
ABSTRACT
Tertiary lymphoid structures (TLSs), clusters of immune cells found around tumor tissue, have been shown to be associated with anti-tumor immunity, but the cellular composition within each TLS and whether the cellular composition of a TLS affects a patient’s prognosis are poorly understood. In the present study, each TLS was categorized according to its cellular composition determined by a system of multiplex immunohistochemical staining and quantitative analysis, and the correlation between the category and prognosis was examined. Sixty-seven patients with curatively resected stage II/III colorectal cancer (CRC) were enrolled. A TLS, consisting of germinal center B cells, follicular dendritic cells, T helper (Th) cells, B cells, cytotoxic T cells, and macrophages, was confirmed in the tumor tissue of 58 patients (87%). The densities of Th cells and macrophages were significantly higher in relapsed patients than in not-relapsed patients (p = .043 and p = .0076). A higher ratio of Th cells was the most significant independent risk factor for disease relapse on multivariate analysis. The subset increasing in Th cells was GATA3+ Th2. A total of 353 TLSs was divided into five clusters according to immune cell composition. Among them, the Th-rich type TLS was significantly increased (p = .0009) in relapsed patients. These data suggest the possibility that Th cell-dominant composition might disturb the anti-tumor immune response, and the function of each TLS might differ depending on its composition.
Introduction
Colorectal cancer (CRC) is the third most commonly diagnosed cancer and the fourth most common cause of cancer death worldwide.Citation1 Multidisciplinary treatment strategies consisting of surgery, adjuvant therapy, and molecular targeted therapy have progressed for advanced stage CRC, but a certain number of patients with stage II or III CRC still experience disease relapse after curative surgery.Citation2 It is necessary to develop biomarkers to help identify the patients who are at high risk of disease relapse and to consider an appropriate treatment strategy depending on the disease condition.
Tumor antigen-specific immune reactions in the host suppress tumor growth and can lead to its eradication. Tumor antigens are incorporated by antigen-presenting cells (APCs), such as dendritic cells (DCs), and are presented to naïve T cells in the secondary lymphoid organs (SLOs). Matured and tumor-specific T cells and B cells subsequently leave the SLOs and reach tumor tissues via the systemic circulation.Citation3 Lymphoid aggregates often develop at sites of inflammation where infection, autoimmune disease, or cancer exist.Citation4 They are called tertiary lymphoid structures (TLSs).Citation4 TLS formations range from tight clusters of B cells and T cells to highly organized structures that have functional germinal centers (GCs) like SLOs. In fact, several characteristics associated with SLOs are seen in TLS formations, such as a T cell zone, a GC with follicular dendritic cells (FDCs), proliferating B cells, and high endothelial venules (HEVs).Citation4 A TLS is recognized as the place where T cell and B cell responses occur, including the induction of effector functions, antibody generation, affinity maturation, class switching, and clonal expansion.Citation5
TLSs have been reported in various types of cancer tissues including lung cancer, breast cancer, pancreas cancer, and CRC. Most previous studies have consistently showed a positive correlation between higher TLS densities and better prognosis in different cancers..Citation6–Citation9 On the other hand, some reports of biliary tract cancer and of some populations with CRC showed that high numbers of TLSs or lymphoid aggregates had no impact on patients’ prognosis.Citation10–Citation12 Among them, a correlation between the number of TLSs and patients’ prognosis was reported when limited to cases with stage II CRC, or TLSs with follicular structure were examined. There are two possible explanations for the discrepancy in the results. One is heterogeneity of the definitions used for quantifying TLSs. So far, the definition of a TLS has varied in each study. Some studies identified TLSs as CD3+ T cell aggregates and/or with DC-Lamp+ mature DCs on immunohistochemical staining, and others identified TLSs as CD20+ B cell aggregates or as immune-cell aggregates on hematoxylin and eosin staining. Another plausible explanation is that what affects patients’ prognosis is not only the number of TLSs, but their functional differences. A previous study of stage II and III CRC reported that TLS density did not correlate with disease relapse, but in the case of TLSs with an FDC network or GC formation, a significant association was present.Citation12 Moreover, an increasing number of studies have shown positive correlations between good and poor clinical outcomes and different cellular components of TLSs, such as DCs, T cells, B cells, follicular helper T cells (Tfh), regulatory T cells (Tregs), HEVs, and chemokines.Citation4 In CRC, increased CD3+ T cell infiltration of TLSs or Tfh-related gene expressions, such as CXCL13 and IL-21, have been reported to predict improved survival.Citation13,Citation14 Furthermore, in gastric cancer, a high number of CD20+ B cells within lymphoid aggregates was associated with significantly better overall survival and was one of the independent predictors of prognosis.Citation15 On the other hand, Treg cells in TLSs reduced infiltration of CD4+ or CD8+ T lymphocytes and suppressed the immune response to tumor in a mouse model of lung adenocarcinoma.Citation16 These data suggest that the cellular component composition of a TLS affects the function of the anti-tumor immune response in different types of cancer. Therefore, to assess the prognostic value of TLSs in cancer patients, differences in cellular components need to be considered.
However, how the balance of the composition affects the anti-tumor effect or regulates distant metastasis has remained unclear. This is because previous studies mainly involved data of immunohistochemistry that stained only a few antigens per slide and focused on individual immune cells. In the conventional immunostaining method, the number of antigens stained in one slide was limited due to the restrictions of fluorescence and host animal species producing antibodies for immunohistochemistry. Though flow-cytometry analysis and gene expression analysis such as microarray and messenger RNA sequencing enable analysis of multiplex antigens or many genes, it is difficult to analyze the location of the cells and the expression profiles of individual cells. In the present study, a novel technology, Opal seven-color IHC Kit (Perkin Elmer, Waltham, CA), which enables multiplex immunohistochemical staining of a maximum of seven antigens on one slide, was used. Then, the number and density of immune cells in TLSs were compared with clinical outcomes, and a classification of TLSs according to TLS component composition was explored. This study showed that a specific TLS component composition correlates with CRC relapse after curative surgery and proposed a TLS classification based on the balance of the multiple TLS components.
Results
Most stage II/III CRCs have tumor-associated TLSs regardless of clinical characteristics
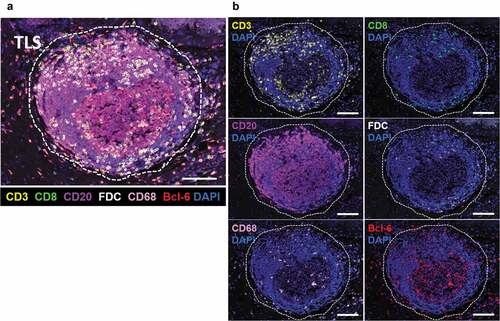
Sixty-seven patients who had undergone curative surgery for stage II or III CRC were examined in this retrospective study. The patients’ baseline characteristics are summarized in . Pathologically, all patients were diagnosed with adenocarcinoma. Six patients (9%) showed loss of mismatch repair (MMR) protein expression, whereas the remaining 61 (91%) showed intact expression of all four MMR proteins, mutL homolog 1 (MLH1), mutS homolog 2 (MSH2), mutS homolog 6 (MSH6), and postmeiotic segregation increased 2 (PMS2). All MMR-deficient (dMMR) tumors in the present study had lost expression of both MLH1 and PMS2. Fifty-three (79%) patients had a low Immunoscore, 13 (19%) patients had an intermediate Immunoscore, and one (1.5%) patient had a high Immunoscore. Of the total population, 40 patients (60%) received adjuvant chemotherapy, which included monotherapy with fluoropyrimidine or combination therapy with fluoropyrimidine, oxaliplatin, and leucovorin. The median follow-up period after surgery was 42.9 months (range 22.5–73.4 months). Thirteen patients (19%) experienced disease relapse, and their median relapse-free survival (RFS) was 9.8 months (95% CI: 6.2–13.5 months, ). To investigate the formation of TLS, fixed-formalin paraffin-embedded (FFPE) CRC samples were stained with CD3, CD8, CD20, FDC, CD68, Bcl-6, and DAPI (). Those that included all T cells, B cells, and FDCs were defined as TLSs in the present study. Peyer’s patches were excluded. Of the overall population, 58 patients (87%) had one or more TLS formations in CRC slides (TLS+ population, ). There was no significant difference between TLS+ (58 patients) and TLS- populations (9 patients) in clinical characteristics and patient outcomes such as disease relapse and RFS.
Table 1. Baseline Patients’ Characteristics
Figure 1. Representative image of a TLS in CRC tissue
Increase of helper T (Th) cells and macrophages in tumor-associated TLS is associated with disease relapse
The relationships between the number of TLSs and clinical features of the overall population were examined first (n = 67, )). There were no significant associations between the number of TLSs and age, pathological stage, tumor location, and disease relapse ()). Regarding pathological stage, however, the number of TLSs tended to be lower in stage III than in stage II CRC, with median values of 3.7 and 5.1 per 100 mm2 of tumor area, respectively (p = .057).
Figure 2. Correlations of TLS-cellular components and clinical signatures
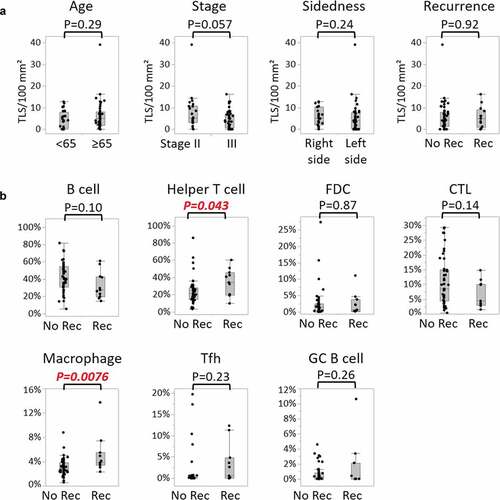
The association between the density of each cellular component and CRC relapse was investigated next. The subsequent analyses were conducted on 58 patients harboring one or more TLSs (the TLS+ population). Of the seven types of immune cells consisting of B cells (CD20+Bcl-6-), Th cells (CD3+CD8-Bcl-6-), FDCs (FDC+), cytotoxic T lymphocytes (CTLs) (CD3+CD8+), macrophages (CD68+), Tfh cells (CD3+CD8-Bcl-6+), and GC B cells (CD20+Bcl-6+), the densities of Th cells and macrophages were significantly higher in disease-relapsed patients rather than in not-relapsed patients ()). Median values of Th cells in not-relapsed patients and relapsed patients were 27% and 40%, respectively (p = .043), and those of macrophages in the two groups were 2.7% and 3.8%, respectively (p = .0076).
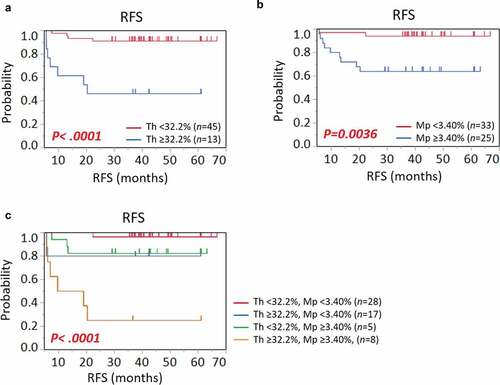
Patients were then stratified by the proportions of Th cells and macrophages. RFS was compared between patients with high and low cellular densities of these immune cells (). Their cutoff values were determined based on receiver operating characteristic (ROC) curves for disease relapse using logistic regression analysis, and the most sensitive and specific values were used (Th 32.2%, AUC 0.70, p = .067; macrophages 3.40%, AUC 0.76, p = .0057). Patients with high densities of Th cells or macrophages had significantly shorter survivals than those with low densities (, Th, p < .0001; 3B, macrophages, p = .0036). Moreover, when patients were stratified into four groups according to high and low densities of Th cells and macrophages, the patient group with high densities of both showed particularly shorter survival than the other three groups (). These data suggest that the presence of increased Th cells and macrophages is correlated with CRC relapse after curative surgery.
Figure 3. Kaplan-Meier survival curves showing RFS according to proportions of (a) helper T cells (Th), (b) macrophages (Mp), and (c) their combination. P values were calculated by the log-rank test. Vertical lines represent censoring
Th cell-dominant composition might be an independent biomarker for CRC relapse
Univariate and multivariate analyses with disease relapse were next conducted to identify independent predictive factors for disease relapse (). As for the number of TLSs, the cutoff values were determined based on ROC curves for disease relapse in the same way as those for Th cell and macrophage densities in . On univariate analysis, there were significant correlations between CRC relapse and tumor depth (p = .0001), the proportion of Th cells (p = .0012), and the proportion of macrophages (p = .0061). On multivariate analysis, only tumor depth (p = .0058) and the proportion of Th cells (p = .028) were significant. In the present study, MMR status and Immunoscore had no significant correlations with disease relapse. These data indicate the possibility that a high Th cell density in TLSs is one of the independent predictors for CRC relapse ().
Table 2. Univariate and Multivariate Analysis with Disease Relapse after curative surgery
GATA3+ Th2 cells are the population that increase in relapsed patients’ TLSs
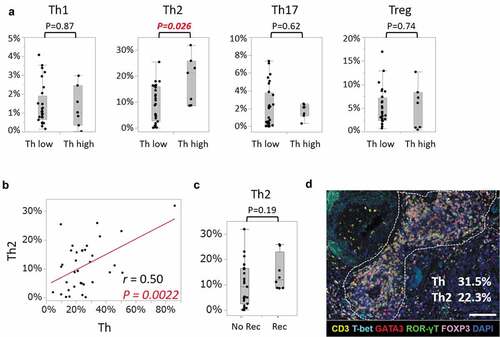
In order to identify which effector subsets of Th cells (CD3+CD8-Bcl-6-) increased, the next investigation was performed. Another staining panel was conducted using primary antibodies for T-bet, GATA3, ROR-γT, FOXP3, CD3, and DAPI (). The densities of Th1, Th2, Th17, and Tregs in TLSs were assessed by calculating the number of each cell per all nucleated cells in a TLS ()). The effector subsets were defined according to CD3 protein expression and the master regulators: Th1 (CD3+T-bet+), Th2 (CD3+GATA3+), Th17(CD3+ROR-γT+), and Tregs (CD3+FOXP3+). Then, the mean value of each subset of all TLSs within whole slides was calculated to provide the representative values for one patient, as in . This investigation involved the 35 patients whose serial sections could be assessed of those used in . The baseline characteristics of the 35 patients are shown in Supplementary Table 1. The patients included 10 (29%) and 25 (71%) patients with stage II and III CRC, respectively, and 8 patients (23%) with disease relapse. There was no significant difference between the 35 patients and the overall population in terms of clinical characteristics, as shown in Supplementary Table 1. They were divided into two groups by Th cell density (Th low group n = 27, Th high group n = 8) (). The cutoff value was defined as 34.1%, which was determined based on ROC curves for disease relapse using logistic regression analysis, and the most sensitive and specific values were used (Th 34.1%, AUC 0.62, p = .34). Of the Th1, Th2, Th17, and Treg subsets, the subset that increased significantly in Th-high patients was Th2 (). There was a positive correlation between the densities of Th and Th2 cells (r = 0.50 and p = .0022) (). In addition, although there was no significant difference, Th2 density tended to increase in patients with disease relapse (p = .19). These findings suggest the possibility that increased Th2 density in TLSs correlates with disease relapse of CRC.
Figure 4. Assessment of increased Th cell subsets in Th-high patients
Classification of TLSs can be defined by multiple key immune cells
Next, TLSs in CRC tissues were classified based on the densities of the cellular components. We applied the k-means clustering algorithm, which is unsupervised learning algorithm, to divide TLSs according to the densities of multiple key immune cells. Then, a total of 353 TLS formations observed in 58 patients were divided into five clusters according to the densities of Th cells, B cells, FDCs, CTLs, GC-B cells, and macrophages (,)). As and ) show, the TLSs could be separated into five clusters according to the balance of the six variables. The clusters were then named in reference to the parallel coordinate plots shown in ): GC-TLS type (Cluster 1), B cell-rich type (Cluster 2), FDC-rich type (Cluster 3), Th-rich type (Cluster 4), and CTL/B/Th type (Cluster 5). Representative images of each cluster are shown in ).
Figure 5. Classification of TLS based on the densities of cellular components
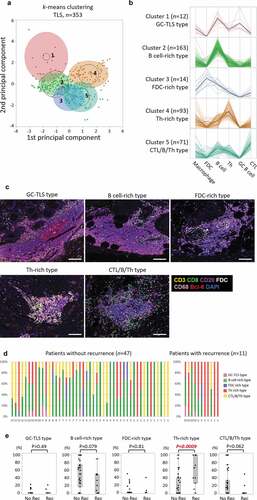
The relationship between disease relapse and the distribution of the five TLS types was then examined. The proportions of the clusters in a single patient were calculated as the number of TLSs assigned to each cluster compared to that of all TLSs (,)). The median numbers of TLSs in a single patient were both five in patients without relapse (range 1 to 15) and in those with relapse (range 1 to 19). The distribution of TLS clusters varied from case to case, but the proportion of Th-rich type TLSs increased significantly in patients with disease relapse (p = .0009), whereas the B cell-rich type and the CTL/B/Th type TLSs tended to decrease in those patients (p = .079 and p = .062, respectively) ()). These data indicate that a variety of TLS types are present in CRC tissue, and that classification of TLSs can be defined by multiple key immune cells. Moreover, the difference in cellular compositions of TLS types is suggested to be associated with patients’ prognosis.
Discussion
The hypothesis on which this study was based was that each tumor-associated TLS could possess a distinct cellular composition with a different degree of anti-tumor immune response. For instance, one TLS would function in antigen presentation and activation and maturation of tumor-specific T cells and B cells in the same manner as an SLO, whereas another would not function sufficiently.
The present study demonstrated that Th cell and macrophage densities in TLSs were significantly higher in relapsed patients than in not-relapsed patients, and a higher ratio of Th cells might be one of the independent risk factors for relapse. Of the effector subsets of Th cells, Th2 subsets increased in patients with a higher density of Th cells. In terms of the TLS classification, the density of Th-rich type was also significantly associated with disease relapse, while the densities of immune cells consisting of GC, such as GC B cells and Tfh cells, were not correlated with prognosis. Although the roles of Th subsets other than Tfh in TLS have been poorly understood, they are considered basically shared with those in SLOs.Citation5 In the T cell zones of TLSs, DCs present antigen peptide in the context of major histocompatibility complex (MHC) class II molecules to naïve CD4+ T cells resulting in activation and differentiation of naïve CD4+ T cells into effector subsets such as Th1, Th2, Th17, and Tfh. The naïve CD4+ T cells are directed to each effector subset depending basically on the cytokines in the microenvironment.Citation17 For example, IL-12 and IFN-γ make naïve CD4+ T cells highly express T-bet and STAT4 and differentiate to Th1, while IL-4 makes naïve CD4+ T cells highly express GATA3 and STAT6 and differentiate to Th2.Citation17 Th2 cytokines such as IL-4, IL-5, and IL-13 activate eosinophils and support B cells to produce IgE antibody. In terms of anti-tumor immune response, however, Th2 cytokines might accelerate tumor growth. Actually, because Th1, Th2, and Th17 suppress differentiation to each other by their master regulators and secreted cytokines, Th1 and Th17 are supposed to be suppressed in a Th2-dominant microenvironment.Citation17 IL-4 is also reported to inhibit activation of CD8+ T cells through suppressing antigen presentation from dendritic cells in an acute graft versus host disease model.Citation18 Moreover, Th2 cytokines can induce M2 macrophage polarization, which enhances tumor growth in the tumor microenvironment by accelerating angiogenesis and inflammation.Citation19 Taken together, a skewed composition of Th2 cells in tumor-associated TLSs is thought to suppress tumor-specific CTL and Th1 and change the microenvironment toward Th2 cells and M2 macrophage polarization.
On the other hand, focusing on the neogenesis and maintenance of TLSs, the initiation is recognized to start from accumulation of IL-17-secreting Th17 cells and CD4+ lymphoid tissue-inducer (LTi) cells harboring lymphotoxin (LT)-α1β2 and expressing retinoic acid receptor-related orphan receptor-γt (RORγt) in inflamed tissue.Citation5,Citation20,Citation21 The Th17 and LTi cells secrete chemokines such as CXCL13, CCL19, and CCL21, which induce cell recruitment of CD62L-positive T cells and B cells through HEVs and support formation of lymphoid aggregates.Citation5,Citation22 GC and T cell zones are then formed to gather FDC, Tfh, GC-B, and other immune cells, and the TLS creates an anti-tumor immune reaction.Citation5 The Th17 cells also play a key role to maintain TLSs through their plasticity shifting into Tfh cells. For example, Th17 cells can display Tfh cell-like characteristics during their differentiation, such as IL-21 secretion and expression of STAT3 and inducible T cell co-stimulator (ICOS).Citation5 Taken together, it is possible that Th2-dominant composition may suppress differentiation toward Th17, which may stop TLS-neogenesis and inhibit TLS maintenance. Therefore, the higher ratio of Th cells in the relapsed patients of the present study is considered to reflect more TLSs that are immature or just breaking up. Such TLSs likely do not maintain sufficient capacity to activate and differentiate tumor-specific effector and memory T cells.
There have been few reports of the association between the density of macrophages in TLSs and cancer patients’ survival. In the present study, the density of CD68+ macrophage was significantly higher in relapsed patients. CD68+ macrophages within SLOs or TLSs are known as tingible-body macrophages (TBMs) and play a role as scavengers of apoptotic lymphocytes.Citation23 In addition, Smith et al. reported that TBMs play a role in downregulating the GC reaction by releasing prostaglandins and suppressing B cell secretion of IL-2.Citation24 It is likely that TBMs in a TLS affect the GC reaction in relapsed CRC patients, but this does not seem to be the full explanation. Another plausible explanation is that M2 macrophages increase within a TLS in relapsed patients. However, since the present study assessed only CD68 expression, it could not distinguish between M1 and M2. Further investigations are required, such as of cytokine production ability of macrophages within cancer-associated TLSs, or activation and proliferation status of T and B cells in TLSs with a higher ratio of TBMs.
The next discussion deals with TLS classification. This study was performed to clarify the impact of differences in cellular composition on patients’ prognosis. It is noteworthy that the densities of each type of TLS divided by cellular composition were associated with CRC relapse. Since there is no established TLS classification, previous studies adopted their own classifications.Citation12,Citation25,Citation26 One previous report of ovarian cancer classified lymphoid aggregates into four types based on size, cellular composition, and degree of GC organization.Citation25 The authors examined the associations between the four types and tumor infiltrating lymphocytes (TILs) and plasma cell densities, whereas they did not mention the relationships of the four types to clinical outcomes.Citation25 In another report on CRC, the authors divided TLSs into three types by the expressions of CD21 and CD23, which were used as markers of the presence of FDC and GC B cells, respectively.Citation12 A higher ratio of TLSs with CD21 and CD23 expression was associated with a lower 3-year relapse-risk after curative surgery.Citation12 The GC-TLS type, B cell-rich type, and FDC-rich type in the present study seem to be roughly the same group as the above TLSs with CD21 and CD23 expression. The present data showing that those TLS types tended to increase in not-relapsed patients is in agreement with the previous report. However, the strength of the present classification is that it is based on objective evaluation using the densities of as many as six types of immune cells comprising TLSs. In particular, to the best of our knowledge, this is the first demonstration of TLS classification that takes into consideration such a variety of immune cells having the role of antigen presentation in maturation of tumor-specific T and B cells. The result of a skewed distribution of Th-dominant type TLSs in relapsed patients in the present study suggests that the anti-tumor immune reaction within the TLS might be affected by the balance of cellular components, which might affect the host’s overall anti-tumor response.
In conclusion, the present data showed that the specific cellular composition of TLSs would affect CRC prognosis, and, especially, Th-dominant composition is a candidate of risk factor for CRC relapse after curative surgery. Cancer-associated TLSs should all be removed with the primary tumor by curative surgery, but the skewed composition of TLSs is associated with disease relapse. This suggests that the skewed cellular composition may reflect dysfunction of the anti-tumor immune reaction of TLS. However, the factors that regulate the composition of tumor-associated TLSs are not clear, and further investigation is needed to understand their heterogeneity and functions.
Materials and methods
Patients and samples
This study included 67 patients with stage II or III CRC diagnosed based on the American Joint Committee on Cancer/International Union Against Cancer (AJCC/UICC) staging manual (8th edition) who underwent curative surgery at Kyushu University Hospital between July 2009 and November 2014. Clinical and pathological data were examined retrospectively using electronic records. Patients with a history of autoimmune disease, including connective tissue or inflammatory bowel diseases, or immunosuppressive drugs such as steroids were excluded. Those with a history of neoadjuvant chemo- or radiotherapy before surgery were also excluded. All patients were routinely assessed by a combination of physical examination and peripheral blood laboratory testing every 3 months and computed tomography and abdominal ultrasound every 3 or 6 months during the first and second years after surgery. These periodic investigations were performed every 6 to 12 months during the third to fifth years. This study was approved by the institutional review board of Kyushu University Hospital.
Multiplex immunohistochemical staining
Multiplex immunohistochemical staining was conducted using the Opal seven-color IHC Kit (Perkin Elmer). Sections with thickness of 4 µm were produced from FFPE-CRC samples or control normal lymph node tissues. The slides were deparaffinized in xylene and rehydrated in ethanol. Antigen retrieval was performed in TrisEDTA buffer (Antigen Unmasking Solution, High pH, Vector Laboratories, Burlingame, CA) by microwave treatment (MWT) for 20 minutes. Endogenous peroxidase was blocked using 3% hydrogen peroxidase in distilled water for 5 minutes. Protein blocking was performed using Protein Block Serum-Free (Agilent Technologies, Santa Clara, CA). Slides were incubated with the primary antibody for CD8 (1:50 dilution, clone C8/144B, Agilent Technologies) for 30 minutes. Slides were incubated using EnVision+ Dual Link kit (Agilent Technologies) for 10 minutes, before visualization using Opal520 TSA (1:50 dilution, Perkin Elmer) for another 10 minutes. After that, MWT was repeated to remove the antibody and TSA complex. Using this Opal staining method, all samples were stained sequentially with the primary antibody for CD20cy (Autostainer, clone L26, Agilent Technologies) visualized with Opal540 TSA (1:50), CD3 (1:50 dilution, clone F7.2.38, Agilent Technologies) visualized with Opal570 TSA (1:50), FDC (1:25 dilution, clone CAN.42, Agilent Technologies) visualized with Opal620 TSA (1:50), CD68 (1:400 dilution, clone KP1, Agilent Technologies) visualized with Opal650 TSA (1:50), and Bcl-6 (1:20 dilution, clone LN22, Leica Biosystems, Wetzlar, Germany) visualized with Opal690 (, ). TSA-stained slides were finished with MWT, counterstained with DAPI for 5 minutes, and coverslipped using the VectaShield Hardset mounting media (Vector Laboratories). Another staining panel was conducted with 35 patients consisting of 28 not-relapsed patients and seven relapsed patients, using primary antibody for: ROR-γT (1:500 dilution, clone 6F3.1, MilliporeSigma, Burlington, MA) visualized with Opal520 TSA (1:50); T-bet/Tbx21 (1:50 dilution, clone 4B10, Abcam, Cambridge, UK) visualized with Opal540 TSA (1:50); GATA3 (1:100 dilution, clone D13C9, Cell Signaling Technology, Danvers, MA) visualized with Opal570 TSA (1:50); FOXP3 (1:50 dilution, clone SP97, Abcam) visualized with Opal620; and CD3 (1:50 dilution, clone F7.2.38, Agilent Technologies) visualized with Opal690 TSA (1:50) ().
Multispectral image acquisition and analysis
Tissue sections stained with seven-plex fluorescence were scanned using the Mantra Quantitative Pathology Workstation (Perkin Elmer) at 40x and 200x magnification. Images at 200x were used for the following analysis using the inForm Advanced Image Analysis software (inForm version 2.3.0, Perkin Elmer). Multispectral images were unmixed using spectral libraries built from images of single-stained tissues for each marker. Then, the TLS regions within the images were manually distinguished and categorized. A selection of 3–5 representative multispectral images obtained from normal lymph node tissues, which were used as positive controls, was used to train the process of cell segmentation and cell phenotyping in the inForm software. All settings were saved within an algorithm to allow batch analysis of all multispectral images from CRC samples. Finally, the number of each cell phenotype within each TLS region was calculated for statistical analysis.
Evaluation of TLS
The sample analyst (KY) was fully blinded to the clinical characteristics of the patients. Lymphoid aggregates presenting in the whole slide including the tumor region or within 2 mm of the tumor area were scanned. TLS density was calculated as the number of TLSs per 100 mm2 of tumor region in the slide ()). Serial sections of CRC samples stained with hematoxylin and eosin (H&E) were scanned using a KEYENCE BZ-X700 all-in-one fluorescence microscope (Keyence, Osaka, Japan), and the area of the tumor region was calculated using BZ-X Analyzer software (Keyence).
Cellular components of TLSs were defined along with specific antigen-expression, such as helper T cells (CD3+CD8-Bcl-6-), cytotoxic T lymphocytes (CD3+CD8+), follicular dendritic cells (FDC+), B cells (CD20+Bcl-6-), macrophages (CD68+), Tfh cells (CD3+CD8-Bcl-6+), and GC B cells (CD20+Bcl-6+) ()). Percentages of each cell component in one TLS were calculated as the number of each type of cell per all nucleated cells in a TLS. The mean values of each component of all TLSs within whole slides were then calculated as representative values of one patient ()).
Evaluation of MMR status
Tissue sections were processed by immunohistochemistry for four MMR proteins. The primary antibodies were anti-MLH1 (1:50 dilution, clone G168-15, BD Biosciences, San Jose, CA) mouse monoclonal antibody, anti-MSH2 (1:100 dilution, clone FE11, Merck Millipore, Burlington, MA) mouse monoclonal antibody, anti-PMS2 (1:100 dilution, clone A16-4, BD Biosciences) mouse monoclonal antibody, and anti-MSH6 (1:100 dilution, clone EP49, Agilent Technologies) rabbit monoclonal antibody. Tumors were considered negative for MLH1, MSH2, PMS2, or MSH6 when there was a complete absence of nuclear staining in the tumor cells, whereas the surrounding lymphocytes and normal epithelial cells showed consistently preserved nuclear staining. If any one of the four MMR proteins was negative, the tumor was considered to be dMMR. Tumors that preserved expression of all four proteins were considered to be MMR-proficient (pMMR). The representative immunohistochemical staining images of dMMR are shown in Supplementary Figure 1.
Evaluation of Immunoscores
Tissue sections were processed by immunohistochemistry, and the densities of CD3+ and CD8+ T cells in the tumor core (CT) and the invasive margin (IM) were calculated. Slides were stained with the primary antibody for CD8 visualized with Opal540 TSA, and they were sequentially stained with the primary antibody for CD3 visualized with Opal620 TSA. TSA-stained slides were counterstained with DAPI. Sections were then scanned for three fields of CT and IM, respectively, using the Mantra Quantitative Pathology Workstation at 200x magnification. The mean densities of CD3+ cells and CD8+ cells in CT and IM were calculated using inForm Advanced Image Analysis software. The mean of four percentiles (two markers, two regions) was calculated and converted into an Immunoscore. In the present study, the Immunoscore was categorized into three groups according to the previous large-scale validation study; groups with mean percentiles of 0-25%, 25-70%, and 70-100% were Immunoscore Low, Intermediate, and High, respectively.Citation27 The representative immunohistochemical staining images of Low, Intermediate, and High Immunoscores are shown in Supplementary Figure 2.
Statistical analysis
Median values were compared between two groups with the Wilcoxon rank-sum test. The association between two categorical variables was assessed with the Chi-squared test or Fisher’s exact test. Univariate and multivariate logistic regression analyses were used to evaluate independent factors associated with disease relapse, including age, pathological stage, MMR status, Immunoscore, number of TLSs per 100 mm2 tumor region, and proportions of each cellular component within a TLS as covariates. RFS was examined using Kaplan-Meier curves and analyzed by the log-rank test. Pearson’s correlation coefficient was used to assess the association between two continuous variables. Classification of TLSs was performed using k-means clustering algorithm, which identifies k number of centroids and then allocates every data point to the nearest cluster, while keeping the centroids as small as possible. P < .05 was considered significant. All statistical analyses were carried out using JMP Pro version 13.0 software (SAS Institute Japan, Tokyo, Japan).
Disclosure of Potential Conflicts of Interest
No potential conflicts of interest were reported by the authors.
Supplemental Material
Download ()Supplemental Material
Download ()Supplemental Material
Download ()Acknowledgments
The authors thank N. Torada from Department of Surgery and Oncology, Kyushu University, for collecting CRC samples.
Supplementary Material
Supplemental data for this article can be accessed on the publisher’s website.
Additional information
Funding
References
- Ferlay J, Soerjomataram I, Dikshit R, Eser S, Mathers C, Rebelo M, Parkin DM, Forman D, Bray F. Cancer incidence and mortality worldwide: sources, methods and major patterns in GLOBOCAN 2012. Int J Cancer. 2015;136:E359–11. doi:10.1002/ijc.29210.
- André T, Boni C, Navarro M, Tabernero J, Hickish T, Topham C, Bonetti A, Clingan P, Bridgewater J, Rivera F, et al. Improved overall survival with oxaliplatin, fluorouracil, and leucovorin as adjuvant treatment in stage II or III colon cancer in the MOSAIC trial. J Clin Oncol. 2009;27:3109–3116. doi:10.1200/JCO.2008.20.6771.
- Chen DS, Mellman I. Oncology meets immunology: the cancer-immunity cycle. Immunity. 2013;39:1–10. doi:10.1016/j.immuni.2013.07.012.
- Dieu-Nosjean MC, Goc J, Giraldo NA, Sautès-Fridman C, Fridman WH. Tertiary lymphoid structures in cancer and beyond. Trends Immunol. 2014;35:571–580. doi:10.1016/j.it.2014.09.006.
- Pitzalis C, Jones GW, Bombardieri M, Jones SA. Ectopic lymphoid-like structures in infection, cancer and autoimmunity. Nat Rev Immunol. 2014;14:447–462. doi:10.1038/nri3700.
- Goc J, Germain C, Vo-Bourgais TK, Lupo A, Klein C, Knockaert S, de Chaisemartin L, Ouakrim H, Becht E, Alifano M, et al. Dendritic cells in tumor-associated tertiary lymphoid structures signal a Th1 cytotoxic immune contexture and license the positive prognostic value of infiltrating CD8+ T cells. Cancer Res. 2014;74:705–715. doi:10.1158/0008-5472.
- Germain C, Gnjatic S, Tamzalit F, Knockaert S, Remark R, Goc J, Lepelley A, Becht E, Katsahian S, Bizouard G, et al. Presence of B cells in tertiary lymphoid structures is associated with a protective immunity in patients with lung cancer. Am J Respir Crit Care Med. 2014;189:832–844. doi:10.1164/rccm.201309-1611OC.
- Hiraoka N, Ino Y, Yamazaki-Itoh R, Kanai Y, Kosuge T, Shimada K. Intratumoral tertiary lymphoid organ is a favourable prognosticator in patients with pancreatic cancer. Br J Cancer. 2015;112:1782–1790. doi:10.1038/bjc.2015.145.
- Väyrynen JP, Sajanti SA, Klintrup K, Mäkelä J, Herzig KH, Karttunen TJ, Tuomisto A, Mäkinen MJ. Characteristics and significance of colorectal cancer associated lymphoid reaction. Int J Cancer. 2014;134:2126–2135. doi:10.1002/ijc.28533.
- Goeppert B, Frauenschuh L, Zucknick M, Stenzinger A, Andrulis M, Klauschen F, Joehrens K, Warth A, Renner M, Mehrabi A, et al. Prognostic impact of tumour-infiltrating immune cells on biliary tract cancer. Br J Cancer. 2013;109:2665–2674. doi:10.1038/bjc.2013.610.
- Di Caro G, Bergomas F, Grizzi F, Doni A, Bianchi P, Malesci A, Laghi L, Allavena P, Mantovani A, Marchesi F. Occurrence of tertiary lymphoid tissue is associated with T-cell infiltration and predicts better prognosis in early-stage colorectal cancers. Clin Cancer Res. 2014;20:2147–2158. doi:10.1158/1078-0432.
- Posch F, Silina K, Leibl S, Mündlein A, Moch H, Siebenhüner A, Samaras P, Riedl J, Stotz M, Szkandera J, et al. Maturation of tertiary lymphoid structures and recurrence of stage II and III colorectal cancer. Oncoimmunology. 2017;7:e1378844. doi:10.1080/2162402X.2017.1378844.
- McMullen TP, Lai R, Dabbagh L, Wallace TM, de Gara CJ. Survival in rectal cancer is predicted by T cell infiltration of tumour-associated lymphoid nodules. Clin Exp Immunol. 2010;161:81–88. doi:10.1111/j.1365-2249.2010.04147.x.
- Bindea G, Mlecnik B, Tosolini M, Kirilovsky A, Waldner M, Obenauf AC, Angell H, Fredriksen T, Lafontaine L, Berger A, et al. Spatiotemporal dynamics of intratumoral immune cells reveal the immune landscape in human cancer. Immunity. 2013;39:782–795. doi:10.1016/j.immuni.2013.10.003.
- Sakimura C, Tanaka H, Okuno T, Hiramatsu S, Muguruma K, Hirakawa K, Wanibuchi H, Ohira M. B cells in tertiary lymphoid structures are associated with favorable prognosis in gastric cancer. J Surg Res. 2017;215:74–82. doi:10.1016/j.jss.2017.03.033.
- Joshi NS, Akama-Garren EH, Lu Y, Lee DY, Chang GP, Li A, DuPage M, Tammela T, Kerper NR, Farago AF, et al. Regulatory T cells in tumor-associated tertiary lymphoid structures suppress anti-tumor T cell responses. Immunity. 2015;43:579–590. doi:10.1016/j.immuni.2015.08.006.
- Luckheeram RV, Zhou R, Verma AD, Xia B. CD4⁺T cells: differentiation and functions. Clin Dev Immunol. 2012;2012:925135. doi:10.1155/2012/925135.
- Via CS, Soloviova K, Puliaiev M, Puliav R, Puliaeva I, Morris SC, Finkelman FD. In vivo IL-4 prevents allo-antigen driven CD8(+) CTL development. Clin Immunol. 2017;180:11–24. doi:10.1016/j.clim.2017.03.008.
- Poh AR, Ernst M. Targeting macrophages in cancer: from bench to bedside. Front Oncol. 2018;8:49. doi:10.3389/fonc.2018.00049.
- Sawa S, Cherrier M, Lochner M, Satoh-Takayama N, Fehling HJ, Langa F, Di Santo JP, Eberl G. Lineage relationship analysis of RORgammat+ innate lymphoid cells. Science. 2010;330:665–669. doi:10.1126/science.1194597.
- Schmutz S, Bosco N, Chappaz S, Boyman O, Acha-Orbea H, Ceredig R, Rolink AG, Finke D. Cutting edge: IL-7 regulates the peripheral pool of adult ROR gamma+ lymphoid tissue inducer cells. J Immunol. 2009;183:2217–2221. doi:10.4049/jimmunol.0802911.
- Drayton DL, Ying X, Lee J, Lesslauer W, Ruddle NH. Ectopic LT alpha beta directs lymphoid organ neogenesis with concomitant expression of peripheral node addressin and a HEV-restricted sulfotransferase. J Exp Med. 2003;197:1153–1163. doi:10.1084/jem.20021761.
- Teillaud JL, Dieu-Nosjean MC. Tertiary lymphoid structures: an anti-tumor school for adaptive immune cells and an antibody factory to fight cancer? Front Immunol. 2017;8:830. doi:10.3389/fimmu.2017.00830.
- Smith JP, Burton GF, Tew JG, Szakal AK. Tingible body macrophages in regulation of germinal center reactions. Dev Immunol. 1998;6:285–294. doi:10.1155/1998/38923.
- Kroeger DR, Milne K, Nelson BH. Tumor-infiltrating plasma cells are associated with tertiary lymphoid structures, cytolytic T-cell responses, and superior prognosis in ovarian cancer. Clin Cancer Res. 2016;22:3005–3015. doi:10.1158/1078-0432.CCR-15-2762.
- Siliņa K, Soltermann A, Attar FM, Casanova R, Uckeley ZM, Thut H, Wandres M, Isajevs S, Cheng P, Curioni-Fontecedro A, et al. Germinal centers determine the prognostic relevance of tertiary lymphoid structures and are impaired by corticosteroids in lung squamous cell carcinoma. Cancer Res. 2018;78:1308–1320. doi:10.1158/0008-5472.CAN-17-1987.
- Pagès F, Mlecnik B, Marliot F, Bindea G, Ou FS, Bifulco C, Lugli A, Zlobec I, Rau TT, Berger MD, et al. International validation of the consensus immunoscore for the classification of colon cancer: a prognostic and accuracy study. Lancet. 2018;391:2128–2139. doi:10.1016/S0140-6736(18)30789-X.