
ABSTRACT
Eosinophils have been identified as a prognostic marker in immunotherapy of melanoma and suggested to contribute to anti-tumor host defense. However, the influence of immune checkpoint inhibitors (ICI) on the eosinophil population is poorly studied. Here, we applied routine laboratory tests, multicolor flow cytometry, RNA microarray analysis, and bio-plex assay to analyze circulating eosinophils and related serum inflammatory factors in 32 patients treated with pembrolizumab or the combination of nivolumab and ipilimumab. We demonstrated that clinical responses to ICI treatment were associated with an eosinophil accumulation in the peripheral blood. Moreover, immunotherapy led to the alteration of the eosinophil genetic and activation profile. Elevated serum concentrations of IL-16 during ICI treatment were found to be associated with increased frequencies of eosinophils in the peripheral blood. Using immunohistochemistry, we observed an enhanced eosinophil degranulation and a positive correlation between eosinophil and CD8+ T cell infiltration of tumor tissues from melanoma patients treated with ICI. Our findings highlight additional mechanisms of ICI effects and suggest the level of eosinophils as a novel predictive marker for melanoma patients who may benefit from this immunotherapy.
Introduction
Therapeutic options for patients with advanced malignant melanoma have been extended during the last years, mostly due to the application of immune checkpoint inhibitors (ICI), including anti-programmed cell death protein 1 (PD-1) antibodies (pembrolizumab and nivolumab) and anti- cytotoxic T-lymphocyte protein 4 (CTLA-4) antibodies (ipilimumab).Citation1,Citation2 However, the objective response rate to pembrolizumab was less than 40%.Citation1 A clinical response to the combination of nivolumab and ipilimumab was observed in 58% of the patients as compared to 44% for nivolumab monotherapy.Citation2 Because of limited response rates and concomitant immune-related adverse events, there is an urgent need for predictive biomarkers, which could predict clinical response to ICI.
Several baseline laboratory factors, such as neutrophil, eosinophil, basophil, monocyte, and lymphocyte counts, as well as a neutrophil-to-lymphocyte ratio (NLR), have been reported to correlate with better clinical responses in patients receiving ipilimumab,Citation3 nivolumab plus ipilimumabCitation4 or pembrolizumab.Citation5 Furthermore, an increase in lymphocyte and eosinophil counts in the early stages of therapy with ICI was found to be associated with improved survival of melanoma patients.Citation3,Citation6
Accumulation of eosinophils in cancer has been observed for decades.Citation7 They were shown to be enriched in the tumor tissue and in the peripheral blood of patients with various solid tumor types.Citation8 Interestingly, this enrichment was described to have a pleiotropic relation to the prognosis of tumor patients. In many cases, eosinophil accumulation was linked to a beneficial survival,Citation9-Citation11 whereas some studies reported a relation to a worse prognosis.Citation12,Citation13 Moreover, eosinophilia was observed in cancer patients upon the treatment with interleukinsCitation14,Citation15 and was shown to be associated with prolonged survival of prostate cancer patients treated with the dendritic cell vaccine Sipuleucel-T,Citation16 as well as with the response to ICI of patients with lung cancer.Citation17 Some mechanisms on how eosinophils influence tumor progression have recently been proposed.Citation18,Citation19 However, their role in response to ICI and the reason for their accumulation remains elusive and needs to be further explored.
In this study, we analyzed the frequency and activation markers of eosinophils in the peripheral blood and related soluble factors in the serum of 32 patients before and after ICI treatment. For additional eosinophil profiling and functional studies, we performed transcriptomic analysis and immunohistochemical (IHC) evaluation of tumor tissues from these patients.
Results
Patients characteristics
This immune monitoring study included 32 melanoma patients receiving ICI (). The median age was 69.5 years (ranging from 15 to 83) and the cohort contained 19 males (59%) and 13 females (41%). Distant metastases were found in 28 patients (88%) and 4 patients (12%) had unresectable stage III disease. The patients received the treatment with pembrolizumab (n = 22,69%) or the combination of nivolumab and ipilimumab (n = 10,31%). Among all, 22 patients (69%) were previously treated with systemic agents. Scaled upon the best overall response, one patient showed CR (3%), 8 patients showed PR (25%) and 3 patients showed SD (9%). For the evaluation of biomarkers, these patients were defined as responders, whereas 17 individuals who showed PD (53%) were determined as non-responders. Furthermore, three patients were classified as MR (9%). We observed no statistically significant correlation between the clinical response of patients to ICI treatment and PD-L1 expression in tumor samples from these patients.
Table 1. Clinical characteristics of the patients at baseline
Early eosinophil increase in responders to ICI treatment
Analysis of the leukocyte subpopulations counts in the peripheral blood at baseline (pre) and after the first ICI administration (post) revealed differences between responders and non-responders at baseline in the relative lymphocyte count (P = .0322), the relative neutrophil count (P = .0247) and the relative basophil count (P = .0403, supplementary Fig. 1A-C). ICI treatment resulted in a significant increase of the relative (P = .0122, )) and absolute eosinophil count (P = .0015, )) in responders in contrast to non-responders. Furthermore, there was a strong trend toward a higher absolute eosinophil count (P = .0538, )) after the first ICI administration in responders compared to non-responders. Moreover, the relative neutrophil count decreased (P = .0392) in non-responders after the first ICI administration, whereas the relative basophil count increased (P = .0197, supplementary Fig. 1A, C). The increase of basophils was also observed for the absolute count in non-responders (P = .0159) and responders (P = .021, supplementary Fig. 1C). In addition, we found no changes in the monocyte count and in NLR upon the treatment in both responders and non-responders (supplementary Fig. 1D-E).
Figure 1. Eosinophil counts in melanoma patients after ICI treatment. Peripheral blood from 29 melanoma patients (12 responders and 17 non-responders) was analyzed by routine laboratory tests. Blood samples were taken before ICI treatment initiation (pre) and after the first administration (post). Results are shown as relative (a) and absolute (b) counts of eosinophils. Responders were characterized by CR, PR, and SD. *P < .05, **P < .01
To investigate changes in eosinophils of ICI-treated melanoma patients, we evaluated their frequency in the peripheral blood by flow cytometry. Eosinophils were defined as CD66b+CCR3+Siglec8+ cells ()). In accordance with the eosinophil count obtained by routine laboratory analysis, we found an increase of the eosinophil frequency (measured as a percentage within live granulocytes) after the first administration of ICI in responders (P = .0322, )). In this group, the amount of eosinophils was elevated in each individual, whereas 50% of non-responders displayed no elevation ()). The frequency of eosinophils was measured before and after the therapy in the patients who received pembrolizumab or those who were treated with the combination of nivolumab and ipilimumab (supplementary Fig. 2A, B). Moreover, the expression of CD69 was measured on eosinophils, as it is known to be an activation marker of eosinophils and other leukocytes.Citation20 We observed a high expression in some responders after the first administration of ICI, however, this trend was not significant (supplementary Fig. 2C). Analyzing the expression of such cytokines as IL-4, IL-13, and IL-5 in eosinophils by real-time PCR, we observed no statistically significant differences in the expression of these cytokines between responder and non-responder groups (data not shown). Furthermore, OS and PFS of patients with a relative eosinophil count equal or higher than 5.4% after the first administration of ICI displayed a trend toward a longer OS and PFS (supplementary Fig. 2D, E).
Figure 2. Assessment of eosinophils in melanoma patients upon the ICI therapy by flow cytometry. Peripheral blood samples from 17 patients (9 responders and 8 non-responders) were taken prior to the treatment (pre) and after the first infusion (post). (a) Representative dot plots identifying CD66b+CCR3+Siglec8+ eosinophils. (b) The frequency of eosinophils in melanoma patients is presented as the percentage of these cells within live CD66b+ granulocytes. (c) The percentage of responders or non-responders displaying changes in eosinophil frequencies after the therapy. Responders were characterized by CR, PR, and SD. *P < .05
Transcriptomic changes in eosinophils during ICI treatment
Next, we studied the gene expression profile of circulating eosinophils from ICI-treated patients and HD using RNA microarray analysis. Principal component analysis (PCA) was performed comparing gene expression of melanoma patients and HD. Subsequent hierarchical clustering of differently expressed genes (DEGs) was applied to investigate the segregation of different clinical phenotypes ()). We found that non-responders clustered in two different groups: one group clustered independently from responders and HD, whereas the other group overlapped with them ()). Furthermore, we observed that patients before therapy (pre) clustered independently from HD, but overlapped partly with patients after treatment (post) ()). Interestingly, patients who displayed no eosinophil increase clustered together with the “pre” group and independently from patients with an eosinophil increase. This group clustered together with HD ()).
Figure 3. Gene expression profile changes in eosinophils under the course of ICI treatment. Microarray analysis was performed using RNA isolated from eosinophils of patients and HD. (a) Heatmap representing hierarchical clustering of DEGs between melanoma patients pre-treatment and HD. (b) Principal components analysis (PCA) plot of HD, patients pre- and post-treatment. (c) PCA plot of HD, patients before (pre) and after (post) treatment with or without early eosinophil increase. (d) Enrichment plot for the gene-set “Hallmark_Wnt_beta_catenin_signaling” upregulated in patients post-treatment with early eosinophil increase (NES = 1.558, FDR = 0.008). (e) Enrichment plot for the gene-set “Hallmark_epithelial_mesenchymal_transition” upregulated in patients post-treatment without early eosinophil increase (NES = −1.971, FDR = 0.000). (f) Gene sets derived from the Molecular Signatures Database Hallmark (h) Gene Set Collection and the Reactome (r) pathway database enriched in patients pre- and post-treatment (P < .006, FDR < 0.05). (g) Differentially expressed genes in patients pre- and post-treatment (P < .002, adjusted P < .1). Responders were characterized by CR, PR, and SD
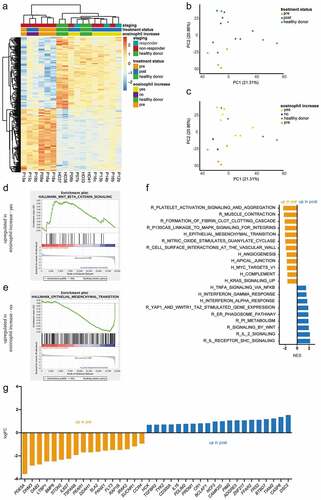
To further compare gene expression profiles from different clinical groups, we performed a GSEA. The gene set “Hallmark_Wnt_beta_catenin_signaling” ()) enriched in eosinophils derived from patients displaying an eosinophil increase after treatment, whereas the epithelial to mesenchymal transition (EMT) signature “Hallmark_epithelial_mesenchymal_transition” enriched in samples of patients, lacking the eosinophil increase ()). Patterns of platelet activation and vascular interaction were observed to be enriched in the pre-treatment group, whereas the post-treatment group showed more inflammation-related signatures ()). Moreover, when we compared pre- and post-treatment groups, we found an upregulation of individual DEGs (such as DDAH1 and CCR4) associated with allergic inflammations in pre-treatment samples.Citation21,Citation22 On the other side, we found DEGs upregulated post-treatment (like CASP8 and TGFBR2) that were reported to be involved in eosinophil apoptosisCitation23,Citation24 ()). Comparing HD and pre-treatment samples, we observed immune signaling- and endocytosis-related gene sets to be enriched in HD (supplementaryFig. S3A). Several DEGs upregulated in HD were coding for surface receptors, which are known to be constitutively expressed on eosinophils such as TLR7,Citation25 CSF2RB,Citation26 and ICAM3Citation27 (supplementary Fig. 3B). In addition, we verified the expression of some molecules using real-time PCR. However, no significant differences were found (data not shown).
Modulation of IL-16 levels with eosinophil accumulation
Next, we tested serum soluble factors, which could be related to the eosinophil elevation after treatment initiation in responders. Multiple linear regression analysis was performed to investigate the potential impact of 14 selected serum factors on the eosinophil count (). We found that the accumulation of interleukin (IL)-16 (P = .0001, )) and CC-chemokine ligand (CCL) 2 (P = .0258, )) measured by the bio-plex assay as independent variables was related to the eosinophil frequency determined by flow cytometry. Furthermore, a tendency toward a beneficial PFS and OS for patients having higher concentrations of IL-16 was detected (supplementary Fig. 4A, B). Interestingly, responding patients displayed increased concentrations of the CXC-ligand (CXCL) 9 after the first administration of ICI (P = .0322, supplementary Fig. 4C). CXCL9, together with IL-8, was also shown to be significantly elevated in the serum of melanoma patients before and after therapy as compared to HD (supplementary Fig. 4C, D).
Table 2. Multiple linear regression analysis of soluble serum factors associated with eosinophil frequencies in melanoma patients after treatment
Figure 4. Inflammatory mediators and circulating eosinophils upon ICI therapy. Inflammatory factors were measured in serum of melanoma patients pre- and post-treatment by bio-plex assay. The percentage of eosinophils within granulocytes was plotted against serum levels of IL-16 (a) or CCL2 (b) upon the treatment expressed in pg/mL
Association of eosinophil and CD8+ T cell infiltration of tumor tissue
Based on the previous findings, we investigated whether eosinophil counts in the peripheral blood are related to intratumoral infiltration. Eosinophils were detected by anti-MBP antibodies in the tumor tissue ()). Importantly, we found a correlation between the frequency of circulating eosinophils (measured as a percentage among live granulocytes) upon ICI treatment and amounts of eosinophils infiltrating the primary skin tumor of corresponding patients (P = .0062, )). Furthermore, we examined the activation status of eosinophils in primary tumors, metastases before (pre) and after treatment initiation (post). Metastatic samples were predominantly from the cutaneous or subcutaneous tissue; a few samples were from lymph nodes, brain, liver, and adrenal gland. Activated eosinophils were defined by the degranulation of MPB-positive vesicles. We observed that the amount of activated tumor-infiltrating eosinophils was enhanced in post-treatment samples as compared to pre-treatment ones (P = .0279, )).
Figure 5. Correlation of tumor infiltration with eosinophils and CD8+ T cells. Consecutive paraffin sections of primary tumors (n = 10) as well as metastases pre- (n = 18) and post-treatment (n = 5) were stained with hematoxylin/eosin (HE), anti-human MBP and CD8 antibodies. (a) Representative images of eosinophils stained with an anti-MBP antibodies. (b) The percentage of eosinophils within granulocytes in the peripheral blood determined by flow cytometry was plotted against eosinophil numbers in primary tumors assessed by immunohistochemistry. (c) Activated eosinophils in the intratumoral region of section from primary tumors as well as metastases pre- and post-treatment were determined by degranulation of MBP-positive vesicles. The results are presented as the percentage of activated among total tumor-infiltrating eosinophils (d) Representative images of consecutive paraffin sections of primary tumors, metastases pre- and post-treatment stained with HE, anti-MBP and anti-CD8 antibodies. (e) The numbers of eosinophils in the intratumoral region of primary tumors, metastases pre- and post-treatment in responders and non-responders was plotted against CD8+ T cell numbers in consecutive sections of these regions. (f) The numbers of eosinophils in the peri- and intratumoral region of metastases pre- and post-treatment was plotted against CD8+ T cell numbers in consecutive sections of these lesions. Responders were characterized by CR, PR, and SD. *P < .05
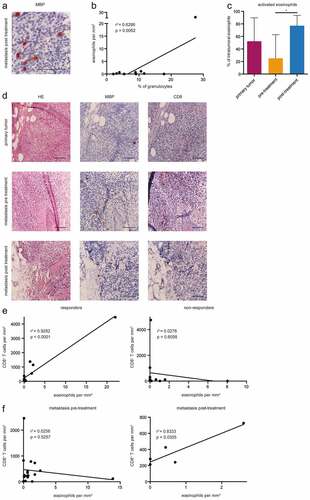
Since eosinophils were described to attract CD8+ T cells in melanoma-bearing mice in the absence of regulatory T cells,Citation18 we performed consecutive staining of samples from primary tumors, metastases before (pre) and after treatment initiation (post) with antibodies against MBP and CD8 ()). It was demonstrated that the number of eosinophils and CD8+ T cells positively correlated in responders in all samples from primary tumors as well as from pre- and post-treatment metastases, whereas no correlation could be observed in non-responders (R2 = 0.9282, P < .0001, )). Moreover, we found that the enrichment of eosinophils displayed a tendency of the association with an increased number of CD8+ T cells within metastases after the treatment (R2 = 0.8333, P = .0305, )). In contrast, no correlation was observed in samples from metastases before ICI treatment ()).
Discussion
It has been hypothesized that eosinophils could contribute to anti-tumor immunity upon immune checkpoint blockade, since increased eosinophil counts in melanoma patients treated with ipilimumab, pembrolizumab, or the combination of nivolumab and ipilimumab were reported to correlate with beneficial clinical responses.Citation3-Citation6
Here, we performed a comprehensive analysis of circulating and tumor-infiltrating eosinophils in melanoma patients in relation to their clinical responses to the treatment with either pembrolizumab or the combination of nivolumab and ipilimumab. A robust increase of both relative as well as the absolute eosinophil counts was observed in responders, in contrast to non-responders. Using flow cytometry, we found that all responding patients displayed an increase in the frequency of circulating eosinophils upon the therapy. However, an early increase of eosinophil numbers was also observed in 50% of the nonresponding patients, suggesting that early eosinophil accumulation could only be considered as a predictive marker in combination with other markers. In addition, it was demonstrated a strong tendency for an elevation of eosinophil count post-treatment in responders as compared to non-responders. Furthermore, we noticed a tendency toward a beneficial OS and PFS in patients with increased eosinophils numbers after the first administration of ICI. This data are in agreement with a recent publication on the association of the eosinophil accumulation during ICI treatment with a higher OS of melanoma patients.Citation28
Next, we investigated changes in the eosinophil profile after treatment initiation. Their activation status was assessed by the expression of CD69, an early activation marker of various immune cells, including eosinophils.Citation20 It was previously demonstrated that activated eosinophils upregulated metastasis suppressor molecules like E-cadherin on cancer cells in vitroCitation29 and inhibited lung metastasis in a melanoma mouse model.Citation20 Although we found no significant alterations, eosinophils from some responding patients displayed an upregulation of CD69 expression after the first administration of ICI. Intriguingly, two patients with >90% circulating CD69+ eosinophils had unresectable stage III disease and did not develop any visceral metastases within 3 years after the start of therapy.
Further changes in eosinophils were deciphered using transcriptomic approaches. Interestingly, eosinophils derived from patients with eosinophil enrichment post-treatment were characterized by an upregulation of Wnt signaling. The Wnt/β-catenin pathway, including the inhibition of the glycogen synthase kinase 3, has been shown to be crucial for IL5-mediated survival of eosinophilsCitation30 and could be a potential mechanism of eosinophil accumulation. On the other side, an upregulation of EMT related pathways was observed in eosinophils from patients without eosinophil accumulation. Until now, eosinophils were described to participate in the EMT of bronchial epithelial cellsCitation31 or esophageal epithelial cells.Citation32 Whether eosinophils contribute to EMT of tumor cells remains to be explored.
Eosinophils from melanoma patients before treatment showed patterns of platelet activation and vascular interaction as compared to the post-treatment group and to HD. It has been reported that eosinophils were able to activate platelets, leading to degranulation or increased adhesion,Citation33 and could create complexes with platelets in the peripheral blood of asthma patients.Citation34 Correspondingly, platelets are known to be activated in cancer patients due to education by tumor cells.Citation35 Moreover, one of the top DEG upregulated in the pre-treatment group was RAP1B, coding for a small GTPase, which has been described to activate α4 integrins on eosinophils.Citation36 These α4 integrins were shown to be responsible for the initial step of eosinophil diapedesis,Citation37 supporting the observed expression of genes involved in vascular interaction. Diapedesis is crucial for eosinophil migration into tumor tissue, which has been described as an inflammatory host response to tumor initiation in a melanoma mouse model.Citation38 Taken together, the gene expression profile of the pre-treatment group indicates the possibility of eosinophil migration to the tumor tissue of melanoma patients as an immune defense reaction.Citation8
Eosinophils from ICI-treated patients were shown to be enriched for IFN-γ response signatures and IL-2 signaling. IFN-γ signaling was found to be essential for the beneficial effect of PD-1 inhibition.Citation39 Furthermore, it has been recently demonstrated an IFN-γ-linked signature in eosinophils infiltrating mouse colorectal tumors and showing a strong anti-tumor activity.Citation40 IL-2 has been demonstrated to be upregulated in a melanoma mouse model after treatment with ICICitation41 and in patients responding to CTLA-4 inhibition.Citation42 Our GSEA results suggest that eosinophils could be influenced by cytokines released during ICI treatment. However, we also observed an upregulation of inhibitory genes in the post-treatment group, such as CD300A, encoding for an inhibitory receptor that has been associated with an impaired survival and chemotaxis of eosinophils.Citation43 Therefore, the post-treatment group showed a mixed genetic profile, which might be explained by the inconsistency of response to therapy in this group. Further analysis with higher sample numbers would be necessary to separate gene expression profiles of eosinophils from responders and non-responders.
Analyzing serum inflammatory mediators, we found that concentrations of IL-16 and CCL2 tend to be associated with the frequency of circulating eosinophils. IL-16, which could be also produced by eosinophils,Citation44 is known to induce migration of human eosinophils through binding to CD4 molecules expressed on their surfaceCitation45 and to stimulate the release of chemokines and cytokines by eosinophils.Citation46,Citation47 In addition, IL-16 levels were enhanced in the serum of patients with increased eosinophil counts due to allergic diseases.Citation48 Interestingly, we found that the expression of the IL16 gene in eosinophils was upregulated after treatment initiation. Therefore, our data suggest that the eosinophil accumulation after ICI treatment could be modulated by the elevation of IL-16 levels. Increased levels of the chemokine CCL2 were correlated with high eosinophil infiltration in a mouse model of allergic asthmaCitation49 and in human skin.Citation50 In line with our data, previous studies described an upregulation of CCL2 in the serum of allergic patients with elevated eosinophil counts.Citation51 Thus, CCL2 might be another factor leading to eosinophil accumulation during the immune checkpoint blockade.
When tumor sections were stained for eosinophils, we found that an accumulation of eosinophils in primary tumors was associated with increased eosinophil frequencies in the peripheral blood upon ICI treatment. Intriguingly, one patient displayed extensive tumor tissue eosinophilia and a strong early increase after treatment. Even though eosinophilia in tumor tissue and peripheral blood was previously described in cancer patients,Citation7,Citation9-Citation11 to our knowledge, there is no evidence about such association in the same patient. Furthermore, it has not been examined if patients who respond to immunotherapy and display eosinophilia upon treatment have anti-tumor immune responses mediated by eosinophils.
Since eosinophils have been demonstrated in a melanoma mouse model to attract CD8+ T cells into the tumor in the absence of regulatory T cells,Citation18 we evaluated primary tumor and metastatic lesions before and after ICI treatment. Melanoma lesions with increased numbers of CD8+ T cells displayed also an accumulation of eosinophils in responders, but not in non-responders, suggesting a relation between eosinophils and CD8+ T cells. Another publication showed that tumor infiltration by CD8+ T cells was enhanced in responders before and during ICI treatment.Citation39 In agreement with our data, T cell enrichment was previously reported to be associated with the infiltration of other leukocyte subpopulations.Citation52
Investigating the influence of ICI on eosinophil capacity to contribute to tumor defense, we compared metastatic samples from patients before and after treatment. Due to low sample numbers after treatment initiation, only patients presenting a response or a mixed response to therapy have been included in this group. Intriguingly, we found a higher amount of activated eosinophils in post-treatment metastatic samples as compared to pre-treatment ones. The degranulation of eosinophil MBP has been described in human Hodgkin lymphomaCitation53 and in melanoma-bearing mice.Citation38 Furthermore, MBP can exert the cytotoxic effects on tumor cells,Citation54 indicating that ICI treatment might stimulate the contribution of eosinophils to tumor defense. The activation and increased degranulation of eosinophils after immunotherapy has also been described in bladder cancer patients receiving IL-2Citation14 and in patients with non-hematological tumors treated with IL-4 and IL-2.Citation15 In addition, we found an association between the accumulation of eosinophils and CD8+ T cells in the peri- and intratumoral regions in post-treatment, but not pre-treatment samples. It has been shown that eosinophils activated by IL-33 induced recruitment and activation of CD8+ T cells in a melanoma mouse model.Citation19 In line with this observation, our results give some indications that eosinophils activated by the ICI therapy might contribute to the migration of CD8+ T cells to the tumor tissue.
Taken together, our data indicate that ICI treatment can influence eosinophils reflected by (i) their early increase in responders during treatment, (ii) an altered eosinophil activation status, and genetic profile, (iii) an increased degranulation in the tumor tissue and by (iv) a correlation between the amounts of eosinophils and CD8+ T cells infiltrated melanoma lesions. However, not all the observed effects on eosinophils might be attributed to ICI therapy. Therefore, future studies should also include the group of melanoma patients receiving or responding to other therapies.
Materials and methods
Patients and healthy donors
For this explorative immune monitoring study, peripheral blood samples were obtained from 32 metastatic melanoma patients receiving ICI at the Skin Cancer Center (University Medical Center Mannheim, Germany). This study was approved by the local ethics committee (2010-318N-MA) and was carried out in accordance to the principles of the Helsinki Declaration. The collection of the peripheral blood and clinical data was performed after patients gave their written informed consent. Peripheral blood samples from 10 age- and gender-matched healthy donors (HD) without indications of immune-related diseases were taken at the Institute of Transfusion Medicine and Immunology, Medical Faculty Mannheim, Heidelberg University, German Red Cross Blood Service Baden Württemberg-Hessen, Germany after informed consent.
Clinical data
Patients were included if they had unresectable stage III or stage IV melanoma according to the AJCC 2017 classification and were treated with pembrolizumab 10 mg per kg body weight every 3 weeks or the combination of nivolumab, 1 mg per kg body weight, and ipilimumab, 3 mg per kg body weight every 3 weeks. Treatment efficacy was assessed by contrast-enhanced CT, MRI, or PET-CT every 12 weeks after the first administration of ICI. Clinical responses were defined based on immune-related response criteria and indicated as complete response (CR), partial response (PR), stable disease (SD), progressive disease (PD), and mixed response (MR). Depending on the best overall response, patients were divided into responders (characterized by CR, PR, and SD) and non-responders (showing PD).
Analysis of peripheral blood samples
Peripheral blood was taken up to 25 days before (pre-treatment) and 12 to 32 days after the first administration of ICI (post-treatment). Counts for leukocyte subpopulations were measured by routine clinical laboratory analysis using a Sysmex XE-5000 analyzer (Sysmex). Granulocytes were obtained by density gradient centrifugation of heparinized venous blood from patients and HD using Biocoll (L6715, Biochrom) followed by lysis of erythrocytes in the extracted cell pellet using red blood cell lysis solution (130-094-183, Miltenyi Biotec). Serum was collected after centrifugation of blood samples for 10 min at 3,000 rpm and stored at −20°C.
Flow cytometry
Freshly obtained granulocytes were treated with FcR Blocking Reagent (130-111-568, Miltenyi Biotec) and stained with monoclonal antibodies (mAbs) for 30 min at 4°C. The following fluorescent-labeled mAbs were used for the surface staining: CD66b-FITC (305104), CCR3-APCCy7 (310712), Siglec-8-APC (347106, all Biolegend) as well as CD69-PECy7 (557745, BD Biosciences). The acquisition was performed by six-color flow cytometry using FACSCanto II with FACSDiva software (BD Biosciences). The compensation control was conducted with BD CompBeads (BD Biosciences) according to the manufacturer’s instruction. FlowJo software (Tree Star) was used to analyze at least 500,000 events. Dead cell exclusion was based on scatter profile or 7-AAD (130-059-901, Miltenyi Biotec).
Bio-plex assay
Concentrations of cytokines and chemokines in the serum of melanoma patients and HD were measured by the multiplex technology (Bio-Rad) using the manufacturer’s protocol. Acquisition and data analysis were performed by bio-plex ManagerTM.
Immunohistochemistry
Primary tumors and metastases taken up to 6 years before and 2 to 24 months after the first administration of ICI were analyzed. Serial IHC staining was conducted on sections of formalin‐fixed paraffin-embedded tumor tissues that included 10 primary tumors, 15 cutaneous or subcutaneous metastases, two lymph node metastases, two brain metastases, one liver, and one adrenal gland metastasis. Eosinophils were stained using anti-Major Basic Protein (MBP) antibodies (MCA5751, Bio-Rad) after pretreatment of the sections with pepsin (606213219, Gatt-Koller). CD8+ T cells were assessed by an anti-CD8 antibody (ab22378, Abcam) and the expression of PD-L1 by an anti-PD-L1 antibody (13684, Cell Signaling) using standard staining protocols. Antibody binding was visualized by the Dako EnVision™ System-HRP (Dako Kit, Mouse K4005 and Dako Kit, Rabbit K4009) as described by the manufacturer. Simultaneously, a negative control without the first antibody and a verified positive control were stained to avoid false positive or negative results.
Analysis of stained tumor samples
Each tumor sample was sectioned into an intratumoral region and a surrounding peritumoral region of 100-µm radius from the tumor boarder. Two independent physicians (SCSS and XH) who were blinded for the clinical data evaluated the number of positively stained cells separately. Major discrepancies in cell counts were reviewed and reanalyzed together to reach a consensus. The quantification of eosinophils and the analysis of their degranulation was conducted in the whole-sectioned intratumoral and peritumoral region using light microscopy (20x). The number of CD8+ T cells was counted in three randomly selected high-power fields (40x) of each sectioned region. Observed cell numbers were divided by the evaluated area to obtain an average cell count. PD-L1 expression was evaluated in completely sectioned tumor tissue using light microscopy. A sample was defined as PD-L1-positive if at least 5% of the tumor cells exhibited membrane PD-L1 staining of any intensity.
Isolation of eosinophils and RNA preparation
Eosinophils were isolated from the peripheral blood using an Eosinophil Isolation Kit (130-092-010, Miltenyi Biotec) after density gradient centrifugation and red blood cell lysis as previously described. The purity of isolated eosinophils was evaluated by flow cytometry and was around 98%. Isolation of total eosinophil RNA from isolated eosinophils was conducted with Trizol (15596018, Thermo Fisher Scientific), followed by quantification using a NanoDrop Spectrophotometer (ND-2000, Thermo Fisher Scientific). DNase digestion for RNA purification was performed using RQ1 RNase-Free DNase (M6101) and RNasin® Ribonuclease Inhibitor (N2611, both Promega Corporation) in accordance with the manufacturer’s instructions and subsequent precipitation. Quality control of RNA was performed using Agilent RNA 6000 Pico Kit with the Agilent 2100 Bioanalyzer (Agilent Technologies).
Microarray analysis
Transcriptome-wide gene expression was analyzed using the Affymetrix GeneChip Clariom™ S Assay (human) platform according to the manufacturer’s instructions. Raw microarray data was subjected to background subtraction, quantile normalization, and log2-transformation using the Robust Multichip Averaging algorithm as implemented in the oligo package (bioconductor). Principal component analysis (PCA) was computed using the prcomp function (R, stats). Differential expression was analyzed using the limma package (bioconductor),Citation55 genes were considered differentially expressed at an adjusted p-value < 0.1. Gene-set enrichment analysis (GSEA) was performed with the pre-ranked GSEA module using the Molecular Signatures Database Hallmark Gene Set CollectionCitation56 and the Reactome Pathway KnowledgebaseCitation24 (GSEA software, Broad Institute).Citation57
Statistical analysis
Comparisons of variables from the peripheral blood were examined for normal distribution and either analyzed with a Mann–Whitney U-test or a two-sample T-test. Overall survival (OS) was defined as the time from the start of ICI treatment until death due to any cause. Progression-free survival (PFS) was calculated as the time from treatment start until disease progression determined by imaging. OS and PFS were estimated by the Kaplan–Meier method. Cutoff values were determined by logistic regression analysis. Survival curves were analyzed with the log-rank test. Patients who did not die or have a progression were censored at the last assessment date. Comparisons of serum cytokines and chemokines with dependent variables from the peripheral blood were conducted by multiple linear regression analysis. Correlation between two parameters was estimated using the Pearson correlation coefficient and validated with a one-sample T-test. P-values less or equal than 0.05 were considered statistically significant. All analyses were performed using SAS software (version 9.4, SAS Institute) or GraphPad Prism (version 6.0e, GraphPad Software).
Disclosure of Potential Conflicts of Interests
The authors disclose no conflict of interest.
Supplemental Material
Download ()Acknowledgments
The authors wish to thank S. Büttner from the Medical Statistics Facility, Medical Faculty of Mannheim, University of Heidelberg for statistical analysis of the results. We thank L. Umansky and M. Platten for assistance with chemokine measurement and S. Arif-Said for assistance in immunohistochemical staining. The Microarray analysis was conducted by the Genomics and Proteomics Core Facility, German Cancer Research Center (DKFZ), Heidelberg.
Supplementary material
Supplemental data for this article can be accessed on the publisher’s website.
Additional information
Funding
References
- Schachter J, Ribas A, Long GV, Arance A, Grob JJ, Mortier L, Daud A, Carlino MS, McNeil C, Lotem M, et al. Pembrolizumab versus ipilimumab for advanced melanoma: final overall survival results of a multicentre, randomised, open-label phase 3 study (KEYNOTE-006). Lancet. 2017;390(10105):1853–12. doi:10.1016/S0140-6736(17)31601-X.
- Wolchok JD, Chiarion-Sileni V, Gonzalez R, Rutkowski P, Grob JJ, Cowey CL, Lao CD, Wagstaff J, Schadendorf D, Ferrucci PF, et al. Overall survival with combined nivolumab and ipilimumab in advanced melanoma. N Engl J Med. 2017;377(14):1345–1356. doi:10.1056/NEJMoa1709684.
- Gebhardt C, Sevko A, Jiang H, Lichtenberger R, Reith M, Tarnanidis K, Holland-Letz T, Umansky L, Beckhove P, Sucker A, et al. Myeloid cells and related chronic inflammatory factors as novel predictive markers in melanoma treatment with ipilimumab. Clin Cancer Res. 2015;21(24):5453–5459. doi:10.1158/1078-0432.CCR-15-0676.
- Rosner S, Kwong E, Shoushtari AN, Friedman CF, Betof AS, Brady MS, Coit DG, Callahan MK, Wolchok JD, Chapman PB, et al. Peripheral blood clinical laboratory variables associated with outcomes following combination nivolumab and ipilimumab immunotherapy in melanoma. Cancer Med. 2018;7(3):690–697. doi:10.1002/cam4.1356.
- Weide B, Martens A, Hassel JC, Berking C, Postow MA, Bisschop K, Simeone E, Mangana J, Schilling B, Di Giacomo AM, et al. Baseline biomarkers for outcome of melanoma patients treated with pembrolizumab. Clin Cancer Res. 2016;22(22):5487–5496. doi:10.1158/1078-0432.CCR-16-0127.
- Delyon J, Mateus C, Lefeuvre D, Lanoy E, Zitvogel L, Chaput N, Roy S, Eggermont AM, Routier E, Robert C. Experience in daily practice with ipilimumab for the treatment of patients with metastatic melanoma: an early increase in lymphocyte and eosinophil counts is associated with improved survival. Ann Oncol. 2013;24(6):1697–1703. doi:10.1093/annonc/mdt027.
- Feldbausch F. The occurrence of eosinophilic leukocytes in tumours. Archiv Pathologische Anatomie Physiologie Klinische Medicin. 1900;161:1–18.
- Simon SCS, Utikal J, Umansky V. Opposing roles of eosinophils in cancer. Cancer Immunol Immunother. 2019;68(5):823–833. doi:10.1007/s00262-018-2255-4.
- Dorta RG, Landman G, Kowalski LP, Lauris JR, Latorre MR, Oliveira DT. Tumour-associated tissue eosinophilia as a prognostic factor in oral squamous cell carcinomas. Histopathology. 2002;41(2):152–157. doi:10.1046/j1365-2559.2002.01437.x.
- Prizment AE, Vierkant RA, Smyrk TC, Tillmans LS, Lee JJ, Sriramarao P, Nelson HH, Lynch CF, Thibodeau SN, Church TR, et al. Tumor eosinophil infiltration and improved survival of colorectal cancer patients: Iowa Women’s Health study. Mod Pathol. 2016;29(5):516–527. doi:10.1038/modpathol.2016.42.
- Steel JL, Kim KH, Dew MA, Unruh ML, Antoni MH, Olek MC, Geller DA, Carr BI, Butterfield LH, Gamblin TC. Cancer-related symptom clusters, eosinophils, and survival in hepatobiliary cancer: an exploratory study. J Pain Symptom Manage. 2010;39(5):859–871. doi:10.1016/j.jpainsymman.2009.09.019.
- Oliveira DT, Biassi TP, Faustino SE, Carvalho AL, Landman G, Kowalski LP. Eosinophils may predict occult lymph node metastasis in early oral cancer. Clin Oral Investig. 2012;16(6):1523–1528. doi:10.1007/s00784-011-0651-7.
- vanDriel WJ, Hogendoorn PCW, Jansen FW, Zwinderman AH, Trimbos JP, Fleuren GJ. Tumor-associated eosinophilic infiltrate of cervical cancer is indicative for ex less effective immune response. Hum Pathol. 1996;27(9):904–911. doi:10.1016/s0046-8177(96)90216-6.
- Huland E, Huland H. Tumor-associated eosinophilia in interleukin-2-treated patients: evidence of toxic eosinophil degranulation on bladder cancer cells. J Cancer Res Clin Oncol. 1992;118:463–467. doi:10.1007/BF01629431.
- Sosman JA, Bartemes K, Offord KP, Kita H, Fisher SG, Kefer C, Ellis TA, Fisher RI, Higgins TJ, Gerald GJ. Evidence for eosinophil activation in cancer patients receiving recombinant interleukin-4: effects of interleukin-4 alone and following interleukin-2 administration. Clin Cancer Res. 1995;1:805–812.
- McNeel D, Gardner T, Higano C, Kantoff P, Small E, Wener M, Sims R, DeVries T, Sheikh N, Dreicer R. A transient increase in eosinophils is associated with prolonged survival in men with metastatic castration-resistant prostate cancer who receive sipuleucel-T. Cancer Immunol Res. 2014;2(10):988–999. doi:10.1158/2326-6066.CIR-14-0073.
- Tanizaki J, Haratani K, Hayashi H, Chiba Y, Nakamura Y, Yonesaka K, Kudo K, Kaneda H, Hasegawa Y, Tanaka K, et al. Peripheral blood biomarkers associated with clinical outcome in non-small cell lung cancer patients treated with nivolumab. J Thorac Oncol. 2018;13(1):97–105. doi:10.1016/j.jtho.2017.10.030.
- Carretero R, Sektioglu IM, Garbi N, Salgado OC, Beckhove P, Hammerling GJ. Eosinophils orchestrate cancer rejection by normalizing tumor vessels and enhancing infiltration of CD8(+) T cells. Nature Immunol. 2015;16(6):609–617. doi:10.1038/ni.3159.
- Lucarini V, Ziccheddu G, Macchia I, La Sorsa V, Peschiaroli F, Buccione C, Sistigu A, Sanchez M, Andreone S, D’Urso MT, et al. IL-33 restricts tumor growth and inhibits pulmonary metastasis in melanoma-bearing mice through eosinophils. Oncoimmunology. 2017;6(6). doi:10.1080/2162402x.2017.1317420.
- Hartnell A, Robinson DS, Kay AB, Wardlaw AJ. CD69 is expressed by human eosinophils activated in vivo in asthma and in vitro by cytokines. Immunology. 1993;80:281–286.
- Kinker KG, Gibson AM, Bass SA, Day BP, Deng J, Medvedovic M, Figueroa JA, Hershey GK, Chen W. Overexpression of dimethylarginine dimethylaminohydrolase 1 attenuates airway inflammation in a mouse model of asthma. PLoS One. 2014;9(1):e85148. doi:10.1371/journal.pone.0085148.
- Matsuo K, Nagakubo D, Komori Y, Fujisato S, Takeda N, Kitamatsu M, Nishiwaki K, Quan YS, Kamiyama F, Oiso N, et al. CCR4 is critically involved in skin allergic inflammation of BALB/c mice. J Invest Dermatol. 2018;138(8):1764–1773. doi:10.1016/j.jid.2018.02.027.
- Oh J, Malter JS. Pin1-FADD interactions regulate Fas-mediated apoptosis in activated eosinophils. J Immunol. 2013;190(10):4937–4945. doi:10.4049/jimmunol.1202646.
- Kanzaki M, Shibagaki N, Hatsushika K, Mitsui H, Inozume T, Okamoto A, Dobashi Y, Ogawa H, Shimada S, Nakao A. Human eosinophils have an intact Smad signaling pathway leading to a major transforming growth factor-beta target gene expression. Int Arch Allergy Immunol. 2007;142(4):309–317. doi:10.1159/000097500.
- Nagase H, Okugawa S, Ota Y, Yamaguchi M, Tomizawa H, Matsushima K, Ohta K, Yamamoto K, Hirai K. Expression and function of Toll-like receptors in eosinophils: activation by Toll-like receptor 7 ligand. J Immunol. 2003;171(8):3977–3982. doi:10.4049/jimmunol.171.8.3977.
- Becher B, Schlitzer A, Chen J, Mair F, Sumatoh HR, Teng KW, Low D, Ruedl C, Riccardi-Castagnoli P, Poidinger M, et al. High-dimensional analysis of the murine myeloid cell system. Nat Immunol. 2014;15(12):1181–1189. doi:10.1038/ni.3006.
- Douglas IS, Leff AR, Sperling AI. CD4+ T cell and eosinophil adhesion is mediated by specific ICAM-3 ligation and results in eosinophil activation. J Immunol. 2000;164(6):3385–3391. doi:10.4049/jimmunol.164.6.3385.
- Moreira A, Leisgang W, Schuler G, Heinzerling L. Eosinophilic count as a biomarker for prognosis of melanoma patients and its importance in the response to immunotherapy. Immunotherapy. 2017;9(2):115–121. doi:10.2217/imt-2016-0138.
- Furbert-Harris P, Parish-Gause D, Laniyan I, Hunter KA, Okomo-Awich J, Vaughn TR, Forrest KC, Howland C, Abdelnaby A, Oredipe OA. Inhibition of prostate cancer cell growth by activated eosinophils. Prostate. 2003;57(2):165–175. doi:10.1002/pros.10286.
- Rosas M, Dijkers PF, Lindemans CL, Lammers JW, Koenderman L, Coffer PJ. IL-5-mediated eosinophil survival requires inhibition of GSK-3 and correlates with beta-catenin relocalization. J Leukoc Biol. 2006;80(1):186–195. doi:10.1189/jlb.1105636.
- Yasukawa A, Hosoki K, Toda M, Miyake Y, Matsushima Y, Matsumoto T, Boveda-Ruiz D, Gil-Bernabe P, Nagao M, Sugimoto M, et al. Eosinophils promote epithelial to mesenchymal transition of bronchial epithelial cells. PLoS One. 2013;8(5):e64281. doi:10.1371/journal.pone.0064281.
- Kagalwalla AF, Akhtar N, Woodruff SA, Rea BA, Masterson JC, Mukkada V, Parashette KR, Du J, Fillon S, Protheroe CA, et al. Eosinophilic esophagitis: epithelial mesenchymal transition contributes to esophageal remodeling and reverses with treatment. J Allergy Clin Immunol. 2012;129(5):1387–1396 e1387. doi:10.1016/j.jaci.2012.03.005.
- Fernvik E, Lundahl J, Magnusson CG, Hallden G. The effect of in vitro activation and platelet interaction on the CD9 distribution and adhesion properties of human eosinophils. Inflamm Res. 1999;48(1):28–35. doi:10.1007/s000110050383.
- Shah SA, Page CP, Pitchford SC. Platelet-eosinophil interactions as a potential therapeutic target in allergic inflammation and asthma. Front Med (Lausanne). 2017;4:129. doi:10.3389/fmed.2017.00129.
- Plantureux L, Mege D, Crescence L, Dignat-George F, Dubois C, Panicot-Dubois L. Impacts of cancer on platelet production, activation and education and mechanisms of cancer-associated thrombosis. Cancers (Basel). 2018;10(11). doi:10.3390/cancers10110441.
- Ulfman LH, Kamp VM, van Aalst CW, Verhagen LP, Sanders ME, Reedquist KA, Buitenhuis M, Koenderman L. Homeostatic intracellular-free Ca2+ is permissive for Rap1-mediated constitutive activation of alpha4 integrins on eosinophils. J Immunol. 2008;180(8):5512–5519. doi:10.4049/jimmunol.180.8.5512.
- Ulfman LH, Kuijper PH, van der Linden JA, Lammers JW, Zwaginga JJ, Koenderman L. Characterization of eosinophil adhesion to TNF-alpha-activated endothelium under flow conditions: alpha 4 integrins mediate initial attachment, and E-selectin mediates rolling. J Immunol. 1999;163:343–350.
- Cormier SA, Taranova AG, Bedient C, Nguyen T, Protheroe C, Pero R, Dimina D, Ochkur SI, O’Neill K, Colbert D, et al. Pivotal advance: eosinophil infiltration of solid tumors is an early and persistent inflammatory host response. J Leukoc Biol. 2006;79(6):1131–1139. doi:10.1189/jlb.0106027.
- Tumeh PC, Harview CL, Yearley JH, Shintaku IP, Taylor EJ, Robert L, Chmielowski B, Spasic M, Henry G, Ciobanu V, et al. PD-1 blockade induces responses by inhibiting adaptive immune resistance. Nature. 2014;515(7528):568–571. doi:10.1038/nature13954.
- Reichman H, Itan M, Rozenberg P, Yarmolovski T, Brazowski E, Varol C, Gluck N, Shapira S, Arber N, Qimron U, et al. Activated eosinophils exert antitumorigenic activities in colorectal cancer. Cancer Immunol Res. 2019;7(3):388–400. doi:10.1158/2326-6066.CIR-18-0494.
- Spranger S, Koblish HK, Horton B, Scherle PA, Newton R, Gajewski TF. Mechanism of tumor rejection with doublets of CTLA-4, PD-1/PD-L1, or IDO blockade involves restored IL-2 production and proliferation of CD8(+) T cells directly within the tumor microenvironment. J Immunother Cancer. 2014;2:3. doi:10.1186/2051-1426-2-3.
- Reuben JM, Lee BN, Li C, Gomez-Navarro J, Bozon VA, Parker CA, Hernandez IM, Gutierrez C, Lopez-Berestein G, Camacho LH. Biologic and immunomodulatory events after CTLA-4 blockade with ticilimumab in patients with advanced malignant melanoma. Cancer. 2006;106(11):2437–2444. doi:10.1002/cncr.21854.
- Munitz A, Bachelet I, Eliashar R, Moretta A, Moretta L, Levi-Schaffer F. The inhibitory receptor IRp60 (CD300a) suppresses the effects of IL-5, GM-CSF, and eotaxin on human peripheral blood eosinophils. Blood. 2006;107(5):1996–2003. doi:10.1182/blood-2005-07-2926.
- Lim KG, Wan HC, Bozza PT, Resnick MB, Wong DT, Cruikshank WW, Kornfeld H, Center DM, Weller PF. Human eosinophils elaborate the lymphocyte chemoattractants. IL-16 (lymphocyte chemoattractant factor) and RANTES. J Immunol. 1996;156:2566–2570.
- Rand TH, Cruikshank WW, Center DM, Weller PF. CD4-mediated stimulation of human eosinophils: lymphocyte chemoattractant factor and other CD4-binding ligands elicit eosinophil migration. J Exp Med. 1991;173(6):1521–1528. doi:10.1084/jem.173.6.1521.
- Ferland C, Flamand N, Davoine F, Chakir J, Laviolette M. IL-16 activates plasminogen-plasmin system and promotes human eosinophil migration into extracellular matrix via CCR3-chemokine-mediated signaling and by modulating CD4 eosinophil expression. J Immunol. 2004;173(7):4417–4424. doi:10.4049/jimmunol.173.7.4417.
- Bandeira-Melo C, Sugiyama K, Woods LJ, Phoofolo M, Center DM, Cruikshank WW, Weller PF. IL-16 promotes leukotriene C(4) and IL-4 release from human eosinophils via CD4- and autocrine CCR3-chemokine-mediated signaling. J Immunol. 2002;168(9):4756–4763. doi:10.4049/jimmunol.168.9.4756.
- Wu KG, Li TH, Chen CJ, Cheng HI, Wang TY. Correlations of serum Interleukin-16, total IgE, eosinophil cationic protein and total eosinophil counts with disease activity in children with atopic dermatitis. Int J Immunopathol Pharmacol. 2011;24(1):15–23. doi:10.1177/039463201102400103.
- Gonzalo JA, Lloyd CM, Wen D, Albar JP, Wells TN, Proudfoot A, Martinez AC, Dorf M, Bjerke T, Coyle AJ, et al. The coordinated action of CC chemokines in the lung orchestrates allergic inflammation and airway hyperresponsiveness. J Exp Med. 1998;188(1):157–167. doi:10.1084/jem.188.1.157.
- Gaga M, Ong YE, Benyahia F, Aizen M, Barkans J, Kay AB. Skin reactivity and local cell recruitment in human atopic and nonatopic subjects by CCL2/MCP-1 and CCL3/MIP-1alpha. Allergy. 2008;63(6):703–711. doi:10.1111/j.1398-9995.2007.01578.x.
- Radman M, Hassanshahi G, Vazirinejad R, Arababadi MK, Karimabad MN, Khorramdelazad H, Rafatpanah H, Iranmanesh F, Hakimizadeh E, Ahmadi Z. Serum levels of the CC chemokines CCL2, CCL5, and CCL11 in food allergic children with different clinical manifestations. Inflammation. 2013;36(3):561–566. doi:10.1007/s10753-012-9577-8.
- Erdag G, Schaefer JT, Smolkin ME, Deacon DH, Shea SM, Dengel LT, Patterson JW, Slingluff CL Jr. Immunotype and immunohistologic characteristics of tumor-infiltrating immune cells are associated with clinical outcome in metastatic melanoma. Cancer Res. 2012;72(5):1070–1080. doi:10.1158/0008-5472.CAN-11-3218.
- Butterfield JH, Kephart GM, Banks PM, Gleich GJ. Extracellular deposition of eosinophil granule major basic protein in lymph nodes of patients with Hodgkin’s disease. Blood. 1986;68:1250–1256. doi:10.1182/blood.V68.6.1250.1250.
- Kubo H, Loegering DA, Adolphson CR, Gleich GJ. Cytotoxic properties of eosinophil granule major basic protein for tumor cells. Int Arch Allergy Immunol. 1999;118(2–4):426–428. doi:10.1159/000024154.
- Ritchie ME, Phipson B, Wu D, Hu Y, Law CW, Shi W, Smyth GK. limma powers differential expression analyses for RNA-sequencing and microarray studies. Nucleic Acids Res. 2015;43(7):e47. doi:10.1093/nar/gkv007.
- Liberzon A, Birger C, Thorvaldsdottir H, Ghandi M, Mesirov JP, Tamayo P. The Molecular Signatures Database (MSigDB) hallmark gene set collection. Cell Syst. 2015;1(6):417–425. doi:10.1016/j.cels.2015.12.004.
- Fabregat A, Jupe S, Matthews L, Sidiropoulos K, Gillespie M, Garapati P, Haw R, Jassal B, Korninger F, May B, et al. The reactome pathway knowledgebase. Nucleic Acids Res. 2018;46(D1):D649–D655. doi:10.1093/nar/gkx1132.