
ABSTRACT
Sézary syndrome (SS) is an aggressive leukemic variant of cutaneous T-cell lymphoma (L-CTCL) that arises from malignant clonally derived skin-homing CD4+ T cells. Based on advancements in our understanding of the mechanisms underlying L-CTCL, boosting the suppressed immune response emerges as a promising strategy in SS management. Immune checkpoint inhibitory molecules have already demonstrated efficacy in a wide spectrum of malignancies. Currently, agents targeting the programmed death-1 (PD-1) axis are under evaluation in L-CTCL. Here we investigated the expression of PD-1 and its ligands, PD-L1 and PD-L2 in blood and skin from patients with L-CTCL. We demonstrate that PD-1 expression is markedly increased on tumor T cells compared to non-tumor CD4+ T cells from SS patients and to CD4+ cells from healthy individuals. In contrast, PD-L1 shows decreased expression on tumor T cells, while PD-L2 expression is low without significant differences between these groups. Functional PD-1 blockade in vitro resulted in reduced Th2 phenotype of non-tumor T lymphocytes, but enhanced the proliferation of tumor T cells from SS patients. Our study sheds some light on the PD-1 axis in both peripheral blood and skin compartments in SS patients, which may be relevant for the treatment of L-CTCL with immune checkpoint inhibitor.
Introduction
Leukemic cutaneous T-cell lymphoma (L-CTCL), comprising Sézary Syndrome (SS) and mycosis fungoides (MF) with blood involvement, are common representatives of the heterogeneous group of primary cutaneous T-cell lymphomas,Citation1–Citation3 which arise from malignant T cells homing to (SS) or residing in (MF) the skin.Citation4 In contrast to early stage skin limited MF, SS and patients with advanced MF with blood and/or organ involvement are characterized by poorer prognosis.Citation5,Citation6 Apart from stem cell transplantation, there is no curative treatment for CTCL.Citation7–Citation9 In the recent years, a major breakthrough in the field of cancer therapy was the implementation of immune checkpoint inhibitors.Citation10 Monoclonal antibodies (mAbs) targeting the programmed cell death protein 1 (PD-1), one of its ligands PD-L1 as well as the cytotoxic T cell antigen 4 (CTLA-4) have demonstrated efficacy in different types of cancer, mainly solid tumors and particularly melanoma.Citation11–Citation15 PD-1 acts as immune checkpoint inhibitor and is a key player in promoting self-tolerance.Citation16,Citation17 Its binding to one of its two ligands, PD-L1 and PD-L2 lead to cell cycle arrest together with suppressed activation and function of effector T cells.Citation18 On the other hand, PD-1 axis downstream signaling is known to prevent apoptosis in regulatory T cells (Tregs).Citation19 Overexpression of PD-1 ligands by malignant cells promotes immune evasion and acts as a “molecular shield” conferring resistance to cytotoxic T cell response.Citation20–Citation22 Expression of PD-1 and its ligands by the tumor milieu contributes also to acquisition of an exhaustion phenotype by the effector cells.Citation23 Thus, targeting PD-1 axis aims at abrogating this inhibitory signaling and eliminating malignant cells by boosting the immune response. Moreover, these agents may act far beyond direct action on T cells, as it has been demonstrated in multiple myeloma, where targeting PD-1/PD-L1 improved skewed NK-cell mediated cytotoxicity.Citation24
In hematooncology, PD-1 and PD-L1 first gained attention in B-cell malignancies, where antibodies blocking this axis effectively abrogated inhibitory signaling from the tumor microenvironment.Citation25 In classical Hodgkin lymphoma, anti-PD-1 immunotherapy was associated with remarkable overall response rates (ORR)Citation26 accompanied by prolonged remission after therapy discontinuation.Citation27 Efficacy of this therapeutic approach emerged also in non-Hodgkin lymphoma (NHL) aggressive subtypes – diffuse large B-cell lymphoma (DLBCL) and follicular lymphoma (FL).Citation28 In T-cell-derived malignancies, the therapeutic potential of anti-PD-1/PD-L1 agents is still unclear. In peripheral T-cell lymphoma, where PD-1 immunoreactivity was observed in 62% and PD-L1 expression in 17% of patients, anti-PD-1 mAb nivolumab induced a 40% ORR in a small subset of heavily pretreated patients.Citation11 In anaplastic large cell lymphoma (ALCL), PD-1 blockade has been reported effective for patients with both ALK-negative and ALK-positive ALCL.Citation29–Citation31
There is an accumulating body of evidence showing the impact of the expression of PD-1 axis members in predicting the response to anti-PD-1 directed therapies.Citation32–Citation37 Preliminary data from clinical trials in solid tumors and Hodgkin lymphoma suggested PD-L1 expression to be crucial for the response to PD-1/PD-L1 blockade.Citation26,Citation38 However, reports on successful clinical outcome in PD-L1 negative casesCitation39 and unsuccessful therapy in a subset of PD-L1+ patients suggest that using PD-L1 as a single predictor has serious limitations. Recently, PD-L2 status emerged as a prediction factor of progression-free survival with pembrolizumab in a large cohort study of head and neck squamous cell carcinoma (HNSCC) patients.Citation40
Evaluation of PD-1 and its ligands PD-L1 and PD-L2 role in L-CTCL in large patient cohorts to assess their potential as prognostic markers is still limited due to the rarity of the disease and the diverse clinical spectrum determined by the long duration of the disease.Citation11,Citation41-Citation43 By now, most of the studies utilized immunohistochemistry, however this method may not be sensitive enough to detect cell surface expression of immune checkpoint molecules. In this study, we assessed the expression profile of PD-1, PD-L1 and PD-L2 on malignant and nonmalignant T cells in peripheral blood and skin derived from patients with L-CTCL and compared it with the expression on T cells from healthy individuals.
Our analysis presents a detailed image of PD-1 axis expression in L-CTCL and may contribute to a better understanding of the role of PD-1 and its ligands in L-CTCL and initiation of novel therapeutic strategies.
Materials and methods
Patients and human samples (skin and blood)
Patients from the Department of Dermatology of the University Hospital of Zurich, Switzerland, with previously diagnosed L-CTCL (SS) and with unequivocally identifiable Vβ clonal T-cell population in their blood and/or skin were included in the study. Blood samples from healthy individuals served as control. The diagnosis of CTCL was established in all patients according to the World Health Organization–European Organization for Research and Treatment of Cancer criteria for SS.Citation44 Peripheral blood and skin from the patients with SS were collected in the context of the University of Zürich Biobank, funded by the University of Zurich University Research Priority Program (URPP) in translational cancer biology. All patients signed an informed consent agreeing to the use of samples, including the generation of cell cultures according to the Biobank project (EK No. 647). Blood from healthy individuals was obtained from the blood bank of the University Hospital Zurich. Healthy skin (surgical remnants and control margins) was obtained as discarded tissue through the University of Zürich Biobank. The study was conducted in accordance with the principles of the Declaration of Helsinki and was approved by the Institutional Review Board of the University of Zurich (KEK-ZH-Nr. 2015–0209).
Isolation of T cells from human skin
Skin T cells from patients with L-CTCL and healthy donors were isolated from skin biopsies by short-term explant technique. Briefly, skin biopsies cut into small pieces were cultured on collagen-coated Cellfoam matrices in Iscove’s modification of Dulbecco’s media supplemented with 20% heat-inactivated FBS, 1% antibiotic-antimycotic (Gibco™), 2 mM L-glutamine, 100 IU/mL interleukin IL-2 and 10 ng/mL IL-15 (Peprotech) as previously reported.Citation45
Flow cytometry
Peripheral blood mononuclear cells (PBMC) were isolated via Ficoll centrifugation. Vβ clonal T-cell populations were assessed using IOTest® Beta Mark TCR V beta Repertoire Kit. (Beckman Coulter) according to the manufacturer’s instructions. Based on Vβ clonality assessment, patients with unequivocally identifiable clonal T-cell population in the blood and/or skin were subjected to further analysis.
For flow cytometry anti-human monoclonal antibodies were used as listed: anti-CD3 (clone BW264/56 labeled with PerCP, Miltenyi Biotec #130-096-910), anti-CD4 (clone VIT4 labeled with APC-Vio770, Miltenyi Biotec #130-098-153), anti-CD26 (clone BA5b labeled with PE-Cy7, BioLegend #302714), anti-CD279/PD-1 (clone J105 labeled with APC, ThermoFisher), anti-CD274/PD-L1 (clone MIH1 labeled with PE-Cy7, ThermoFisher), anti-CD273/PD-L2 (clone MIH18 labeled with APC, ThermoFisher), anti- KIR3DL2/CD158 k in Alexa Fluor® 700 (R&D systems, #FAB2878 N), anti CD160 in APC (Biolegend, #341207), and anti-TCR Vβ antibodies specific for the malignant clone of each patient (labeled with PE, Beckman Coulter). Samples were acquired on Becton Dickinson FACSCanto or BD LSR II Fortessa flow cytometer. FCS Express 5 Flow Cytometry RUO, FlowJo V10.0.8, Origin Pro 9.1 G and GraphPad Prism 5.0 Software were used for data analysis.
Intracellular flow cytometry for IFN-γ and IL-4
Ficoll purified PBMCs were seeded 2 × 10⁶ cells per well in 96-well plates, and cultured in RPMI 1640 medium (Gibco, #12633-012) supplemented with 10% fetal bovine serum (Sigma-Aldrich, #F0804), 1 mM sodium pyruvate (Gibco, # 11360070), 2 mM L-glutamine (Gibco, # 25030081), and 100 μg/ml Normocin (Invivogen). The PBMCs were stimulated with 50 ng/ml PMA (Sigma-Aldrich, #16561-29-8), 750 ng/ml ionomycin (Sigma-Aldrich, #56092-82-1), 1% PHA (Sigma-Aldrich, #5662-75-9), and 50 μg/ml poly I:C (Sigma-Aldrich, #26301-44-0). The same cells were re-stimulated with 50 ng/ml PMA and 750 ng/ml ionomycin after 24 h of incubation, and left for another 12 h in culture with added to the medium 10 µg/ml Brefeldin A (Sigma-Aldrich, #B6542). Two conditions were assessed for each patient: stimulated PBMC with and without PD-1 blockade (Nivolumab, 10 µg/mL). After the treatments, the lymphocytes were stained with anti-CD3 in PerCP (clone BW264/56, Miltenyi Biotec, #130-096-910), anti-CD4 in APC-Vio770 (clone REA623, Miltenyi Biotec, # 130-113-223), anti-CD8 in PE-Vio770 (clone REA734, Miltenyi Biotec, # 130-110-680), anti-IL-4 in APC (clone MP4-25D2, BD Pharmingen, #554486), anti-IFN-γ in FITC (clone 45–15, Miltenyi Biotec, #130-091-641) and anti-TCR Vβ antibodies in PE specific for the malignant clone of each patient (Beckman Coulter). BD LSR II Fortessa flow cytometer was used for data acquisition. The analysis was done in FlowJo V10.0.8.
T cell proliferation assay
Peripheral blood mononuclear cells (PBMC) were isolated via Ficoll centrifugation. The cells were seeded 2 × 10⁶ per well in 96-well plates, and cultured in RPMI 1640 medium (Gibco, #12633-012) supplemented with 10% fetal bovine serum (Sigma-Aldrich, #F0804), 1 mM sodium pyruvate (Gibco, # 11360070), 2 mM L-glutamine (Gibco, # 25030081), and 100 μg/ml Normocin (Invivogen). The PBMCs were initially stimulated with a cocktail of 50 ng/ml PMA (Sigma-Aldrich, #16561-29-8), 750 ng/ml ionomycin (Sigma-Aldrich, #56092-82-1), 1% PHA (Sigma-Aldrich, #5662-75-9), and 50 μg/ml poly I:C (Sigma-Aldrich, #26301-44-0). On day 2 after the seeding, the PBMCs were re-stimulated with 50 ng/ml PMA and 750 ng/ml ionomycin, and 10 µM 5-bromo-2̓-deoxyuridine (BrdU) was added to each sample. After an overnight incubation, the cells were stained with BrdU staining kit for flow cytometry (ThermoFisher, #8811-6600-42) according to the manufacturer’s protocol. Additional staining with anti-CD3 in PerCP (clone BW264/56, Miltenyi Biotec, #130-096-910), anti-CD4 in APC-Vio770 (clone REA623, Miltenyi Biotec, # 130-113-223), anti-CD8 in PE-Vio770 (clone REA734, Miltenyi Biotec, # 130-110-680), and anti-TCR Vβ antibodies in PE was applied. The T cell proliferation rate for each individual was investigated in stimulated PBMC with and without PD-1 blockade (Nivolumab, 10 µg/mL). The data were acquired on BD LSR II Fortessa flow cytometer, and subsequently analyzed with FlowJo V10.0.8.
Immunohistochemistry (IHC)
Immunohistochemistry (IHC) was performed on 3–5 μm thick paraffin sections as previously described. The sections were deparaffinized and rehydrated in graded series: X-TRA-Solv 8 (Medite, # 41-5212-00) – 15 min at 68°C; Xylol – 5 min room temperature (RT), 100% EtOH – 5 min RT; 96% EtOH – 5 min RT; 80% EtOH – 5 min RT; distilled water – 2 min RT. For antigen retrieval, the slides were heated in a Dako Cytomation Pascal Pressure Cooker (115°C; 10 min) and after that endogenous peroxidase activity was blocked using 3% hydrogen peroxide in distilled water (RT; 10 min). Normal goat serum was used to block nonspecific epitopes (30 min) and after that, the sections were incubated with the following primary antibodies: mouse anti-human PD-1 (R&D systems, # AF 1086, dilution 1:20; 60 min; RT), PD-L1 (Cell signaling, clone: E1L3 N, dilution: 1:25; 60 min; RT), PD-L2 (Cell signaling, clone: D7U8 C, dilution: 1:25, 60 min, RT) as well as the corresponding biotinylated anti-goat IgG secondary antibody (1:100 dilution, 30 min, RT). Following manufacturer’s protocol (Dako), visualization was achieved via application of streptavidin conjugated to alkaline phosphatase. Additional Mayer’s hematoxylin staining was applied in order to depict the cell nuclei. The staining rate (percentage of cells showing positive staining, 0-100%) was determined. PD-1 expression on >5% of lymphocytes was counted as positive. Expression was evaluated as negative (-) when the expression was 0-5%, moderate (+) when 5–50% cells showed positive staining and high expression (++) when more than 50% cells were positive per visual field. Graphic visualization of PD-1 expression in skin evaluated in three visual fields for each immunohistochemistry slide. As a control served discarded healthy surplus skin.
Statistical analysis
Differences in clinicopathological parameter distributions and PD-1, PD-L1 and PD-L2 expression were assessed with Fisher’s exact test. Data were tested for normal distribution with Shapiro–Wilk test. Dependent on the distribution pattern, for comparison among three groups non-parametric Kruskal-Wallis ANOVA or one-way ANOVA tests were used. When two groups were compared, a standard two sample Student’s t test or two sample Kolmogorov–Smirnov test was utilized. P values ≤0.05 were considered significant.
Results
PD-1 is up – while PD-L1 is downregulated in peripheral blood T cells of L-CTCL patients
First, we compared PD-1 expression in CD4+ T cells in the blood of L-CTCL patients and healthy individuals regardless of the clonal and non-clonal cell populations. Suppl. Table 1 summarizes the patients’ clinical characteristics. In all cases, we detected a population of CD4+ T cells expressing PD-1 and the percentage of PD-1 expressing CD4+ T cells was significantly upregulated in blood of L-CTCL patients (p = .006; )). The percentage of PD-1+ CD4+ T cells in blood from L-CTCL patients ranged from 25.28% to 83.03%, with mean value of 63.65%. In healthy individuals, the percentage of PD-1 expressing CD4+ T cells ranged between 22.59%-52.67%, with mean value of 37.43% ().
Figure 1. PD-1 is up – while PD-L1 is downregulated in peripheral blood T cells of L-CTCL patients. Percentage of PD-1, PDL-1 and PDL-2 positive cells upon staining with fluorochrome-conjugated monoclonal antibodies was assessed in double CD3- and CD4-positive cells. (a) T helper subset in L-CTCL individuals (n = 8) was characterized with significantly upregulated PD-1 expression compared to the healthy volunteers (n = 10). Representative dot blot (b) and histogram (c) demonstrate increased PD-1 expression on CD4+ T cells in blood from patients with L-CTCL, as compared to healthy donors. In contrast to PD-1, PD-L1 (d) showed decreased expression on CD4+ T cells in blood from patients with L-CTCL in comparison to healthy donors. Representative dot blot (e) and histogram (f) further visualize the lower PD-L1 expression on CD4+ T cells in L-CTCL. The percentage of peripheral blood CD4+ T cells positive for PD-L2 was low and did not differ significantly between L-CTCL patients and healthy donors (g). Mean values of percentage PD-L2 positive T lymphocytes (h) and median fluorescent intensity for the same marker (i) were in similar range for the patient and control cohort. Abbreviations: ns: P > .05; *: P ≤ 0.05; **: P ≤ 0.01; nlm: healthy donors
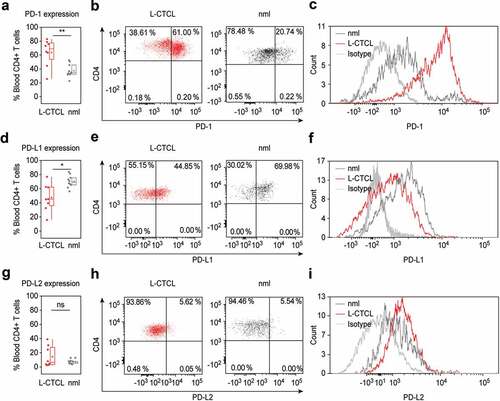
On the contrary, the percentage of PD-L1+ cells was significantly higher in healthy CD4+ T cells (range 56.33%-83.75%; mean 70.24%) compared to CD4+ T cells from L-CTCL patients (range 15.94%-76.82%; mean 47.48%) (p = .012; ).
The percentage of PD-L2 expressing peripheral blood CD4+ T cells was low in both L-CTCL (range 2.27%-38.94%; mean 14.38%) and healthy individuals (range 3.44%-12.82%; mean 6.68%) and the differences were not statistically significant (p = .18; ).
PD-1 is predominantly expressed on tumor T cells in the blood of L-CTCL patients
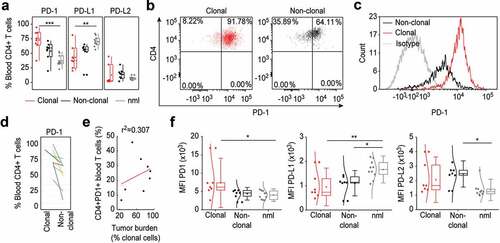
In L-CTCL patients, the peripheral CD4+ T cells compartment contains the clonally expanded tumor T cells as well as the non-clonal bystander CD4+ T cells. To analyze the pattern distribution and fluorescence intensity of PD-1 and PD-L1 expression on tumor and bystander T cells, we identified patients with conclusively identifiable specific TCR Vβ malignant T-cell clone. Interestingly, the high percentage of PD-1 expressing cells in L-CTCL blood ()) was largely due to increased PD-1 expression within the fraction of the tumor CD4+ T cells ()). The PD-1 expression on CD4+ T cells varied between the different patients, but the mean value of 72.68% PD-1+ tumor lymphocytes was significantly higher than the mean value of 53.73% PD-1+ non-tumor bystander lymphocytes in CTCL blood (p = .03; ). Interestingly, the percentage of PD-1+ T cells was higher in clonal tumor lymphocytes than in non-clonal bystander lymphocytes for every individual patient without exception ()) but did not correlate with the total tumor burden in patients’ blood (r = 0.307; r2 = 0.09) ()). Moreover, while increased PD-1 expression was strongly related to tumor lymphocytes ()), we found no significant differences in the percentage of neither PD-L1 nor PD-L2 expressing tumor or bystander lymphocytes in the blood of L-CTCL patients ()). Assessment of the fluorescence intensity confirmed increased PD-1 expression specifically on tumor but not bystander or healthy lymphocytes (p = .052), and general decrease in PD-L1 but not PD-L2 on both tumor (p = .007) and bystander lymphocytes (p = .003) in blood of L-CTCL patients ()). PD-L2 is significantly upregulated in non-clonal T-cells of L-CTCL patients compared to healthy controls ()).
Figure 2. PD-1 is upregulated specifically on tumor T cells in the blood of L-CTCL patients. (a) Expression of PD-1, PDL-1 and PDL-2 was analyzed in malignant (clonal) compared to bystander (non-clonal) CD4+ T cells from peripheral blood of L-CTLC patients (n = 8) vs. T cells from healthy individuals (n = 10) using flow cytometry. Clonal malignant T cells were identified upon staining with T-cell receptor Vβ antibodies specific for each patient’s malignant clone. (b) and (c) Representative dot blots and histograms demonstrate the increased PD-1 expression in clonal vs. non-clonal CD4+ T cells from patients with SS. (d) Pair-wise comparison of the expression of PD-1 on clonal CD4+ T cells compared to non-clonal CD4+ T cells within the same individual patients’ blood with L-CTCL. Each color-indexed pair represents a data set from an individual patient with L-CTCL. (e) Linear regression and correlation analysis to measure the strength of association between PD-1 expressing CD4+ T cells and tumor burden, defined by % clonal T cells of all CD4+ T cells. (f) Mean fluorescent intensities (MFIs) of the stainings for PD-1 and its ligands in malignant vs. bystander and normal peripheral blood CD4+ T cells were assessed. Clonal malignant T cells were definitively identified by staining with T-cell receptor Vβ antibodies specific for each patient’s malignant clone and showed significant increase of PD-1 expression compared to the control CD4+ T lymphocytes. On the contrary, PD-L1 was downregulated in L-CTCL patients on both clonal and non-clonal CD4+ T cell subsets. Abbreviations: ns: P > .05; *: P ≤ 0.05; **: P ≤ 0.01; ***: P ≤ 0.001; nlm: health donors
PD-1 expressing tumor T cells in the blood of L-CTCL patients are preferentially skin tropic
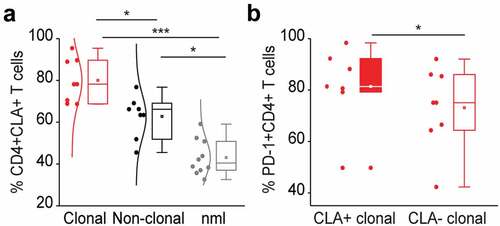
The glycoprotein cutaneous lymphocyte-associated antigen (CLA) is expressed on the cell surface of tumor lymphocytes and can be used for the identification of skin-homing T cells.Citation46 Skin‐resident CD4+ T cells express NK receptors, CD160 and CD158 k (KIR3DL2) being amongst the most stably observed and relative ones for CTCL.Citation47 In our study cohort, CLA was expressed on 71.36% of all lymphocytes in L-CTCL patients and on 42.6% of all lymphocytes in healthy individuals (p = .00000068, )). Within the subset of TCR Vβ clonal tumor cells, 77.26% of the cells expressed CLA. In particular, PD-1 expressing tumor T cells were preferentially CLA positive and thus skin tropic (p = .03; )). Further, tumor cells showed a tendency for enhanced CD160 expression (Suppl. Figure 1a), especially within the fraction of skin-homing (Suppl. Figure 1b) or PD-1+ (Suppl. Figure 1c) T cells. CD158 k is known to be often expressed on malignant T-cells.Citation48,Citation49 In the limited number of patients, from which samples were available for this analysis, expression of CD158 k did not significantly differ depending on clonality (Suppl. Figure 1d) or skin-homing capacity (Suppl. Figure 1e) of the T cells but was strikingly and almost exclusively restricted to PD-1+ T cells only (Suppl. Figure 1f).
Figure 3. PD-1 expressing tumor T cells in the blood of L-CTCL patients are preferentially skin tropic. (a) CLA expression was significantly higher in L-CTCL patients (n = 8), especially within the subset of TCR Vβ clonal tumor cells compared to healthy individuals (n = 10). (b) PD-1 expressing tumor T cells were preferentially CLA positive and thus skin tropic. Abbreviations: ns: P > .05; *: P ≤ 0.05; **: P ≤ 0.01; ***: P ≤ 0.001; nlm: healthy donors
T lymphocytes from L-CTCL skin lesions overexpress PD-1, have significantly lower PD-L1 and almost negligible PD-L2 expression
To analyze the expression of PD-1 and its ligands on skin-derived T cells directly, we isolated T cells from biopsy specimens of L-CTCL patients and healthy individuals using short-term explant techniqueCitation45,Citation50 and subjected them to flow cytometry. Interestingly, in flow cytometry, almost all T cells isolated from patients with L-CTCL homogeneously expressed high levels of PD-1. The percentage of PD-1 expressing CD3+CD8− T cells from L-CTCL skin lesions ranged from 80.96% to 98.34%, with mean value of 93.14%, while only less than one-third of T cells isolated from healthy skin expressed PD-1 (range 20.34%-33%, medium 27.0%) (p = .005, )). Interestingly, and in contrast to the blood, PD-1 expression on L-CTCL skin T cells was very high and equally upregulated both within the fraction of the tumor (95.78%) and the non-tumoral (96.46%) T cells (p-value = 0.84, )). In parallel, T lymphocytes in L-CTCL skin lesions expressed significantly less PD-L1 (mean 10.1%; range 1.66% to 15.06%) compared to T lymphocytes in healthy skin (mean 48.64%; range 40.24%- 57.72%) (p = .001, )).
Figure 4. PD-1 is significantly overexpressed, PD-L1 significantly decreased and PD-L2 is low on T cells in the skin of patients with L-CTCL when compared with T cell population in healthy individuals. (a) PD-1, PD-L1 and PD-L2 expression analyzed by flow cytometry in skin-derived CD3+CD8− T cells isolated from biopsies of L-CTCL patients (n = 6) and healthy individuals (n = 4) using short-term explant technique. (b) Expression of PD-1, PD-L1 and PD-L2 in the tumor (clonal) and non-tumoral bystander (non-clonal) T cells from L-CTLC skin lesions. In at least one of the samples analyzed in a) and b), there was a partial aberrant loss of CD4 on the tumor cells. For consistency throughout all the samples, a gating strategy on CD3+ CD8-T cells was applied. (c) Representative images of paraffin-embedded CTCL (MF and SS) skin biopsies with high expression of PD-1 (++/≥50%), with moderate expression of PD-1 (+/5-50%), and negative for PD-1 (-/<5%). (d) Graphic visualization of PD-1 expression in CTCL skin lesions (n = 18). Evaluation of three visual fields of each slide demonstrates variable positivity for PD-1 in CTCL on immunohistochemistry. Abbreviations: ns: P > .05; ***: P ≤ 0.001; nlm: healthy donors
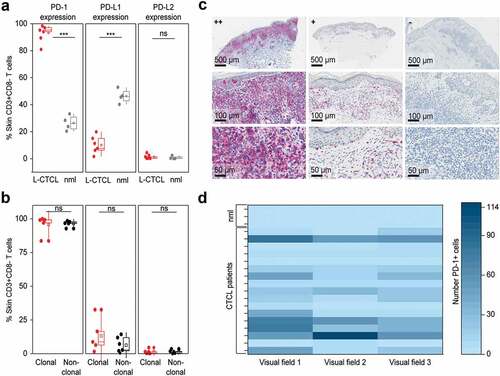
Expression of PD-L2 was low in all cases and did not differ significantly between T lymphocytes isolated from L-CTCL skin lesions (mean 0.94%; range 0.24% to 2.53%) and T lymphocytes isolated from healthy skin (mean 0.06%; range 0.04%-2.44%) (p = .62, )). Finally, the percentage of PD-L1 expressing skin T cells showed a tendency for higher expression (mean 13.18%) on tumor skin T cells than on non-tumoral T cells isolated from the same lesion (mean 6.32%); however, the difference did not reach statistical significance (p = .31, )). PD-L2 was low and did not differ significantly between clonal (mean 1.33%; range 0.17–4.53%) and non-tumoral (non-clonal) (mean 1.37%; range 0–3.5%) skin T cells (p = .97, )).
We also applied immunohistochemistry (IHC) on formalin-fixed skin biopsies as a less sensitive but easily applicable routine method to detect PD-1 expressing lymphocytes in both MF- and SS-CTCL skin lesions (n = 18, Suppl. Table 2). IHC confirmed high (++) PD-1 expression on lymphocytes in 17% of the lesional CTCL skin biopsies. In 56% of the cases, PD-1 expression was moderate (+) and in 27% of the cases IHC-staining for PD-1 remained negative (-) ( and Suppl. Table 2). In IHC, the expression of PD-1 was significantly higher in the L-CTCL patient group compared to the non-leukemic patient group. As L-CTCL, we considered MF or SS patients with blood involvement B2 (recommendations from the EORTC cutaneous lymphoma task forceCitation51). As non-leukemic, we considered MF patients without blood involvement (B0) or MF patients with borderline blood involvement B1. High PD-1 expression was observed in 27% of the lesional biopsies in L-CTCL in contrast to 0% in the non-leukemic patients. No correlation between disease duration and PD-1 expression could be detected (data not shown).
PD-1 blockade reduces Th2 phenotype of non-tumoral bystander T lymphocytes in Sézary patients
Recently Samimi et al. reported that blockade of PD-1 downstream signaling by the use of anti-PD-1 or anti-PD-L1 antibodies increased IFN-γ secretion in vitro in total peripheral blood lymphocytes in three out of six patients with Sézary syndrome.Citation43 These data suggest that PD-1 targeting may abolish suppressive phenotype of SS cells. We evaluated the impact of PD-1 blockade (nivolumab 10 µg/mL) on the Th1/Th2 phenotype of separate T cell subpopulation by intracytoplasmic flow cytometry for IFN-γ and IL-4. For functional studies, peripheral blood from five SS patients was available (suppl. Table 3).
Within the fraction of total blood CD4+ T cells, PD-1 blockade resulted in decreased percentage of IL-4 producers in five out of five Sézary patients ()). In contrast, IL-4 production of CD8+ T cells remained largely unaffected ()). Cumulative analysis revealed no statistically significant differences in the percentage of IL-4 producing CD3+ and CD8+ T cells and confirmed a significant decrease by approximately 30% of IL-4-producing total CD4+ T cells upon PD-1 blockade (p = .0042, Suppl. Figure 2(a-c)). Further analysis clearly demonstrated that PD-1 blockade reduced the frequency and intensity of IL-4 production exclusively in the fraction of non-clonal bystander CD4+ T lymphocytes (p = .0006), while tumor T cells retained their high levels of IL-4 () and Suppl. Figure 2d-g).
Figure 5. PD-1 blockade reduces Th2 phenotype of non-clonal bystander T lymphocytes in Sézary patients. The impact of in vitro PD-1 blockade on the Th1/Th2 phenotype of separate T cell subpopulation was evaluated by intracytoplasmic flow cytometry for IL-4 and IFN-γ. Percentage of IL-4 producing CD4+ T cells (a) and percentage of IL-4 producing CD8+ T cells (b) stimulated in the absence (blue dots) or presence (red dots) of 10 µg/mL nivolumab. Further gating demonstrates the change in percentage of IL-4 producers upon PD-1 blockade in non-clonal, bystander CD4+ T cells (c) versus clonal malignant T cells identified upon staining with T-cell receptor Vβ antibodies, specific for each individual patient, as described in Fig. 2 (d). (e–h) Distribution of IFN- γ producers amongst the same T cell fractions and stimulating conditions as described in (a-d). Data from five SS patients. Each dot represents data from one individual patient. The data obtained from the same patient are connected with dotted line
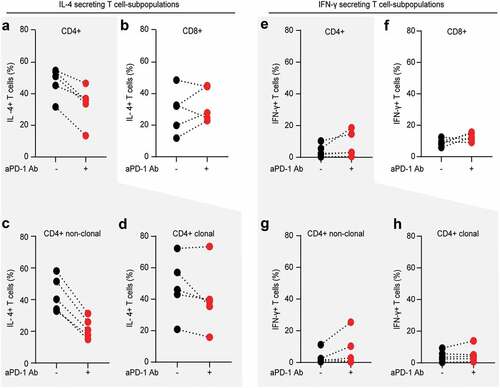
As previously reported,Citation50,Citation52-Citation54 we observed a global Th2-bias also in this cohort of Sézary patients with a frequency of IL-4 producing cells at least two times higher (>30%) than the frequency of IFN-γ producing cells (<15%), regardless of the T cell subpopulation ( and suppl. Figure 2). Upon PD-1 blockade, there was a tendency for increased frequency and/or intensity of IFN-γ producers in all T cell fractions, with the highest consistency (three out of five patients) for the fraction of CD8+ T cells (). Nevertheless, cumulative analysis failed to reveal statistically significant impact of PD-blockade on IFN-γ in our cohort of Sézary patients (suppl. Figure 3).
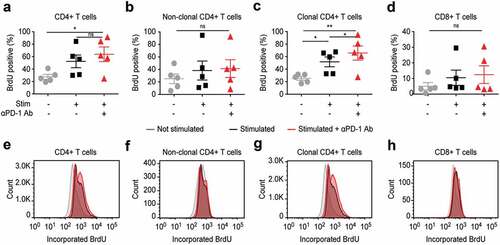
PD-1 blockade leads to enhanced proliferation of T cells, but affects also the clonal tumor T cells
PD-1 signaling efficiently inhibits T cell activation and its blockade results in enhanced T cell proliferation, which is of advantage in the treatment of solid tumors.Citation55 It is not yet sufficiently elucidated if in the setting of a tumor arising in T cells themselves, PD-1 blockade strengthens more anti-tumor T cell immunity or rather facilitates tumor progression.Citation50,Citation56-Citation60 We evaluated the impact of PD-1 blockade (nivolumab 10 µg/mL) on T cell proliferation by measuring non-radioactive 5-bromo-2ʹ-deoxyuridine (BrdU) incorporation. PD-1 blockade resulted in enhanced proliferation of T cells upon stimulation; however, we observed the strongest enhancement of proliferation within the fraction of the clonal tumor T cell as compared to their benign non-clonal counterparts ().
Figure 6. In vitro PD-1 blockade leads to enhanced proliferation of T cells, but affects most strongly the clonal tumor T cells in blood from SS patients
Discussion
Agents targeting the PD-1 axis are established in the treatment of solid tumors and are emerging as novel options in the management of hematological malignancies. In general, their action relies on boosting the impaired immune response by abrogating immunosuppressive mechanisms. The particularity of CTCL in the context of implementation of immune checkpoint inhibitors is based on the fact that the tumor itself arises from CD4+ T cells, a population of lymphocytes responsible for the priming of cytotoxic response. In CTCL both malignant and bystander T helper cells are characterized with Th2 bias (that results in skewed anti-tumor and anti-pathogen response) and have an exhausted phenotype.Citation50
Studies in solid tumors suggest that blocking PD-1 may be effective in abrogating Th2 bias.Citation61–Citation66 However, the exact role of PD-1 and its two known ligands, PD-L1 and PD-L2, in the tumor microenvironment of patients with CTCL is not fully understood and may differ from those in tumors arising from non-T cells.Citation36,Citation37,Citation42,Citation43,Citation61-Citation68
A recent single-arm, multicenter phase II study showed an overall response of 38% to pembrolizumab in patients with relapsed/refractory MF and SS (stages IB-IV; n = 24). Six out of nine responders had ≥90% improvement in skin disease as determined by mSWAT score. In this study, IHC expression of PD-1, PD-L1, or PD-L2 could not predict response to treatment, but increased PD-L1 expression by both IHC and nanoString analysis upon administration of pembrolizumab was observed.Citation69
To our knowledge, our study provides the first analysis that consecutively addresses the expression of PD-1 and its ligands in CD4+ malignant and bystander cells in peripheral blood and skin lesions in L-CTCL. Our results demonstrate high heterogeneity in the expression of immune checkpoint molecules, PD-1, PD-L1 and PD-L2, on malignant and nonmalignant CD4+ T cells in the blood and skin of patients with L-CTCL. Despite this heterogeneity, we show a particular immune checkpoint pathway signature in patients with L-CTCL.
Our study indicates that PD-1 is significantly overexpressed on malignant T cells in the peripheral blood and skin of patients with L-CTCL when compared with the nonmalignant bystander T cells in L-CTCL patients and healthy CD4+ T cells, which is in line with previous studies.Citation43,Citation70 We observed also a significantly increased expression of PD-1 in skin-homing CD4+ cells in L-CTCL patients that again was more pronounced in clonal malignant cells. Our data further support the assumption suggested by other authorsCitation42,Citation43,Citation67 that PD-1 is a contributor to the immunosuppression and dysregulated immune response, characteristic for L-CTCL patients.
Several reports reveal diverse expression of PD-1 axis in CTCL subtypes.Citation20,Citation42 A study by Wilcox et al. demonstrated that PD-L1 was expressed in peripheral blood CD4+ T cells in the majority of patients with L-CTCL; however, only 27% of the patients’ biopsies were evaluated with immunohistochemistry.Citation20 Its expression, however, was high in the tumor environment, particularly in monocyte-derived compartment, where PD-L1 was expressed by 73% of cells. A study by Wada et al., where PD-1 expression was assessed in a cohort of 15 MF and 11 SS patients, showed high positivity in PD-1 and thus proposed PD-1 as a factor responsible for drug resistance in SS.Citation70
In fact, PD-1 expression is linked to T cell exhaustion and hypoproliferation and Sézary cells have documented resistance to conventional mitogens and apoptotic stimuli.Citation71,Citation72 In an analysis by Kantekure et al. PD-1 was frequently expressed in the early stages – patch and plaque of mycosis fungoides, but diminished in the tumor stage and in cases of large cell transformation.Citation73 On the other hand, more advanced stages were characterized by high expression of PD-L1.Citation73 Reports by others suggest that PD-1 expression correlates with disease progression. Samimi et al. showed significantly increased expression of PD-1 in CD4+ T cells in the blood of SS patients when compared to MF patients and healthy volunteers.Citation43 Increased expression of PD-1+ cells was observed both in CD26- and CD26+ (a surrogate marker for malignant cells) cells.Citation43 Blockade of PD-1 downstream signaling by the use of anti-PD-1 and anti-PD-L1 antibodies increased IFN-γ secretion in a subset of patients, suggesting that PD-1 targeting may abolish suppressive phenotype of SS cells. Another study analyzed expression of PD-1 in skin biopsies in a large cohort of 27 SS and 60 MF patients by immunocytochemistry and showed strong expression in 89% of SS, but only 13% of MF.Citation42 Recently an elegant study by Querfeld et al. assessing the expression profile of immune checkpoints by flow cytometry in CTCL skin samples has been published; however, no clear distinction between their expression in MF and SS has been made.Citation63 The study showed that CD4+ cells in MF and SS population had higher percentage of PD-1+ cells, compared to healthy skin. However, most of the T cells did not express PD-L1. Analysis of PD-L1 on DC revealed that they harbored high PD-L1 expression regardless of disease status.
Importantly, it has been observed that therapies blocking the PD-1 axis are also effective in low immunogenic tumors, especially in cases where those molecules are expressed also by tumor cells due to an activation of the mTOR pathway.Citation43,Citation74,Citation75 Activation of mTOR has been recently demonstrated as characteristic for mycosis fungoidesCitation74-Citation77 and may possibly explain the increased PD-1 expression also in our subset of patients. However, given that both malignant clonal and benign non-clonal T cells express PD-1, further studies exploring the mechanisms that lead to PD-1 overexpression in patients with L-CTCL are needed. In our study, the percentage of PD-1+ T cells was higher in clonal tumor lymphocytes than in non-clonal bystander lymphocytes for every individual patient, but did not correlate with the total tumor burden in patients’ blood, in contrast to other studies, which reported on higher numbers of PD-1 positive cells in L-CTCL patients with a low or medium tumor burden and decreased expression of PD-1 in those with a high tumor burden.Citation43
In the current study, the percentage of PD-L1+ cells was decreased on malignant T cells in blood when compared with nonmalignant T cells in patients with L-CTCL. Although individual variability of the expression in this group was high, PD-L1 expression was detected in all patients with L-CTCL, which is in contrast to previously reported negative expression of PD-1 ligands.Citation43 Generally, a correlation between high PD-L1 expression and clinical response to therapies targeting the PD-1 pathway has been observed in patients with a broad spectrum of malignancies.Citation78,Citation79 Although PD-L1 is not an unequivocal biomarker to predict clinical responses, the expression profile of T-cell checkpoint molecules seems to be valuable not only for confirming the presence or absence of the therapeutic target but also for providing characteristics of tumor-directed T-cell responses in individual patients.Citation80 The expression levels of PD-L1 on CD4+ T cells in blood and skin from L-CTCL patients were markedly lower compared to healthy individuals, but generally higher on clonal CD4+ T cells in individuals with higher percentage of clonal cells. Thus, we suggest that targeting PD-L1 may be a rational strategy in the management of patients with high tumor burden. This is especially interesting, as an anti-PD-L1 agent (atezolizumab) is currently being tested in CTCL and trials with durvalumab are actively recruiting patients. Given the fact that PD-1 has been recently demonstrated to act as a tumor suppressor in T-cell malignanciesCitation81 and taking into consideration a case report on a patient developing an epidermotropic peripheral T cell lymphoma when treated with pembrolizumab for melanoma,Citation82 targeting PD-1 ligands may potentially offer safer option in CTCL. It has been suggested by some authors that high PD-L1 expression in tumors reflects a preexisting anti-tumor immunity in patients when compared to patients with tumors that lack PD-L1 expression.Citation78 Therefore, the observed low levels of PD-L1 expression in the patients that we examined could indicate an attenuated, preexisting antitumor immunity, that may benefit from immune checkpoint inhibition.
We observed low levels of PD-L2 in L-CTCL CD4+ cells both in skin and blood, that did not differ significantly from the levels observed in healthy individuals. By now, the role of PD-L2 expression both as a tumor-promoting factor as well as a prognostic marker has not been sufficiently clarified.Citation83–Citation85 Novel studies suggest that it may also serve as a marker of clinical response to pembrolizumab, as demonstrated in patients with head and neck squamous cell carcinoma, where PD-L2 positivity correlated with greater objective response rate and longer median progression-free survival time.Citation85 This study showed 37% objective response rate in MF patients treated with nivolumab, however little is known about the role of PD-L2 in CTCL and whether it correlates with the clinical outcome of anti-PD-1/PD-L1 therapies. Further studies on a molecular level as well as clinical trials are needed to fully elucidate its relevance as a biomarker.
Altogether, our study offers a complex image of PD-1 axis signature in L-CTLC patients. However, studies investigating the expression of these negative checkpoint regulators on other populations of immune cells, e.g., dendritic cells are also needed to provide even better understanding of the clinical outcome of anti-PD-1 targeting therapies. Moreover, as reports on the development of resistance to PD-1/PD-L1 blocking antibodies arise, e.g., by upregulation of CD38,Citation86 expression and regulation of other molecules contributing to the success of immune checkpoint inhibitors should also be addressed.
Disclosure of potential conflicts of interest
No potential conflicts of interest were disclosed.
Supplemental Material
Download ()Supplementary material
Supplemental data for this article can be accessed on the publisher’s website.
Additional information
Funding
References
- Willemze R, Cerroni L, Kempf W, Berti E, Facchetti F, Swerdlow SH, Jaffe ES. The 2018 update of the WHO-EORTC classification for primary cutaneous lymphomas. Blood. 2019;133(16):1703–12. doi:10.1182/blood-2018-11-881268.
- Mangold AR, Thompson AK, Davis MD, Saulite I, Cozzio A, Guenova E, Hodak E, Amitay-Laish I, Pujol RM, Pittelkow MR, et al. Early clinical manifestations of Sezary syndrome: A multicenter retrospective cohort study. J Am Acad Dermatol. 2017;77(4):719–727. doi:10.1016/j.jaad.2017.05.036.
- Molloy K, Jonak C, Woei AJF, Guenova E, Busschots AM, Bervoets A, Hauben E, Knobler R, Porkert S, Fassnacht C, et al. Characteristics associated with significantly worse quality of life in mycosis fungoides/sezary syndrome from the Prospective Cutaneous Lymphoma International Prognostic Index (PROCLIPI) study. Br J Dermatol. 2020;182(3):770–779. doi:10.1111/bjd.18089.
- Campbell JJ, Clark RA, Watanabe R, Kupper TS. Sezary syndrome and mycosis fungoides arise from distinct T-cell subsets: a biologic rationale for their distinct clinical behaviors. Blood. 2010;116(5):767–771. doi:10.1182/blood-2009-11-251926.
- Scarisbrick JJ, Prince HM, Vermeer MH, Quaglino P, Horwitz S, Porcu P, Stadler R, Wood GS, Beylot-Barry M, Pham-Ledard A, et al. Cutaneous lymphoma international consortium study of outcome in advanced stages of mycosis fungoides and sezary syndrome: effect of specific prognostic markers on survival and development of a prognostic model. J Clin Oncol. 2015;33(32):3766–3773. doi:10.1200/JCO.2015.61.7142.
- Scarisbrick JJ, Quaglino P, Prince HM, Papadavid E, Hodak E, Bagot M, Servitje O, Berti E, Ortiz-Romero P, Stadler R, et al. The PROCLIPI international registry of early-stage mycosis fungoides identifies substantial diagnostic delay in most patients. Br J Dermatol. 2018;181(2):350–357. doi:10.1111/bjd.17258.
- Guenova E, Ignatova D, Chang YT, Contassot E, Mehra T, Saulite I, Navarini A, Mitev V, Dummer R, Kazakov D, et al. Expression of CD164 on malignant T cells in Sézary syndrome. Acta Derm Venereol. 2016;96(4):464–467. doi:10.2340/00015555-2264.
- Saulite I, Hoetzenecker W, Weidinger S, Cozzio A, Guenova E, Wehkamp U. Sezary syndrome and atopic dermatitis: comparison of immunological aspects and targets. Biomed Res Int. 2016;2016:9717530. doi:10.1155/2016/9717530.
- Argnani L, Broccoli A, Zinzani PL. Cutaneous T-cell lymphomas: focusing on novel agents in relapsed and refractory disease. Cancer Treat Rev. 2017;61:61–69. doi:10.1016/j.ctrv.2017.10.007.
- Couzin-Frankel J. Breakthrough of the year 2013. Cancer Immuno Sci. 2013;342:1432–1433.
- Lesokhin AM, Ansell SM, Armand P, Scott EC, Halwani A, Gutierrez M, Millenson MM, Cohen AD, Schuster SJ, Lebovic D, et al. Nivolumab in patients with relapsed or refractory hematologic malignancy: preliminary results of a phase Ib Study. J Clin Oncol. 2016;34(23):2698–2704. doi:10.1200/JCO.2015.65.9789.
- Brahmer JR, Tykodi SS, Chow LQ, Hwu W-J, Topalian SL, Hwu P, Drake CG, Camacho LH, Kauh J, Odunsi K, et al. Safety and activity of anti-PD-L1 antibody in patients with advanced cancer. N Engl J Med. 2012;366(26):2455–2465. doi:10.1056/NEJMoa1200694.
- Topalian SL, Hodi FS, Brahmer JR, Gettinger SN, Smith DC, McDermott DF, Powderly JD, Carvajal RD, Sosman JA, Atkins MB, et al. Safety, activity, and immune correlates of anti-PD-1 antibody in cancer. N Engl J Med. 2012;366(26):2443–2454. doi:10.1056/NEJMoa1200690.
- Sznol M, Chen L. Antagonist antibodies to PD-1 and B7-H1 (PD-L1) in the treatment of advanced human cancer–response. Clin Cancer Res. 2013;19(19):5542. doi:10.1158/1078-0432.CCR-13-2234.
- Xia Y, Medeiros LJ, Young KH. Immune checkpoint blockade: releasing the brake towards hematological malignancies. Blood Rev. 2016;30(3):189–200. doi:10.1016/j.blre.2015.11.003.
- Gianchecchi E, Delfino DV, Fierabracci A. Recent insights into the role of the PD-1/PD-L1 pathway in immunological tolerance and autoimmunity. Autoimmun Rev. 2013;12(11):1091–1100. doi:10.1016/j.autrev.2013.05.003.
- Francisco LM, Sage PT, Sharpe AH. The PD-1 pathway in tolerance and autoimmunity. Immunol Rev. 2010;236(1):219–242. doi:10.1111/j.1600-065X.2010.00923.x.
- Patsoukis N, Brown J, Petkova V, Liu F, Li L, Boussiotis VA. Selective effects of PD-1 on Akt and Ras pathways regulate molecular components of the cell cycle and inhibit T cell proliferation. Sci Signal. 2012;5(230):ra46. doi:10.1126/scisignal.2002796.
- Getts DR, Turley DM, Smith CE, Harp CT, McCarthy D, Feeney EM, Getts MT, Martin AJ, Luo X, Terry RL, et al. Tolerance induced by apoptotic antigen-coupled leukocytes is induced by PD-L1+ and IL-10-producing splenic macrophages and maintained by T regulatory cells. J Immunol. 2011;187(5):2405–2417. doi:10.4049/jimmunol.1004175.
- Wilcox RA, Feldman AL, Wada DA, Yang -Z-Z, Comfere NI, Dong H, Kwon ED, Novak AJ, Markovic SN, Pittelkow MR, et al. B7-H1 (PD-L1, CD274) suppresses host immunity in T-cell lymphoproliferative disorders. Blood. 2009;114(10):2149–2158. doi:10.1182/blood-2009-04-216671.
- Andorsky DJ, Yamada RE, Said J, Pinkus GS, Betting DJ, Timmerman JM. Programmed death ligand 1 is expressed by non-hodgkin lymphomas and inhibits the activity of tumor-associated T cells. Clin Cancer Res. 2011;17(13):4232–4244. doi:10.1158/1078-0432.CCR-10-2660.
- Butte MJ, Keir ME, Phamduy TB, Sharpe AH, Freeman GJ. Programmed death-1 ligand 1 interacts specifically with the B7-1 costimulatory molecule to inhibit T cell responses. Immunity. 2007;27(1):111–122. doi:10.1016/j.immuni.2007.05.016.
- Tsushima F, Yao S, Shin T, Flies A, Flies S, Xu H, Tamada K, Pardoll DM, Chen L. Interaction between B7-H1 and PD-1 determines initiation and reversal of T-cell anergy. Blood. 2007;110(1):180–185. doi:10.1182/blood-2006-11-060087.
- Benson DM Jr., Bakan CE, Mishra A, Hofmeister CC, Efebera Y, Becknell B, Baiocchi RA, Zhang J, Yu J, Smith MK, et al. The PD-1/PD-L1 axis modulates the natural killer cell versus multiple myeloma effect: a therapeutic target for CT-011, a novel monoclonal anti-PD-1 antibody. Blood. 2010;116(13):2286–2294. doi:10.1182/blood-2010-02-271874.
- Yang ZZ, Novak AJ, Stenson MJ, Witzig TE, Ansell SM. Intratumoral CD4+CD25+ regulatory T-cell-mediated suppression of infiltrating CD4+ T cells in B-cell non-Hodgkin lymphoma. Blood. 2006;107(9):3639–3646. doi:10.1182/blood-2005-08-3376.
- Ansell SM, Lesokhin AM, Borrello I, Halwani A, Scott EC, Gutierrez M, Schuster SJ, Millenson MM, Cattry D, Freeman GJ, et al. PD-1 blockade with nivolumab in relapsed or refractory Hodgkin’s lymphoma. N Engl J Med. 2015;372(4):311–319. doi:10.1056/NEJMoa1411087.
- Manson G, Herbaux C, Brice P, Bouabdallah K, Stamatoullas A, Schiano J-M, Ghesquieres H, Dercle L, Houot R. Prolonged remissions after anti-PD-1 discontinuation in patients with Hodgkin lymphoma. Blood. 2018;131(25):2856–2859. doi:10.1182/blood-2018-03-841262.
- Xu-Monette ZY, Zhou J, Young KH. PD-1 expression and clinical PD-1 blockade in B-cell lymphomas. Blood. 2018;131(1):68–83. doi:10.1182/blood-2017-07-740993.
- Chan TS, Khong PL, Kwong YL. Pembrolizumab for relapsed anaplastic large cell lymphoma after allogeneic haematopoietic stem cell transplantation: efficacy and safety. Ann Hematol. 2016;95(11):1913–1915. doi:10.1007/s00277-016-2764-1.
- Rigaud C, Abbou S, Minard-Colin V, Geoerger B, Scoazec JY, Vassal G, Jaff N, Heuberger L, Valteau-Couanet D, Brugieres L. Efficacy of nivolumab in a patient with systemic refractory ALK+ anaplastic large cell lymphoma. Pediatr Blood Cancer. 2018;65(4). doi:10.1002/pbc.26902.
- Hebart H, Lang P, Woessmann W. Nivolumab for refractory anaplastic large cell lymphoma: a case report. Ann Intern Med. 2016;165(8):607–608. doi:10.7326/L16-0037.
- Song Y, Li Z, Xue W, Zhang M. Predictive biomarkers for PD-1 and PD-L1 immune checkpoint blockade therapy. Immuno. 2019;11(6):515–529. doi:10.2217/imt-2018-0173.
- Goodman AM, Piccioni D, Kato S, Boichard A, Wang H-Y, Frampton G, Lippman SM, Connelly C, Fabrizio D, Miller V, et al. Prevalence of PDL1 amplification and preliminary response to immune checkpoint blockade in solid tumors. JAMA Oncolo. 2018;4(9):1237–1244. doi:10.1001/jamaoncol.2018.1701.
- da Silva PB, Real JM, Ferreira LRP, Esteves GH, Brito FDN, Baiocchi OCG. Soluble PD-1 and PD-L1 as potential biomarkers for classical Hodgkin lymphoma. Hematol Oncol. 2018;36(4):709–712. doi:10.1002/hon.v36.4.
- Kollmann D, Ignatova D, Jedamzik J, Chang Y-T, Jomrich G, Baierl A, Kazakov D, Michal M, French LE, Hoetzenecker W, et al. PD-L1 expression is an independent predictor of favorable outcome in patients with localized esophageal adenocarcinoma. Oncoimmunology. 2018;7(6):e1435226. doi:10.1080/2162402X.2018.1435226.
- Kollmann D, Ignatova D, Jedamzik J, Chang Y-T, Jomrich G, Paireder M, Kristo I, Kazakov D, Michal M, Cozzio A, et al. Expression of programmed cell death protein 1 by tumor-infiltrating lymphocytes and tumor cells is associated with advanced tumor stage in patients with esophageal adenocarcinoma. Ann Surg Oncol. 2017;24(9):2698–2706. doi:10.1245/s10434-017-5858-7.
- Kollmann D, Schweiger T, Schwarz S, Ignatova D, Chang Y-T, Lewik G, Schoppmann SF, Hoetzenecker W, Klepetko W, Guenova E, et al. PD1-positive tumor-infiltrating lymphocytes are associated with poor clinical outcome after pulmonary metastasectomy for colorectal cancer. Oncoimmunology. 2017;6(9):e1331194. doi:10.1080/2162402X.2017.1331194.
- Taube JM, Young GD, McMiller TL, Chen S, Salas JT, Pritchard TS, Xu H, Meeker AK, Fan J, Cheadle C, et al. Differential expression of immune-regulatory genes associated with PD-L1 display in melanoma: implications for PD-1 pathway blockade. Clin Cancer Res. 2015;21(17):3969–3976. doi:10.1158/1078-0432.CCR-15-0244.
- Grigg C, Rizvi NA. PD-L1 biomarker testing for non-small cell lung cancer: truth or fiction? J Immunother Cancer. 2016;4(1):48. doi:10.1186/s40425-016-0153-x.
- Haque S, Yellu M, Randhawa J, Hashemi-Sadraei N. Profile of pembrolizumab in the treatment of head and neck squamous cell carcinoma: design development and place in therapy. Drug Des Devel Ther. 2017;11:2537–2549. doi:10.2147/DDDT.S119537.
- Nguyen GH, Olson LC, Magro CM. Upregulation of inhibitory signaling receptor programmed death marker-1 (PD-1) in disease evolution from cutaneous lymphoid dyscrasias to mycosis fungoides and sezary’s syndrome. Ann Diagn Pathol. 2017;28:54–59. doi:10.1016/j.anndiagpath.2017.02.003.
- Cetinozman F, Jansen PM, Vermeer MH, Willemze R. Differential expression of programmed death-1 (PD-1) in sezary syndrome and mycosis fungoides. Arch Dermatol. 2012;148(12):1379–1385. doi:10.1001/archdermatol.2012.2089.
- Samimi S, Benoit B, Evans K, Wherry EJ, Showe L, Wysocka M, Rook AH. Increased programmed death-1 expression on CD4+ T cells in cutaneous T-cell lymphoma: implications for immune suppression. Arch Dermatol. 2010;146(12):1382–1388. doi:10.1001/archdermatol.2010.200.
- Trautinger F, Eder J, Assaf C, Bagot M, Cozzio A, Dummer R, Gniadecki R, Klemke C-D, Ortiz-Romero PL, Papadavid E, et al. European organisation for research and treatment of cancer consensus recommendations for the treatment of mycosis fungoides/sezary syndrome - update 2017. Eur J Cancer. 2017;77:57–74. doi:10.1016/j.ejca.2017.02.027.
- Clark RA, Chong BF, Mirchandani N, Yamanaka K-I, Murphy GF, Dowgiert RK, Kupper TS. A novel method for the isolation of skin resident T cells from normal and diseased human skin. J Invest Dermatol. 2006;126(5):1059–1070. doi:10.1038/sj.jid.5700199.
- Watanabe R, Gehad A, Yang C, Scott LL, Teague JE, Schlapbach C, Elco CP3, Huang V1, Matos TR4, Kupper TS, et al. Human skin is protected by four functionally and phenotypically discrete populations of resident and recirculating memory T cells. Sci Transl Med. 2015;7(279):279ra39. doi: 10.1126/scitranslmed.3010302.
- Brooks AE. Skin-resident CD4+ T cells express NK receptors: lessons from skin pathologies. Cytometry A. 2014;85(10):827–829. doi:10.1002/cyto.a.v85.10.
- Bagot M, Moretta A, Sivori S, Biassoni R, Cantoni C, Bottino C, Boumsell L, Bensussan A. CD4(+) cutaneous T-cell lymphoma cells express the p140-killer cell immunoglobulin-like receptor. Blood. 2001;97(5):1388–1391. doi:10.1182/blood.V97.5.1388.
- Sicard H, Bonnafous C, Morel A, Bagot M, Bensussan A, Marie-Cardine A. A novel targeted immunotherapy for CTCL is on its way: anti-KIR3DL2 mAb IPH4102 is potent and safe in non-clinical studies. Oncoimmunology. 2015;4(9):e1022306. doi:10.1080/2162402X.2015.1022306.
- Guenova E, Watanabe R, Teague JE, Desimone JA, Jiang Y, Dowlatshahi M, Schlapbach C, Schaekel K, Rook AH, Tawa M, et al. TH2 cytokines from malignant cells suppress TH1 responses and enforce a global TH2 bias in leukemic cutaneous T-cell lymphoma. Clin Cancer Res. 2013;19(14):3755–3763. doi:10.1158/1078-0432.CCR-12-3488.
- Scarisbrick JJ, Hodak E, Bagot M, Stranzenbach R, Stadler R, Ortiz-Romero PL, Papadavid E, Evison F, Knobler R, Quaglino P, et al. Blood classification and blood response criteria in mycosis fungoides and sezary syndrome using flow cytometry: recommendations from the EORTC cutaneous lymphoma task force. Eur J Cancer. 2018;93:47–56. doi:10.1016/j.ejca.2018.01.076.
- Geskin LJ, Viragova S, Stolz DB, Fuschiotti P. Interleukin-13 is overexpressed in cutaneous T-cell lymphoma cells and regulates their proliferation. Blood. 2015;125(18):2798–2805. doi:10.1182/blood-2014-07-590398.
- Krejsgaard T, Lindahl LM, Mongan NP, Wasik MA, Litvinov IV, Iversen L, Langhoff E, Woetmann A, Odum N. Malignant inflammation in cutaneous T-cell lymphoma-a hostile takeover. Semin Immunopathol. 2017;39(3):269–282. doi:10.1007/s00281-016-0594-9.
- Nielsen M, Nissen MH, Gerwien J, Zocca M-B, Rasmussen HM, Nakajima K, Röpke C, Geisler C, Kaltoft K, Ødum N, et al. Spontaneous interleukin-5 production in cutaneous T-cell lymphoma lines is mediated by constitutively activated stat3. Blood. 2002;99(3):973–977. doi:10.1182/blood.V99.3.973.
- Okazaki T, Chikuma S, Iwai Y, Fagarasan S, Honjo T. A rheostat for immune responses: the unique properties of PD-1 and their advantages for clinical application. Nat Immunol. 2013;14(12):1212–1218. doi:10.1038/ni.2762.
- Guenova E, Hoetzenecker W, Rozati S, Levesque MP, Dummer R, Cozzio A. Novel therapies for cutaneous T-cell lymphoma: what does the future hold? Expert Opin Investig Drugs. 2014;23(4):457–467. doi:10.1517/13543784.2014.876407.
- Saulite I, Guenova E, Hoetzenecker W. Adverse reactions of antibody-therapy for primary cutaneous lymphomas: rituximab, brentuximab vedotin, alemtuzumab, and mogamulizumab. Curr Probl Dermatol. 2018;53:70–81.
- Bobrowicz M, Zagozdzon R, Domagala J, Vasconcelos-Berg R, Guenova E, Winiarska M. Monoclonal antibodies in dermatooncology-state of the art and future perspectives. Cancers (Basel). 2019;11(10):1420. doi:10.3390/cancers11101420.
- DeSimone JA, Sodha P, Ignatova D, Dummer R, Cozzio A, Guenova E. Recent advances in primary cutaneous T-cell lymphoma. Curr Opin Oncol. 2015;27(2):128–133. doi:10.1097/CCO.0000000000000161.
- Ramelyte E, Dummer R, Guenova E. Investigative drugs for the treatment of cutaneous T-cell lymphomas (CTCL): an update. Expert Opin Investig Drugs. 2019;28(9):799–809. doi:10.1080/13543784.2019.1654995.
- Rubio Gonzalez B, Zain J, Rosen ST, Querfeld C. Tumor microenvironment in mycosis fungoides and sezary syndrome. Curr Opin Oncol. 2016;28(1):88–96. doi:10.1097/CCO.0000000000000243.
- Torrealba MP, Manfrere KC, Miyashiro DR, Lima JF, Oliveira M, Pereira NZ, Cury-Martins J, Pereira J, Duarte AJS, Sato MN, et al. Chronic activation profile of circulating CD8+ T cells in Sézary syndrome. Oncotarget. 2018;9(3):3497–3506. doi:10.18632/oncotarget.v9i3.
- Querfeld C, Leung S, Myskowski PL, Curran SA, Goldman DA, Heller G, Wu X, Kil SH, Sharma S, Finn KJ, et al. Primary T cells from cutaneous T-cell lymphoma skin explants display an exhausted immune checkpoint profile. Cancer Immunol Res. 2018;6(8):900–909. doi:10.1158/2326-6066.CIR-17-0270.
- Dulos J, Carven GJ, van Boxtel SJ, Evers S, Driessen-Engels LJA, Hobo W, Gorecka MA, de Haan AFJ, Mulders P, Punt CJA, et al. PD-1 blockade augments Th1 and Th17 and suppresses Th2 responses in peripheral blood from patients with prostate and advanced melanoma cancer. J Immunother. 2012;35(2):169–178. doi:10.1097/CJI.0b013e318247a4e7.
- Wang S, Zhu X, Xu Y, Zhang D, Li Y, Tao Y, Piao H, Li D, Du M. Programmed cell death-1 (PD-1) and T-cell immunoglobulin mucin-3 (Tim-3) regulate CD4+ T cells to induce type 2 helper T cell (Th2) bias at the maternal-fetal interface. Hum Reprod. 2016;31(4):700–711. doi:10.1093/humrep/dew019.
- Pauken KE, Wherry EJ. Overcoming T cell exhaustion in infection and cancer. Trends Immunol. 2015;36(4):265–276. doi:10.1016/j.it.2015.02.008.
- Armand P. Immune checkpoint blockade in hematologic malignancies. Blood. 2015;125(22):3393–3400. doi:10.1182/blood-2015-02-567453.
- Anzengruber F, Ignatova D, Schlaepfer T, Chang Y-T, French LE, Pascolo S, Contassot E, Bobrowicz M, Hoetzenecker W, Guenova E, et al. Divergent LAG-3 versus BTLA, TIGIT, and FCRL3 expression in sezary syndrome. Leuk Lymphoma. 2019;60(8):1899–1907. doi:10.1080/10428194.2018.1564827.
- Khodadoust MS, Rook A, Porcu P, Foss FM, Moskowitz AJ, Shustov A, Shanbhag S, Sokol L, Fling SP, Ramchurren N et al. Pembrolizumab in Relapsed and Refractory Mycosis Fungoides and Sezary Syndrome: A Multicenter Phase II Study. Journal of clinical oncology: official journal of the American Society of Clinical Oncology 2020; 38:20–8. doi:10.1200/JCO.19.01056.
- Wada DA, Wilcox RA, Harrington SM, Kwon ED, Ansell SM, Comfere NI. Programmed death 1 is expressed in cutaneous infiltrates of mycosis fungoides and sezary syndrome. Am J Hematol. 2011;86(3):325–327. doi:10.1002/ajh.v86.3.
- Carney DN, Bunn PA Jr., Schechter GP, Gazdar AF. Lymphocyte transformation in patients with cutaneous T-cell lymphomas. Int J Cancer. 1980;26:535–542. doi:10.1002/ijc.2910260503.
- Meech SJ, Edelson R, Walsh P, Norris DA, Duke RC. Reversible resistance to apoptosis in cutaneous T cell lymphoma. Ann N Y Acad Sci. 2001;941:46–58. doi:10.1111/j.1749-6632.2001.tb03710.x.
- Kantekure K, Yang Y, Raghunath P, Schaffer A, Woetmann A, Zhang Q, Odum N, Wasik M. Expression patterns of the immunosuppressive proteins PD-1/CD279 and PD-L1/CD274 at different stages of cutaneous T-cell lymphoma/mycosis fungoides. Am J Dermatopathol. 2012;34(1):126–128. doi:10.1097/DAD.0b013e31821c35cb.
- Kleffel S, Posch C, Barthel SR, Mueller H, Schlapbach C, Guenova E, Elco C, Lee N, Juneja V, Zhan Q, et al. Melanoma cell-intrinsic PD-1 receptor functions promote tumor growth. Cell. 2015;162(6):1242–1256. doi:10.1016/j.cell.2015.08.052.
- Clark CA, Gupta HB, Sareddy G, Pandeswara S, Lao S, Yuan B, Drerup JM, Padron A, Conejo-Garcia J, Murthy K, et al. Tumor-intrinsic PD-L1 signals regulate cell growth, pathogenesis, and autophagy in ovarian cancer and melanoma. Cancer Res. 2016;76(23):6964–6974. doi:10.1158/0008-5472.CAN-16-0258.
- Witzig TE, Reeder C, Han JJ, LaPlant B, Stenson M, Tun HW, Macon W, Ansell SM, Habermann TM, Inwards DJ, et al. The mTORC1 inhibitor everolimus has antitumor activity in vitro and produces tumor responses in patients with relapsed T-cell lymphoma. Blood. 2015;126(3):328–335. doi:10.1182/blood-2015-02-629543.
- Guenova E, Metzler G, Hoetzenecker W, Berneburg M, Rocken M. Classic mediterranean kaposi’s sarcoma regression with sirolimus treatment. Arch Dermatol. 2008;144(5):692–693. doi:10.1001/archderm.144.5.692.
- Nguyen LT, Ohashi PS. Clinical blockade of PD1 and LAG3–potential mechanisms of action. Nat Rev Immunolo. 2015;15(1):45–56. doi:10.1038/nri3790.
- Taube JM, Klein A, Brahmer JR, Xu H, Pan X, Kim JH, Chen L, Pardoll DM, Topalian SL, Anders RA, et al. Association of PD-1, PD-1 ligands, and other features of the tumor immune microenvironment with response to anti-PD-1 therapy. Clin Cancer Res. 2014;20(19):5064–5074. doi:10.1158/1078-0432.CCR-13-3271.
- Blank CU, Haanen JB, Ribas A, Schumacher TN. CANCER IMMUNOLOGY. The “cancer immunogram”. Science. 2016;352(6286):658–660. doi:10.1126/science.aaf2834.
- Wartewig T, Kurgyis Z, Keppler S, Pechloff K, Hameister E, Öllinger R, Maresch R, Buch T, Steiger K, Winter C, et al. PD-1 is a haploinsufficient suppressor of T cell lymphomagenesis. Nature. 2017;552(7683):121–125. doi:10.1038/nature24649.
- Zheng YJ, Lee A, Pincus L, Ho W, Vujic M, Ortiz-Urda S. Cutaneous CD56(+) T-cell lymphoma developing during pembrolizumab treatment for metastatic melanoma. JAAD Case Rep. 2018;4(6):540–542. doi:10.1016/j.jdcr.2018.01.016.
- Zhong X, Tumang JR, Gao W, Bai C, Rothstein TL. PD-L2 expression extends beyond dendritic cells/macrophages to B1 cells enriched for V(H)11/V(H)12 and phosphatidylcholine binding. Eur J Immunol. 2007;37:2405–2410. doi:10.1002/eji.200737461.
- Shi M, Roemer MG, Chapuy B, Liao X, Sun H, Pinkus GS, Shipp MA, Freeman GJ, Rodig SJ. Expression of programmed cell death 1 ligand 2 (PD-L2) is a distinguishing feature of primary mediastinal (thymic) large B-cell lymphoma and associated with PDCD1LG2 copy gain. Am J Surg Pathol. 2014;38(12):1715–1723. doi:10.1097/PAS.0000000000000297.
- Yearley JH, Gibson C, Yu N, Moon C, Murphy E, Juco J, Lunceford J, Cheng J, Chow LQM, Seiwert TY, et al. PD-L2 expression in human tumors: relevance to anti-PD-1 therapy in cancer. Clin Cancer Res. 2017;23(12):3158–3167. doi:10.1158/1078-0432.CCR-16-1761.
- Chen L, Diao L, Yang Y, Yi X, Rodriguez BL, Li Y, Villalobos PA, Cascone T, Liu X, Tan L, et al. CD38-mediated immunosuppression as a mechanism of tumor cell escape from PD-1/PD-L1 blockade. Cancer Discov. 2018;8(9):1156–1175. doi:10.1158/2159-8290.CD-17-1033.