
ABSTRACT
Omics analyses often result in dozens to hundreds of potential targets, requiring validation for their biological relevance. Current high-throughput functional investigation methods are frequently labor-intensive, expensive, and display low reproducibility. The Immune Co-Culture Cell Microarray (ICCM) is a formalin-fixed paraffin-embedded cell block microarray based on co-cultures of patient-derived tumor-infiltrating lymphocytes and their autologous melanoma cells. Each ICCM slide represents the same experiment and can be stained using standard immunohistochemistry and immunofluorescence techniques. Functional dynamics assessment of both proteins and microRNAs using ICCM stained slides demonstrated similar findings to flow cytometry assays and to previously published patient-derived biopsy reports.
Introduction
Recent technological advances have turned omics analyses, such as RNA sequencing, proteomics, and metabolomics, into common methodologies in cancer immunology research. The use of omics has led to highly important discoveries of potential resistance mechanisms to immune checkpoint inhibitors and to adoptive cell therapy,Citation1–Citation3 but also create a new set of challenges. These analyses often result in a dozen to hundreds of potential targets, turning the efforts to validate their biological and clinical relevance into a complex task. This is especially true when combining multi-layer omics since the differences between the transcribed and translated levels may lead to different and even contradicting results – further complicating the validation processes.Citation4,Citation5 Moreover, omics are usually a “snap-shot” measurement, which lack the ability to delineate the functional dynamics or temporal expression patterns of a given target over time. Validation is therefore performed in individual, labor-intensive, low-reproducibility and non-easily transferrable cellular assays and platforms. There is a need for a validation tool capable of conducting reproducible, functional immunological investigations in a high-throughput manner.
Common immunological functional assays capable of investigating the dynamics of target expression are based on both cytometry and microscopy methods. Flow cytometry is commonly used for multiple target detection but is limited by overlapping emission wave-lengths of fluorescence markers,Citation6 low reproducibility, and cost- and labor-intensiveness of repeated experiments.Citation7 Newly developed high-throughput tools, roboticCitation7 or on mass cytometry,Citation6,Citation8,Citation9 are powerful but require expensive equipment and highly trained personnel, hence are unavailable to standard laboratories. Moreover, these tools do not discern complex cell morphology parameters or readily differentiate different subcellular localizations. Microscopy-based technologies acquire morphological and subcellular localization data, and intra-vital video microscopy is able to demonstrate molecular and cellular dynamics.Citation10 However, like flow cytometry, each experiment is set up independently, thereby reducing reproducibility.
The aim of this study was to develop a feasible tool, based on standard laboratory means that enables high-throughput functional and morphological investigation and validation of potential immunological cancer targets during a prolonged lymphocyte–melanoma interaction – the Immune Co-Culture Cell Microarray (ICCM).
Materials and methods
Supplementary Table 1 details the antibodies that were used for the purpose of this study.
Cells
Tumor-infiltrating lymphocytes (TILs) and their autologous melanoma cells were extracted from metastatic lesions of patients as part of the adoptive cell therapy (ACT) program of the Ella Lemelbaum Institute for Immuno-Oncology, Sheba Medical Center (Institutional Review Board approval no. 3518/2004), as previously described.Citation11 After extraction from the tumor, TILs were cultivated for 14–21 days in a complete medium which was composed of RPMI-1640 supplemented with 2 mM L-Glutamine, 10% human AB serum, 25 mM HEPES, 10 ug/ml gentamicin, and 5.5 × 10 − 5 M 2-mercaptoethanol, (Biological Industries, Israel) with 3,000 IU/mL rhIL-2 (Proleukin, Chiron B.V., The Netherlands). After this period, TILs were expanded by a Rapid Expansion ProtocolCitation12 and were divided into vials. Each vial contained 150 × 106 TILs. Melanoma cells were cultivated for 5–10 passages in T2 medium which were composed of RPMI-1640 medium supplemented with 10% fetal bovine serum, 100 µg/mL Pen/Sterp, 2 mM L-Glutamine, 25 mM HEPES and 1 mM sodium pyruvate (Biological Industries, Israel). Melanoma cells were then divided into vials containing 20 × 106 cells each. Both the TILs and the melanoma vials were kept frozen in liquid nitrogen.
Both melanoma cells and TILs were tested for mycoplasma before freezing using a PCR detection kit with internal control (EZ-PCR™ Mycoplasma Detection Kit, Biological Industries, Israel).
In this study, two autologous patient-derived pairs of melanoma cells and TILs were used: ACT study number 131 (composed of 75% CD8+ T-Cells) and ACT Study number 14 (composed of 90% CD8+ T-Cells). In comparison to ACT-131, ACT-14 are characterized by higher expression levels of the inhibitory protein CD33 and a lower expression level of the activation marker CD69. There are no differences between ACT-131 and ACT-14 in the expression of the following markers: CD25 – a baseline marker for T suppressive cells; CD27, CD28, and GITR – co-activating molecules; CXCR3 and CCR4 – major chemokine receptors; and IL-7Ra and CD62 L – homeostatic molecules (Table S2). Differences in killing abilities between these pairs were assessed using fluorometric killing assay, as described below.
New vials of melanoma cells and TILs from each autologous pair were thawed specifically for the purpose of this study. After thawing, both cell types were incubated at 37°C in a humidified atmosphere of 5% CO2 in air for a few recovery days prior to co-culturing. Melanoma cells were maintained in the same T2-based medium as described above. The presence of melanoma cells was verified using flow cytometry expression assessment of MCSP, GP100, and MART1. TILs were thawed and cultivated in the same complete medium as described above. The presence of TILs was verified using flow cytometry expression assessment for CD3 and CD8. Cell type authentication processes were conducted before freezing and immediately after both cells types were thawed.
Killing assay
The effectiveness of TILs cytotoxic ability was assessed using the CytoTox-ONE™ (Promega, USA) kit, which assesses the number of nonviable cells by measuring the release of lactate dehydrogenase (LDH) from cells with a damaged membrane. The released LDH is coupled with an enzymatic assay that results in a fluorescent product. The amount of fluorescence produced is proportional to the number of lysed cells.
The CytoTox-ONE™ kit was used according to the manufacturer guidelines. Briefly, autologous TILs and melanoma were co-incubated in a 384-well plate for 24 h. Effector to target (E/T) ratio was 2.5/1 for System-131 and 5:1 for System-14. Each co-culture was sextuplicate (six repetitions). After 24 h of incubation, the plate was centrifuged and 25 μl of conditioned medium was extracted from each assay well and transferred into a black 384-well plate. To generate the control wells containing maximum released LDH, 0.5ul of Lysis Solution were added to the designated control wells. 25 μl of CytoTox-ONE™ Reagent was added to the medium present in each well in the black plate. The plate was gently stirred for 30 s and was incubated at 22°C for 10 min in a dark incubator. After this incubation period, 12.5 μl of Stop Solution was added. The plate was gently stirred for 10 s and was inserted into the GloMax plate reader (Promega, USA). Fluorescence excitation wavelength was 560 nm and emission wavelength were 590 nm.
The killing assay was repeated six times. Killing assay results were analyzed using non-paired, two-tailed T-Test via STATA Version 15.1 for Mac (Texas, USA).
Assessment of interferon-γ (IFN-γ) production
Assessment of IFN-γ production in TILs-melanoma cells co-culture was previously described.Citation13 Briefly, autologous TILs and melanoma cells were co-cultured in a 96-well plate for 24 h. Effector to target (E/T) ratio was 2/1 for both System-131 and System-14. After 24 h, the plate was centrifuged and 50 μl of conditioned medium was extracted from each assay well and tested with IFN-γ Duo-Set (R&D Systems, USA). For assessment of IFN-γ production, cells were co-cultured in eight repetitions.
Production of cell blocks
The full protocol describing the cell block preparation process was uploaded to Protocols.io (dx.doi.org/10.17504/protocols.io.6pnhdme). A 0.5% agarose and phosphate-buffered saline (PBS) gel was prepared. A small amount of the gel was put in a bath which was pre-warmed to 65°C. For the ACT-131, 20 million TIL and 20 million melanoma cells were harvested, enabling an effector-to-target (E/T) ratio of 1:1. For ACT-14, 80 million TIL and 20 million melanoma cells were harvested (E/T 4:1). After co-culturing for the indicated time points, non-adherent cells (TILs and some melanoma cells) were harvested using mechanical pipettation and transferred into a 15 mL tube. Immediately afterward, the adherent melanoma cells were harvested using Trypsin and were added to the same 15 mL tube containing their respective non-adherent cells. These combined harvested cells were washed with cold PBS and were then re-suspended with a 15 mL fixing solution composed of 4% formaldehyde and 96% ethanol in a 1:1 mix ratio. Cells were kept in this fixing solution for 5 min at room temperature and were then centrifuged for 5 min at 1200 g. After centrifugation, cells were re-suspended with PBS and transferred into a single well in a 96-wells U-shaped plate (Cellstar, Sigma-Aldrich, USA). The plate was centrifuged for 5 min at 500 g and the supernatant was discarded. The pellet was re-suspended with 100-200microL of the melted agarose gel and was transferred into a new flat-bottom 96-wells plate, creating a unified cell block structure. This flat-bottom plate was cooled at 4°C for 45 min in order to solidify the gel. After cooling, the gel was gently squeezed out of the plate using a sterile scalpel (blade #15) and was put in a cassette. The gel-containing cassettes were kept in a 4% formaldehyde solution for 24 h and were then embedded in paraffin using the Tissue-Tek VIP Tissue Processor (Electron microscopy science, USA). Each block was sectioned for an H&E stain which was assessed by a senior pathologist (IB) for quality control.
Construction of microarray
The technique of microarray construction was previously described.Citation14 Briefly, double 2-mm diameter cylinder cores were punched out from each of the cell blocks. Double cores were used as a mean of overcoming possible heterogeneity, as previous reports on tumor samples demonstrated that a near 95% concordance between a double core microarray and the original tumor samples.Citation15,Citation16 In addition to co-culture representative cores, the ICCM also included control cores. As a biological control, melanoma cells from each autologous pair were cultivated, harvested, and fixed into cell blocks without co-culturing with T cells. Double cores from these melanoma-only blocks were implanted in the ICCM. As a technical control (e.g., to assess nonspecific staining) cores from normal human liver and muscle tissue were also implanted into the ICCM block. All cores were deposited into a recipient block using Manual Tissue Arrayer MTA-1 (Beecher Instruments Inc., USA). Post-construction, a 4 μm slide was sectioned and hematoxylin & eosin (H&E) stained and were assessed for quality control by a senior pathologist (IB).
Immunohistochemistry (IHC) and microRNA stains
The ICCM block was sectioned to 4.5 μm thick slides. The slides were dewaxed and rehydrated prior to the initiation of staining procedures.
IHC stains against HLA-A, MNF-116, MITF, IDO-1, and PDL-1+ SOX10 (double stain) were conducted manually, according to standard procedure, on 4.5 μm thick slides. IHC stain against CD3 was conducted using a fully automated protocol on a Benchmark module (Ventana Medical Systems Inc., USA). A CC1 Standard Benchmark XT pretreatment for antigen retrieval (Ventana Medical Systems Inc., USA) was selected for CD3 stain. Detection was performed with iView DAB Detection Kit (Ventana Medical Systems Inc., USA) and counterstaining with Hematoxylin (Ventana Medical Systems Inc., USA).
Micro-RNA (miR) stains were conducted by double labeling of 6 μm thick sections from microarray block by hsa-miR-21 in situ hybridization and CD3 immunohistochemistry. This labeling was calibrated to a fully automated protocol (Discovery Ultra, Ventana Medical Systems, USA). All reagents, antibodies (except for anti-CD3), and substrates were purchased from Roche Diagnostics for Discovery Ultra automation. Briefly, sections were submitted to a Discovery Ultra CC1 pretreatment of 24 min. Discovery peroxidase inhibition treatment was performed for 8 min. Tissue sections were hybridized with denaturized 80 nM double-DIG labeled LNA miR-21 probe (Exiqon, Denmark) at 53° C for 2 h. The immunological detection was done with HRP-conjugated anti-digoxigenin. Discovery Amplification was performed by Discovery AMP TSA BF kit and followed by Discovery anti-BF HRP, 32 min each. Enzymatic reaction was developed with Discovery Silver kit. After antibody denaturation (CC2, 100° C, 8 min) we proceed to CD3 immunostaining (antibody detailed in Table S1, 1:100, 32 min, 37° C). As second antibody, we selected OmniMap anti-Rabbit HRP for 16 min. HRP enzymatic reaction was developed with Discovery Purple Kit for 32 min. Counterstaining and post counterstaining were performed with Hematoxylin II and Bluing reagent, respectively. After the run on the automated stainer was completed, the slides were dehydrated in graded ethanols (70%, 96%, and 100%). Before cover-slipping, sections were cleared in Xylene and mounted with Entellan.
Immunofluorescence (IF)
The full IF protocol was uploaded to Protocols.io (dx.doi.org/10.17504/protocols.io.6pqhdmw).
The ICCM block was sectioned to 4.5 μm thick slides. Prior to IF stain, slides were heated for 2 h at 37° C. Deparaffinization was performed using xylene and ethanol, and slides were afterward washed with a PBS-T (PBS and 0.05% Tween-20). Antigen retrieval was conducted using immersion of slides in Citrate buffer (pH 6.0) and microwave heating. After cool-down, slides were washed with PBS-T and incubated for 1 h at room temperature with a blocking solution containing 3% BSA. Post blocking, slides were washed with PBS-T. 200microL mix of primary antibodies against Caspase-3 and CD45 (Table 1) in 2% BSA were added. A control slide designated for secondary antibodies only stained was covered with 200microL of 2% BSA only. Slides were covered with paraffin stickers and incubated overnight at 4° C. The following day, slides were washed with PBS-T, 200microL mix of secondary antibodies against mouse and rabbit in PBS-T were added, slide was covered with paraffin stickers and incubated for 1 h in room temperature. Post-incubation, slides were washed, and DAPI stain was added (Hoechst stain in PBS, 1:2000, Sigma-Aldrich, USA). Slides were washed, and coverslips were glued using Fluoromount Aqueous Mounting fluid (Sigma-Aldrich, USA).
Flow cytometry (FC)
The FC protocol used for the cell authentication process was previously described.Citation17 The FC assessment of cell death was in accordance with that protocol. Cells used for FC cell death assessment were collected from the very same co-cultures used for cell block preparation, in order to avoid inter-experimental bias. After cells were harvested from the co-cultures into pre-fixation cell suspension, a sample was collected from each suspension into FC-designated tubes. Cells were washed using FACS buffer (PBS, 0.02% sodium azide, 0.5% BSA) and were incubated on ice for 30 min with a solution containing FACS buffer and anti-CD3 antibodies (Table 1). Following incubation, cells were centrifuged for 5 min in 500 g 4°C, washed and re-suspended in 200 µl FACS buffer. 7-AAD solution (Biolegend, USA) was used for the detection of dead cells, in accordance with manufacturer recommendations.
Manual gating of side-forward scatter plot was used to exclude cellular debris. Additional manual gating excluded CD3+ cells, leaving only melanoma cells as 7-AAD+. FC experiments were performed using a FACSCalibur® instrument (BD Biosciences, USA) and data analysis using FlowJo® software (Tree Star Inc., USA version 7.6.5).
Trends comparison between FC and IF results were conducted via Excel (Microsoft, USA, version 16.27). Raw measurements were standardized according to the background, which was defined as the measurement in the “melanoma only” samples.
Digital image analyses
IHC Stained slides were scanned using Aperio VERSA Digital Pathology Scanner (Leica Biosystems, Wetzlar, Germany). Images were acquired using ImageScope software (Leica Biosystems).
IF Images were acquired using the confocal microscope Leica TCS SP5 (Leica Biosystems, Germany). After filtration for background staining using slides stained with secondary-only antibodies, no further filtration or change of microscope setting was done through-out the image capture process. Images were export into TIFF files using the Fiji softwareCitation18 (version 1.51 W), with no change of filters. Caspase-3 fluorescence intensity was calculated using the Imaris software (Oxford Instruments, UK, version 9.3.0).
Results
The ICCM included two different autologous TILs-Melanoma cell pairs, ACT#131 and ACT#14. During a 24-h co-culture, ACT#131 TILs demonstrated higher melanoma killing effectiveness and IFN-γ production in comparison to that of ACT #14 TILs (, p = .0048 and p = .0005, respectively). In line with the inferior killing effectiveness, ACT#14 displays a more exhausted phenotype than ACT#131, evident by higher PD-1 and CEACAM1 expression ()). This inherent difference in the killing ability between a proficient killing pair (PKP, ACT #131) and a mild killing pair (MKP, ACT #14) enabled a comparison of expression dynamics between two functionally distinct systems. In order to demonstrate dynamics over-time, co-cultures of each autologous pair were mixed on the same day and were harvested at the same five time-points: a few minutes after mixing (0 h), and after co-culturing for 6, 24, 48 and 72 h. As a biological control, cultures containing only melanoma cells were added. Immediately after harvesting, cells were turned into a formalin-fixed paraffin-embedded (FFPE) cell block and the ICCM was constructed. Overall, the ICCM was composed of 10 co-cultures and two melanoma-only controls ()).
Figure 1. Comparison of killing ability, IFN-γ production and exhaustion profile between Proficient Killing Pair (PKP, ACT#131) Mild Killing Pair (MKP, ACT#14). (a) The killing ability was assessed by a 24-h autologous Fluorometric killing assay which was repeated for six times. The Proficient Killing Pair had an Effector to Target (E/T) ratio of 2.5/1 in all six repetitions, while the Mild Killing Pair had an E/T of 5/1. The graph demonstrated a better mean killing percentage (marked as X) of the Proficient Killing Pair, despite the lower E/T ratio. (b) IFN-γ production was assessed by ELISA which were conducted on medium taken from eight repetitions of 24-h autologous co-cultures. The same E/T ratio of 2:1 was used for both pairs. (c) Expression analysis of PD-1 and CEACAM1 with flow cytometry of Proficient Killing Pair and Mild Killing Pair. Secondary antibodies served as background levels. **Denotes p < .01. ***Denotes p < .001, circles denote a result from a single experiment
Figure 2. Immune Co-Culture Cell Microarray (ICCM) map and validation processes. (a) A Map of the ICCM block; (b) MNF-116 stain, an epithelial marker, demonstrating negative stains among morphologically intact TILs and melanoma cells in an entire core; (c) CD3 membranal stain, positive in TILs and negative in melanoma cells; (d) MITF nuclear stain, positive in melanoma cells and negative in TILs; (e) HMB45 cytoplasmic and membrane stain positive in melanoma cells combined with DAPI nuclear stain (blue); (f) HMB45 cytoplasmic and membrane stain (positive in melanoma cells) combined with CD8 membranal stain (positive in TILs) and DAPI (blue). Overall, this figure demonstrated no nonspecific stains, supporting the specificity of the ICCM
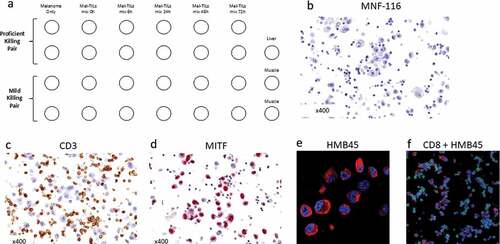
Validation of the ICCM preparation technique was conducted to rule out possible protein distortion due to the ICCM preparation process. Such potential distortion may lead to a nonspecific binding of antibodies and hence to nonspecific stains. ICCM slides were stained for different cell markers. The pan-cytokeratin epitope (MNF-116) antibody, an epithelial cell marker, did not stain cells in the ICCM ()). The lymphocytic marker CD3 stained only TILs ()), while the melanoma markers MITF and HMB-45 stained only melanoma cells (). These findings disaffirm the concern of nonspecific binding. also demonstrated no impairment in cellular morphology.
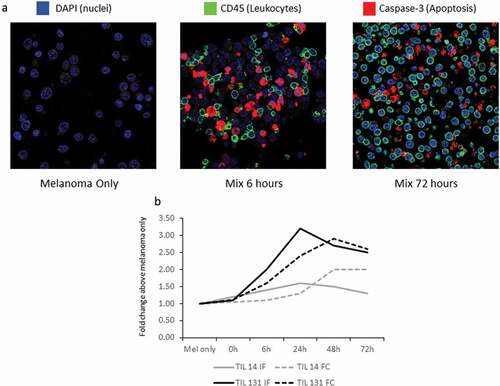
The ability of the ICCM to properly demonstrate the functional dynamics of a known biological process was assessed and compared to other common methodologies. First, we sought to demonstrate differences in IFN-γ production between the two autologous pairs, similar to the results which were described above. The expression level of HLA-A was used ss a surrogate to IFN-γ production, since HLA-A (as other MHC class I molecules) expression among melanoma cells is up-regulated by IFN-γCitation19 Despite similar HLA-A expression among the melanoma only samples of both pairs, the PKP induced a stronger up-regulation of HLA-A, representing higher IFN-γ production (Figure S1). Next, T-Cell induced cytotoxicity was assessed. This cytotoxicity is manifested by target cell apoptosis, which is mediated by Caspase-3 up-regulation and activation.Citation20 Immuno-fluorescence (IF) stain against Caspase-3 (Cas-3) was conducted, demonstrating increased expression over-time only among target melanoma cells ()). In order to validate these findings, the dynamics of Cas-3 expression in an IF-stained ICCM slide were compared to the dynamics in cellular death according to the conventional technique of FC with 7-AminoActinomycin D staining (7-AAD).Citation21 The FC assay was conducted on cells harvested from the same co-cultures used for the ICCM construction. Cas-3 is a major early driver of apoptosis and one of the initiators of the “death cascade” in living cells,Citation22 whereas 7-AAD is a chemical compound with a high affinity to DNA, which will stain only dying or dead cells. Cas-3 activation eventually results in 7-AAD binding. ) demonstrates that Cas-3 fluorescence intensity in the ICCM slide was higher in PKP in comparison to MKP, as expected due to PKP’s higher killing effectiveness. In both pairs, Cas-3 fluorescence intensity peaked at 24 h. 7-AAD fluorescence intensity among melanoma cells (CD3−) was higher in PKP in comparison to MKP and peaked at 48 h – emphasizing the time-lag between initiation of apoptosis and actual cell death. The intensities of both stains subsided at 72 h, as the killing ability of both pairs was exhausted. Overall, these findings support the ability of the ICCM to properly represent functional dynamics.
Figure 3. ICCM representation of TILs cytotoxic activity. (a) Immuno-fluorescence (IF) stain of ICCM time-points of Proficient Killing Pair (PKP), acquired at zoom x630: Blue – DAPI, green – CD45 (a leukocyte marker), and red – Caspase-3 (Cas-3, a marker of immune-induced apoptosis). This IF staining reflects very low melanoma cell death in the melanoma-only sample and high melanoma cell death after co-culturing. Lymphocytes do not express signs of cell death. (b) Dynamics in mean fluorescence intensity of Cas-3 IF stain and of 7-Aminoactinomycin D (7-AAD) flow cytometry (FC). Y-axis represents fold-change in mean fluorescence intensity, which was calculated as the mean fluorescence intensity in a certain time point divided by the mean fluorescence intensity of “melanoma only” sample. Cells from the exact same co-cultures were used for the FC and for construction of the ICCM block. Cas-3, a protease that initiates apoptosis, peaked 24 h since killing assay initiation. 7-AAD, which binds to dying or dead cells, peaked at 48 h, after Cas-3 activity resulted in cellular death
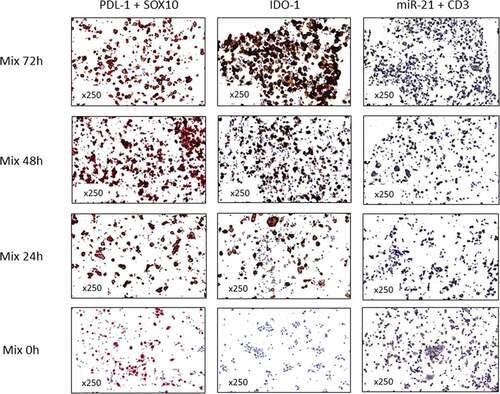
Functional dynamics was demonstrated not only for targets related to immune-mediated cell death but also for targets related to immune resistance. Potential differences in expression dynamics of Programmed Cell Death Ligand (PDL)-1, Indoleamine-pyrrole 2,3-DiOxygenase (IDO)-1 and microRNA (miR)-21 were assessed using different stains. Both pairs did not constitutively express PDL-1 and IDO-1 and no expression was detected immediately after mixing with TILs (). In contrast, miR-21 was constitutively expressed among melanoma cells (). After co-culturing with TILs for 24 h, a clear up-regulation was observed in all three targets. miR-21 stain concentrated around melanoma nuclei, as expected from a miR, while PDL-1 and IDO-1 were detected in melanoma cells both on cytoplasmatic vesicles and on the membranes (). All three targets remained highly up-regulated in the 48 h and 72-h time-points (Figure S2). Similar dynamics were observed in both the PKP and the MKP samples (Figure S3). These findings demonstrated that ICCM can discern between the functional dynamics of multiple different immune-related molecules and represent their location within intra-cellular compartments.
Figure 4. Dynamics in functional expression of interferon-γ-induced miR and immune checkpoints in Mild Killing Pair (MKP). The left panel shows a double stain of PDL-1 in brown and SOX10 (melanoma marker) in red. Middle panel shows an IDO-1 single stain in brown. Right panel shows a double stain of miR-21 in silver and CD3 in purple. This figure demonstrated no constitutive expression of PDL-1 and IDO-1 while some constitutive expression of miR-21 could be observed. Exposure to TILs-secreted interferon-γ resulted in increased expression of all molecules over 24 h. The time points are indicated in the figure. Stains were conducted on three different ICCM slides
Discussion
This study demonstrated that the ICCM can properly represent biological interactions between lymphocytes and cancer cells while avoiding inter-experimental biases. The ICCM was composed of cells that were thawed and cultivated together. Hence, different ICCM slides represent the same experiment, without the technical variations that accompany multiple passages and re-freezing/re-thawing cycles. Different stains of different ICCM slides demonstrated immune checkpoints expression patterns which were similar to those reported from patient-derived biopsies. Aggressive melanoma metastasesCitation23 and those with low intra-tumoral CD8+ T-Cell infiltrationCitation24 were reported to express low levels of both PDL-1 and IDO-1. Metastatic melanoma expression of PDL-1 and IDO-1 was correlated with TILs activity and was up-regulated after exposure to IFN-γCitation25 The same functional dynamic was demonstrated by the ICCM, as melanoma-only and 0-h melanoma cells were not stained by either PDL-1 or IDO-1 antibodies, but from the 24-h time point and beyond – almost all melanoma cells were intensively stained by both PDL-1 and IDO-1 antibodies. In contrast, melanoma-only and 0-h melanoma cells were stained by miR-21 probes, as expected from an important regulator of melanoma cell proliferation and invasion.Citation26 A previously published miR microarray analysis demonstrated that IFN-γ up-regulates miR-21 expression in melanoma cell-lines after 24 h of exposureCitation27 – similar to the staining dynamics in the ICCM slide. Together with the proper representation of lymphocytes killing ability by the Cas-3 stains, these findings support the reliability and reproducibility of the ICCM – features which are essential to a validation tool.
The different suppressive and exhaustion phenotypes of the PKP and MKP, as demonstrated by CD33, PD-1 and CEACAM1 flow cytometry assays, corresponded with the differences in killing activity and IFN-γ which were demonstrated by the ICCM stains. TILs suppressive activity may also be induced by CD8+ regulatory T-Cells (CD8+CD25+FoxP3+).Citation28,Citation29 These suppressive and exhaustion characteristics should be taken into consideration when constructing an ICCM assessed, since deliberately choosing cellular systems with different suppression abilities may help to further delineate the functional dynamics of an investigated target.
As the cost of omics is still fairly expensive, the additional cost of validation processes using robotics and mass cytometry may significantly limit the research capacity of a standard immunology lab. ICCM production and construction are easily learned (the link to the full protocol is attached to the Materials and Methods section) and is based on non-expensive, commonly available reagents. The ICCM can be constructed according to a lab’s specific need or project and any cell type or co-culture may be used. Its construction processes can be completed within days, without the need for continuous supply of cells for multiple different assays – which is especially important when dealing with sparse patient-derived cells. Additionally, since the ICCM blocks are paraffin embedded, the blocks and slides can be stored for years and easily transferred between laboratories. Each block can be sectioned to hundreds of slides and IHC/IF techniques are similar to those used for standard FFPE slides. Slides may be stained in any standard laboratory, and multiple slides may be stained simultaneously. These characteristics support the feasibility and high-throughput ability of the ICCM.
The ICCM has several limitations. After the cells were fixed, the experimental settings cannot be changed. For example, investigation of the functional dynamics of potential target between TILs and melanoma cells after PD-1 blockade will require construction of a new ICCM. Another limitation is the limited number of different targets that can be stained of the same slide using standard IF and IHC protocols. This can be overcome by the commonly growing use of multiplex staining protocolsCitation30,Citation31 or by staining multiple slides – since each slide represents the same experiment. A third limitation is the fact that prior to the ICCM construction process, cells may undergo cultivation under different settings or for prolong periods. For example, after extraction from the patient’s body, TILs undergo a Rapid Expansion Process while melanoma cells do not. The potential implications of prior cultivation settings are inherited in every co-culture in-vitro study model and must be taken into account when results are interpreted.
In conclusion, the ICCM is a feasible tool for a reliable validation of the biological relevance of proteins and miRs and also provides the target location within specific intra-cellular compartments. In the age of multi-omics, such a feasible, high-throughput tool may substantially aid in the functional investigation and validation of immune-related targets.
Disclosure of Potential Conflicts of Interest
The authors report no conflict of interests.
Supplemental Material
Download ()Acknowledgments
The authors would like to thank Haya and Nehemia Lemelbaum for their generous and continuous support. We would also like to thank Dr. Miriam Shaharabany and Dr. Yael Zilberstein from Tel Aviv University for their assistant in digital image analyses. This work is part of PhD thesis of E.N.B.
Supplementary material
Supplemental data for this article can be accessed on the publisher’s website.
Additional information
Funding
References
- Ascierto ML, Makohon-Moore A, Lipson EJ, Taube JM, McMiller TL, Berger AE, Fan J, Kaunitz GJ, Cottrell TR, Kohutek ZA, et al. Transcriptional mechanisms of resistance to anti-PD-1 therapy. Clin Cancer Res. 2017;23(12):3168–8. doi:10.1158/1078-0432.CCR-17-0270.
- Hugo W, Zaretsky JM, Sun L, Song C, Moreno BH, Hu-Lieskovan S, Berent-Maoz B, Pang J, Chmielowski B, Cherry G, et al. Genomic and transcriptomic features of response to anti-PD-1 therapy in metastatic melanoma. Cell. 2016;165(1):35–44. doi:10.1016/j.cell.2016.02.065.
- Lauss M, Donia M, Harbst K, Andersen R, Mitra S, Rosengren F, Salim M, Vallon-Christersson J, Törngren T, Kvist A, et al. Mutational and putative neoantigen load predict clinical benefit of adoptive T cell therapy in melanoma. Nat Commun. 2017;8(1):1738. doi:10.1038/s41467-017-01460-0.
- Misra BB, Langefeld C, Olivier M, Cox LA. Integrated omics: tools, advances and future approaches. J. Mol. Endocrinol. 2019;62(1):R21.
- Pinu FR, Beale DJ, Paten AM, Kouremenos K, Swarup S, Schirra HJ, Wishart D. Systems biology and multi-omics integration: viewpoints from the metabolomics research community. Metabolites. 2019;9(4):76. doi:10.3390/metabo9040076.
- Lun ATL, Richard AC, Marioni JC. Testing for differential abundance in mass cytometry data. Nat Methods. 2017;14(7):707–709. doi:10.1038/nmeth.4295.
- Zuleta IA, Aranda-Diaz A, Li H, El-Samad H. Dynamic characterization of growth and gene expression using high-throughput automated flow cytometry. Nat Methods. 2014;11(4):443–448. doi:10.1038/nmeth.2879.
- Angelo M, Bendall SC, Finck R, Hale MB, Hitzman C, Borowsky AD, Levenson RM, Lowe JB, Liu SD, Zhao S, et al. Multiplexed ion beam imaging of human breast tumors. Nat Med. 2014;20(4):436–442. doi:10.1038/nm.3488.
- Schapiro D, Jackson HW, Raghuraman S, Fischer JR, Zanotelli VRT, Schulz D, Giesen C, Catena R, Varga Z, Bodenmiller B, et al. histoCAT: analysis of cell phenotypes and interactions in multiplex image cytometry data. Nat Methods. 2017;14(9):873–876. doi:10.1038/nmeth.4391.
- Johnston ST, Shah ET, Chopin LK, Sean McElwain DL, Simpson MJ. Estimating cell diffusivity and cell proliferation rate by interpreting IncuCyte ZOOM assay data using the Fisher-Kolmogorov model. BMC Syst Biol. 2015;9:38. doi:10.1186/s12918-015-0182-y.
- Besser MJ, Shapira-Frommer R, Treves AJ, Zippel D, Itzhaki O, Hershkovitz L, Levy D, Kubi A, Hovav E, Chermoshniuk N, et al. Clinical responses in a phase II study using adoptive transfer of short-term cultured tumor infiltration lymphocytes in metastatic melanoma patients. Clin Cancer Res. 2010;16(9):2646–2655. doi:10.1158/1078-0432.CCR-10-0041.
- Dudley ME, Wunderlich JR, Shelton TE, Even J, Rosenberg SA. Generation of tumor-infiltrating lymphocyte cultures for use in adoptive transfer therapy for melanoma patients. J Immunother. 2003;26(4):332–342. doi:10.1097/00002371-200307000-00005.
- Ortenberg R, Sapir Y, Raz L, Hershkovitz L, Ben Arav A, Sapoznik S, Barshack I, Avivi C, Berkun Y, Besser MJ, et al. Novel immunotherapy for malignant melanoma with a monoclonal antibody that blocks CEACAM1 homophilic interactions. Mol Cancer Ther. 2012;11(6):1300–1310. doi:10.1158/1535-7163.MCT-11-0526.
- Galore-Haskel G, Baruch EN, Berg AL, Barshack I, Zilinsky I, Avivi C, Besser MJ, Schachter J, Markel G. Histopathological expression analysis of intercellular adhesion molecule 1 (ICAM-1) along development and progression of human melanoma. Oncotarget. 2017;8(59):99580–99586. doi:10.18632/oncotarget.v8i59.
- Hoos A, Cordon-Cardo C. Tissue microarray profiling of cancer specimens and cell lines: opportunities and limitations. Lab Invest. 2001;81(10):1331–1338. doi:10.1038/labinvest.3780347.
- La Spada A, Baronchelli S, Ottoboni L, Ruffini F, Martino G, Convertino N, Ntai A, Steiner T, Biunno I, De Blasio A, et al. Cell line macroarray: an alternative high-throughput platform to analyze hiPSC lines. J Histochem Cytochem: Off J Histochem Soc. 2016;64(12):739–751. doi:10.1369/0022155416673969.
- Markel G, Ortenberg R, Seidman R, Sapoznik S, Koren-Morag N, Besser MJ, Bar J, Shapira R, Kubi A, Nardini G, et al. Systemic dysregulation of CEACAM1 in melanoma patients. Cancer Immunol Immunother: CII. 2010;59(2):215–230. doi:10.1007/s00262-009-0740-5.
- Schindelin J, Arganda-Carreras I, Frise E, Kaynig V, Longair M, Pietzsch T, Preibisch S, Rueden C, Saalfeld S, Schmid B, et al. Fiji: an open-source platform for biological-image analysis. Nat Methods. 2012;9(7):676–682. doi:10.1038/nmeth.2019.
- Browne SK, Roesser JR, Zhu SZ, Ginder GD. Differential IFN-gamma stimulation of HLA-A gene expression through CRM-1-dependent nuclear RNA export. J Immunol. 2006;177(12):8612–8619. doi:10.4049/jimmunol.177.12.8612.
- Dai C, Krantz SB. Interferon gamma induces upregulation and activation of caspases 1, 3, and 8 to produce apoptosis in human erythroid progenitor cells. Blood. 1999;93(10):3309–3316. doi:10.1182/blood.V93.10.3309.410k04_3309_3316.
- Lecoeur H, Fevrier M, Garcia S, Riviere Y, Gougeon ML. A novel flow cytometric assay for quantitation and multiparametric characterization of cell-mediated cytotoxicity. J Immunol Methods. 2001;253(1–2):177–187. doi:10.1016/S0022-1759(01)00359-3.
- Nicholson DW, Ali A, Thornberry NA, Vaillancourt JP, Ding CK, Gallant M, Gareau Y, Griffin PR, Labelle M, Lazebnik YA, et al. Identification and inhibition of the ICE/CED-3 protease necessary for mammalian apoptosis. Nature. 1995;376(6535):37–43. doi:10.1038/376037a0.
- Fortis SP, Mahaira LG, Anastasopoulou EA, Voutsas IF, Perez SA, Baxevanis CN. Immune profiling of melanoma tumors reflecting aggressiveness in a preclinical model. Cancer Immunol Immunother: CII. 2017;66(12):1631–1642. doi:10.1007/s00262-017-2056-1.
- Gide TN, Allanson BM, Menzies AM, Ferguson PM, Madore J, Saw RPM, Thompson JF, Long GV, Wilmott JS, Scolyer RA, et al. Inter- and intrapatient heterogeneity of indoleamine 2,3-dioxygenase expression in primary and metastatic melanoma cells and the tumour microenvironment. Histopathology. 2019;74(6):817–828. doi:10.1111/his.2019.74.issue-6.
- Spranger S, Spaapen RM, Zha Y, Williams J, Meng Y, Ha TT, Gajewski TF. Up-regulation of PD-L1, IDO, and Tregs in the melanoma tumor microenvironment is driven by CD8+ T cells. Sci Transl Med. 2013;5(200):200ra116. doi:10.1126/scitranslmed.3006504.
- Melnik BC. MiR-21: an environmental driver of malignant melanoma? J Transl Med. 2015;13(1):202. doi:10.1186/s12967-015-0570-5.
- Reinsbach S, Nazarov PV, Philippidou D, Schmitt M, Wienecke-Baldacchino A, Muller A, Vallar L, Behrmann I, Kreis S. Dynamic regulation of microRNA expression following interferon-gamma-induced gene transcription. RNA Biol. 2012;9(7):978–989. doi:10.4161/rna.20494.
- Smith TRF, Kumar V. Revival of CD8+ Treg–mediated suppression. Trends Immunol. 2008;29(7):337–342. doi:10.1016/j.it.2008.04.002.
- Zhang S, Wu M, Wang F. Immune regulation by CD8+ Treg cells: novel possibilities for anticancer immunotherapy. Cell Mol Immunol. 2018;15(9):805–807. doi:10.1038/cmi.2018.170.
- Bolognesi MM, Manzoni M, Scalia CR, Zannella S, Bosisio FM, Faretta M, Cattoretti G. Multiplex staining by sequential immunostaining and antibody removal on routine tissue sections. J Histochem Cytochem: Off J Histochem Soc. 2017;65(8):431–444. doi:10.1369/0022155417719419.
- Sorrelle N, Ganguly D, Dominguez ATA, Zhang, Y., Huang, H., Dahal, L.N., Burton, N., Ziemys, A., Brekken, R.A. Improved multiplex immunohistochemistry for immune microenvironment evaluation of mouse formalin-fixed, paraffin-embedded tissues. J Immunol. 2018;202:ji1800878.