
ABSTRACT
Cytotoxic T cells and regulatory T cells play a crucial role in the outcome of cancer patients. Besides the density of these cells, it was shown recently that the spatial distribution is equally important. Here, we specifically analyzed the spatial distribution of these T cell subtypes at the epithelial–stromal interface in a rectal cancer cohort and its relevance for prognosis. We studied a cohort of 191 patients with advanced rectal cancer treated by radiochemotherapy (RCT). Tissue microarrays were immunohistochemical double-stained by FoxP3+ and CD+. Cell densities were analyzed in the stromal and epithelial compartment. Additionally, an image analysis software calculated the distances of lymphocytes to the epithelial–stromal interface (ESI). CD8+ and FoxP3+ cell counts decreased clearly after RCT with the decrease of FoxP3+ being more pronounced than of CD8+ cells. In the invasive front, short distances of the ESI to CD8+ and to FoxP3+ cells were associated with improved overall survival. Cell counts in the stromal compartment had no influence on prognosis. No correlation between stromal and epithelial lymphocyte densities was observed. The distance of epithelial–stromal interface to CD8+ and FoxP3+ cells was more accurate in predicting prognosis in the stromal compartment of rectal cancer patients than mere cell counts and could thereby be means of better stratifying patients for therapy. This observation will have to be validated in future prospective studies with regard to other tumor entities and its implications for the responsiveness of tumors to new therapeutic modalities.
Introduction
In recent years, several studies have revealed the importance of the human immune system in cancer patients and especially for the success of anti-cancer therapies. Many studies showed that high CD8+ T cell counts in various solid tumors, e.g. renal cell carcinoma,Citation1 urethral carcinoma,Citation2 as well as colorectal carcinoma,Citation3 are associated with a favorable prognosis. The opposite was reported to be true for high Treg counts.Citation4-Citation6 Regulatory T cells are important mediators of tumoral immune-escape because of their ability to suppress cytotoxic T cells, natural killer cells, B cells and antigen-presenting cells by cell-to-cell contact or secretion of inhibitory cytokines.Citation7
On the other hand, their immunosuppressive function plays a key role in self-tolerance and prevention of autoimmune diseases. FoxP3-positive cells are associated with a favorable prognosis in patients with advanced rectal cancer.Citation3 In our recent study we could show that not only the count of FoxP3+ and CD8+ T cells is of major importance but also the spatial distribution of the tumor-infiltrating lymphocytes (TILs).Citation3 We hypothesize that cell-to-cell distances of TILs can serve as a surrogate marker of their functional activity and interaction and therefore can predict prognosis of cancer patients more accurately than mere cell counts.
In this previous study, we observed that FoxP3+ lymphocytes showed a propensity to be located close to the epithelial–stromal interface (ESI). Therefore, in this current study, we analyzed the distribution of FoxP3+ and CD8+ T cells with special regard to the tumor areas where the neoplastic epithelial compartment is in direct contact with the non-neoplastic stromal compartment of the tumor and correlated these findings with different clinical characteristics and outcome-parameters. The aim of our study was to assess, whether or not the arrangement of the TILs at the epithelial–stromal interface plays a role in the prognosis of patients with advanced colorectal cancer. Accordingly, Carstens et al.Citation8 described that the spatial distribution of cytotoxic T cells in close proximity to cancer cells does influence the overall survival (OS) favorably in pancreatic cancer patients. Additionally, it was demonstrated in a recent study, that high CD8+ cell counts with tight contact to cancer cells in liver metastasis are valid markers of better OS of patients with colorectal cancer.Citation9 Considering these promising results, analysis of the spatial distribution in the proximity to the epithelial–stromal interface seems to be an even more valuable approach than to perform a mere quantification of infiltrating inflammatory cells for investigating the prognostic role of intratumoral lymphocytes.
Materials and methods
Selection of patients
The patient cohort included 191 patients with advanced colorectal cancer. All patients were treated at the University hospital of Erlangen between 2006 and 2013. Prior to a total mesorectal excision (TME), all patients received radiochemotherapy (RCT). Fifty-nine pre-RCT biopsies and 144 post-RCT resections were available, in 26 patients both pre-RCT biopsies and post-RCT resections could be assessed. In a previous study, this cohort was already analyzed for FoxP3+ and CD8+ densities and cell-to-cell distances both in the stromal and intraepithelial compartment. The number of individuals in the different groups varies greatly. The reason is that cell density samples without or with rare positive cells can be included in mere quantitative analysis however no distances can be calculated. Therefore, the overlap between the recent study and the current study is limited. The previous study had a follow-up of 3.6 years, the current study has now 5.1 years follow-up.
Data on tumor staging were retrieved from the patient’s files and classified according to the International Union Against Cancer (IUCC) from 2009. The use of formalin-fixed paraffin-embedded material from the Archive of the Institute of Pathology was approved by the Ethics Committee of the Friedrich-Alexander-University of Erlangen-Nuremberg on 24 January 2005, waiving the need for consent for using the existing archived material. Written informed consent was obtained ‘front door’ from all patients allowing the collection of their tissue and clinical data.
Treatment protocol
All patients received neoadjuvant radiochemotherapy treatment including 50.4 Gy overall dose fractured into 28 sessions of 1.8 Gy and chemotherapy including 5-FU for an overall period of 38 days.Citation10,Citation11 The tumor response was surveilled 8 weeks post-RCT with proctoscopy, CT of the pelvis, endorectal ultrasound and clinical examination. Thereafter, tumor resection was performed in 191 patients. In 10 patients of whom only the biopsy was available, complete remission was achieved without surgical intervention. These patients underwent further adjuvant chemotherapy including 5-FU. All patients were followed up regularly.
Tissue microarray & immunohistochemistry
Formalin-fixed, paraffin-embedded material of all patients (59 pre-RCT biopsies and 144 post-RCT tumor resections) was collected, of which Tissue Micro Arrays (TMA) with cores of 2 mm diameter were prepared. Per patient, two TMA punches were taken from the biopsies, and two TMA punches from each the invasive front and the tumor center of the resection specimens. One section of the whole tissue block was cut and placed on a slide. On the slide positions of the invasive front and tumor center were marked by a pathologist. These positions were transferred to the tissue block and the areas were punched and transferred to a recipient block to form the tissue microarray. To assess TIL immunohistochemical double stainings were performed with anti-FoxP3- and anti-CD8-specific antibodies. Briefly, sections were deparaffinized and rehydrated and antigen retrieval was performed in a steam cooker for 5 min in citrate buffer.Citation12,Citation13 Overnight incubation with the FoxP3-specific antibody (1:100, Ab20034, abcam, Cambridge, United Kingdom) was followed by detection with a Polymer-Kit (Fa Zytomed POLAP-100) according to the manufacturer`s instructions and Fast Red as a chromogen. Thereafter, the CD8-specific antibody was added for 60 min (1:50, M7103, Agilent, Santa Clara, CA United States). Detection was performed with the Polymer-Kit and Fast Blue as a chromogen.Citation3
Analysis of the slides
Stained slides were scanned with a high throughput scanner (Zeiss, Mirax MIDI Scan, Göttingen, Germany) at a magnification of 1:200 and transferred to a PC. For analyzing the slides, an image analysis software was used (Biomas, Erlangen, Germany).Citation3,Citation12,Citation13 The outlines of the epithelial–stromal interface and TMA spot were marked and the size was calculated (mm2). Cells were counted solely in the stromal compartment. Cell counts of the epithelial compartment were obtained from a previous study.Citation3 Counting and allocation of FoxP3+- and CD8+ T cells were performed semiautomatically. On average per patient and region, 448 FoxP3+ cells and 434 CD8+ cells were analyzed. A constant area of tissue was analyzed and counted cell numbers and calculated ESI to cell distances varied greatly between samples. Cell densities were calculated by the software per analyzed area.
Stromal–epithelial interface to cell distances
Using the image analysis software average cell-to-cell-distances as well as cell-to-epithelial–stromal interface (ESI) and ESI-to-cell-distances in the stromal compartment of the slides were calculated automatically by the software (µm) and transferred to Excel sheets. These distances include FoxP3+-ESI, ESI-FoxP3+, CD8+-ESI and ESI-CD8+. The marked epithelial–stromal interface consists of a high number of points connected to form a line. These points in the line had a distance from point to point of 0.3 µm to 5 µm with an average of 2 µm. Distances of lymphocytes to ESI were calculated as the distance from each lymphocyte to the nearest point in the ESI and the length of the calculated lines was approximately perpendicular to the ESI. The ESI to lymphocyte distance was calculated as the distance of each point of the epithelial–stromal interface to the next lymphocyte.
Statistics
Statistical analysis was performed using SPSS (version 21, IBM Inc., Chicago Illinois, USA) as well as Excel (Microsoft, Redmond, Washington, USA). Survival analysis was performed using Kaplan–Meier curves and Log Rang test with regard to tumor-specific survival, overall survival and metastasis-free survival. Nonlinear regression was analyzed by curve estimation regression model. The cutoff value for the definition of subgroups was either zero or the median. Unpaired t-test and Mann–Whitney U test were applied to compare cell counts in the different groups when appropriate.
Results
We studied a cohort of 191 patients with advanced rectal cancer including tissue of pre-therapy biopsy samples from 59 patients and post-radiochemotherapy (RCT) tumor resection from 144 patients. In 26 cases both biopsies and tumor resections were available. Clinical characteristics of the cohort are summarized in . The median follow-up time was 5.3 years. The cohort had a five-year recurrence free-survival of 66.8%. The five-year overall survival was 68.3% (). The most important prognostic factors were the M stage (p < .001) () and post-RCT regression grade (Dworak) (p = .006) (c). T- and N-stage, UICC stage, grading, age and sex were not clearly associated with outcome (p > .1) (Figure S1). For a more detailed topographic analysis, the tumor was additionally separated in a tumor center and the invasive front. Tissue blocks were used to construct TMA. The tumor center was derived from the central tumor region and invasive front was situated at the outer edges of the carcinomatous infiltrate where infiltrating the surrounding normal tissue. On the donor blocks, these regions were marked and punched tissue cores were inserted into the recipient block. Complete TMA spots with an area of 3.1 mm2 were analyzed (). Usually, two spots were analyzed per region and patient. The epithelial–stromal interface of the tumors was marked manually with the image analysis software (). Double-stainings for regulatory T cells (FoxP3+, nuclear staining) and cytotoxic T cells (CD8+, membranous staining) were performed. Distances between the epithelial–stromal interface and lymphocytes and vice versa were calculated for each individual lymphocyte separately ().
Table 1. Clinical characteristics
Figure 1. Clinical characteristics of the cohort and TMA samples: (a) Kaplan Meier plots of overall survival, recurrence-free survival and metastasis-free survival in the cohort. (b) Distant metastasis and overall survival. (c) Regression grade (Dworak) and overall survival. Tissue samples were processed into microarrays with a core diameter of 2 mm. (d) Here, an example of tissue derived from the center of a tumor is depicted. (e) The epithelial compartment of the tumor was marked manually using Biomas software. (f) Examples of CD8+ and FoxP3+ T-cells; TIL in proximity to the ESI. (g) Density of stromal TILs in different compartments. (h) Distances of ESI to TIL in different stromal compartments
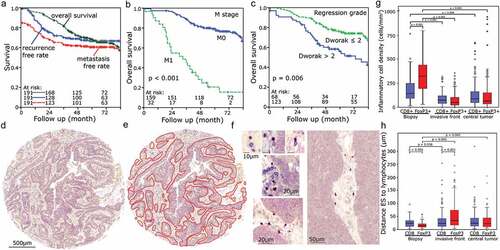
Distinctly more Fox3+ cells than CD8+ cells (p = .001) were present in the stromal compartment of pretherapeutic biopsies. Both types of lymphocytes decreased clearly (p < .009) in the posttherapeutic tumor resection in the center of the tumor as well as at the invasive front at the epithelial-stromal-interface. In both regions, there was no clear difference between FoxP3+ and CD8+ cell counts (). However, FoxP3+ lymphocytes in the pretherapeutic biopsies were noticeably closer to the ESI than CD8+ lymphocytes (p < .001, ). At the invasive front of posttherapeutic resections, distances of FoxP3+ cells to the ESI increased (p < .036) so that now CD8+ cells were distinctly closer to the ESI than FoxP3+ cells (p < .001). In the central tumor region, distances of both cell types to the ESI were similar (). Distributions of distances varied between different patients (Figure S2).
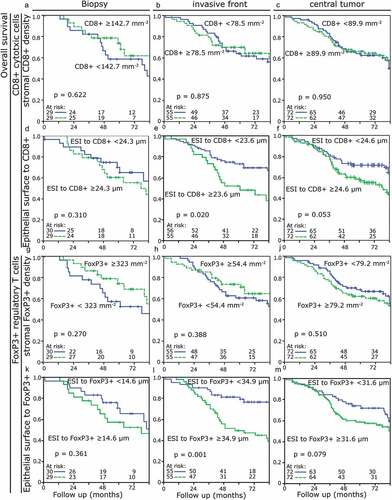
Neither CD8+ nor FoxP3+ lymphocyte density in the stromal compartment had an influence on overall survival in the pretherapeutic biopsies or the tumor resections (p > .270) ((a–c), (g–j)). Similarly, in the biopsy samples the distance of the ESI to the stromal lymphocytes was not prognostically relevant (). However, at the invasive front after therapy, short distances of ESI to stromal CD8+ cells were associated with a favorable prognosis with regard to overall survival (p = .020). Distances of ESI to stromal FoxP3+ cells were likewise prognostically relevant with short distances being associated with a better overall survival (p = .001). In the central region of the tumors, the distances did not reach prognostical significance (CD8+ p = .053; FoxP3+ p = .079). Short ESI to FoxP3+ cell distances in the invasive front had a clearly favorable prognostic value for recurrence-free (p = .027) and metastasis-free survival (p < .001) (Figure S3 and S4).
Figure 2. Kaplan-Meier-Plots for overall survival depending on the stromal TIL density and the stromal-located lymphocyte distances to the epithelial–stromal interface (ESI) in different compartments: (a) Density of CD8+ TIL in the biopsy. (b) Density of CD8+ TIL in the invasive front. (c) Density of CD8+ TIL in the central tumor area. (d) ESI to CD8+ distances in the biopsy. (e) ESI to CD8+ distances in the invasive front. (f) ESI to CD8+ distances in the central tumor area. (g) Density of FoxP3+ TIL in the biopsy. (h) Density of FoxP3+ TIL in the invasive front. (j) Density of FoxP3+ TIL in the central tumor area. (k) ESI to FoxP3+ distances in the biopsy. (l) ESI to FoxP3+ distances in the invasive front. (m) ESI to FoxP3+ distances in the central tumor area
Next, we assessed whether a relationship between the measured distances of TIL to the ESI and the TIL density in the invasive front samples existed. Doing so we found a quadratic relationship between ESI to TIL distances and density. A simulation for this relationship was done under the assumption that the stromal compartment has an average width of 250 µm. There is a weak correlation with the expected values, however, with substantial deviations (). We found no direct interrelation between ESI to FoxP3+ distances and cell density in the stromal or intraepithelial compartment. The same was true for CD8+ cells. Similarly, there was no correlation between stromal and intraepithelial cell densities, neither for FoxP3+ nor for CD8+ lymphocytes ().
Figure 3. Distances of ESI to TIL depending on their density in different tumor compartments: (a) Density of FoxP3+ TIL in the stroma and ESI to FoxP3+ TIL distance. (b) Density of intraepithelial FoxP3+ TIL and ESI to FoxP3+ TIL distance. (c) Density of CD8+ TIL in the stroma and ES to CD8+ TIL distance. (d) Density of intraepithelial CD8+ TIL and ESI to CD8+ TIL distance. (e) Intraepithelial vs stromal FoxP3+ density. (f) Intraepithelial vs stromal CD8+ density
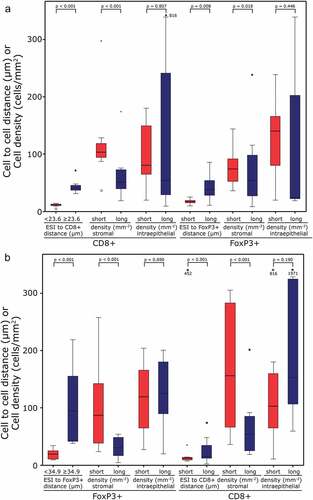
Thereafter, we analyzed whether cells of the group with short distances of the ESI to lymphocytes in the stromal compartment are associated with a denser lymphocytic infiltrate in the invasive front of the tumor (). Samples with short ESI to CD8+ lymphocyte distances (<23.6 µm) were characterized by accompanying high stromal CD8+ densities (p < .001). Additionally, ESI to FoxP3+ distances were short (p = .008), the stromal density of FoxP3+ cells was higher (p = .018) and intraepithelial CD8+ densities were similar when compared to long ESI to CD8+ distances (). Short distances of both CD8+ and FoxP3+ cells to the ESI were associated with high numbers of TIL (both FoxP3+ and CD8+, p < .001) in the stromal compartment. In contrast, in the intraepithelial compartment, no association of frequencies of FoxP3+ cells and stromal distances to the ESI was observed (). In samples of the biopsies and central tumor, the relation of the values was comparable to the invasive front (Figures S5 and S6).
Figure 4. Cell to cell distances and cell densities in the ESI to CD8+ and ESI to FoxP3+ samples of the invasive front: Cell to cell distances and cell densities in the samples with ESI to CD8+ < (short) or ≥23.6 µm (long); (a) Stromal and epithelial densities and distances are given for “short” and “long” groups. (b) Cell to cell distances and cell densities in the samples with ESI to FoxP3+ TIL distance < (short) or ≥34.9 µm (long); Stromal and epithelial densities and distances are given for “short” and “long” groups
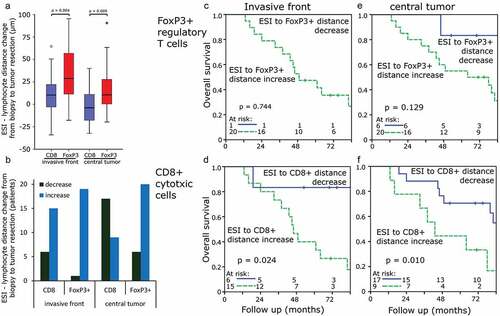
Due to the fact that ESI to FoxP3+ distances between biopsies and tumor resections varied greatly, the distance change of each sample was studied in cases with available paired probes. ESI to CD8+ distances increased mildly between biopsies and tumor resection at the invasive front (7.9 ± 28.9 µm) and decreased slightly between biopsy and the central tumor compartment (−3.1 ± 18.6 µm). ESI to FoxP3+ distance increased clearly in both the invasive front (37.8 ± 88.3 µm) and central tumor compartment (20.8 ± 35.9 µm) (). CD8+ cell to ESI distances increased in 71% (invasive front) and 35% (central tumor) of samples, respectively, and of FoxP3+ cell to ESI in 95% and 77%, respectively (). ESI to FoxP3+ cell distances showed a more pronounced increase between biopsy and tumor resection than ESI to CD8+ cell distances (p < .009). Cases with a decrease of ESI to CD8+ lymphocyte distances between biopsy and tumor resection as compared to cases with an increase of distances presented with an improved overall survival when assessing both the invasive front and tumor center () and recurrence-free survival with regard to the tumor center (Figure S7).
Figure 5. Changes in distances of ESI to TIL comparing biopsies and tumor resections: (a) ESI to TIL distance changes depending on the compartment [µm]. (b) Changes of ESI to TIL distance depending on the compartment [number of patients]. (c) Change of ESI to FoxP3+ TIL distance in the invasive front regarding overall survival. (d) Change of ESI to CD8+ TIL distance in the invasive front regarding overall survival. (e) Change of ESI to FoxP3+ TIL distance in the central tumor area regarding overall survival. (f) Change of ESI to CD8+ TIL distance in the central tumor area regarding overall survival
![Figure 5. Changes in distances of ESI to TIL comparing biopsies and tumor resections: (a) ESI to TIL distance changes depending on the compartment [µm]. (b) Changes of ESI to TIL distance depending on the compartment [number of patients]. (c) Change of ESI to FoxP3+ TIL distance in the invasive front regarding overall survival. (d) Change of ESI to CD8+ TIL distance in the invasive front regarding overall survival. (e) Change of ESI to FoxP3+ TIL distance in the central tumor area regarding overall survival. (f) Change of ESI to CD8+ TIL distance in the central tumor area regarding overall survival](/cms/asset/d9d8c897-0d89-4d9e-a2bf-961b5e2336fc/koni_a_1746149_f0005_oc.jpg)
Discussion
In the present study, we were able to show that the nearest distance of the epithelial–stromal interface (ESI) to tumor-infiltrating lymphocytes, particularly in the invasive front, is of greater prognostic value than the mere analysis of cell counts, with regard to CD8+ cytotoxic T cells as well as FoxP3+ Treg. For both cell types, short distances were associated with a favorable prognosis when compared to long distances. Strong proximity of ESI to the cytotoxic T cells was associated with high numbers of stromal CD8+ CTL and FoxP3+ Tregs in general, whereas no influence of the ESI to lymphocyte distances on cell counts in the intraepithelial compartment was found. In a previous study, pretherapeutic biopsies with high amounts of FoxP3+ cells were associated with a favorable overall survival in the stromal as well as in the intraepithelial compartment.Citation3 In the present study, we analyzed fewer patients than in the previous study. This may be the main reason for a lower statistical significance for the stromal cell densities in the pretherapeutic biopsies.
In our previous study on spatial distributions of FoxP3+ and CD8+ lymphocytes in rectal cancer, we noticed that tissue samples exist showing a conspicuously high number of stromal FoxP3+ lymphocytes very close to the epithelial–stromal interface.Citation3 To better understand the significance of this phenomenon we defined the epithelial–stromal interface in the tumor and used a computer-assisted approach to quantify the average lymphocytes to ESI and the ESI to lymphocytes distance. The average ESI to lymphocyte distance is low when TILs are located close to the ESI as the nearest distance of the respective ESI to the closest lymphocyte is measured. For calculating the lymphocyte to ESI distances, the nearest distance to an ESI is measured for each lymphocyte. If high numbers of lymphocytes are distributed throughout the stromal compartment, besides cells being in proximity of the ESI, a large number of TIL will be far apart from the ESI, thus obscuring the short distances of many TILs to the ESI and producing relatively high average values of TIL to ESI distances. Therefore, as an alternative approach overcoming this problem we used the ESI to lymphocyte distances, which best represents the finding of an accumulation of lymphocytes near the epithelial–stromal interface.
Spatial and morphological patterns of cancer and tumor-infiltrating inflammatory cells have attracted increasing attention in recent years.Citation8,Citation9,Citation14 In previous studies, we found that the spatial distribution of FoxP3+ and CD8+ cells is of high prognostic value.Citation3,Citation12 Additionally, we postulated that the spatial distribution of FoxP3+ and CD8+ cells may be indicative of the functional activity of these cells.Citation13 Here we show that especially the close proximity of FoxP3+ and CD8+ lymphocytes to the ESI in the stromal compartment is of positive predictive prognostic value. This might indicate that TIL distributed more randomly throughout the tumoral stroma are nonfunctional bystanders rather than mediators of an anti-tumoral immune-reaction. In contrast, a close association of TIL with the tumor cells may be a sign that these cells specifically recognize the cancer cells and mediate an anti-tumoral response.
No association of short ESI-TIL distances and a high density of TIL in the epithelial compartment was found. One could speculate that this indicates that TIL remains near the ESI because they lack the capacity to infiltrate into the epithelial compartment of the tumor. However, an alternative explanation, which would be supported by the improved prognosis associated with short ESI-TIL distances, could be the functional activity of TIL at the interface of the cancer cells and its surrounding stroma. Accordingly, CD8+ lymphocytes located at this interface might act as cytotoxic effector cells killing cancer cells and FoxP3+ cells might down-regulate inflammatory stimuli promoting tumor growth. Recently we could show in a head and neck squamous cell cancer cohort, that low numbers of Treg are adverse, and in contrast, high numbers of Treg are favorable with regard to prognosis.Citation15 This could indicate that inflammatory cells do not necessarily need to infiltrate the epithelial compartment of the tumor but can act from the margins of the tumor being localized in the stromal compartment. This is of particular interest in view of a proposed subdivision of malignancies according to their immunological background. In this regard, a model of three different immunological tumor-groups was discussed dividing cancers into “immune dessert” non-inflamed cases, “immune excluded” cases with inflammatory cells predominantly restricted to the stromal compartment and “immune inflamed” with high numbers of inflammatory cells in the intraepithelial compartment.Citation16 It was argued that the success of immunotherapy is restricted to “immune-inflamed” tumors whereas “immune-excluded” tumors will be resistant to such a therapeutic approach. Our findings could argue against such a strict division, as our results implicate an anti-tumoral activity of inflammatory cells located in the stroma, especially when in close proximity to the epithelial–stromal interface, which might be enhanced by the use of immune-checkpoint inhibitors.
Conclusion
In the present study, we describe that FoxP3+ or CD8+ T lymphocytes located close to the epithelial–stromal interface of the invasive front are associated with a better outcome in rectal cancer. Whereas the mere density of CD8+ and FoxP3+ TIL was of no prognostic value, the distance of stromal FoxP3+ or CD8+ T-lymphocytes to the epithelial–stromal interface was a valuable prognostic marker. Besides being a more accurate predictor of outcome when compared to cell density, the spatial distribution may potentially be a useful parameter in decision-making regarding the use of immune-therapeutic approaches. This will have to be assessed in future prospective studies with new therapy modalities and other tumor entities.
Disclosure of potential conflicts of interest
The authors report no conflict of interest.
Supplemental Material
Download ()Acknowledgments
We thank Stefan Söllner for excellent technical assistance. We thank the Tumour Centre at the Friedrich-Alexander University Erlangen-Nürnberg, Erlangen, Germany for providing us with patient data. The present work was performed in fulfillment of the requirements for obtaining the degree “Dr. med.”
Supplementary material
Supplemental data for this article can be accessed on the publisher’s website.
References
- Nakano O, Sato M, Naito Y, Suzuki K, Orikasa S, Aizawa M, Suzuki Y, Shintaku I, Nagura H, Ohtani H. Proliferative activity of intratumoral CD8(+) T-lymphocytes as a prognostic factor in human renal cell carcinoma: clinicopathologic demonstration of antitumor immunity. Cancer Res. 2001;61:5132–9.
- Sharma P, Shen Y, Wen S, Yamada S, Jungbluth AA, Gnjatic S, Bajorin DF, Reuter VE, Herr H, Old LJ, et al. CD8 tumor-infiltrating lymphocytes are predictive of survival in muscle-invasive urothelial carcinoma. Proc Natl Acad Sci U S A. 2007;104(10):3967–3972. doi:10.1073/pnas.0611618104.
- Posselt R, Erlenbach-Wunsch K, Haas M, Jessberger J, Buttner-Herold M, Haderlein M, Hecht M, Hartmann A, Fietkau R, Distel LV. Spatial distribution of FoxP3+ and CD8+ tumour infiltrating T cells reflects their functional activity. Oncotarget. 2016;7(37):60383–60394. doi:10.18632/oncotarget.11039.
- Chew A, Salama P, Robbshaw A, Klopcic B, Zeps N, Platell C, Lawrance IC. SPARC, FOXP3, CD8 and CD45 correlation with disease recurrence and long-term disease-free survival in colorectal cancer. PLoS One. 2011;6(7):e22047. doi:10.1371/journal.pone.0022047.
- Correale P, Rotundo MS, Del Vecchio MT, Remondo C, Migali C, Ginanneschi C, Tsang KY, Licchetta A, Mannucci S, Loiacono L, et al. Regulatory (FoxP3+) T-cell tumor infiltration is a favorable prognostic factor in advanced colon cancer patients undergoing chemo or chemoimmunotherapy. J Immunother. 2010;33(4):435–441. doi:10.1097/CJI.0b013e3181d32f01.
- Salama P, Phillips M, Grieu F, Morris M, Zeps N, Joseph D, Platell C, Iacopetta B. Tumor-infiltrating FOXP3+ T regulatory cells show strong prognostic significance in colorectal cancer. J Clin Oncol. 2009;27(2):186–192. doi:10.1200/JCO.2008.18.7229.
- Sakaguchi S, Miyara M, Costantino CM, Hafler DA. FOXP3+ regulatory T cells in the human immune system. Nat Rev Immunol. 2010;10(7):490–500. doi:10.1038/nri2785.
- Carstens JL, Correa de Sampaio P, Yang D, Barua S, Wang H, Rao A, Allison JP, LeBleu VS, Kalluri R. Spatial computation of intratumoral T cells correlates with survival of patients with pancreatic cancer. Nat Commun. 2017;8:15095. doi:10.1038/ncomms15095.
- Berthel A, Zoernig I, Valous NA, Kahlert C, Klupp F, Ulrich A, Weitz J, Jaeger D, Halama N. Detailed resolution analysis reveals spatial T cell heterogeneity in the invasive margin of colorectal cancer liver metastases associated with improved survival. Oncoimmunology. 2017;6(3):e1286436. doi:10.1080/2162402X.2017.1286436.
- Jager T, Neureiter D, Fallaha M, Schredl P, Kiesslich T, Urbas R, Klieser E, Holzinger J, Sedlmayer F, Emmanuel K, et al. The potential predictive value of tumor budding for neoadjuvant chemoradiotherapy response in locally advanced rectal cancer. Strahlenther Onkol. 2018;194(11):991–1006. doi:10.1007/s00066-018-1340-0.
- Paleny R, Bremer M, Walacides D, Mainwaring S, Weber K, Henkenberens C. Comparison of relative and absolute rectal dose-volume parameters and clinical correlation with acute and late radiation proctitis in prostate cancer patients. Strahlenther Onkol. 2019;195(2):103–112. doi:10.1007/s00066-018-1365-4.
- Feichtenbeiner A, Haas M, Buttner M, Grabenbauer GG, Fietkau R, Distel LV. Critical role of spatial interaction between CD8(+) and Foxp3(+) cells in human gastric cancer: the distance matters. Cancer Immunol Immunother. 2014;63(2):111–119. doi:10.1007/s00262-013-1491-x.
- Nagl S, Haas M, Lahmer G, Büttner-Herold M, Grabenbauer GG, Fietkau R, Distel L. Cell-to-cell distances between tumour infiltrating inflammatory cells have the potential to distinguish functionally active from suppressed inflammatory cells. Oncoimmunology. 2016;5(5):e1127494. doi:10.1080/2162402X.2015.1127494.
- Heindl A, Nawaz S, Yuan Y. Mapping spatial heterogeneity in the tumor microenvironment: a new era for digital pathology. Lab Invest. 2015;95(4):377–384. doi:10.1038/labinvest.2014.155.
- Echarti A, Hecht M, Buttner-Herold M, Haderlein M, Hartmann A, Fietkau R, Distel L. CD8+ and regulatory T cells differentiate tumor immune phenotypes and predict survival in locally advanced head and neck cancer. Cancers (Basel). 2019;11(9):1398. doi:10.3390/cancers11091398.
- Chen DS, Mellman I. Elements of cancer immunity and the cancer-immune set point. Nature. 2017;541(7637):321-330. doi: 10.1038/nature21349.