
ABSTRACT
CD200, a member of the immunoglobulin superfamily, interacts with its receptor CD200R1 to modulate cancer immune microenvironments. Here, we explored the clinicopathological and prognostic implications of the CD200/CD200R1 axis in non-small-cell lung cancer (NSCLC) patients. We evaluated CD200/CD200R1 expression in the tumors and stroma of 632 NSCLC patients using immunohistochemistry. Associations between CD200/CD200R1 expression levels and clinicopathological data were analyzed. We also examined their expression in lung cancer cell lines. Changes in endogenous immune-related factors and cell proliferation were evaluated by CD200 and CD200R1 knockdown and CD200Fc fusion protein administration. CD200 expression was observed mainly in the tumor, and also in the stroma among a few cases, whereas CD200R1 expression was observed in both the tumor and stroma. High tumoral CD200 expression was significantly associated with female sex, never-smoking status, adenocarcinoma histology, EGFR mutation, and a low density of tumor-infiltrating lymphocytes. Meanwhile, high CD200R1 expression in the tumor and stroma was associated with ever smoking, non-adenocarcinoma histology, and increased tumor-infiltrating lymphocytes. High CD200R1 expression was associated with worse survival (log-rank, P <.001 for both tumor and stroma), whereas high CD200 expression was associated with better survival outcomes (log-rank, P <.001). The transient knockdown of CD200R1 in lung cancer cell lines impaired cell proliferation, and the in vitro modulation of CD200 and CD200R1 altered endogenous oncogenic and inflammation-related gene expression. CD200R1 expression was associated with poor prognosis, whereas CD200 expression was an independent favorable prognostic factor. Our results suggest the importance of CD200 and CD200R1 in lung cancer biology.
Introduction
The tumor immune-microenvironment (TME) comprises various immune-related cells including effector T cells that exert antitumor immune responses, immune-suppressive cells such as regulatory T cells (Treg), tumor-associated macrophages, and myeloid-derived suppressor cells.Citation1,Citation2 These cells express an array of immune receptors including co-stimulatory and co-inhibitory molecules and directly or indirectly interact with tumor cells. Several of these immune molecules including A2A adenosine receptor (A2AR), Citation3,Citation4 CD73, Citation3,Citation5 and indoleamine 2,3-dioxygenase (IDO), Citation6,Citation7 have been investigated as novel therapeutic targets. In addition, combinations of PD-1/PD-L1 immune checkpoint inhibitors (ICIs) with these molecular targeted therapies have been proposed .Citation4,Citation5,Citation7 Despite vigorous investigations, the response rate to ICIs remains unsatisfactory; non-responders and acquired resistance to ICIs, Citation8,Citation9 as well as hyper-progressive disease following ICI administration, Citation10 have been reported. Thus, the population of patients responding well to ICIs is limited. Moreover, the performance of current PD-L1 expression assays for complementary/companion diagnostics is not sufficient .Citation11 Therefore, novel druggable targets among TME-related molecules are urgently needed.
CD200, an immunoglobulin superfamily member, is expressed in various immune cells including activated T cells, B cells, and follicular dendritic cells .Citation12,Citation13 CD200 expression is also observed in organs such as the skin and central nervous system, as well as in tumor cells .Citation14 CD200 interacts with its receptor CD200R1, which is mainly expressed in macrophages, granulocytes, natural killer cells, and Tregs. C200/CD200R1 signaling is known to suppress antitumor responses by modulating macrophage and T-cell functions .Citation13,Citation15–Citation17 Experimental and clinical evidence demonstrates that the blockade of CD200/CD200R1 signaling increases Th1-related cytokine expression and inflammation, leading to anticancer responses .Citation18 Thus, the CD200/CD200R1 pathway has been considered a novel therapeutic target. A clinical trial of an anti-CD200 antibody in patients with B-cell chronic lymphocytic leukemia demonstrated tolerability, as well as a partial benefit .Citation19 However, the clinical significance of CD200/CD200R1 in non-small-cell lung cancer (NSCLC) is yet to be elucidated. In the current study, we explored the clinicopathological and prognostic implications of CD200 and CD200R1 in patients with NSCLC using a relatively large cohort of resected disease. Further, we evaluated CD200/CD200R1 expression in lung cancer cell lines, as well as the roles of CD200 and CD200R1 based on in vitro experiments using CD200 and CD200R1 transient knockdown and a CD200 Fc fusion protein.
Results
Clinicopathological characteristics of patients
We analyzed 632 NSCLC cases based on tissue microarray (TMA) (N = 631 for tumoral CD200, N = 631 for tumoral CD200R1, and N = 630 for stromal CD200R1; ). Several specimens were excluded from TMA because of the insufficient quality of the TMA cores. The clinical characteristics of all patients are shown in . The median age was 68 (range, 23–88) years, 434 (68.7%) patients were male, and 185 (29.3%) had never smoked. The tumors were histologically classified as adenocarcinoma (ADC; N = 415, 65.7%), squamous cell carcinoma (SCC; N = 173, 27.3%), or other histological types (N = 44, 7.0%). Four hundred (63.3%) patients had stage Ι disease, and EGFR mutations were observed in 129 (20.4%) cases. Postoperative adjuvant chemotherapy was prescribed to 257 (40.7%) patients.
Table 1. Characteristics of patients with non-small cell lung cancer according to CD200 and CD200R1 expression
CD200 expression in NSCLC
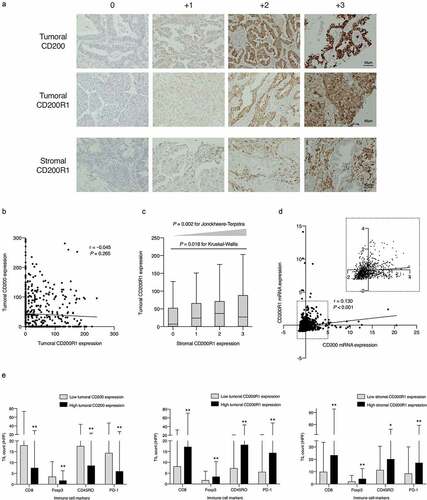
The mean ± standard deviation (SD) H-score value of tumoral CD200 expression was 42.0 ± 57.7 and the median value was 12 (0–295, range) (Supplementary Figure S1A). In contrast, stromal CD200 expression was not observed in most cases (Supplementary Figure S1B); 589 (93.3%) of the assessable 631 cases showed no stromal CD200 expression, grade 2 expression was observed in only three cases, and there were no cases with grade 3 expression. The optimal cutoff H-score for tumoral CD200 expression was determined to be 20 using the minimum P-value method for overall survival OS. Based on this cutoff, we divided the cases into “high” and “low” expression groups and examined the associations with patient data (). Female sex, never-smoking status, ADC histology, and early disease stage were significantly associated with high tumoral CD200 expression (P < .001 for all categories). High tumoral CD200 expression was also significantly associated with EGFR mutations (P < .001) and TTF-1 expression (P < .001).
CD200R1 expression in NSCLC
The mean H-score value of tumoral CD200R1 expression was 41.6 ± 52.8, and the median was 21 (0–241, range) (Supplementary Figure S1C). Stromal CD200R1 expression was detected in 382 (60.6%) cases (Supplementary Figure S1D) including 215 with grade 1, 109 with grade 2, and 58 with grade 3 expression. To determine which types of immune cells expressed CD200R1, we additionally performed multiple immune cell-specific immunohistochemical (IHC) analysis of the stroma cells using serial FFPE samples of the same case. CD200R1 expression was mainly enriched with CD204-positive immune cells compared to that enrichment with T cell markers such as CD3 and CD8 (Supplementary Figure S2).
The entire cohort was divided into “high” and “low” tumoral or stromal CD200R1 expression groups based on optimal cutoff values. The cutoff H-score for tumoral CD200R1 expression was determined to be 21 of the H-score value based on the minimum P-value method. Regarding stromal CD200R1 expression, we divided the low expression group into grades 0 and 1 and the high expression group into grades 2 and 3. In contrast to that with CD200 expression, high CD200R1 expression in both the tumor and stroma was significantly associated with male sex, ever smokers, and non-ADC histology (P < .001 for all categories; ). High stromal CD200R1 expression was significantly associated with advanced disease stage (P = .032) including T factor (P = .002) and nodal metastases (P = .006). Low stromal CD200R1 expression was significantly associated with EGFR mutations and positive TTF-1 expression (P < .001 for both variables).
Mutual associations between CD200 and CD200R1
There was no significant association between tumoral CD200 expression and tumoral CD200R1 expression (r = −0.045, P = .265; ), whereas a significant positive association was found between tumoral and stromal CD200R1 expression (P = .002 for trend based on the Jonckheere–Terpstra test; ). Similar to our findings, online TCGA database analysis (provisional, RNA Seq V2 RSEM) of 1018 patients with NSCLC revealed a small positive correlation between CD200 and CD200R1 mRNA expression (r = 0.130; ).
Figure 1. Mutual correlations between CD200 and CD200R1 expression and their associations with tumor-infiltrating lymphocytes (TILs)
Associations between CD200 and CD200R1 expression and tumor-infiltrating lymphocytes (TILs)
We assessed four subsets of TILs (CD8+, CD45RO+, FoxP3+, and PD-1+ cells) as TME representatives in the tumoral nest, and their associations with CD200 and CD200R1 expression were determined. As shown in , all TIL subsets were significantly enriched in tumors with low tumoral CD200 expression compared to those with high CD200 expression. In contrast, tumors with high CD200R1 expression in the stroma or tumor were significantly more enriched in all TIL subsets than those with low CD200R1 expression. In particular, Foxp3+ TILs, represented as Tregs, and PD-1+ TILs were less abundant in high CD200-expressing tumors. In contrast, they were more abundant in tumors with high CD200R1 expression.
Prognostic value of CD200 and CD200R1 expression in NSCLC
The median follow-up period for the entire cohort was 3.56 years (interquartile range, 1.94–5.80). Kaplan–Meier curves showed that patients with high tumoral CD200 expression had significantly better survival (P < .001 for OS, recurrence-free survival (RFS), and cancer-specific survival (CSS)) than those with low tumoral CD200 expression (). Conversely, patients with high tumoral CD200R1 expression showed significantly worse survival in terms of both OS and CSS (P < .001 for both) but not RFS (P = .134; ). High stromal CD200R1 expression was also significantly associated with worse survival (P < .001 for OS and RFS, P = .0028 for CSS) compared to that for patients with low stromal CD200R1 expression (). Univariate Cox regression analysis (Supplementary Table S1) revealed that high tumoral CD200 expression was a predictor of favorable OS (hazard ratio [HR], 0.433; 95% confidence interval [CI], 0.312–0.601), RFS (HR, 0.528; 95% CI, 0.407–0.684), and CSS (HR, 0.402; 95% CI, 0.266–0.608). In contrast, stromal CD200R1 expression was a predictor of worse prognosis (HR, 1.731; 95% CI, 1.270–2.359 for OS, HR, 1.596; 95% CI, 1.233–2.066 for RFS, and HR, 1.547; 95% CI, 1.046–2.286 for CCS). Similarly, tumoral CD200R1 expression was a predictor of worse OS (HR, 1.811; 95% CI, 1.309–2.505) and CSS (HR, 2.222; 95% CI, 1.456–3.390). Multivariate analysis of age, sex, smoking status, histology, pathological stage, and EGFR mutations () revealed that tumoral CD200 expression was an independent prognostic factor associated with favorable OS (HR, 0.654; 95% CI, 0.451–0.949), RFS (HR, 0.720; 95% CI, 0.538–0.963), and CSS (HR, 0.549; 95% CI, 0.342–0.879). Further, tumoral CD200R1 expression was an independent prognostic indicator of worse CSS (HR, 1.688; 95% CI, 1.073–2.654).
Table 2. Multivariate Cox hazards models of survivals in all patients with non-small cell lung cancer
Figure 2. Survival analysis according to CD200 or CD200R1 expression in patients with non-small cell lung cancer (NSCLC)
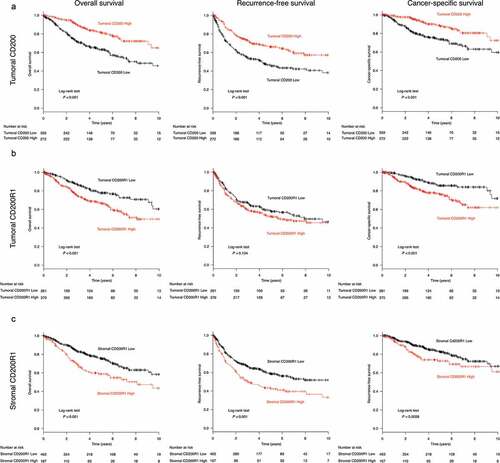
To further analyze the prognostic value of CD200/CD200R1 in patients with NSCLC, the lung cancer database in Kaplan–Meier plotter, comprising 1,926 and 1,145 tumors with CD200 and CD200R1 expression data, respectively, was used. Survival outcomes were significantly more favorable for patients with high CD200 expression than for those with low CD200 expression (log-rank, P = .014; Supplementary Figure S3A), and multivariate analysis revealed that CD200 expression was an independent predictor of favorable outcome (HR, 0,838; 95% CI, 0.727–0.965). In contrast, patients with high CD200R1 expression showed a slight tendency of worse survival (log-rank, P = .263; Supplementary Figure S3B).
Expression and localization of CD200 and CD200R1 in lung cancer cell lines
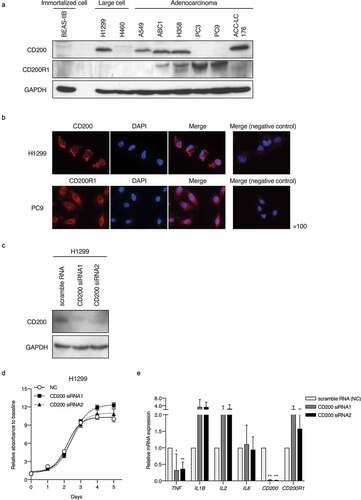
CD200 and CD200R1 protein expression were assessed in one nonmalignant immortalized cell line (BEAS-IIB) and eight lung cancer cell lines (H1299, H460, A549, ABC1, H358, PC3, PC9, and ACC-LC-176). Western blotting analyses revealed that H1299, A549, ABC1, H358, and ACC-LC176 cells endogenously express CD200, whereas ABC1, H358, PC3, and PC9 cells endogenously express CD200R1 (). BEAS-IIB cells did not express CD200 or CD200R1 protein. Subcellular localization in tumor cells was analyzed by immunofluorescence analysis, which revealed that both CD200 and CD200R1 were expressed on the membrane and in the cytoplasm of H1299 and PC9 cells (). Given these results, we used H1299, PC9, and H358 cells for the functional investigation of CD200 on H1299 cells via transient knockdown and of CD200R1 on PC9 and H358 cells by transient knockdown and CD200 Fc treatment.
Figure 3. CD200 and CD200R1 expression profiles in lung cancer cell lines and effect of CD200 knockdown
CD200 knockdown alters endogenous inflammatory cytokine expression in tumor cells
To elucidate the effect of CD200 depletion in tumor cells, we transiently suppressed CD200 expression by siRNA transfection into H1299 cells expressing CD200. CD200 expression was markedly reduced 2 days after transfection (). The transient knockdown of CD200 did not substantially affect the proliferation of H1299 cells (). mRNA expression levels of several inflammatory chemokines upon CD200 depletion were assessed by RT-qPCR. TNF expression was significantly decreased, whereas that of IL1B and IL2 was increased, albeit not statistically significant ().
CD200R1 is associated with cell proliferation activity and endogenous cytokine expression in tumor cells
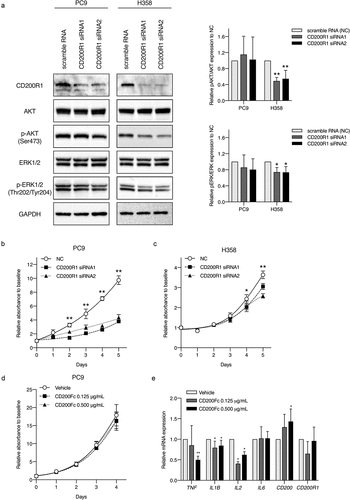
Next, we performed CD200R1 transient knockdown using PC9 and H358 cells, harboring an EGFR mutation (exon19 delE746-750) and KRAS mutation (G12 C), respectively (). The transient knockdown of CD200R1 significantly inhibited cell proliferation in PC9 and H358 cells (,). Simultaneously, we analyzed phospho-AKT (pAKT)/AKT and phospho-ERK (pERK)/ERK levels after CD200R1 knockdown because CD200R1 is known to be associated with Ras signalingCitation17 and both AKT and MAPK signaling pathways frequently participate in lung cancer cellular proliferation and apoptosis .Citation20,Citation21 Interestingly, CD200R1 depletion led to a significant decrease in the expression of pAKT and pERK in KRAS-mutant H358 cells (). CD200R1 depletion also partially changed the levels of several endogenous cytokines including TNF, IL1B, and IL-6 (Supplementary Figure S4A and S4B). Although CD200Fc did not directly affect PC9 cell proliferation (), significant decreases in the endogenous mRNA expression levels of IL1B and IL2 were demonstrated ().
Figure 4. Evaluation of CD200R1 functions with CD200R1 knockdown and CD200Fc administration
Molecular profiling of CD200R1-positive NSCLCs and CD200R1-mediated signaling pathway
To perform the molecular profiling of NSCLC with high CD200R1 expression, we analyzed TCGA RNA sequencing data with investigation GSEA (). Tumors with high CD200R1 expression were enriched in genes related to KRAS activation in both ADCs and SCCs. They were also associated with gene sets involved in the inflammatory response and IL2/STAT5 signaling.
Figure 5. Enriched gene profiles in tumors with high CD200R1 expression and differentially-expressed genes in response to CD200Fc administration as assessed by cDNA microarray
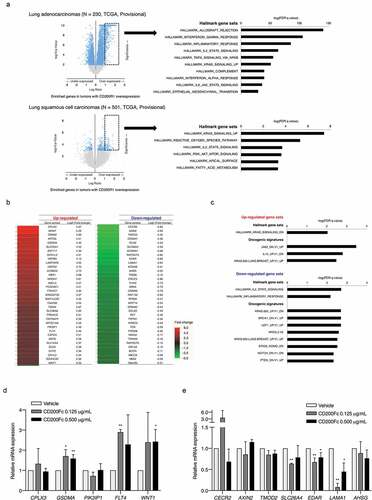
Next, global gene expression changes in PC9 cells after CD200Fc administration were analyzed by cDNA microarray analysis. Several genes were differentially expressed upon CD200Fc administration (). GSEA using two gene sets, specifically hallmark (H) and oncogenic signatures (C6), revealed that genes involved in KRAS and JAK2 signaling were enriched in CD200Fc-treated PC9 cells. In contrast, genes involved in the inflammatory response and IL-2-related signaling were downregulated ( and Supplementary Table S2). Among the highly differentially-expressed genes, we validated mRNA expression levels using RT-qPCR. Significant increases in GSDMA, FLT4, and WNT1 mRNA expression upon CD200Fc treatment were validated (). Further, CD200Fc treatment significantly decreased the SLC26A4, EDAR, and LAMA1 mRNA expression levels in PC9 cells (). The functions of the genes validated by RT-qPCR are summarized in Supplementary Table S3. Together, our data suggested that CD200/CD200R1 is involved in inflammatory responses and specific oncogenic signaling including KRAS in NSCLC, which might be attributed to the worse survival associated with tumors with high CD200R1 expression.
Discussion
The present study, for the first time, explored associations between CD200 and CD200R1 expression in NSCLC patients and clinicopathological characteristics, as well as their prognostic implications. We demonstrated that both CD200 and CD200R1 are expressed in NSCLC, and clinical characteristics and TIL profiles among TMEs were distinct according to CD200 or CD200R1 expression. Tumoral CD200 expression was associated with better prognosis, whereas CD200R1 expression in the tumor and stroma was related to worse patient survival. Multivariate analyses showed that CD200 expression was an independent prognostic factor for patients with NSCLC. In vitro analyses showed that CD200R1 knockdown with siRNA significantly inhibited cell proliferation and altered endogenous mRNA expression levels of genes related to inflammation and oncogenic signaling pathways. Our data revealed the importance of CD200 and CD200R1 in the prognosis of patients with NSCLC.
CD200 is broadly expressed on myeloid cells and tumor cells in various types of cancer including solid tumors and hematologic malignancies .Citation12–Citation14 Upon interaction with CD200R1, CD200 triggers inhibitory signaling to suppress immune reactions. However, CD200R1 expression on tumor cells, in particular in solid cancers, has not been fully explored .Citation22,Citation23 The present study revealed that both CD200 and CD200R1 are expressed in NSCLCs, and these findings were confirmed in lung cancer cell lines. Our results suggested that the CD200/CD200R1 axis interacts with both the TME and NSCLC per se. In particular, TIL density was differentiated according to CD200 and CD200R1 expression in NSCLC specimens. TIL subsets were significantly enriched in tumors with lower tumoral CD200 expression, whereas higher CD200R1 expression in the tumor and stroma were associated with increased levels of TIL subsets. Of note, levels of FoxP3+ Tregs and PD-1+ cells were increased with lower numbers of CD200-expressing NSCLCs and were also associated with higher CD200R1 expression. Although modulation of the CD200 pathway via CD200 knockdown or CD200-Fc treatment did not directly affect cancer cell proliferation, CD200R1 knockdown inhibited cell growth activity. CD200-Fc administration also upregulated KRAS and JAK2 signaling according to GSEA. Additionally, endogenous pro-inflammatory cytokines such as IL-2 and IL-1β were changed with CD200-Fc administration and the depletion of CD200/CD200R1 with siRNA, respectively. These results suggested that possible relationships between CD200/CD200R1 expression and TME-mediated immune tolerance in NSCLCs.
CD200 serves as an immune checkpoint inhibitor; thus, the significance of the CD200/CD200R1 axis has been intensively studied. Mice lacking CD200 show increased susceptibility to experimental allergic encephalomyelitis, arthritis, Citation24 and influenza infection due to failed inactivation of excessive inflammation .Citation25 In cancer immunity, CD200R1-mediated signaling in macrophages/monocytes attenuates the secretion of Th1-directed cytokines including IL-2 and IFN-γ .Citation13,Citation16 It also inhibits cytotoxic T lymphocyte (CTL)Citation18,Citation24 and natural killer cell activities .Citation15 Thus, CD200R1-mediated inhibitory signaling blocks the Th1 response in the TME, resulting in cancer progression. Indeed, the present study showed that CD200R1 expression in stromal areas is associated with worse survival. Similarly, high stromal CD200R1 expression in hepatocellular carcinoma was associated with poor prognosis, Citation22 and CD200R1 was previously found to be more strongly overexpressed in stromal cells of metastatic colon cancer patients than in those of patients without metastasis .Citation23 Therefore, CD200R1 might inhibit signaling in stromal cells, leading to modulation of the TME and inducing immune tolerance, which at least in part contributes to disease progression in NSCLC.
We found that higher tumoral CD200R1 expression was independently associated with worse outcomes for CSS. Only a few studies have evaluated CD200R1 expression in tumoral and stromal areas separately to date, but these reported that CD200R1 is expressed mainly in the stroma .Citation22,Citation23 Previous preclinical studies have shown CD200R1 intracellular signaling, which leads to the recruitment of Dok2 and RasGAP to the intracellular domain of CD200R1, Citation17,Citation26,Citation27 as well as subsequent inhibition of the Ras signaling pathway including its downstream targets, ERK, p38, and JNK .Citation17 In this study, we found that the knockdown of CD200R1 inhibits cell proliferation through the suppression of MAPK and AKT signaling pathways, demonstrated as decreased pERK and pAKT protein expression in H358 cells. Although an EGFR mutation harbored by PC9 cells is known to be exclusive from KRAS mutations, CD200-Fc administration also upregulated KRAS and JAK2 signaling based on GSEA analysis. Given these findings, high CD200R1 expression on tumor cells might be related to the upregulation of specific oncogenic signaling in cancer cells.
We showed that high CD200 expression is an independent favorable prognostic factor in NSCLC. The biological machinery of CD200 in malignant disease has been intensively studied in hematologic malignancies and some solid cancers. CD200 expression is reportedly associated with worse survival in patients with acute myeloid leukemia, multiple myeloma, Citation28,Citation29 and solid cancers such as hepatocellular carcinoma, Citation22 melanoma, Citation18 ovarian cancer, Citation18 and rectal cancer .Citation23 An anti-CD200 monoclonal antibody, samalizumab, has been tested in clinical trials for patients with advanced B-cell chronic lymphocytic leukemia (NCT00648739), acute myelogenous leukemia (NCT03013998), and advanced solid cancer (NCT02987504); these mostly demonstrated partial benefits with respect to anticancer treatments. However, several basic studies have addressed the differential roles of CD200 in limiting cancer growth or promoting cancer progression in different cancer types. In melanoma mouse models, CD200-positive melanoma cells abrogate immune tolerance by inhibiting IL-10 production from tumor-associated macrophages, resulting in the activation of tumor-specific CTLs and preventing tumor recurrence and metastasis .Citation16,Citation30 The protective role of CD200 in breast cancer was reported based on a study using CD200-transgenic and CD200R1-knockout mice ;Citation31 CD200 overexpression was associated with decreased primary tumor growth and metastasis, whereas metastasis was increased in CD200R1-knockout mice. Moreover, using a chemically-induced melanoma mouse model, Rygiel et al. reported that CD200/CD200R1 is functionally active irrespective of tumoral CD200 expression .Citation32 The authors speculated that the blockade of CD200R1 signaling might have various effects according to timing during tumor development; inhibition of the CD200/CD200R1 axis boosted the antitumor response, but did not exert a pro-tumorigenic effect, in the early stage of tumor development. In contrast, in the advanced stage, CD200/CD200R blockade might cause tumor-progressive inflammation .Citation33 These previous studies indicated the bidirectional effects of CD200 and CD200R1 depending on cancer phase and type. Our results corroborated the functions of CD200 and CD200R1 in cancer progression, which seem to be complexly regulated depending on the cancer type, tumor stage, and TME.
The present study showed the different clinical relevance of CD200 and CD200R1 in patients with NSCLC. Our cohort consisted largely of early-stage resected NSCLCs. We speculated that CD200 might contribute to the anti-tumor response, as CD200 functions in a protective manner in early phases of breast cancer .Citation31 Indeed, decreased levels of Tregs, represented as Foxp3+ cells, and PD-1+ cells were observed in high CD200-expressing tumors. Conversely, high-CD200R1 tumors were significantly associated with increased levels of Tregs and PD-1+ cells, which were sufficient to suppress CTL functions, Citation34 and also significantly associated with worse patient survival .Citation35,Citation36 Tumor-associated macrophages, represented as CD204+ M2-polarized macrophages, were also abundant with CD200R1 immune cells. Further, impaired cell proliferation mediated by CD200R1 transient knockdown was observed in vitro. Therefore, these TME changes and the oncogenic signaling of CD200R1 might contribute to the different prognostic implications of CD200 and CD200R1 in patients with NSCLC.
This study had several limitations. First, H-scoring and semi-quantitative grading were performed with the naked eye; automated immunostaining evaluation has been recently reported, with a good correlation between automated and classical manual assessment .Citation37 Second, although simultaneous co-staining analysis using specific antibodies for immune cells was performed in our study, we did not correctly identify CD200R1-expressing immune cell types. Flow cytometry or Multiplex QIF analysis might have been informative .Citation38,Citation39 Third, we performed preliminary experiments on several lung cancer cell lines, but it would have been desirable to use patient-derived cancer cells and/or immune cells. Forth, in vitro analyses showed that H1299 cells and PC9 cells expressed only either CD200 or CD200R1, respectively, and not both (). However, the depletion of CD200 and CD200R1 altered the endogenous expression levels of several cytokines. Additionally, the functional modulation of CD200R1 via CD200-Fc administration and transient knockdown showed different effects on cell proliferation. These results suggested the possibility that CD200 and CD200R1 might function independently from CD200–CD200R1 mutual interactions. Indeed, Ren et al showed that the KATP channel regulates CD200-mediated anti-inflammatory responses .Citation40 Therefore, we believe further experiments using in vivo models and an antagonistic antibody of CD200/CD200R1 are needed to clarify the detailed mechanism underlying CD200-and CD200R1-mediated immune modification of tumor cells.
In conclusion, this study shed light on the clinical roles of CD200 and CD200R1 in patients with NSCLC. Both CD200 and CD200R1 are expressed in NSCLC, and distinct TIL patterns are regulated by CD200 and CD200R1 expression levels. CD200R1 expression is associated with poor prognosis, whereas CD200 expression is an independent favorable prognostic factor. The blockade of CD200R1 inhibited cell proliferation in vitro and the modulation of CD200/CD200R1 signaling altered endogenous oncogenic and inflammatory signaling. The CD200/CD200R1 axis is likely more complex, and CD200/CD200R1 mutual interactions are yet to be clarified in the TME. Hence, an understanding of the mechanisms associated with CD200 and CD200R1 might lead to a candidate therapeutic target for NSCLC.
Material and methods
Patients and specimens
We collected 632 NSCLC tumor tissues, 413 of which were resected at Hamamatsu University Hospital between January 1990 and April 2014 and 219 at Seirei Mikatahara General Hospital between January 2006 and April 2014. Pathological stages were defined based on the 2015 WHO classification, Citation41 and tumors were histologically classified by three senior pathologists (KT, KS, and HS) .Citation42 Clinicopathological data including age, sex, smoking status, adjuvant chemotherapy, and survival time from surgical resection, obtained until the end of June 2016, were retrospectively collected from hospital medical records. Tissue cores were punched out from distinct tumor areas using 2- or 3-mm-diameter cylinders (Azumaya, Tokyo, Japan) and were aligned on TMAs. Prior to TMA analysis, the presence of a sufficient number of tumor cells in the TMA cores was confirmed using hematoxylin–eosin staining of tissue sections.
This study was approved by the ethics committees of Hamamatsu University School of Medicine and Seirei Mikatahara General Hospital. The need for patient approval and informed consent was waived, because this study was based on reviews of patient records. All analyses were conducted in compliance with the Helsinki Declaration.
Cell lines and culture
Human lung cancer cell lines H1299, H460, A549, ABC1, H358, PC3, PC9, and ACC-LC176 and the human immortalized bronchial cell line BEAS-IIB were used (see Supporting Information for details regarding cell lines) .Citation43,Citation44 The cells were cultured in RPMI-1640 medium (Thermo Fisher Scientific, Waltham, MA, USA) supplemented with 10% fetal bovine serum and penicillin/streptomycin at 37°C in the presence of 5% CO2.
Antibodies, RNAi transfection, and CD200Fc binding assay
The following antibodies were used for immunohistochemical staining: rabbit polyclonal anti-CD200 (HPA031149; Atlas Antibody, Bromma, Sweden), Citation45 mouse monoclonal anti-CD200R1 (clone OX-102; cat. no. LS-B10967; LifeSpan BioSciences, Seattle, WA, USA), mouse monoclonal anti-CD200 (66282-1-Ig; Proteintech, Chicago, IL, USA), Citation46 mouse monoclonal anti-CD200R1 (OX-102), which were also applied to both immunoblotting and immunofluorescent analyses. The other applied antibodies are shown in the Supporting information.
Stealth RNAi™ siRNAs for the transient knockdown of CD200 (cat. nos. 10620318 and 10620319) and negative control siRNA (cat. no. 12935–200) were purchased from Thermo Fisher Scientific. Two siRNAs with different target sequences for one targeted gene were used to exclude off-target effects. The sequences of the siRNAs were follows: CD200-siRNA-1, 5′-GCAGCUGUACACACCUGCUUCCUUA-3′, CD200-siRNA-2, 5′-GAAGACCACCUAAAUAUCACUUGCU-3′, CD200R1-siRNA-1, 5′-ACAGAUUACACAGAACUACUCGAAA-3′, CD200R1-siRNA-2, 5′-GCCUGUAAAGAUGGCUACAAAUGCU-3′. siRNAs were transfected into cells at a final concentration of 40 nM for H1299 cells and at 80 nM for PC9 and H358 cells using Lipofectamine 2000. Cells were used for further analysis 48 h post-transfection.
To investigate the binding of CD200 to CD200R1, we used recombinant human CD200Fc protein (cat no. 2724-CD; R&D Systems, Minneapolis, MN, USA). CD200Fc is a CD200 fusion protein consisting of the extracellular domain of CD200 bound to a murine IgG2aFc sequence and modified to eliminate the Fc receptor and complement binding regionsCitation47,Citation48 (see Supporting information for details).
Immunohistochemical analysis
TMA sections were analyzed by IHC as previously described (see Supporting Information for details). Protein expression levels of CD200 and CD200R1 were separately evaluated in tumoral and surrounding stromal areas (). Tumoral protein expression levels were assessed based on the H-score, Citation49 which was calculated by multiplying the percentage of the stained tumor area (0–100%) by the staining intensity (scored on a scale of 0–3) to yield a value ranging from 0 to 300. Stromal expression levels were semi-quantitatively assessed using a four-graded scale (0 = no staining, 1 = limited and weak staining, 2 = moderate staining, and 3 = abundant and strong staining) .Citation50,Citation51 Two observers (KY and YI) independently assessed protein expression. Optimal cutoff values for tumoral CD200 and CD200R1 H-scores were determined using the minimum P-value method for OS, Citation3 and a cutoff mean value of ≥ 2 was used to determine stromal CD200R1 expression. Four subsets of TILs were selected as follows: CD8+ (representing cytotoxic T-cells), Foxp3+ (representing Tregs), CD45RO+ (representing memory T cells), and PD-1+ immune cells. These subsets of TILs were assessed by counting the cells in high-power fields (×20) in the tumor nest/epithelial compartment .Citation52,Citation53 The average total TIL number in the three areas was calculated.
Quantitative reverse-transcription (qRT-)PCR analysis
Total RNA was extracted from cells using an RNeasy Mini Kit (Qiagen, Valencia, CA, USA). RNA concentration and quality were assessed on a NanoDrop spectrophotometer (NanoDrop Technologies). cDNA was synthesized from 0.5 μg of total RNA using the SuperScript III First-Strand Synthesis System (Thermo Fisher Scientific, San Jose, CA, USA). qPCRs were run in triplicate on a StepOne Plus instrument (Applied Biosystems, Foster City, CA, USA) using QuantiTect SYBR Green PCR Kits (Qiagen) as per the manufacturer’s instructions. Target gene expression levels were normalized to the level of GAPDH. The comparative ΔCt method was used for data analysis. Gene-specific primers are listed in Supplementary Table S4.
Immunoblotting analysis
Cells were lysed in 1× sodium dodecyl sulfate (SDS) sample buffer. Cell lysates were quantified for protein concentrations with a BCA protein assay kit (Thermo Fisher Scientific). Following the addition of 2-mercaptoethanol, the samples were boiled, and 15–20 μg of the cell lysates were separated by SDS polyacrylamide gel electrophoresis and transferred onto polyvinylidene fluoride (PVDF) membranes (Amersham Hybond P 0.45 PVDF; GE Healthcare, Little Chalfont, UK). Target proteins were detected using specific antibodies at appropriate dilutions (GAPDH, 1:1000; CD200, 1:1000; CD200R1 1:1000; ERK1/2 1:1000; pERK1/2 1:1000; AKT 1:1000; pAKT 1:2000), at 4°C overnight. Blots were then incubated with a secondary goat anti-rabbit (NA9340 V; GE Healthcare, Buckinghamshire, UK) or anti-mouse antibody (NA9310 V; GE Healthcare) at room temperature for 1 h. Blots were visualized by enhanced chemiluminescence detection using Pierce ECL Western Blotting Substrate Plus (Thermo Fisher Scientific).
Immunofluorescence analysis
Cells grown on coverslips were fixed with 4% paraformaldehyde and permeabilized with 0.1% triton X-100. After blocking with 5% bovine serum albumin in PBS at room temperature for 1 h, the cells were probed with primary antibodies against CD200 and CD200R1 and then incubated with an Alexa Fluor® 546-conjugated secondary antibody against rabbit IgG (Thermo Fisher Scientific). Nuclei were stained with 4′,6-diamidino-2-phenylindole. The cells were imaged by fluorescence microscopy using z-stack image reconstructions (BZ-9000; Keyence, Osaka, Japan).
Cell proliferation assay
Cells were seeded in 96-well plates at 3 × 10³ cells per well. Cell proliferation was monitored using a Cell Counting Kit-8 (CCK-8; Dojindo, Kumamoto, Japan) according to the manufacturer’s protocol. After incubation for 5 days, the cells were incubated with 10% CCK-8 for 2 h, and the absorbance at 450 nm was assessed in each well by spectrophotometry every 24 h. The assay was carried out in sextuplicate.
Microarray gene analysis
Global gene expression profiling was carried out using Agilent SurePrint G3 Human GE v3 8 × 60 K Microarrays (Agilent Technologies) according to the manufacturer’s protocol. Differentially-expressed genes were determined by gene set enrichment analysis (GSEA) (http:/software.broadinstitute.org/gsea/omdex.jsp)Citation54 (see Supporting information for details).
Online database analysis
To validate the prognostic associations of CD200 and CD200R1 in other NSCLC cohorts, we used the lung cancer database in Kaplan–Meier plotter (http://kmplot.com/analysis/index.php?p=service&cancer=lung) .Citation55 The data were downloaded on March 20, 2018. We generated Kaplan–Meier curves for OS according to the auto select best cutoff. To assess the correlation between CD200 and CD200R1 expression and the enriched gene profile in tumors with high CD200R1 expression, we used the TCGA database. CD200 and CD200R1 mRNA expression data (NSCLC, TCGA, Provisional) were downloaded from cBioPortal (http://www.cbioportal.org/)Citation56,Citation57 on March 24, 2018 (see Supporting information for details).
Statistical analysis
Categorical variables were analyzed using a Fisher’s exact test. Continuous variables were analyzed using the Mann–Whitney U-test or a student’s t-test, and multi-group comparisons were performed using the Kruskal–Wallis test or one-way ANOVA, with post-hoc analysis using the Holm-Sidak test. The Jonckheere-Terpstra test was also used to evaluate the trend for relationships. Correlations between variables were assessed based on Pearson’s correlation coefficient. OS and CSS were defined as the interval between the date of surgical resection and the date of death due to any cause or death due to lung cancer, respectively. RFS was defined as the time from surgical resection to the time of recurrence or death due to any cause. The Kaplan–Meier method with a log-rank test and multivariate models with Cox proportional hazards regression analyses were used to analyze survival. Statistical analyses were conducted using R software, version 3.2.0 (The R Foundation for Statistical Computing, Vienna, Austria). P < .05 was considered statistically significant.
Author contributions
All authors contributed toward the conception and design, data analysis, drafting, and critically revising the paper, and agree to be accountable for all aspects of the work.
Disclosure of potential conflicts of interest
No potential conflicts of interest were disclosed.
Supplemental Material
Download ()Acknowledgments
We thank Mr. Hisaki Igarashi (Hamamatsu University School of Medicine) for their technical assistance.
Supplementary material
Supplemental data for this article can be accessed on the publisher’s website.
Additional information
Funding
References
- Teng MWL, Ngiow SF, Ribas A, Smyth MJ. Classifying cancers basedon T-cell infiltration and PD-L1. Cancer Res. 2015;2139–15. doi:10.1158/0008-5472.CAN-15-0255.
- Yoshimura K, Inoue Y, Kahyo T, Kawase A, Tanahashi M, Ogawa H, Inui N, Funai K Shinmura K, Niwa H, Suda T Abstract 3698: associations of the immune microenvironment with PD-L1 copy number alterations and PD-L1 expression in resected non-small cell lung cancer. AACR2017. 2017. p. 3698.
- Inoue Y, Yoshimura K, Kurabe N, Kahyo T, Kawase A, Tanahashi M, Ogawa H, Inui N, Funai K, Shinmura K, et al. Prognostic impact of CD73 and A2A adenosine receptor expression in non-small-cell lung cancer. Oncotarget. 2018;8:8738–8751. doi:10.18632/oncotarget.v8i5.
- Fong L, Forde PM, Powderly JD, Goldman JW, Nemunaitis JJ, Luke JJ, Hellmann MD, Kummar S, Doebele RC, Mahadevan D, et al. Safety and clinical activity of adenosine A2a receptor (A2aR) antagonist, CPI-444, in anti-PD1/PDL1 treatment-refractory renal cell (RCC) and non-small cell lung cancer (NSCLC) patients. J Clin Oncol. 2017;35:3004. doi:10.1200/JCO.2017.35.15_suppl.3004.
- Rizvi N, Shu C, Goldberg S, Papadimitrakopoulou V, Camidge DR, Patel S, Marrone K, Kim S, Kim D, Hsieh H, et al. P3.04-23 phase 1b/2 study to evaluate novel combinations with oleclumab (MEDI9447) in previously treated advanced EGFRm NSCLC. J Thorac Oncol. 2018;13:S930–1. doi:10.1016/j.jtho.2018.08.1730.
- Suzuki Y, Suda T, Furuhashi K, Suzuki M, Fujie M, Hahimoto D, Nakamura Y, Inui N, Nakamura H, Chida K, et al. Increased serum kynurenine/tryptophan ratio correlates with disease progression in lung cancer. Lung Cancer. 2010;67(3):361–365. doi:10.1016/j.lungcan.2009.05.001.
- Gangadhar TC, Schneider BJ, Bauer TM, Wasser JS, Spira AI, Patel SP, Balmanoukian AS, Bauml J, Schmidt EV, Zhao Y, et al. Efficacy and safety of epacadostat plus pembrolizumab treatment of NSCLC: preliminary phase I/II results of ECHO-202/KEYNOTE-037. J Clin Oncol. 2017;35(15_suppl):9014. doi:10.1200/JCO.2017.35.15_suppl.9014.
- Pitt JM, Vétizou M, Daillère R, Roberti MP, Yamazaki T, Routy B, Lepage P, Boneca I, Chamaillard M, Kroemer G, et al. Resistance mechanisms to immune-checkpoint blockade in cancer: tumor-intrinsic and -extrinsic factors. Immunity. 2016;44(6):1255–1269. doi:10.1016/j.immuni.2016.06.001.
- Yoshimura K, Karayama M, Inoue Y, Kahyo T, Inui N, Maekawa M, Sugimura H, Suda T. Heterogeneous MET gene copy number and EGFR mutation elicit discordant responses to crizotinib between primary and metastatic lesions in erlotinib-resistant lung adenocarcinoma. Lung Cancer. 2018;124:317–319. doi:10.1016/j.lungcan.2018.03.016.
- Ferrara R, Mezquita L, Texier M, Lahmar J, Audigier-Valette C, Tessonnier L, Mazieres J, Zalcman G, Brosseau S, Le Moulec S, Leroy L. hyperprogressive disease in patients with advanced non-small cell lung cancer treated with PD-1/PD-L1 inhibitors or with single-agent chemotherapy. JAMA Oncol. 2018;4:1543–1552. doi:10.1001/jamaoncol.2018.3676.
- Yoshimura K, Inoue Y, Karayama M, Tsuchiya K, Mori K, Suzuki Y, Iwashita Y, Kahyo T, Kawase A, Tanahashi M, et al. Heterogeneity analysis of PD-L1 expression and copy number status in EBUS-TBNA biopsy specimens of non-small cell lung cancer: comparative assessment of primary and metastatic sites. Lung Cancer. 2019;134:202–209. doi:10.1016/j.lungcan.2019.06.002.
- Barclay AN, Clark MJ, McCaughan GW. Neuronal/lymphoid membrane glycoprotein MRC OX-2 is a member of the immunoglobulin superfamily with a light-chain-like structure. Biochem Soc Symp. 1986;51:149–157.
- Barclay AN, Wright GJ, Brooke G, Brown MH. CD200 and membrane protein interactions in the control of myeloid cells. Trends Immunol. 2002;23:285–290. doi:10.1016/S1471-4906(02)02223-8.
- Broderick C, Hoek RM, Forrester JV, Liversidge J, Sedgwick JD, Dick AD. Constitutive retinal CD200 expression regulates resident microglia and activation state of inflammatory cells during experimental autoimmune uveoretinitis. Am J Pathol. 2002;161:1669–1677. doi:10.1016/S0002-9440(10)64444-6.
- Coles SJ, Wang ECY, Man S, Hills RK, Burnett AK, Tonks A, Darley RL. CD200 expression suppresses natural killer cell function and directly inhibits patient anti-tumor response in acute myeloid leukemia. Leukemia. 2011;25:792–799. doi:10.1038/leu.2011.1.
- Wang L, Liu JQ, Talebian F, El-Omrani HY, Khattabi M, Yu L, Bai X-F. Tumor expression of CD200 inhibits IL-10 production by tumor-associated myeloid cells and prevents tumor immune evasion of CTL therapy. Eur J Immunol. 2010;40:2569–2579. doi:10.1002/eji.201040472.
- Zhang S, Cherwinski H, Sedgwick JD, Phillips JH. Molecular mechanisms of CD200 inhibition of mast cell activation. J Immunol. 2004;173:6786–6793. doi:10.4049/jimmunol.173.11.6786.
- Siva A, Xin H, Qin F, Oltean D, Bowdish KS, Kretz-Rommel A. Immune modulation by melanoma and ovarian tumor cells through expression of the immunosuppressive molecule CD200. Cancer Immunol Immunother. 2008;57:987–996. doi:10.1007/s00262-007-0429-6.
- Mahadevan D, Lanasa MC, Farber C, Pandey M, Whelden M, Faas SJ, Ulery T, Kukreja A, Li L, Bedrosian CL, et al. Phase I study of samalizumab in chronic lymphocytic leukemia and multiple myeloma: blockade of the immune checkpoint CD200. J Immunother Cancer. 2019;7:227. doi:10.1186/s40425-019-0710-1.
- Ferrer I, Zugazagoitia J, Herbertz S, John W, Paz-Ares L, Schmid-Bindert G. KRAS-Mutant non-small cell lung cancer: from biology to therapy. Lung Cancer. 2018;124:53–64. doi:10.1016/j.lungcan.2018.07.013.
- Papadimitrakopoulou V. Development of PI3K/AKT/mTOR pathway inhibitors and their application in personalized therapy for non-small-cell lung cancer. J Thorac Oncol. 2012;7:1315–1326. doi:10.1097/JTO.0b013e31825493eb.
- Sun H, Xu J, Huang M, Huang Q, Sun R, Xiao W, Sun C. CD200R, a co-inhibitory receptor on immune cells, predicts the prognosis of human hepatocellular carcinoma. Immunol Lett. 2016;178:105–113. doi:10.1016/j.imlet.2016.08.009.
- Bisgin A, Meng WJ, Adell G, Sun XF. Interaction of CD200 Overexpression on tumor cells with cd200r1 overexpression on stromal cells: an escape from the host immune response in rectal cancer patients. J Oncol. 2019;2019:1–7. doi:10.1155/2019/5689464.
- Hoek RH, Ruuls SR, Murphy CA, Wright GJ, Goddard R, Zurawski SM, Blom B, Homola ME, Streit WJ, Brown MH, Barclay AN. Down-regulation of the macrophage lineage through interaction with OX2 (CD200). Science (80-). 2000;290:1768–1771. doi:10.1126/science.290.5497.1768.
- Snelgrove RJ, Goulding J, Didierlaurent AM, Lyonga D, Vekaria S, Edwards L, Gwyer E, Sedgwick JD, Barclay AN, Hussell T, et al. A critical function for CD200 in lung immune homeostasis and the severity of influenza infection. Nat Immunol. 2008;9:1074–1083. doi:10.1038/ni.1637.
- Mihrshahi R, Barclay AN, Brown MH. Essential roles for Dok2 and RasGAP in CD200 receptor-mediated regulation of human myeloid cells. J Immunol. 2009;183:4879–4886. doi:10.4049/jimmunol.0901531.
- Zhang S, Phillips JH. Identification of tyrosine residues crucial for CD200R-mediated inhibition of mast cell activation. J Leukoc Biol. 2006;79:363–368. doi:10.1189/jlb.0705398.
- Tonks A, Hills R, White P, Rosie B, Mills KI, Burnett AK, Darley RL. CD200 as a prognostic factor in acutemyeloid leukaemia. Leukemia. 2007;21:566-568. doi:10.1038/sj.leu.2404559.
- Moreaux J, Hose D, Reme T, Jourdan E, Hundemer M, Legouffe E, Moine P, Bourin P, Moos M, Corre J, et al. CD200 is a new prognostic factor in multiple myeloma. Blood. 2006;108:4194–4197. doi:10.1182/blood-2006-06-029355.
- Talebian F, Liu JQ, Liu Z, Khattabi M, He Y, Ganju R, Bai X-F. Melanoma cell expression of CD200 inhibits tumor formation and lung metastasis via inhibition of myeloid cell functions. PLoS One. 2012;7:e31442. doi:10.1371/journal.pone.0031442.
- Erin N, Podnos A, Tanriover G, Duymuş CE, Khatri I, Khatri I, Gorczynski RM. Bidirectional effect of CD200 on breast cancer development and metastasis, with ultimate outcome determined by tumor aggressiveness and a cancer-induced inflammatory response. Oncogene. 2015;34:3860–3870. doi:10.1038/onc.2014.317.
- Rygiel TP, Karnam G, Goverse G, Van Der Marel APJ, Greuter MJ, Van Schaarenburg RA, Visser WF, Brenkman AB, Molenaar R, Hoek RM, et al. CD200-CD200R signaling suppresses anti-tumor responses independently of CD200 expression on the tumor. Oncogene. 2012;31:2979–2988. doi:10.1038/onc.2011.477.
- Rygiel TP, Meyaard L. CD200R signaling in tumor tolerance and inflammation: A tricky balance. Curr Opin Immunol. 2012;24:233–238. doi:10.1016/j.coi.2012.01.002.
- Maeda Y, Nishikawa H, Sugiyama D, Ha D, Hamaguchi M, Saito T, Nishioka M, Wing JB, Adeegbe D, Katayama I, et al. Detection of self-reactive CD8 + T cells with an anergic phenotype in healthy individuals. Science. 2014;346:1536–1540. doi:10.1126/science.aaa1292.
- Zhao S, Jiang T, Zhang L, Yang H, Liu X, Jia Y, Zhou C. Clinicopathological and prognostic significance of regulatory T cells in patients with non-small cell lung cancer: A systematic review with meta-analysis. Oncotarget. 2016;7:36065–36073. doi:10.18632/oncotarget.9130.
- Pollack SM, He Q, Yearley JH, Emerson R, Vignali M, Zhang Y, Redman MW, Baker KK, Cooper S, Donahue B, et al. T-cell infiltration and clonality correlate with programmed cell death protein 1 and programmed death-ligand 1 expression in patients with soft tissue sarcomas. Cancer. 2017;123:3291–3304. doi:10.1002/cncr.v123.17.
- Akbar S, Jordan LB, Purdie CA, Thompson AM, McKenna SJ. Comparing computer-generated and pathologist-generated tumour segmentations for immunohistochemical scoring of breast tissue microarrays. Br J Cancer. 2015;113:1075–1080. doi:10.1038/bjc.2015.309.
- Lu S, Stein JE, Rimm DL, Wang DW, Bell JM, Johnson DB, Sosman JA, Schalper KA, Anders RA, Wang H, et al. Comparison of biomarker modalities for predicting response to PD-1/PD-L1 checkpoint blockade. JAMA Oncol. 2019;5:1195–1204. doi:10.1001/jamaoncol.2019.1549.
- Zhang SS, Huang ZW, Li LX, Fu JJ, Xiao B. Identification of CD200 + colorectal cancer stem cells and their gene expression profile. Oncol Rep. 2016;36:2252–2260. doi:10.3892/or.2016.5039.
- Ren Y, Ye M, Chen S, Ding J. CD200 inhibits inflammatory response by promoting KATP channel opening in microglia cells in Parkinson’s disease. Med Sci Monit. 2016;22:1733–1741. doi:10.12659/MSM.898400.
- Goldstraw P, Chansky K, Crowley J, Rami-Porta R, Asamura H, Eberhardt WEE, Nicholson AG, Groome P, Mitchell A, Bolejack V, et al. The IASLC lung cancer staging project: proposals for revision of the TNM stage groupings in the forthcoming (eighth) edition of the TNM classification for lung cancer. J Thorac Oncol. 2016;11:39–51. doi:10.1016/j.jtho.2015.09.009.
- Travis WD, Brambilla E, Nicholson AG, Yatabe Y, Austin JHM, Beasley MB, Chirieac LR, Dacic S, Duhig E, Flieder DB, et al. The 2015 world health organization classification of lung tumors. J Thorac Oncol. 2015;10:1243–1260. doi:10.1097/JTO.0000000000000630.
- Natsume H, Shinmura K, Tao H, Igarashi H, Suzuki M, Nagura K, Goto M, Yamada H, Maeda M, Konno H, Nakamura S. The CRKL gene encoding an adaptor protein is amplified, overexpressed, and a possible therapeutic target in gastric cancer. J Transl Med. 2012;10:97. doi: 10.1186/1479-5876-10-97.
- Matsuura S, Kahyo T, Shinmura K, Iwaizumi M, Yamada H, Funai K, Kobayashi J, Tanahashi M, Niwa H, Ogawa H, et al. SGOL1 variant B induces abnormal mitosis and resistance to taxane in non-small cell lung cancers. Sci Rep. 2012;3:3012. doi:10.1038/srep03012.
- Fukazawa Y, Lum R, Okoye AA, Park H, Matsuda K, Bae JY, Hagen SI, Shoemaker R, Deleage C, Lucero C, et al. B cell follicle sanctuary permits persistent productive simian immunodeficiency virus infection in elite controllers. Nat Med. 2015;21:132–139. doi:10.1038/nm.3781.
- Ishibashi M, Neri S, Hashimoto H, Miyashita T, Yoshida T, Nakamura Y, Udagawa H, Kirita K, Matsumoto S, Umemura S, et al. CD200-positive cancer associated fibroblasts augment the sensitivity of epidermal growth factor receptor mutation-positive lung adenocarcinomas to EGFR Tyrosine kinase inhibitors. Sci Rep. 2017;7:46662. doi:10.1038/srep46662.
- Cox FF, Carney D, Miller AM, Lynch MA. CD200 fusion protein decreases microglial activation in the hippocampus of aged rats. Brain Behav Immun. 2012;26:789–796. doi:10.1016/j.bbi.2011.10.004.
- Ding Y, Yang H, Xiang W, He X, Liao W, Yi Z. CD200R1 agonist attenuates LPS-induced inflammatory response in human renal proximal tubular epithelial cells by regulating TLR4-MyD88-TAK1-mediated NF-κB and MAPK pathway. Biochem Biophys Res Commun. 2015;460:287–294. doi:10.1016/j.bbrc.2015.03.026.
- Yoshimura K, Inoue Y, Mori K, Iwashita Y, Kahyo T, Kawase A, Tanahashi M, Ogawa H, Inui N, Funai K, Shinmura K. Distinct prognostic roles and heterogeneity of TTF1 copy number and TTF1 protein expression in non-small cell lung cancer. Genes Chromosom Cancer. 2017;56:570–581. doi:10.1002/gcc.22461.
- Meng H, Chen G, Zhang X, Wang Z, Thomas DG, Giordano TJ, Beer DG, Wang MM. Stromal LRP1 in lung adenocarcinoma predicts clinical outcome. Clin Cancer Res. 2011;17(8):2426–2433. doi:10.1158/1078-0432.CCR-10-2385.
- Mirastschijski U, Schnabel R, Claes J, Schneider W, Ågren MS, Haaksma C, Tomasek JJ. Matrix metalloproteinase inhibition delays wound healing and blocks the latent transforming growth factor-β1-promoted myofibroblast formation and function. Wound Repair Regen. 2010;18:223–234. doi:10.1111/wrr.2010.18.issue-2.
- Kadota K, Nitadori JI, Ujiie H, Buitrago DH, Woo KM, Sima CS, Travis WD, Jones DR, Adusumilli PS. Prognostic impact of immune microenvironment in lung squamous cell carcinoma. J Thorac Oncol. 2015;10:1301–1310.
- Hamanishi J, Mandai M, Iwasaki M, Okazaki T, Tanaka Y, Yamaguchi K, Higuchi T, Yagi H, Takakura K, Minato N, et al. Programmed cell death 1 ligand 1 and tumor-infiltrating CD8+ T lymphocytes are prognostic factors of human ovarian cancer. Proc Natl Acad Sci USA. 2007; 104(9):3360-3365. International Association for the Study of Lung Cancer. Available from
- Subramanian A, Tamayo P, Mootha VK, Mukherjee S, Ebert BL, Gillette MA, Paulovich A, Pomeroy SL, Golub TR, Lander ES, et al. Gene set enrichment analysis: A knowledge-based approach for interpreting genome-wide expression profiles. Proc Natl Acad Sci USA. 2005;102(43):15545–15550. doi:10.1073/pnas.0506580102.
- Gyorffy B, Surowiak P, Budczies J, Lánczky A. Online survival analysis software to assess the prognostic value of biomarkers using transcriptomic data in non-small-cell lung cancer. PLoS One. 2013;8:e82241. doi:10.1371/journal.pone.0082241.
- Gao J, Aksoy BA, Dogrusoz U, Dresdner G, Gross B, Sumer SO, Sun Y, Jacobsen A, Sinha R, Larsson E, Cerami E. Integrative analysis of complex cancer genomics and clinical profiles using the cBioPortal. Sci Signal. 2013;6:pl1. doi:10.1126/scisignal.2004088.
- Cerami E, Gao J, Dogrusoz U, Gross BE, Sumer SO, Aksoy BA, Jacobsen A, Byrne CJ, Heuer ML, Larsson E, Antipin Y. The cBio cancer genomics portal: an open platform for exploring multidimensional cancer genomics data. Cancer Discov. 2012;2:401–404. doi:10.1158/2159-8290.CD-12-0095.