
ABSTRACT
Despite the success of monotherapies based on blockade of programmed cell death 1 (PD-1) in human melanoma, most patients do not experience durable clinical benefit. T-cell infiltration and/or the presence of PD-L1 in tumors may be used as indicators of clinical response; However, recent studies reported that preexisting tumor-specific T cells may have limited reinvigoration capacity. Therefore, evaluating status of T cells of tumor-adjacent area and its impact on the prognosis are very important. Here, we examined 117 surgical samples from HCC patients for infiltration of exhausted T cell (Tex) including CD4+-Tex, CD8+-Tex and regulatory T cell (FOXP3+-Treg) in tumor and adjacent tissue. CD3+CD45RO+T cells were sorted from adjacent area or tumor core, then the clusters and heterogeneity of T cells were further interrogated by single-cell RNA sequencing. As a result, we suggested that abundance or location of T cell subsets is differentially correlate with long-term clinical outcome of HCC. In contrast with CD4+T or CD4+-Tex, the infiltration of CD8+T or CD8+-Tex cells was closely linked to overall or recurrence-free survival. FOXP3+-Treg is more predictive of early recurrence. Single-cell transcriptional analysis demonstrates the composition of CD4+-Tex, CD8+-Tex, and FOXP3+-Treg is shifted in tumor and adjacent tissue. Molecular profiles including genes coding checkpoint receptors, effector molecules are distinct between CD4+-Tex, CD8+-Tex, though some common features of CD4+ and CD8+ T cell exhaustion are revealed. In conclusion, we underline the heterogeneity and clinical relevance of Tex cells in HCC patients. A better understanding of Tex is critical for HCC monitoring and treatment.
Introduction
Hepatocellular carcinoma (HCC) is one of the leading causes of cancer-related death and is currently the main event leading to death in patients with cirrhosis.Citation1–Citation3 HCC can be surgically removed with high precision in most patients; however, the rate of local recurrence is high.Citation1,Citation2 As the immune microenvironment around the cutting edge is the first defense for killing residual tumor cells, it may have a significant impact on recurrence and prognosis of patients.Citation4 A precise evaluation of the immune status of the resection margin on post-operative recurrence is required to clarify the issue. Thus, we decided to explore CD4+, CD8+T, and regulatory T cell (Treg) status in HCC, given the important role of these cells in tumor immunity, viral infection, and etc.
While the development of Tex remains incompletely understood, persisting antigen stimulation appears to be a key driver of exhaustion.Citation5 Together with chronic TCR engagement,Citation6 these signals drive elevated and sustained expression of multiple inhibitory receptors (e.g., PD-1, Lag-3, Tim-3, etc.), altered use of key transcription factors (e.g., T-bet, Eomes, Blimp-1, NFAT/AP-1).Citation5,Citation7,Citation8 Ultimately, these signals lead to progressive loss of effector function, resulting in poor control of pathogens or tumors. Although antibodies against PD-L1, TIM3, or LAG3 restore responses of HCC-derived T cells to tumor antigens,Citation9 most patients do not experience durable clinical benefit. Recently, the study indicated that clinical failure in many patients was due to an imbalance between T-cell reinvigoration and tumor burden.Citation10 Preexisting tumor-specific T cells may have limited reinvigoration capacity, and that the T cell response to checkpoint blockade derives from a distinct repertoire of T cell clones that may have just recently entered the tumor.Citation11 Thus, a better understanding of the magnitude of exhausted T cells (Tex) in tumor microenvironment is required to improve immunotherapies that restore function in Tex.
In recent years the pathways involved in CD8+-Tex have begun to be defined.Citation12 In contrast, while CD4+-Tex cells play a pivotal role in chronic infection and cancer, the effect of persisting antigen activation on their function and differentiation remains less well understood. Furthermore, there is a lack of study to simultaneously compare CD4+-Tex and CD8+-Tex in the same disease course. We performed single-cell RNA sequencing (scRNA) on T cells (CD3+CD45RO+) isolated from human HCC. The global and single cell-leveled transcriptional analysis demonstrated a molecular profile distinct from effector or memory CD4+T cells and also from exhausted CD8+T cells, though some common features of CD4+T cell and CD8+T cell exhaustion were revealed. Furthermore, we analyzed the clinical pathology and prognosis of HCC patients, and found that in contrast with CD4+T cell, the presence of CD8+T cell and Treg was strongly correlated with clinical outcome. Especially high PD-1 expression of CD8+T cell in adjacent tissue was negatively associated with overall and recurrence-free survival. These results emphasize the clinical relevance and importance of evaluating Tex cells and the immune status in noncancerous tissue around resections.
Materials & methods
Human specimens
Total 130 patients who were pathologically diagnosed with HCC were enrolled in this study. None of the patients was treated with chemotherapy or radiation prior to tumor resection. Paired HCC tumor and adjacent normal liver tissues were obtained from each patient. The adjacent normal tissues were at least 3 cm from the matched tumor tissue. Formalin-fixed paraffin-embedded HCC specimens of 117 HCC patients were developed into tissue microarrays; fresh samples of 13 patients were collected for the subsequent T cell isolation and scRNA or in vitro tests. This study was approved by the Ethics Committee of Zhongshan Hospital, Fudan University. All patients in this study provided written informed consent for sample collection and data analyses.
Tissue microarrays (TMAs)
Formalin-fixed paraffin-embedded human HCC specimens were randomly collected from 117 HCC patients at Zhong Shan Hospital (Shanghai, People’s Republic of China) between 2006 and 2007. TMAs were constructed by Shanghai Biochip Co, Ltd, as described previously.Citation13 The histopathological diagnosis was determined according to the World Health Organization criteria. Tumor differentiation was graded using the Edmondson grading system.Citation14 Tumor staging was based on the 6th edition of the tumor-node-metastasis (TNM) classification of the International Union Against Cancer. The clinicopathologic characteristics of 117 HCC patients are summarized in Table S1. Five-year follow-up data are summarized at the end of December 2011. Follow-up procedures and postsurgical patient surveillance were described previously.Citation13,Citation15 TMAs were constructed by Shanghai Biochip Co, Ltd, as described previously.Citation13 Overall survival (OS) was defined as the interval between the dates of surgery and death. Time to recurrence (TTR) was defined as the interval between the dates of surgery and the dates of any diagnosed recurrence (intrahepatic recurrence and extrahepatic metastasis). For surviving patients, the data were censored at the date of death or final follow-up.
Multiplex quantitative immunofluorescence
The multiplex quantitative immunofluorescence staining for TMAs slides was performed as previously described.Citation16–Citation19 Slides were fluorescently stained with Opal 7-Color Manual IHC Kit (NEL811001KT) according to the manufacturer’s description. Multispectral images of arrays were acquired using Vectra Polaris multispectral imaging system (PerkinElmer), and quantitative positivity of primary antibodies was analyzed using inForm Tissue Finder software (PerkinElmer).
Cell isolation and single-cell sequencing
Paired fresh tissues of cancerous and adjacent noncancerous liver tissue were obtained during surgical resection. Tissues were put into RPMI 1640 containing 10% FBS and cut up into a slurry with sterilized surgical scissors followed by gentle rocking for 30 to 45 min at 37°C RPMI 1640 medium containing 0.1% (m/v) collagenase IV. Suspension was then filtered on a 40uM strainer and centrifuged at 1100 rpm for 10 min. Supernatant was discarded. After erythrocyte lysis, the precipitate was washed and prepared for flow cytometry.
Single-cell suspension was stained with FACS buffer containing 0.5% CD3 (Biolegend, Cat No.300308, Clone HIT3a), and 0.5% CD45RO (Biolegend, Cat No.304210, Clone UCHL1) antibodies, then incubated at 4°C for 30 min. After washing, cells were resuspended for Fluorescent cell sorting. CD3+CD45RO+ T cells were sorted by using BD FACS Aria II.
For scRNA, isolated cells were counted in duplicate with a hemocytometer, diluted to 700–1200 cells/μl requiring a minimum cell viability of 70%. Single cells were separated on a Chromium controller (10XGenomics) following the manufacturer’s recommendations and previous study.Citation20 Library construction was performed using Single-Cell 3ʹ Reagent Kits V2 (10xGenomics, Pleasanton, California), which produces illumina-ready sequencing libraries. After quality control by fragment analysis (AATI), libraries were sequenced by Illumina sequencer. Sequencing data from Illumina sequencer was processed with Cell Ranger pipeline (version 2.1.1, 10XGenomics) using default settings. Cell was only included if the number of expressed genes were greater than 200 and mitochondrial genes expression ratio was less than 5%. Gene expression matrix was normalized using log scale. Results were used for subsequent clustering analysis and visualized as a PCA.
Generation of CART
The vector of anti-mesothelin chimeric antigen receptor (CAR) is constructed for the engineering of T cells to target human mesothelin. We constructed and evaluated fully human anti-mesothelin CARs comprised of a human mesothelin-specific single-chain antibody variable fragment (P4 scFv) coupled to T cell signaling domains. All CARs contained the SS1 scFv against human mesothelin protein. The mesothelin CAR was previously described.Citation21 The BBz CAR contained the scFv linked to the CD137 intracellular portion and the CD3z domain through a CD8a hinge and transmembrane domain.Citation22 For preparation of in-vitro-tran-scribed (IVT) RNA, the CAR-encoding gene constructs were subcloned into the pGEM.64A-based vector, as described previously.Citation23 CD137 CART cells were co-cultured with cancer cell line H226, with cell ratios of 1:1, 6:1, respectively. Cells were cultured in X-VIVO medium containing 100 u/ml IL-2 and followed by centrifugation after 24 h, then supernatant was collected and detected by using Pierce LDH Cytotoxicity Assay Kit (Thermo Fisher, Cat No. 88953). The data were statistically analyzed using the software Graphpad prism 5. The significant differences of LDH were measured by t-test, P < .05 was considered statistically significant.
FACS analysis
Cells were stained with CD3 (BioLegend, clone: HIT3a), CD8 (BioLegend, clone: SK1), CD45RO (Biolegend, clone: UCHL1), CD137(Biolegend, clone: 4B4-1), BCL2 (Cell Signaling Technology, clone: 124), Ki67 (Abcam, clone: B126.1), GZMA (Biolegend, clone:CB9), HLA-DR(Biolegend, clone:L243). For intracellular staining, cells were given PMA/ionomycin (Biolegend, 423303) re-stimulation and then intracellular staining was performed as previously described.Citation24 FACS analysis was performed on a BD FACS Aria II flow cytometer and analyzed by FlowJo6 software.
Statistics of clinical characteristics
For research on the relationship between multi-labeled immunofluorescence results of TMAs and clinical information, contingency table analysis and χ2 tests were used. We counted positive rates of CD8+, CD8+PD-1+, CD4+, CD4+PD-1+, CD4+FOXP3+ cells in duplicate for each dot; The averages of positive rates were calculated for every patient. Then, positive rates of CD8+, CD8+PD-1+, CD4+, CD4+PD-1+, CD4+FOXP3+ cells of tumor or peritumor TMAs were divided into high expression group and low expression group in terms of cut point of overall survival (OS) judged by X-tile 3.5.0. Other clinical indicators were also divided into two groups according to certain clinical standards, as shown in Table S1. The chi-square test was conducted with SPSS statistics 17 software. A P value <.05 was considered statistically significant.
For research of survival or recurrence rates, OS and time to recurrence (TTR) curves were plotted according to Kaplan–Meier in GraphPad Prism 5. Basis for grouping of TTR was the same as aforementioned OS statistics. Life tables were performed using SPSS statistics to evaluate 1,3 and 5 year survival and recurrence rates. For univariate and multivariate analysis of hazard ratio, a COX regression analysis was performed with SPSS statistics.
Results
Tumor characteristics and clinical information
We developed tissue array of 117 HCC patients and summarized clinical characteristics of them in . Each patient has more than 5-year follow-up. By the end of 5 years, 59.8% (70/117) of patients suffered a recurrence and 48.7% (57/117) died. The 1, 3, and 5 year overall survival (OS) rates were 80%, 57%, and 49% and the cumulative recurrence rates were 42%, 56%, and 62%, respectively. Fifteen key clinicopathological features were calculated by univariate and multivariate analysis to test their correlation with OS and time to recurrence (TTR) of HCC (Table S1). Among them, γ-glutamyl transferase (γ-GT) was the sole significant variable of OS and TTR in both univariate and multivariate analyses (P < .01, Table S1).
Figure 1. Summary of clinical information and tumor immune microenvironment. (a) We developed tissue array of 117 HCC patients and summarized clinical characteristics. Each patient has more than 5-year follow-up. (b) Opal multicolor IHC staining with anti-CD8, anti-CD4, anti-PD-1, FOXP3 antibodies, and DAPI. (c) Comparison of CD8+, CD8+PD-1+, CD4+, CD4+PD-1+ and CD4+FOXP3+ expression between ANT and TM
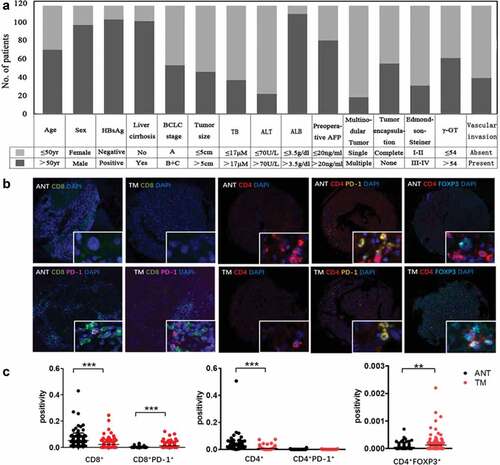
The presence of infiltrating lymphocytes in the tumor core (TM) or adjacent non-cancerous tissue (ANT) was investigated using multiplex quantitative immunofluorescence staining with CD8, PD-1, CD4, FOXP3, and DAPI (). We observed that although the percentage of CD8+ T and CD4+ T cells were much lower in the tumor core, the frequency of CD8+PD1+ cells (CD8+-Tex) was increased in the tumor core (P < .001, ). We considered FOXP3 and CD4 double positive cells as Treg since FOXP3 is a master regulator in the development and function of Treg. More CD4+FOXP3+ cells infiltrated in tumor core were observed (P < .01, ). All the data highlighted the immunosuppressive nature of the tumor microenvironment of HCC.
Specific T cell populations in HCC are differentially clinically relevant
Firstly we found the location of CD8+T cell subsets is differentially clinically relevant in HCC. Although the overall survival rate remained unchanged in ANT and ANT+TM (,), Increased CD8+T cell infiltration in TM (CD8+_TMhigh) was strong predictor of survival (1y: 87% vs 76%; 3y: 71% vs 48%; 5y: 59% vs 42%) (). We then extended our analysis to the PD-1 expression of CD8+T cell. The exhaustion status of T cells was identified as double positive of CD8 and PD1 markers (). Less exhausted CD8+T cell in ANT (CD8+PD-1+_ANTlow) predicts higher survival rates of patients (1y: 84% vs 73%; 3y: 65% vs 41%; 5y: 55% vs 38%) (). However, there was no statistical difference in the prognostic value of these parameters from TM or ANT+TM ().
Figure 2. OS curves from ANT and TM in HCC. OS curves were plotted in GraphPad Prism 5. The horizontal axis showed time after surgery and the vertical axis showed overall survival rates by the corresponding time. Two sets of data (low vs. high) were represented by black and red curve, respectively. P < .05 was considered statistically significant. OS, overall survival; ANTlow, low expression of indicated biomarkers in ANT; ANThigh, high expression of indicated biomarkers in ANT; TMlow, low expression of indicated biomarkers in TM; TMhigh, high expression of indicated biomarkers in TM; ANT+TMlow, low expression of indicated biomarkers in both ANT and TM; ANT+TMhigh, high expression of indicated biomarkers in both ANT and TMTTR curves from ANT and TM in HCC TTR curves were plotted in GraphPad Prism 5. The horizontal axis showed time after surgery and vertical axis showed probability of recurrence. Two sets of data (low vs. high) were represented by black and red curve, respectively. P < .05 was considered statistically significant. TTR, time to recurrence; ANTlow, low expression of indicated biomarkers in ANT; ANThigh, high expression of indicated biomarkers in ANT; TMlow, low expression of indicated biomarkers in TM; TMhigh, high expression of indicated biomarkers in TM; ANT+TMlow, low expression of indicated biomarkers in both ANT and TM; ANT+TMhigh, high expression of indicated biomarkers in both ANT and TM
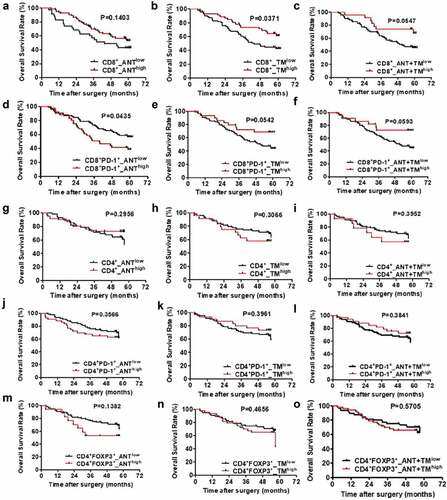
Interestingly, we found although CD4+T cells play an important role in the development of effective antitumor immunity, in contrast to CD8+T cell, the positive rates of CD4+, CD4+PD-1+, CD4+FOXP3+ cells of TM or ANT have no significant correlation with the overall survival rate of HCC patients ().
Next, we compared the predictive value of the specific cell populations involvement on recurrence risk ().CD8+_TMlow patients had poorer prognosis for more recurrence than CD8+_TMhigh individuals (1y: 49% vs 30%; 3y: 63% vs 44%; 5y: 67% vs 54%, P < .05) (). The probability remained similar between groups in cells from ANT or ANT+TM (). We also discovered that CD8+PD-1+_ANThigh predicts higher cumulative recurrence than CD8+PD-1+_ANTlow (1y: 51% vs 37%; 3y: 73% vs 46%; 5y: 77% vs 54%) ().However, the recurrence rates of CD8+PD-1+_TMlow were significantly higher than those of CD8+PD-1+_TMhigh patients (1y: 47% vs 28%; 3y: 60% vs 42%; 5y: 67% vs 47%) ().Besides, we calculated the CD8+PD-1+T cells in both TM and ANT (CD8+PD-1+_ANT+TM), and found that the less CD8+PD-1+T cells correlated with higher recurrence rates (1y: 45% vs 27%; 3y: 59% vs 42%; 5y: 66% vs 42%) (). In contrast to CD4+ and CD4+PD-1+ cells (P > .05, ), CD4+FOXP3+ cells showed strong association with the probability of cancer recurrence in ANT or ATN+TM (P < .05, ) although weaker correlation observed in TM (P = .0557, ).
We then analyzed the correlation between the percentage of infiltrated CD8+ or CD8+PD-1+ T cells and 15 clinicopathologic characteristics by using χ2 test and Kaplan–Meier Curve (Table S2). Total bilirubin (TB) level has positive correlation with CD8+T cell infiltration in ANT (CD8+_ANThigh) (P = .045). Also in ANT, HBsAg infection predicts more CD8+-Tex (P = .039). On the contrary, increased alanine aminotransferase (ALT) level associated with less CD8+-Tex (P = .006). Larger tumor size negatively correlated with CD8+T cell infiltration in TM (P = .02). Advanced Edmondson-Steiner grade (III–IV) was significant predictor of decreased CD8+ T cell in TM (P = .049), more CD8+PD1+T cell infiltrated in TM or ANT+TM (both P = .001). Detailed information is shown in Table S2.
At last, we analyzed the correlation between CD4+, CD4+PD-1+ or CD4+FOXP3+T cells infiltration and 15 clinicopathologic characteristics as well (Table S3). Increased albumin (ALB) predicts less CD4+T cell accumulated in ANT (P < .05). Similarly, liver cirrhosis correlated with CD4+T cell in TM (P = .003). However, γ-GT negatively correlated with CD4+T cell in TM (P = .013). More multinodular tumor is negative predictor of CD4+T cell infiltration in both ANT and TM (P = .023). The presence of vascular invasion is significantly correlated with the number of CD4+FOXP3+ T cells in ANT as well (P < .05). Advanced Edmondson-Steiner grade is negative predictor of CD4+FOXP3+T cells infiltration in TM or ANT+TM (P < .05). γ-GT significantly correlated with CD4+FOXP3+T cells infiltration in TM or ANT+TM as well (P < .05). For tumors of bigger size, enhanced CD4+FOXP3+T cells infiltration is observed in combined ANT+TM (P < .05). Detailed information is shown in Table S3.
The study systemically analyzed the composition, the location, and exhausted states of five important T cell subsets in human HCC and their correlation with long-term clinical outcomes and clinical tests. These T cell subsets differentially linked to overall and recurrence-free survival. Especially, around cutting margins, CD8+T lymphocytes have favorable effects on survival.
Single-cell transcriptomics to explore T cells subsets in HCC
To determine the heterogeneity of Tex we applied scRNA on 4876 sorted CD3+CD45RO+ cells from the HCC ANT or 3171 CD3+CD45RO+ cells from HCC TM to understand why these subsets have different impacts on long-term clinical outcome (). CD8A and IL-7 R were used as markers to classify CD8+ or CD4+T cells. We found CD8+T cells were the dominant population in ANT. In contrast, CD4+T cells made up most of CD3+CD45RO+ cells infiltrated in TM (). Consistent with the previous reportsCitation25 and earlier observations (), there were less CD8+T cells in the TM than in the ANT (), again highlighting inefficient CD8+T cell infiltration. Notably, the presence of CD8+PDCD1++ and CD4+FOXP3+T cells in the TM, which was greater than in the ANT (), further demonstrated the exhausted nature of CD8+T cells and the immunosuppressive microenvironment in HCC.
Figure 3. TTR curves from ANT and TM in HCC
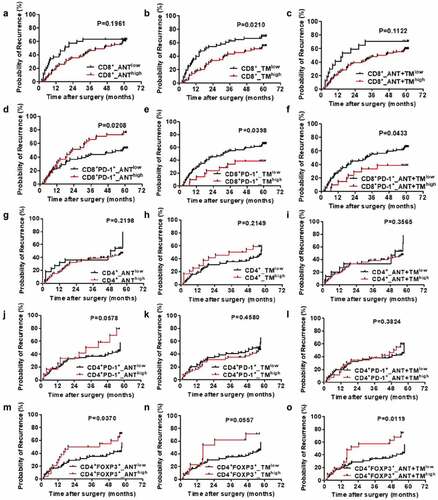
Figure 4. Clustering tumor-infiltrating T cells in ANT and TM of HCC
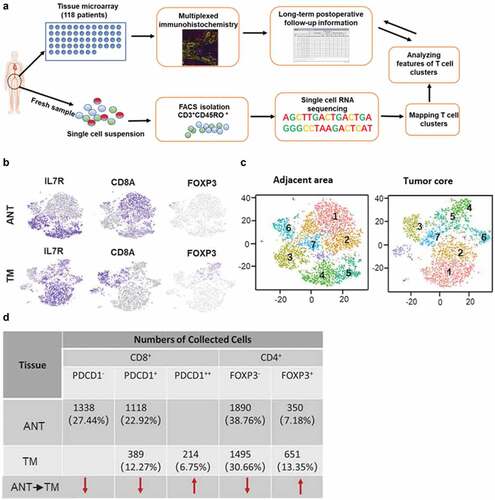
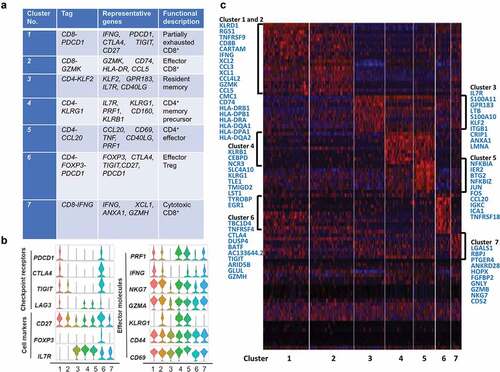
To reveal the intrinsic structure and potential functional subtypes of the overall T cell populations, we performed unsupervised clustering of all T cells using spectral clustering. For the ANT, a total of seven stable clusters emerged, including three clusters for CD8+ cells, four clusters for CD4+ cells, each with its unique signature genes (). Notably, cells in the CD8-PDCD1 cluster were dominant in ANT (22.27%) and expressed multiple known exhaustion marker genes such as TNFRSF9, TIGIT, PDCD1, and CD27. Cells in the CD8-GZMK cluster, were characterized by the high expression of the CD74, CCL5, and HLA-DPA1 genes. This cluster attends to be an intermediate state between effector and exhausted T cells based on its transcripts. These two CD8+ T cell clusters accounted for 44.48% of ANT cells, while the third CD8+T cell cluster, CD8-IFNG, expressed high levels of effector genes GZMH, ANXA1, and CD63, thus representing effector CD8+T cells. Regulatory T cells (Treg) were detected in the CD4-FOXP3 and accounted for 7.18% of ANT cells. The key genes for clustering in T cells of ANT were shown in Table 5A. Comparison of cell markers, checkpoint receptors, effector molecules, and top genes of each cluster was shown in ,.
Figure 5. T cell subtype analysis of ANT based on single-cell gene expression (a) Seven stable T cell clusters, corresponding signature genes, and functional description of ANT. (b) Violin plots showing the expression profile of multiple inhibitory receptors, cell markers, and effector molecules in each cluster corresponding to the ANT. Each violin plot shows both distribution and density of the indicated gene. (c) Heatmap of top selected genes among seven clusters of ANT
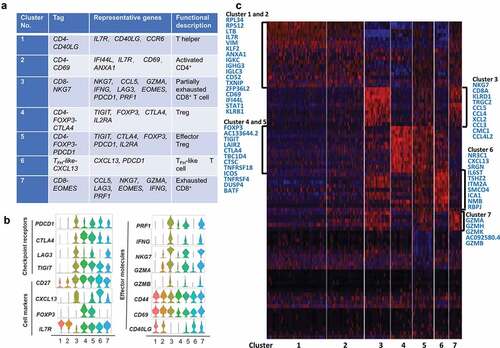
A similar analysis for the TM, revealed a total of seven stable clusters, including four clusters for CD4+ cells, two clusters for CD8+ cells, and one cluster for TFH-like cells (). Cells in the CD4-CD40LG cluster were the most abundant (29.30% of TM) and expressed multiple known antigen recognition or antigen-binding genes such as IGLC3, IGHG3, IGKC, LTB, IL7 R, and ANXA1, as well as genes encoding ribosomal proteins (not shown). These results suggest that in response to extracellular signals, effector CD4+T cells coordinately increase multiple ribosomal components to accommodate burgeoning cytokine production. Cells in the CD4-CD69 cluster expressed high levels of CD69, which is typically an early T cell activation marker, however, recent studies reported that CD69+CD4+CD25−T cells might be a new subset of CD4+Treg cells and increase dramatically during tumor progression.Citation26,Citation27 Moreover, two other clusters, CD4-FOXP3-PDCD1 and CD4-FOXP3-CTLA4, shared most of Treg signature genes and well-defined immune checkpoints genes expression, also expressing elevated GITR and OX40, which were critical in extending the survival of T effector cells. Finally, cells in the CD8-NKG7 cluster presented a signature of partial exhaustion, with expression of LAG3, CCL5, GZMA, IFNG, PRF1, and PDCD1, while cells in the CD8-EOMES cluster also expressed exhaustion genes, while having lower expression of NKG7, IFNG, and PRF1 compared to the CD8-NKG7 cluster. This leads us to conclude that both clusters contained partially exhausted CD8+ effector T cells, and that the differentially expressed genes between these two clusters reflect heterogeneity and gradual development of CD8+T cells exhaustion. The increased population of Treg in the TM and the extensive expression co-inhibitory receptors is likely to support the immune-suppressive nature of the tumor microenvironment. Comparison of cell markers, checkpoint receptors, effector molecules, and top genes of each cluster was shown in ,.
Figure 6. T cell subtype analysis of TM based on single-cell gene expression (a) Seven T cell clusters, corresponding signature genes and functional description of TM. (b) Violin plots showing the expression profile of multiple inhibitory receptors, cell markers, and effector molecules in each cluster corresponding to the TM. Each violin plot shows both distribution and density of the indicated gene. (c) Heatmap of top genes in each cluster of ANT
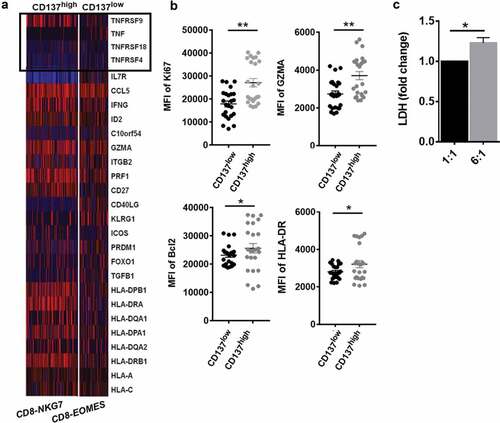
Next, we compared the effector function of the two CD8+T cell clusters of TM. Firstly, we found the mRNA level of TNFRSFs was distinct in the two CD8+T cell clusters (). C3-CD8-NKG7 cells highly expressed TNFRSF9+(CD137) gene and C7-CD8-EOMES expressed lower level of CD137. Notably, the CD137high CD8+ T cells increasingly expressed IFNG, and CD27 which is required for generation and long-term maintenance of T cell immunity. Besides, the protein level of anti-apoptosis and proliferation genes (Bcl2, GZMA, HLA-DR, Ki67) increased in CD137highCD8+T cells as well. To confirm that the difference was due to the signaling domains of the receptor, we generated CD137 CART cells to test the cytotoxicity of CD137 activated CD8+T cells based on lactate dehydrogenase release (). CD137 CART cells were co-cultured with cancer cell with cell ratios of 1:1, 6:1, respectively. The data indicate that CD137 CART cells kill tumor cells in the dose-dependent manner (). Thus, in immunosuppressive microenvironment of HCC, most CD8+T cells expressed multiple exhausted markers (). CD137, a costimulatory molecule highly expressed on some exhausted T cells, maintained Tex cell survival and anti-tumor immunity in TM of HCC.
Figure 7. CD137 enriched CD8+T cell with superior effector function in HCC TM (a) Heatmap of scRNA showing differentially expressed genes of tumor necrosis factor (TNF) and TNF-receptor superfamily. (b) The comparison of CD137highCD8+T cell and CD137lowCD8+T cell including Ki67, GZMA, HLA-DR, and Bcl2 from tumor tissue of HCC patients was analyzed through flow cytometry. (c) The cytotoxicity of CD137 activated CD8+T cells. CD137 CART cells were co-cultured with cancer cell line H226, with cell ratios of 1:1, 6:1, respectively. After 24 h, the supernatant was collected and detected by using pierce LDH cytotoxicity assay kit. P < .05 was considered statistically significant. *, P < .05; **, P < .01
Discussion
The poor outcome of HCC patients results from metastases and/or postsurgical recurrence of the primary tumor. The association between intra-tumoral T-cell accumulation and improved survival in cancer predicts a role for tumor-specific T-cell activity in tumor control. Thus, a better understanding of T cell subsets in microenvironment of HCC will aid in designing improved immunotherapies. In the study, we aim to answer 1) the composition, location, molecular profiles of CD4+T, CD8+T cells including exhausted subsets in HCC microenvironment; 2) clinical relevance of T cell subsets.
CD4+T cell, CD8+T cell, and Treg are important T-cell subsets of tumor immunity; however, our data found that their presence and location differentially correlated with the long-term clinical outcome of HCC (–). In the study, although CD4+T cell is considered as the essential helper for cytotoxic CD8+T cell, they have no impact on the prognosis of HCC in the study. Treg especially located in adjacent area, is significantly associated with early recurrence. Although the role of Treg in tumor progression has been extensively investigated and Treg-mediated immune suppression has emerged as a crucial mechanism of tumor evasion,Citation28 the relevance to human disease or prevention strategies remains to be defined. Why Treg links to early recurrence of patients with HCC? In the study, a plausible explanation for it is Treg of the cutting-edge plays an important role of affecting CD8+T cells on killing residual tumor cells after surgery. As reported,Citation29 our study confirms again that CD8+T cells are closely related to long-term survival and recurrence of HCC patients. Interestingly, exhausted CD8+T cells in adjacent non-cancerous liver tissue show a superior prognostic value compared to CD8+-Tex of tumor core. The data highlights that spatial transcriptomic analysis of immune cells is critical for understanding their role in tumor. The clinically relevant finding prompted us to explore the heterogeneity of T cell phenotypes of HCC.
By single-cell transcriptional analysis, we found that the composition of CD4+-Tex, CD8+-Tex, and FOXP3+-Treg was shifted in tumor and adjacent tissue. A wider range of genes coding co-inhibitory receptor expression is present in tumor core. T cells transition from activation to exhaustion at a later period, as judged by expression of key exhaustion genes. We observed that distinct CD8+ T cells subsets co-existed in HCC tumors and surrounding tissue, including the CD8-IFNG (effector CD8+ T cells), CD8-GZMK (as reported as transitional CD8+T cellsCitation25) and CD8-PDCD1 cells (exhausted CD8+T cells) associated into a relative process in pseudo-time. In the study, 88.03% of HCC patients have HBV infection history (Table S3). Therefore, the heterogeneity of CD8+-Tex is induced by chronic antigen activation presented by both tumor and virus infection. For example, the top-overexpressed genes of the third cluster of TM are abundant of genes related to lymphocyte chemotaxis and response to virus (CCL5, CCL4, XCL2, CCL3, CCL4L2, etc.). Thus, the long-term persisting HBV infections result in an additional driver of heterogeneity in the pool of exhausted T cells.Citation5,Citation30
In comparison to CD8+T cell, most CD4+T cells rarely expressed the checkpoint receptors (PD1, CTLA4, LAG3, TIGIT). Indeed, no clear exhaustion signature of most CD4+T cells compared to memory CD4+T cells. Previous work suggests one possible impact of chronic viral infection is skewing of CD4+T cells toward follicular helper T (Tfh).Citation31 Tfh cells are a subset of CD4+T cells specialized to regulate antibody responses and clear infection.Citation32 The Tfh cells are characterized by the expression of CXC chemokine receptor 5 (CXCR5), inducible T-cell costimulatory (ICOS), PD-1, B cell lymphoma 6 (BCL-6), and IL-21.Citation32 While several of these markers are also features of exhausted T cells and might suggest a possible Tfh skewing, some can also reflect recent T cell activation. As shown in ,, the sixth cluster “TFH-like-CXCL13” remarkably expressed multiple co-inhibitory receptors (PD1, CTLA-4, TIGIT). However, whether these PD-1+Tfh cells origin from exhausted CD4+T cells need further study. Meanwhile, their impact on antiviral/antitumor immunity of HCC barely has been reported.Citation33 HBV-related HCC patients lack effective B cell antibody responses.Citation28 To study the function of these PD-1-expressing Tfh cells will help to understand the defects in B cell immunity of HCC.
On the other hand, FOXP3+Treg extensively expressed genes coding co-inhibitory receptors. In both ANT and TM, the cluster CD4-FOXP3-PDCD1 highly expressed PDCD1 which has been identified as effector Treg.Citation34 As reported, the presence of actively proliferating PD-1+effector Treg cells in tumors is a reliable marker for hyper-progressive disease (HPD).Citation34 PD-1 blockade facilitates the proliferation of highly suppressive PD-1+effector Treg cells in HPD, resulting in inhibition of antitumor immunity.Citation34
Conclusion
In summary, this work reveals the heterogeneity of the CD4+ and CD8+ T cell exhaustion and their correlation with clinical outcome of HCC patients. Especially, the clinical prognostic role of Tex in non-cancerous adjacent tissue, suggesting the importance of immune status assessment in the tumor periphery. Single-cell transcriptional analysis allowed us to gain insight into the unique differentiation of “exhausted” CD4+T cells or CD8+T cells. A molecular profile distinct from effector or memory CD4+T cells and also from exhausted CD8+T cells, though some common features of CD4+ and CD8+ T cell exhaustion were revealed. Understanding the heterogeneity of these T cell populations and their clinical relevance rationalizes the combined therapy for selectively targeted.
Availability of data and material
All remaining data are available within the article and supplementary files, or available from the authors upon request.
Authors’ contributions
DW had full access to all of the data in the study and takes responsibility for the integrity of the data and the accuracy of the data analysis. DW, YS, and XW: contribution to study design. FL, WL, LW, HW, and MT: acquisition of data. FL, MT, GJ, and BZ: analysis and interpretation of data. FL and DW: drafting of the manuscript. YS, XW, and DS: critical revision of the manuscript for important intellectual content. FL and WL: statistical analysis. DW: study supervision.
Consent for publication
All authors have agreed to publish this manuscript.
Disclosure of potential conflicts of interest
No potential conflicts of interest were disclosed.
Ethics approval and consent to participate
This study was received and approved by the Ethics Committee of Zhongshan Hospital, Fudan University.
Supplemental Material
Download ()Acknowledgments
The authors thank WuXi NextCODE Genomics (Shanghai) Co., Ltd. for scRNA data generation and analysis. Also we thank Gracell Biotechnologies (Shanghai) Co., Ltd. for CART cells generation.
Additional information
Funding
References
- Bruix J, Gores GJ, Mazzaferro V. Hepatocellular carcinoma: clinical frontiers and perspectives. Gut. 2014;63(5):844–12. 10.1136/gutjnl-2013-306627.
- Forner A, Reig M, Bruix J. Hepatocellular carcinoma. Lancet. 2018;391(10127):1301–1314. doi:10.1016/S0140-6736(18)30010-2.
- Hashimoto M, Kamphorst AO, Im SJ, Kissick HT, Pillai RN, Ramalingam SS, Araki K, Ahmed R. CD8 T cell exhaustion in chronic infection and cancer: opportunities for interventions. Annu Rev Med. 2018;69:301–318. doi:10.1146/annurev-med-012017-043208.
- Budhu A, Forgues M, Ye Q-H, Jia H-L, He P, Zanetti KA, Kammula US, Chen Y, Qin L-X, Tang Z-Y, et al. Prediction of venous metastases, recurrence, and prognosis in hepatocellular carcinoma based on a unique immune response signature of the liver microenvironment. Cancer Cell. 2006;10(2):99–111. doi:10.1016/j.ccr.2006.06.016.
- Wherry EJ, Kurachi M. Molecular and cellular insights into T cell exhaustion. Nat Rev Immunol. 2015;15(8):486–499. doi:10.1038/nri3862.
- Ferris RL, Lu B, Kane LP. Too much of a good thing? Tim-3 and TCR signaling in T cell exhaustion. J Immunol. 2014;193(4):1525–1530. doi:10.4049/jimmunol.1400557.
- Bengsch B, Johnson AL, Kurachi M, Odorizzi PM, Pauken KE, Attanasio J, Stelekati E, McLane LM, Paley MA, Delgoffe GM, et al. Bioenergetic insufficiencies due to metabolic alterations regulated by the inhibitory receptor PD-1 are an early driver of CD8(+) T cell exhaustion. Immunity. 2016;45(2):358–373. doi:10.1016/j.immuni.2016.07.008.
- Pauken KE, Wherry EJ. SnapShot: T cell exhaustion. Cell. 2015;163(4):1038–1038. e1031. doi:10.1016/j.cell.2015.10.054.
- Zhou G, Sprengers D, Boor PP, Doukas M, Schutz H, Mancham S, Pedroza-Gonzalez A, Polak WG, de Jonge J, Gaspersz M, et al. Antibodies against immune checkpoint molecules restore functions of tumor-infiltrating T cells in hepatocellular carcinomas. Gastroenterology. 2017;153(4):1107–1119. e1110. 10.1136/gutjnl-2013-306627.
- Huang AC, Postow MA, Orlowski RJ, Mick R, Bengsch B, Manne S, Xu W, Harmon S, Giles JR, Wenz B, et al. T-cell invigoration to tumour burden ratio associated with anti-PD-1 response. Nature. 2017;545(7652):60. doi:10.1038/nature22079.
- Yost KE, Satpathy AT, Wells DK, Qi Y, Wang C, Kageyama R, McNamara KL, Granja JM, Sarin KY,Brown RA, et al. Clonal replacement of tumor-specific T cells following PD-1 blockade. Nat Med.2019;25(8):1251–1259.doi:10.1038/s41591-019-0522-3.
- Popovic A, Jaffee EM, Zaidi N. Emerging strategies for combination checkpoint modulators in cancer immunotherapy. J Clin Invest. 2018;128(8):3209–3218. doi:10.1172/JCI120775.
- Gao Q, Qiu S-J, Fan J, Zhou J, Wang X-Y, Xiao Y-S, Xu Y, Li Y-W, Tang Z-Y. Intratumoral balance of regulatory and cytotoxic T cells is associated with prognosis of hepatocellular carcinoma after resection. J Clin Oncol. 2007;25(18):2586–2593. doi:10.1200/JCO.2006.09.4565.
- Wittekind C. Pitfalls in the classification of liver tumors. Pathologe. 2006;27(4):289–293. doi:10.1007/s00292-006-0834-1.
- Sun H-C, Zhang W, Qin L-X, Zhang B-H, Ye Q-H, Wang L, Ren N, Zhuang P-Y, Zhu X-D, Fan J, et al. Positive serum hepatitis B e antigen is associated with higher risk of early recurrence and poorer survival in patients after curative resection of hepatitis B-related hepatocellular carcinoma. J Hepatol. 2007;47(5):684–690. doi:10.1016/j.jhep.2007.06.019.
- Agarwal S, Gertler FB, Balsamo M, Condeelis JS, Camp RL, Xue X, Lin J, Rohan TE, Rimm DL. Quantitative assessment of invasive mena isoforms (Mena calc) as an independent prognostic marker in breast cancer. Breast Cancer Res. 2012;14(5):R124. doi:10.1186/bcr3318.
- Feng Z, Jensen SM, Messenheimer DJ, Farhad M, Neuberger M, Bifulco CB, Fox BA. Multispectral imaging of T and B cells in murine spleen and tumor. J Immunol. 2016;196(9):3943–3950. doi:10.4049/jimmunol.1502635.
- Bakdash G, Buschow SI, Gorris MA, Halilovic A, Hato SV, Sköld AE, Schreibelt G, Sittig SP, Torensma R, Duiveman-de Boer T, et al. Expansion of a BDCA1+CD14+ myeloid cell population in melanoma patients may attenuate the efficacy of dendritic cell vaccines. Cancer Res. 2016;76(15):4332–4346. doi:10.1158/0008-5472.CAN-15-1695.
- Shipitsin M, Small C, Giladi E, Siddiqui S, Choudhury S, Hussain S, Huang YE, Chang H, Rimm DL, Berman DM, et al. Automated quantitative multiplex immunofluorescence in situ imaging identifies phospho-S6 and phospho-PRAS40 as predictive protein biomarkers for prostate cancer lethality. Proteome Sci. 2014;12(1):40. doi:10.1186/1477-5956-12-40.
- Rodda LB, Lu E, Bennett ML, Sokol CL, Wang X, Luther SA, Barres BA, Luster AD, Ye CJ, Cyster JG, et al. Single-cell RNA sequencing of lymph node stromal cells reveals niche-associated heterogeneity. Immunity. 2018;48(5):1014–1028. e1016. doi:10.1016/j.immuni.2018.04.006.
- Carpenito C, Milone MC, Hassan R, Simonet JC, Lakhal M, Suhoski MM, Varela-Rohena A, Haines KM, Heitjan DF, Albelda SM, et al. Control of large, established tumor xenografts with genetically retargeted human T cells containing CD28 and CD137 domains. Proc Natl Acad Sci U S A. 2009;106(9):3360–3365. doi:10.1073/pnas.0813101106.
- Milone MC, Fish JD, Carpenito C, Carroll RG, Binder GK, Teachey D, Samanta M, Lakhal M, Gloss B, Danet-Desnoyers G, et al. Chimeric receptors containing CD137 signal transduction domains mediate enhanced survival of T cells and increased antileukemic efficacy in vivo. Mol Ther. 2009;17(8):1453–1464. doi:10.1038/mt.2009.83.
- Zhao Y, Moon E, Carpenito C, Paulos CM, Liu X, Brennan AL, Chew A, Carroll RG, Scholler J, Levine BL, et al. Multiple injections of electroporated autologous T cells expressing a chimeric antigen receptor mediate regression of human disseminated tumor. Cancer Res. 2010;70(22):9053–9061. doi:10.1158/0008-5472.CAN-10-2880.
- Wu D, Sanin DE, Everts B, Chen Q, Qiu J, Buck MD, Patterson A, Smith A, Chang C-H, Liu Z, et al. Type 1 interferons induce changes in core metabolism that are critical for immune function. Immunity. 2016;44(6):1325–1336. doi:10.1016/j.immuni.2016.06.006.
- Zheng C, Zheng L, Yoo J-K, Guo H, Zhang Y, Guo X, Kang B, Hu R, Huang JY, Zhang Q, et al. Landscape of infiltrating T cells in liver cancer revealed by single-cell sequencing. Cell. 2017;169(7):1342–1356. e1316. doi:10.1016/j.cell.2017.05.035.
- Zhu J, Feng A, Sun J, Jiang Z, Zhang G, Wang K, Hu S, Qu X. Increased CD4+CD69+CD25- T cells in patients with hepatocellular carcinoma are associated with tumor progression. J Gastroenterol Hepatol. 2011;26(10):1519–1526. doi:10.1111/j.1440-1746.2011.06765.x.
- Han Y, Guo Q, Zhang M, Chen Z, Cao X. CD69+CD4+CD25−T cells, a new subset of regulatory T cells, suppress T cell proliferation through membrane-bound TGF-β1. J Immunol. 2009;182(1):111–120. doi:10.4049/jimmunol.182.1.111.
- Miyara M, Sakaguchi S. Natural regulatory T cells: mechanisms of suppression. Trends Mol Med. 2007;13(3):108–116. doi:10.1016/j.molmed.2007.01.003.
- Mahmoud SM, Paish EC, Powe DG, Macmillan RD, Grainge MJ, Lee AH, Ellis IO, Green AR. Tumor-infiltrating CD8+ lymphocytes predict clinical outcome in breast cancer. J Clin Oncol. 2011;29(15):1949–1955. doi:10.1200/JCO.2010.30.5037.
- McLane LM, Abdel-Hakeem MS, Wherry EJ. CD8 T cell exhaustion during chronic viral infection and cancer. Annu Rev Immunol. 2019;37:457–495. doi:10.1146/annurev-immunol-041015-055318.
- Fahey LM, Wilson EB, Elsaesser H, Fistonich CD, McGavern DB, Brooks DG. Viral persistence redirects CD4 T cell differentiation toward T follicular helper cells. J Exp Med. 2011;208(5):987–999. doi:10.1084/jem.20101773.
- Jogdand GM, Mohanty S, Devadas S. Regulators of Tfh cell differentiation. Front Immunol. 2016;7:520. doi:10.3389/fimmu.82016.00520.
- Zhou ZQ, Tong DN, Guan J, Tan HW, Zhao LD, Zhu Y, Yao J, Yang J, Zhang ZY. Follicular helper T cell exhaustion induced by PD-L1 expression in hepatocellular carcinoma results in impaired cytokine expression and B cell help, and is associated with advanced tumor stages. Am J Transl Res. 2016;8(7):2926–2936.
- Kamada T, Togashi Y, Tay C, Ha D, Sasaki A, Nakamura Y, Sato E, Fukuoka S, Tada Y, Tanaka A, et al. PD- regulatory T cells amplified by PD-1 blockade promote hyperprogression of cancer. Proc Natl Acad Sci USA. 2019;116(20):9999–10008. doi:10.1073/pnas.1822001116.