
ABSTRACT
Epithelial Ovarian cancer (EOC) is the most lethal gynecological malignancy and has limited curative therapeutic options. Immunotherapy for EOC is promising, but clinical efficacy remains restricted to a small percentage of patients. Several lines of evidence suggest that the low response rate might be improved by combining immunotherapy with carboplatin and paclitaxel, the standard-of-care chemotherapy for EOC. Here, we assessed the immune contexture of EOC tumors, draining lymph nodes, and peripheral blood mononuclear cells during carboplatin/paclitaxel chemotherapy. We observed that the immune contexture of EOC patients is defined by the tissue of origin, independent of exposure to chemotherapy. Summarized, draining lymph nodes were characterized by a quiescent microenvironment composed of mostly non-proliferating naïve CD4 + T cells. Circulating T cells shared phenotypic features of both lymph nodes and tumor-infiltrating immune cells. Immunologically ‘hot’ ovarian tumors were characterized by ICOS, GITR, and PD-1 expression on CD4 + and CD8 + cells, independent of chemotherapy. The presence of PD-1 + cells in tumors prior to, but not after, chemotherapy was associated with disease-specific survival (DSS). Accordingly, we observed high MHC-I expression in tumors prior to chemotherapy, but minimal MHC-I expression in tumors after neoadjuvant chemotherapy, even though there were no differences in the number of tumor-infiltrating lymphocytes (TIL) in both groups. We therefore speculate that the TIL influx into the chemotherapy tumor microenvironment may be a consequence of the general inflammatory nature of chemotherapy-experienced tumors. Strategies to upregulate MHC-I during or after neoadjuvant chemotherapy may thus improve treatment outcome in these patients.
Introduction
Epithelial ovarian cancer (EOC) is the most lethal gynecological malignancy and the fifth leading cause of cancer mortality in women. Almost all EOC patients present with an advanced stage of disease and relapse rates are high with a 5-y survival of only 40%.Citation1 The poor prognosis for women with EOC has not improved in decades and new therapies are urgently needed. A new approach to the treatment of EOC may be immunotherapy.
The immune system is considered to play an important role in the development and control of EOC. The number of intraepithelial CD8+ T cells is strongly associated with prolonged survival across studies.Citation2–Citation4 In addition, differentiation, exhaustion, and other functional parameters of intraepithelial CD8+ T cells have been associated with prognosis, as has the presence of regulatory T cells, macrophages, B cells, myeloid-derived suppressor cells, and other immune cell subsets.Citation5–Citation9 The immune checkpoint programmed death 1 (PD-1) and its ligand PD-L1 are also associated with prognosis in EOC, although controversy on the direction of this effect remains.Citation10–Citation14 Initial trials using blocking antibodies (immune checkpoint blockade; ICB) targeting PD-1 or PD-L1 in EOC have demonstrated clinical effect, albeit in a small percentage of patients.Citation15 One potential strategy to increase the efficacy of immunotherapy, including ICB, is to combine treatment with other modalities, such as standard chemotherapy.
A combination of carboplatin and paclitaxel chemotherapy is part of the standard-of-care for the treatment of EOC patients with advanced disease worldwide. Carboplatin and paclitaxel are DNA intercalating and cell cycle inhibitors, respectively, used frequently in combination for the treatment of ovarian, endometrial, lung, and breast cancers. For EOC patients, carboplatin/paclitaxel is administered in six cycles of 3 weeks and combined with cytoreductive surgery performed either prior to chemotherapy or at the interval (i.e. after three cycles of chemotherapy). Previously, we demonstrated that the number and differentiation of CD8+ tumor-infiltrating lymphocytes (TIL) did not differ between tumors that were carboplatin/paclitaxel-naïve when compared with tumors isolated after three cycles of chemotherapy.Citation8,Citation16 Lo et al. recently reported an increase in the number of TIL after carboplatin/paclitaxel chemotherapy in a subset of patients.Citation17 Nevertheless, little data exists on the systemic immune cell status of EOC patients undergoing carboplatin/paclitaxel chemotherapy.
We studied the impact of chemotherapy on the general immune contexture of EOC patients by analysis of immune cell populations in a series of primary tumors, tumor-draining lymph nodes (tDLN), and peripheral blood mononuclear cells (PBMC). In addition, the presence of PD-1 positive cells, MHC-I expression, and its correlation with survival was explored.
Material and methods
Patients
We selected patients diagnosed with advanced-stage (FIGO ≥IIB) EOC at the University Medical Center Groningen (UMCG). Patient in the PDS cohort received primary debulking surgery and thereafter six cycles of platinum-based chemotherapy. Patients in the NACT cohort received three cycles of chemotherapy prior to the cytoreductive debulking surgery and thereafter additional 3 cycles of chemotherapy. Ovarian tumor tissue (n = 16) and tumor-draining lymph nodes (tDLN) (n = 13, for three patients three nodes were collected) were collected during cytoreductive surgery from 20 ovarian cancer patients (Supplementary Table S1A). Tissue was obtained at the time of primary cytoreductive surgery (n = 12) or during interval surgery after three cycles of platinum-based neoadjuvant chemotherapy (n = 8). PBMC from 7 EOC patients were isolated from peripheral blood and obtained prior to chemotherapy, 1–3 weeks after three cycles of chemotherapy, and 4–6 weeks after completion of all six cycles of chemotherapy (Supplementary Table S1A). Written informed consent was obtained from all patients.
Selection of retrospective tumor material from patients with advanced-stage (FIGO ≥IIB) high-grade serous ovarian carcinoma (HGSOC) was described previously (Supplementary Table S1B).Citation8 Briefly, formalin-fixed paraffin-embedded tissue (FFPE) was collected at the time of the primary debulking surgery (n = 83) or 1–3 weeks after three cycles of chemotherapy at the time of interval cytoreductive surgery (n = 79). Construction of the tissue microarray (TMA) was described previously.Citation8
Processing of tumor material, tDLN, and PBMC
Tumor tissue and lymph nodes were cut into pieces of <1 mm3 and placed in a T75 culture flask (Nunc™ EasYFlask™ Cell Culture Flasks, cat. no. 156499, ThermoScientific) with digestion medium, consisting of RPMI (Gibco, Paisley, UK), 10% fetal bovine serum (FBS, Gibco, Paisley, UK), collagenase type IV (1 mg/mL; Gibco, Grand Island, USA), and 12.6 µg/mL recombinant human DNase (Pulmozyme, Roche, Woerden, the Netherlands) for overnight digestion at room temperature. After digestion, the suspension was strained through a 70 µm filter and washed with PBS. Cells were centrifuged over a Ficoll-Paque gradient (GE Healthcare Bio-Sciences AB, Uppsala, Sweden) and lymphocytes were isolated from between the two layers. After a wash with PBS, cells were pelleted. Total cell pellet was suspended in 1 ml FBS with 10% dimethylsulfoxide (Merck, Darmstadt, Germany), and stored in liquid nitrogen until further use. Peripheral blood was centrifuged over a Ficoll-Paque gradient (GE Healthcare Bio-Sciences AB, Uppsala, Sweden) and PBMC were isolated from between the two layers. After a wash with PBS, cells were pelleted. Total cell pellet was suspended in 1 ml FBS with 10% dimethylsulfoxide (Merck, Darmstadt, Germany), and stored in liquid nitrogen until further use.
Flow cytometry
Cryopreserved cell suspensions from peripheral blood, tumor tissue, and tDLN were thawed on ice, washed with RPMI medium (Gibco, Paisley, UK) with 10% FBS and centrifuged at 1000 × g. The total cell pellets were resuspended in RPMI with 10% FBS, and cells were incubated with the indicated antibodies (Supplementary Table 2A). The Zombie Aqua Fixable Viability Kit (BioLegend, Uithoorn, The Netherlands) was used for live/dead staining according to the manufacturer’s instructions. For intracellular staining, cells were permeabilized and fixed using the FoxP3 Transcription Factor Staining Buffer kit (A25866A, Thermofisher Scientific) according to the manufacturer’s protocol. All flow cytometry analyses were performed on a BD FACSVerse (BD Biosciences) using BDFACSuite CS&T Research Beads (BD Bioscience), BD™ CompBeads Set anti-mouse Ig, κ/negative control compensation particles set (552843, BD Bioscience), and UltraComp eBeads Compensation Beads (01-2222-42, eBioscience, ThermoFisher Scientific). Samples were analyzed with Premium Cytobank software (cytobank.org) (Supplementary figure S1).
Where indicated, PBMC were activated prior to phenotyping using Dynabeads® (2 µL/1×105 cells, T-activator CD3/CD28 beads, 11131D, Gibco, Oslo, Norway and Vilnius, Lithuania).
Immunohistochemistry
FFPE slides were de-paraffinized and rehydrated in graded ethanol. Antigen retrieval was initiated with a preheated 10 mM citrate buffer (pH = 6) and endogenous peroxidase activity was blocked by submerging sections in a 0.45% hydrogen peroxide solution. Slides were blocked in PBS containing 1% human serum and 1% BSA and incubated overnight with primary antibody at 4°C (Supplementary Table 2B). Subsequently, slides were incubated with a ready-to-use peroxidase-labeled polymer for 30 minutes (Envision+/HRP anti-mouse or Envision+/HRP anti-rabbit, 2 drops, cat. number K4001/K4003, Dako, Carpinteria, USA). Signal was visualized with 3,3ʹdiaminobenzidin (DAB) solution, and slides were counterstained with hematoxylin. Appropriate washing steps with PBS were performed in-between incubation steps. Sections were embedded in Eukitt mounting medium (Sigma Aldrich, Steinheim, Germany), and scanned on a Hamamatsu digital slide scanner (Hamamatsu photonics, Hamamatsu, Japan).
PD-1 staining was performed by the use of Ventana Discovery Ultra Platform for automatic staining, using a mouse-anti-human PD-1 antibody. Furthermore, a sequential dual staining was performed for tumor-associated macrophages (TAMs) on the Ventana Discovery Ultra platform to identify CD163+ cells using a mouse anti-human CD163 antibody with DAB chromogen, and CD68+CD163- cells using a mouse anti-human CD68 with Discovery purple chromogen.
Immunohistochemistry for CD8, CD3, and CD27 was performed previously in this cohort.Citation8,Citation16
Immunofluorescence
FFPE slide preparation and antigen retrieval were performed as described above. Next, double immunofluorescent staining of HLA-B/C and cytokeratin was performed. Slides were incubated overnight at 4°C with primary antibody (mouse anti-human HLA-B/C) and subsequently incubated with the appropriate secondary antibody for 45 minutes at room temperature (Supplementary Table S2B). Specific signal was amplified using the TSA Cyanine 5 (Cy5) detection kit (Perkin Elmer, NEL705A001KT, Boston, USA). To allow multiple amplifications on the same slide, primary HRP labels were destroyed between incubations by washing with 0.01 M hydrochloric acid for 10 minutes. Next, slides were incubated overnight at 4°C with primary antibody (mouse anti-human cytokeratin) and subsequently incubated with the appropriate secondary antibody for 45 minutes at room temperature (Supplementary Table S2B). Specific signal was amplified using the TSA Cyanine 3 (Cy3) detection kit according to the manufacturer’s protocols. Appropriate washing steps with PBS containing 0.05% Tween20 (Sigma-Aldrich, Missouri, USA) were performed during the procedure. For embedding, Prolong Diamond anti-fade mounting medium with or without DAPI was used (Invitrogen/Thermo Fisher Scientific, P36962 and P36961, Oregon, USA). Finally, slides were scanned at room temperature using the TissueFAXS acquisition software and microscope (TissueGnostics, Vienna, Austria) with the following specifications: Zeiss EC “Plan-Neofluar” 40x/1.30 Oil, DIC objective, CMOS-color camera PL-B623 Pixelink (3.1 Megapixels), EXFO Excite 120 PC fluorescence illumination and Chroma ET Dapi (49000), Chroma ET CY3 (49004), Chroma ET Cy5 (49006), and Chroma FITC (49011) filter sets. Overlay images were produced using Adobe Photoshop software. MHC-I scoring was performed manually by two individuals blinded for clinicopathological data. Cores were categorically scored as low (<1% of CK+ cells MHC-I positive), intermediate (>1–<80% of CK+ cells MHC-I positive), or high expression (>80% of CK+ cells MHC-I positive). Patients were included if at least two cores contained >20% tumor epithelium.
Statistics
Heatmaps were constructed in R (version 3.3.1) with package pheatmap. Differences in the percentage of immune cell subpopulations between clusters were determined using a non-parametric Kruskal–Wallis test, followed by Dunn’s post hoc analysis. Differences in the number of tumor-infiltrating immune cells on FFPE slides were determined by two-tailed Mann Whitney test. Differences in the immune cell density between MHC-I groups were determined using a non-parametric Kruskal–Wallis test, followed by Dunn’s post hoc analysis. Differences in disease-specific survival were determined by a logrank test. Variables associated with disease-specific survival were entered into a multivariate analysis using the Cox proportional hazards model. All statistical analyses were performed using IBM SPDSS 24 (SPDSS inc., Chicago, USA) or GraphPad Prism (GraphPad Software Inc., CA, USA). A p-value of <0.05 was used as a cutoff for significance.
Results
Immune contexture is defined by the tissue of origin, independent of chemotherapy
We analyzed the immune contexture of a series of tumors, tDLN, and PBMC samples from EOC patients before, during, and after chemotherapy. We determined the expression of activation and inhibitory markers on CD4+ and CD8+ T cells, CD14+ monocytes, and lineage-negative HLA-DR+ DCs. Cluster analysis of all markers across samples revealed four main clusters based on tissue of origin: tumor tissue (tumor 1 and tumor 2), tDLN and PBMC clusters. All samples clustered independent of chemotherapy status ( and b).
Figure 1. Immune contexture is defined by the tissue of origin, independent of chemotherapy.
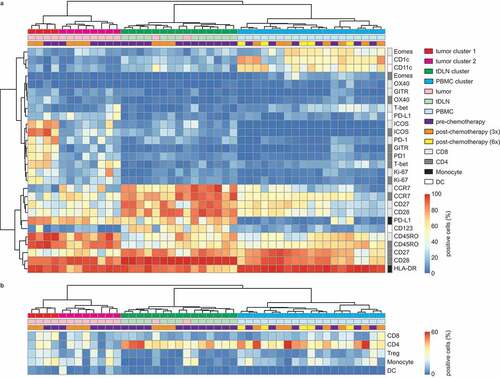
In tumor cluster 1, both CD4+ and CD8+ cells were characterized by a dominant CD45RO+ phenotype with heterogeneous expression of CCR7 (C-C chemokine receptor type 7). CD28 expression was heterogeneous in CD8+ T cells but expressed on most CD4+ T cells present in the tumor (, Supplementary Table S3A, median 42.4% vs 87.7%). The phenotype of T cells in the tumor microenvironment displayed an activated and exhausted phenotype, with both CD8+ and CD4+ T cells co-expressing PD-1, ICOS, GITR, and HLA-DR (). Cluster 2 contained tumor samples that appeared to be significantly less activated than tumor cluster 1 with a lower percentage of CD8 cells expressing PD-1 (median 15.4% vs 65,1%, P <.001) or ICOS (P <.001) and a lower percentage of CD4 cells expressing PD-1 (P <.001), ICOS (P <.001), or GITR (P <.001).
TLDN and PBMC clusters were characterized by a marker expression pattern more consistent with a quiescent and non-proliferative immune phenotype (Supplementary Table S3A). TDLN were almost exclusively characterized by expression of CCR7, CD28, and CD45RO on CD4+ and CD8+ T cells, consistent with a resting naïve-like phenotype (). By contrast, PBMC were characterized by CD4+ and CD8+ cells with heterogeneous expression of CCR7, CD28, and CD27. The memory T-cell marker CD45RO was variably expressed on CD4+ and CD8+ T cells in both tDLN and PBMC, indicating the presence of both naïve and memory cells (). The expression of CCR7+, CD45RO+, CD27,+ and CD28+ is indicative of the presence of a central memory T-cell population. Most CD8+ and CD4+ T cells from tDLN and PBMC were negative for exhaustion marker PD-1 (supplementary figure S2). In addition, PBMC were characterized by the presence of CD1 c+ and CD11 c+ myeloid dendritic cells while the tumor samples were largely devoid of these populations (, Supplementary table S3A).
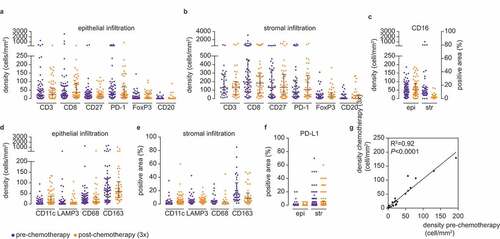
Chemotherapy as a treatment was not associated with a distinct tumor, lymph node, or peripheral blood sample clusters. Thus, we speculated that chemotherapy would have a modest effect on the immune contexture of these tissues in EOC patients. To test this hypothesis, we performed immunohistochemical analysis of an independent cohort (N = 162) of high-grade serous ovarian cancer (HGSOC) tumor samples obtained either prior to chemotherapy or after three cycles of chemotherapy (i.e. at the time of interval debulking). We included only HGSOC patients, to avoid the potential bias from differences between histological subtypes (Supplementary Table S1B). We analyzed immune markers for which commercial antibodies were available and for which we could optimize a reproducible staining protocol (Supplementary figure S5, Supplementary table S2B). There were no statistically significant differences between the immune cell infiltration of either epithelium or stroma when comparing tumor samples obtained pre- or post-chemotherapy (-f, Supplementary table S2 C). The median density for individual immune markers showed an almost perfect correlation (R2 = 0.92 P <.0001) between the pre- and post-chemotherapy cohort ().
Figure 2. Immune cell distribution is comparable between pre- and post-chemotherapy tumors. (a) Epithelial infiltration of CD3+, CD8+, CD27+, PD1+, FoxP3+, and CD20+ cells in pre- and post-chemotherapy tumors. Density is defined as cells/mm2. (b) Stromal infiltration of CD3+, CD8+, CD27+, PD1+, FoxP3+, and CD20+ cells in pre- and post-chemotherapy tumors. Density is defined as cells/mm2. (c) Epithelial and stromal infiltration of CD16+ cells in pre- and post-chemotherapy tumors. Epithelial infiltration was determined by density in cells/mm2, stromal infiltration was determined by the percentage of positive area. (d) Epithelial infiltration of CD11 c+, LAMP3+, CD68+, and CD163+ cells in pre- and post-chemotherapy tumors. Density is defined as cells/mm2. (e) Stromal infiltration of CD11 c+, LAMP3+, CD68+, and CD163+ cells in pre- and post-chemotherapy tumors. Stromal infiltration is determined by the percentage of positive area. (f) Epithelial and stromal infiltration of PD-L1+ cells in pre- and post-chemotherapy tumors. Infiltration was determined by the percentage of positive area. (a–f) Representative samples are depicted in supplementary figure S5. Differences in the number of tumor-infiltrating immune cells on FFPE slides were determined by two-tailed Mann Whitney test. N-numbers are described in supplementary table S3 C. G, Median immune cell density of all epithelial and stromal immune cells depicted in a–f. Comparability between pre- and post-chemotherapy tumors was determined by a Pearson correlation test. R2 = 0.92, <0.0001.
Taken together, we observed a tissue-dependent immune contexture in EOC patients. In addition, our data suggest that chemotherapy does not have a major effect on the immune cell infiltration.
T-cell differentiation is heterogeneous across tissue types
In our flow cytometry analyses, we observed differences in the expression of T-cell differentiation markers between tumor, tDLN, and PBMC, as well as between individual clusters of tumor samples (). Previously, we found the expression of the T-cell differentiation marker CD27 to also be highly heterogeneous in IHC analysis of EOC tumors, ranging from 0 to 407 cells/mm2. Thus, we next aimed to define the co-expression of differentiation markers within the CD4+ and CD8+ immune subsets to assess their differentiation status (). We used the clusters identified by single marker analysis and determined co-expression of CD45RO, CCR7, CD28, and CD27. A restricted co-expression for these markers was observed, with a large number of potential populations present at a frequency of <1% (Supplementary figure S3, cropped for clarity in ). The tumor clusters displayed an activated T-cell phenotype with a high percentage of all effector memory subsets (EM). For CD8+ cells within tumors, the dominant phenotypes were CD45RO+CCR7−CD28−CD27− and CD45RO+CCR7−CD28−CD27+ cells, consistent with the phenotype of effector cells. CD4+ cells displayed a similar dominant phenotype except that most CD4 cells co-expressed CD28. This is consistent with previous reports demonstrating an earlier loss of CD28 during CD8+ T-cell differentiation when compared to CD4+ T cells.Citation18 As anticipated, both tDLN and PBMC were characterized by a relatively high number of naïve and central memory CD4+ and CD8+ T cells. In addition, approximately half of the PBMC samples were characterized by the presence of EM3 (CD45RO+CCR7−CD28−CD27−) cells.
Figure 3. T-cell differentiation is heterogeneous across tissue types.
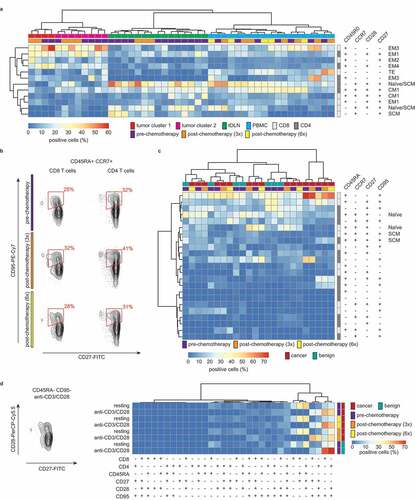
The combination of CD45RO, CCR7, CD27, and CD28 did not allow us to definitively distinguish between naïve and stem cell memory (SCM) T cells. Additionally, we performed a complementary analysis of CD45RA, CCR7, CD27, and CD95 co-expression in consecutive pre- and post-chemotherapy PBMC samples of EOC patients (n = 7) and compared the differentiation status to age-matched controls diagnosed with a benign ovarian tumor (n = 7) ( and c). Cluster analysis revealed neither distinguishing effects of chemotherapy nor between patients with EOC and patients with a benign tumor. As observed before, a restricted pattern of marker co-expression was observed. Two EOC patients were characterized by a high prevalence of CD45RA+CD95+CD8+ T cells, representing a terminally differentiated subset. Finally, sufficient PBMC were available from a single EOC patient and benign control, to confirm the observed loss of CD28 on CD8+, but not CD4+ T cells in tumors by analyzing T-cell phenotype upon in vitro activation. In brief, PBMC of an ovarian cancer patient and a healthy control were activated with CD3/CD28 beads for 7 d and expression of CD45RA, CD27, CD28, and CD95 was analyzed (). T-cell activation was associated with a loss of CD28 from the cell surface of CD8+, but not CD4+ SCM T cells, independent of disease status and chemotherapy status (). No other phenotypic differences were observed between these two T-cell subsets.
ICOS and GITR are co-expressed in ovarian cancer patients with an exhausted phenotype
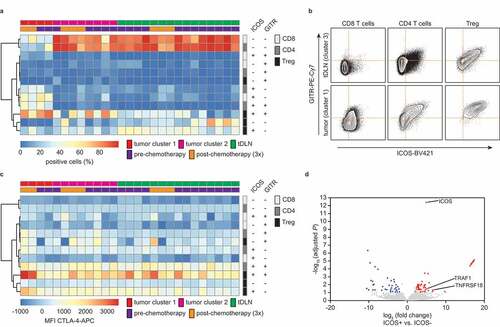
Having established a comprehensive immune profile for ovarian tumors, tDLN and PBMC, we next assessed potential targets for therapeutic intervention. We observed a relatively high percentage of ICOS and GITR in tumors from cluster 1 (). Co-expression analysis of ICOS and GITR revealed a dominant co-expression in tumor cluster 1 when compared to tumor cluster 2, mostly on T-regulatory cells, but also on CD4+ and CD8+ T cells ( and b). By contrast, most CD4+ and CD8+ cells in tumor cluster 2, TDLN and PBMC were double negative for ICOS and GITR ( and b). This difference in co-expression on CD8+, CD4+, and Treg cells was also evident when comparing a tumor with a draining lymph node from a patient from whom a matched sample was available (). To confirm the observed co-expression in CD8+ T cells, we also analyzed a recently published dataset of CD8+ TIL from ovarian cancer.Citation19 ICOS, TNFRSF18 (GITR), as well as in the intracellular signaling adaptor for GITR: TRAF1 were overexpressed in ICOS+ vs. ICOS− TILs (). ICOS and GITR are also often co-expressed with immune checkpoint CTLA4 (cytotoxic T-lymphocyte attenuator 4).Citation19 Therefore, we investigated the expression levels of CTLA4 within the various ICOS/GITR CD4+ and CD8+ T-cell subpopulations () and found that mean fluorescent intensities (MFI) for CTLA-4 were higher in ICOS/GITR double-positive Treg cells when compared to the other subpopulations.
Figure 4. ICOS, GITR, and CTLA-4 co-expression.
Infiltration of PD-1+ cells in tumor epithelium is correlated with disease-specific survival in pre-chemotherapy patients only
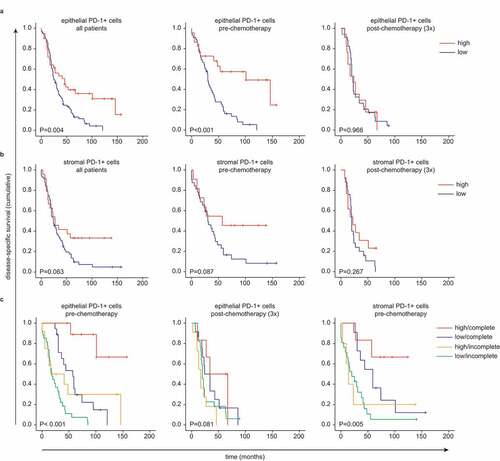
A dominant phenotype observed in tumor cluster 1 of PD-1+ CD4+ and CD8+ T cells compared to tumor cluster 2 (). In addition, PD-1+ TIL were observed in both the pre-chemotherapy and chemotherapy group but did not differ in absolute number (). We tested for a potential survival benefit of high PD-1 expression in EOC. DSS was significantly longer in HGSOC patients with a higher infiltration of epithelial PD-1+ cells (P =.004) (). This survival benefit was only observed in patients who received primary debulking surgery (P <.001), and not in the neoadjuvant chemotherapy cohort (). Stromal PD-1 expression was not correlated with improved DSS in any of the cohorts (). Next, we corrected for surgical outcome since this is a major predictor for DSS. High epithelial PD-1+ cell infiltrate was a predictor for DSS in the case of a complete primary debulking (P <.001) (). Again, the survival benefit was only present in the pre-chemotherapy group, but not in the chemotherapy group. Although stromal PD-1 expression was not predictive in the entire patient group, when correcting for surgical outcome, stromal infiltration of PD-1+ cells did have a predictive value for DSS in the patients with a complete primary debulking (P =.005).
Figure 5. PD-1+ cells only have a survival benefit in pre-chemotherapy tumors who were completely removed after primary surgical debulking.
Treatment of HGSOC patients with neoadjuvant chemotherapy is associated with minimal expression of MHC-I
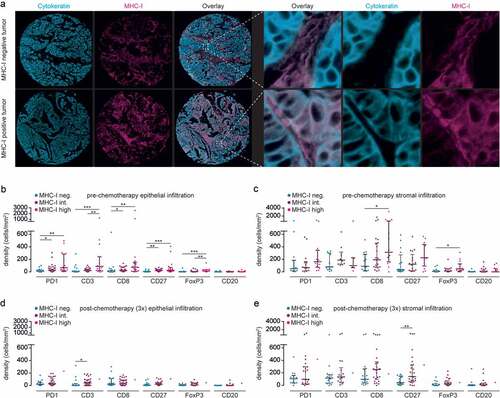
We hypothesized that the loss in prognostic benefit of epithelial PD-1+ cells of patients treated with neoadjuvant chemotherapy could be explained by inadequate antigen presentation. Therefore, we analyzed the expression of MHC-I on cancer cells (). Expression of high, intermediate, and low MHC-I on cancer cells was observed in 24.1%, 45.6%, and 30.4% of tumors in the pre-chemotherapy group compared to only 1.7%, 61.7%, and 36.7% in the chemotherapy group, respectively. Next, we determined the correlation between MHC-I expression, chemotherapy, and immune markers. In the pre-chemotherapy patients, a significant correlation between MHC-I expression on cancer cells was observed with all immune markers, with the exception of the B-cell marker CD20 (). A step-wise increase was observed from low, to intermediate, to high MHC-I. In the stroma, a comparable trend was observed, with a significant correlation between MHC-I expression on cancer cells and both CD8+ and FoxP3+ cells (). In the post-chemotherapy patients, intermediate MHC-I expression on cancer cells was significantly correlated with CD3+ cells, only (). In the stroma, this correlation was only seen for CD27+ cells ().
Figure 6. Treatment of HGSOC patients with neoadjuvant chemotherapy is associated with minimal expression of MHC-I.
To confirm the prognostic value of PD-1+ cell infiltration in the context of MHC-I expression, treatment regimen, and surgical result, we performed a multivariate Cox regression analysis, also including other known prognostic parameters, FIGO stage and epithelial CD8+ cell infiltration (Supplementary Table S3 H). In this model, the surgical result (hazard risk (HR): 1.338, 95% CI: 1.165–1.536) and PD-1+ cell infiltration in epithelium (HR: 0.826, 95% CI: 0.685–0.995) were the only parameters of prognostic value.
Discussion
We report on the immune profile of ovarian carcinoma patients treated with carboplatin and paclitaxel chemotherapy. We demonstrated that the phenotype and the presence of immune subsets are highly variable within individual patients and are more defined by the tissue of origin than by exposure to chemotherapy. Tumor-draining lymph nodes were characterized by a quiescent microenvironment composed of mostly non-proliferating naïve CD4+ T cells. Circulating T cells shared phenotypic features of both lymph node and tumor-infiltrating immune cells. Immunologically ‘hot’ ovarian tumors were characterized by ICOS, GITR, and PD-1 expression on CD4+ and CD8+ cells, independent of chemotherapy.
Earlier studies on the effect of carboplatin and paclitaxel chemotherapy assessed pre-and post-NACT samples within the same patient.Citation17,Citation20,Citation21 The largest study included 83 paired pre- and post-NACT EOC tumor samples and demonstrated an overall significant increase in the level of tumor-infiltrating lymphocytes after NACT. TIL were defined as the percentage of intratumoral occupation by mononuclear cells on H&E stained fixed tissue, but lymphocyte subsets were not further defined.Citation20 Two additional studies included smaller sample sizes, but studied a broader panel of immune markers using IHC. Both studies demonstrated an increase in CD8+ cells after NACT. However, these studies showed contradicting results on CD4+ and Granzyme B+ expression, highlighting the heterogeneity of ovarian carcinoma.Citation17,Citation21
In our study, no differences in the immune phenotypes were observed between tumors collected during primary surgery debulking and tumors collected during interval debulking after three cycles of NACT. However, no matched pre- and post-chemotherapy samples were available for our study. Therefore, we cannot exclude the potential of NACT patients with a low baseline of TILs that had increased upon chemotherapy treatment. The past decade has seen changes in the standard-of-care for patients with ovarian cancer in the Netherlands. In particular, a higher number of patients are treated with neoadjuvant chemotherapy. Before 2008, ~30% of patients were treated with NACT, but by 2013 this increased to ~60%.Citation22 If NACT patients would be characterized by a lower baseline of epithelial TILs compared to PDS patients, a higher median density of epithelial CD8+ T cells would thus be observed in the NACT cohort after the change in standard-of-care (e.g. <2008 vs >2008). However, no difference was observed in total epithelial T cells between the NACT cohort 2002–2008 and NACT 2008–2012 cohort (Supplementary figure S4).
The data demonstrate a tDLN phenotype which is consistent with quiescent lymph nodes from healthy individuals.Citation23,Citation24 Few studies to date have comprehensively examined the immune phenotype of tDLN in human cancer.Citation24,Citation25 In one of the most extensive studies, Heeren et al. reported on the composition of tumor-negative and tumor-positive DLN in patients with cervical cancer. The phenotype for tumor-free DLN in their study is almost identical to what we have observed for ovarian tDLN, Citation25 in line with a quiescent nature of tDLN of ovarian cancer patients. The observed quiescent nature of the tDLN suggests a lack of lymph node involvement in the antitumor immune responses in ovarian cancer. Therefore, novel immunotherapeutic treatment strategies may need to specifically target this site for enhanced antitumor efficacy. Herein, one approach of particular interest may be the use of vaccines targeted at myeloid CD11 c+ dendritic cells for the direct uptake and presentation of antigens. Such vaccines have recently proved effective at eliciting strong antitumor immunity in mice and humans, and have shown tentative signs of clinical activity, particularly when combined with PD-1 blockade.Citation26,Citation27
In concordance with our findings, Wu et al. observed an unchanged level of circulating immune cells in blood samples collected before chemotherapy and blood samples collected 3–4 weeks after chemotherapy administration.Citation28 However, at 12–14 d after chemotherapy they found a decrease in T-regulatory cells and an increase in cytotoxic CD8+ T cells.Citation28 Importantly, standard-of-care carboplatin and paclitaxel chemotherapy is often combined with pre-medication, including dexamethasone, to reduce chemotherapy side effects. While dexamethasone has a clearly described immune-attenuating effect, the precise mode-of-action on the circulating lymphocytes remains ambiguous. In both mice and humans, administration of dexamethasone was associated with an upregulation of circulating lymphocytes in the lymph nodes and circulation.Citation29,Citation30 Considering the biological half-life of dexamethasone (36–72 h), it is conceivable that immune-modulating effects earlier than ~12 d (4x biological half-life) after chemotherapy/corticosteroid application can be contributed to the administration of dexamethasone and not chemotherapy treatment.
Importantly, we observed no deleterious effects of carboplatin/paclitaxel on differentiation, activation, and/or proliferation of T cells, confirming previous reports that certain chemotherapeutic regimes can be effectively combined with T cell-targeting immunotherapy.Citation31–Citation33 Early data from clinical trials in triple-negative breast cancer combining chemotherapy with PD-1/PD-L1 checkpoint inhibition are currently ongoing and early data suggest that the combination is relatively safe and improves response rates.Citation33–Citation35
A striking observation was the difference between the two defined tumor clusters. We observed immunologically ‘hot’ ovarian tumors characterized by ICOS, GITR, and PD-1 expression on both CD4+ and CD8+ cells. ICOS and GITR are immune checkpoint receptors known to be co-expressed on the cell surface of exhausted T cells together with CTLA-4.Citation19 The relative overexpression of CTLA-4, ICOS, and GITR on regulatory T cells in our data is in line with a recent report on Treg phenotype in melanoma, non-small cell lung cancer (NSCLC), and RCC. The association of ICOS+ Tregs with poor survival was previously described in ovarian cancer and more recently renal cell cancer (RCC).Citation36–Citation38 CTLA-4, ICOS, and GITR may thus be targets for the depletion of suppressive Tregs via antibody-dependent cell-mediated cytotoxicity (ADCC), either as monoclonal antibody or in bispecific format.
Tumor epithelial infiltration by PD-1+ cells was predictive for DSS in patients who received a complete primary debulking surgery and not in NACT patients. A possible bias is introduced due to the fact that overall survival is better for patients receiving a primary debulking compared to NACT patients. Checkpoint inhibition targeting PD-1 has been successful in the treatment of several solid malignancies.Citation39 Therapeutic efficacy in ovarian cancer, however, has been limited. In a phase I trial, an objective response was observed in 3 out of 26 patients,Citation40 and in a phase II trial, 2 complete responses out of 20 patients were reported.Citation41 For both studies, the studied population consisted of patients with platinum-resistant recurrences with heterogeneous histological and clinicopathological characteristics. In our study, the prognostic benefit of epithelial PD-1 expression was absent in the chemotherapy group, which can potentially be explained by the lack of proper antigen recognition via MHC-I, as high MHC-I expression was only seen in the pre-chemotherapy group. We did not observe differences in the number of TIL in both groups, even though MHC-I expression was reduced. We therefore speculate that TIL influx into the chemotherapy tumor micro-environment is not the result of tumor antigen-specific recognition, but may be a consequence of the general inflammatory nature of chemotherapy-experienced tumors. As such, these TILs may therefore be unable to exert tumor-specific cytotoxic effects, in line with their limited prognostic benefit with regards to long-term patient survival. Determining how chemotherapy influences MHC-I expression in these tumors may lead to new opportunities to improve treatment outcome in patients treated with neoadjuvant chemotherapy. A recent paper described loss of MHC-I antigen presentation in cancer cells through transcriptional silencing of the MHC-I antigen processing pathway by conserved function of polycomb repressive complex 2.Citation42 In breast cancer methylation of MHC-I genes was shown to suppress MHC-I expression which could be reversed by DNA methyltransferase inhibition.Citation43 MHC-I could be upregulated via interferon-γ which can be induced by the use of, e.g., vaccination strategy or other immune-stimulating therapies. However, in EOC it is firstly important to validate whether the low MHC-I expression is upfront or whether it occurs due to the NACT. In conclusion, our findings show a reduced amount of MHC-I on tumors after chemotherapy, which might explain the loss of prognostic benefit of TILs in these patients. Upregulating MHC-I in ovarian tumors might therefore augment chemo-immunotherapeutic strategies.
Disclosure of Potential Conflicts of Interests
No potential conflicts of interest were disclosed.
Supplemental Material
Download ()Supplementary material
Supplemental data for this article can be accessed on the publisher’s website.
References
- Vaughan S, Coward JI, Bast RCJ, Berchuck A, Berek JS, Brenton JD, Coukos G, Crum CC, Drapkin R, Etemadmoghadam D, et al. Rethinking ovarian cancer: recommendations for improving outcomes. Nat Rev Cancer. 2011 Sep;11(10):719–12. doi:10.1038/nrc3144.
- Leffers N, Gooden MJM, de Jong RA, Hoogeboom B-N, Ten Hoor KA, Hollema H, Boezen HM, van der Zee AGJ, Daemen T, Nijman HW, et al. Prognostic significance of tumor-infiltrating T-lymphocytes in primary and metastatic lesions of advanced stage ovarian cancer. Cancer Immunol Immunother. 2009 Mar;58(3):449–459. doi:10.1007/s00262-008-0583-5.
- Vermeij R, de Bock GH, Leffers N, Ten Hoor KA, Schulze U, Hollema H, van der Burg SH, van der Zee AGJ, Daemen T, Nijman HW, et al. Tumor-infiltrating cytotoxic T lymphocytes as independent prognostic factor in epithelial ovarian cancer with wilms tumor protein 1 overexpression. J Immunother. 2011;34(6):516–523. doi:10.1097/CJI.0b013e31821e012f.
- Hwang W-T, Adams SF, Tahirovic E, Hagemann IS, Coukos G. Prognostic significance of tumor-infiltrating T cells in ovarian cancer: a meta-analysis. Gynecol Oncol. 2012 Feb;124(2):192–198. doi:10.1016/j.ygyno.2011.09.039.
- Barnes TA, Amir E. HYPE or HOPE: the prognostic value of infiltrating immune cells in cancer. Br J Cancer. 2018 Jan;118(2):e5. doi:10.1038/bjc.2017.417.
- Nelson BH. The impact of T-cell immunity on ovarian cancer outcomes. Immunol Rev. 2008 Apr;222:101–116. doi:10.1111/j.1600-065X.2008.00614.x.
- Sato E, Olson SH, Ahn J, Bundy B, Nishikawa H, Qian F, Jungbluth AA, Frosina D, Gnjatic S, Ambrosone C, et al. Intraepithelial CD8+ tumor-infiltrating lymphocytes and a high CD8+/regulatory T cell ratio are associated with favorable prognosis in ovarian cancer. Proc Natl Acad Sci U S A. 2005 Dec;102(51):18538–18543. doi:10.1073/pnas.0509182102.
- Wouters MCA, Komdeur FL, Workel HH, Klip HG, Plat A, Kooi NM, Wisman GBA, Mourits MJE, Arts HJG, Oonk MHM, et al. Treatment regimen, surgical outcome, and T-cell differentiation influence prognostic benefit of tumor-infiltrating lymphocytes in high-grade serous ovarian cancer. Clin Cancer Res. 2016 Feb;22(3):714–724. doi:10.1158/1078-0432.CCR-15-1617.
- Wouters MCA, Komdeur FL, de Bruyn M, Nijman HW. Size matters: survival benefit conferred by intratumoral T cells is dependent on surgical outcome, treatment sequence and T cell differentiation. Oncoimmunology. 2016 5;May(5):e1122863. doi:10.1080/2162402X.2015.1122863.
- Tumeh PC, Harview CL, Yearley JH, Shintaku IP, Taylor EJM, Robert L, Chmielowski B, Spasic M, Henry G, Ciobanu V, et al. PD-1 blockade induces responses by inhibiting adaptive immune resistance. Nature. 2014 Nov;515(7528):568–571. doi:10.1038/nature13954.
- Karyampudi L, Lamichhane P, Krempski J, Kalli KR, Behrens MD, Vargas DM, Hartmann LC, Janco JMT, Dong H, Hedin KE, et al. PD-1 blunts the function of ovarian tumor-infiltrating dendritic cells by inactivating NF-kappaB. Cancer Res. 2016 Jan;76(2):239–250. doi:10.1158/0008-5472.CAN-15-0748.
- Landskron J, Helland O, Torgersen KM, Aandahl EM, Gjertsen BT, Bjorge L, Taskén K. Activated regulatory and memory T-cells accumulate in malignant ascites from ovarian carcinoma patients. Cancer Immunol Immunother. 2015 Mar;64(3):337–347. doi:10.1007/s00262-014-1636-6.
- Teng MWL, Ngiow SF, Ribas A, Smyth MJ. Classifying cancers based on T-cell infiltration and PD-L1. Cancer Res. 2015 Jun;75(11):2139–2145. doi:10.1158/0008-5472.CAN-15-0255.
- Khagi Y, Kurzrock R, Patel SP. Next generation predictive biomarkers for immune checkpoint inhibition. Cancer Metastasis Rev. 2017 Mar;36(1):179–190. doi:10.1007/s10555-016-9652-y.
- Wang D, Guo L, Wu X. Checkpoint inhibitors in immunotherapy of ovarian cancer. Tumour Biol. 2015 Jan;36(1):33–39. doi:10.1007/s13277-014-2848-2.
- Komdeur FL, Wouters MCA, Workel HH, Tijans AM, Terwindt ALJ, Brunekreeft KL, Plat A, Klip HG, Eggink FA, Leffers N et al. CD103+ intraepithelial T cells in high-grade serous ovarian cancer are phenotypically diverse TCRalphabeta+ CD8alphabeta+ T cells that can be targeted for cancer immunotherapy. Oncotarget. 2016 Nov;7(46):75130–75144. doi:10.18632/oncotarget.12077.
- Lo CS, Sanii S, Kroeger DR, Milne K, Talhouk A, Chiu DS, Rahimi K, Shaw PA, Clarke BA, Nelson BH, et al. Neoadjuvant chemotherapy of ovarian cancer results in three patterns of tumor-infiltrating lymphocyte response with distinct implications for immunotherapy. Clin Cancer Res. 2017 Feb;23(4):925–934. doi:10.1158/1078-0432.CCR-16-1433.
- Romero P, Zippelius A, Kurth I, Pittet MJ, Touvrey C, Iancu EM, Corthesy P, Devevre E, Speiser DE, Rufer N, et al. Four functionally distinct populations of human effector-memory CD8 + T lymphocytes. J Immunol. 2007 Apr;178(7):4112–4119. doi:10.4049/jimmunol.178.7.4112.
- Workel HH, Lubbers JM, Arnold R, Prins TM, van der Vlies P, de Lange K, Bosse T, van Gool IC, Eggink FA, Wouters MCA, et al. A transcriptionally distinct CXCL13þCD103þCD8þ T-cell population is associated with B-cell recruitment and neoantigen load in human cancer. Cancer Immunol Res. 2019;7(5):784–796. doi:10.1158/2326-6066.CIR-18-0517.
- Mesnage SJL, Auguste A, Genestie C, Dunant A, Pain E, Drusch F, Gouy S, Morice P, Bentivegna E, Lhomme C, et al. Neoadjuvant chemotherapy (NACT) increases immune infiltration and programmed death-ligand 1 (PD-L1) expression in epithelial ovarian cancer (EOC). Ann Oncol Off J Eur Soc Med Oncol. 2017 Mar;28(3):651–657. doi:10.1093/annonc/mdw625.
- Polcher M, Braun M, Friedrichs N, Rudlowski C, Bercht E, Fimmers R, Sauerwald A, Keyver-Paik M-D, Kübler K, Büttner R, et al. Foxp3+ cell infiltration and granzyme B+/Foxp3+ cell ratio are associated with outcome in neoadjuvant chemotherapy-treated ovarian carcinoma. Cancer Immunol Immunother. 2010 Jun;59(6):909–919. doi:10.1007/s00262-010-0817-1.
- Eggink FA, Mom CH, Kruitwagen RF, Reyners AK, Van Driel WJ, Massuger LF, Niemeijer GC, Van der Zee AG, Van der Aa MA, Nijman HW, et al. Improved outcomes due to changes in organization of care for patients with ovarian cancer in the Netherlands. Gynecol Oncol [Internet]. 2016 Jun 1;141(3):524–530. [cited 2019 Apr 4]. https://www.sciencedirect.com/science/article/pii/S0090825816301408.
- Scott GD, Atwater SK, Gratzinger DA. Normative data for flow cytometry immunophenotyping of benign lymph nodes sampled by surgical biopsy. J Clin Pathol [Internet]. 2018 Feb;71(2):174–179. [cited 2019 Apr 3]. http://jcp.bmj.com/lookup/doi/10.1136/jclinpath-2017-204687.
- Tedla N, Dwyer J, Truskett P, Taub D, Wakefield D, Lloyd A. Phenotypic and functional characterization of lymphocytes derived from normal and HIV-1-infected human lymph nodes. Clin Exp Immunol [Internet]. 1999 Jul;117(1):92–99. [cited 2019 Apr 3]. http://www.ncbi.nlm.nih.gov/pubmed/10403921.
- Heeren AM, Koster BD, Samuels S, Ferns DM, Chondronasiou D, Kenter GG, Jordanova ES, de Gruijl TD. High and interrelated rates of PD-L1+CD14+ antigen-presenting cells and regulatory T cells mark the microenvironment of metastatic lymph nodes from patients with cervical cancer. Cancer Immunol Res [Internet]. 2015 Jan 1;3(1):48–58. [cited 2019 Apr 3]. http://www.ncbi.nlm.nih.gov/pubmed/25361854.
- Dillman RO, Cornforth AN, Nistor GI, McClay EF, Amatruda TT, Depriest C. Randomized phase II trial of autologous dendritic cell vaccines versus autologous tumor cell vaccines in metastatic melanoma: 5-year follow up and additional analyses. J Immunother Cancer [Internet]. 2018 Dec 6;6(1):19. [cited 2019 Apr 3]. http://www.ncbi.nlm.nih.gov/pubmed/29510745.
- Martin Lluesma S, Wolfer A, Harari A, Kandalaft LE. Cancer vaccines in ovarian cancer: how can we improve? Biomedicines [Internet]. 2016 May 3;4(2):10. [cited 2019 Apr 3]. http://www.mdpi.com/2227-9059/4/2/10.
- Wu X, Feng Q-M, Wang Y, Shi J, Ge H-L, Di W. The immunologic aspects in advanced ovarian cancer patients treated with paclitaxel and carboplatin chemotherapy. Cancer Immunol Immunother. 2010 Feb;59(2):279–291. doi:10.1007/s00262-009-0749-9.
- Wu Y, Xiab R, Dai C, Yan S, Xie T, Liu B, Gan L, Zhuang Z, Huang Q. Dexamethasone inhibits the proliferation of tumor cells. Cancer Manag Res [Internet]. 2019 Feb;11:1141–1154. [cited 2019 Apr 4]. http://www.ncbi.nlm.nih.gov/pubmed/30774442.
- Corcoran T, Paech M, Law D, Muchatuta NA, French M, Ho KM. Intraoperative dexamethasone alters immune cell populations in patients undergoing elective laparoscopic gynaecological surgery. Br J Anaesth [Internet]. 2017 Aug 1;119(2):221–230. [cited 2019 Apr 4]. http://www.ncbi.nlm.nih.gov/pubmed/28854534.
- Komdeur FL, Prins TM, van de Wall S, Plat A, Wisman GBA, Hollema H, Daemen T, Church DN, de Bruyn M, Nijman HW, et al. CD103+ tumor-infiltrating lymphocytes are tumor-reactive intraepithelial CD8+ T cells associated with prognostic benefit and therapy response in cervical cancer. Oncoimmunology. 2017;6(9):e1338230. doi:10.1080/2162402X.2017.1338230.
- Welters MJ, van der Sluis TC, van Meir H, Loof NM, van Ham VJ, van Duikeren S, Santegoets SJ, Arens R, de Kam ML, Cohen AF, et al. Vaccination during myeloid cell depletion by cancer chemotherapy fosters robust T cell responses. Sci Transl Med. 2016 Apr;8(334):334ra52. doi:10.1126/scitranslmed.aad8307.
- Polk A, Svane I-M, Andersson M, Nielsen D. Checkpoint inhibitors in breast cancer - Current status. Cancer Treat Rev. 2018 Feb;63:122–134. doi:10.1016/j.ctrv.2017.12.008.
- Adams S, Diamond JR, Hamilton E, Pohlmann PR, Tolaney SM, Chang C-W, Zhang W, Iizuka K, Foster PG, Molinero L, et al. Atezolizumab plus nab-paclitaxel in the treatment of metastatic triple-negative breast cancer with 2-year survival follow-up. JAMA Oncol [Internet]. 2019 Mar 1;5(3):334. [cited 2019 Apr 3]. http://www.ncbi.nlm.nih.gov/pubmed/30347025.
- Nanda R, Liu MC, Yau C, Asare S, Hylton N, Veer LV, Perlmutter J, Wallace AM, Chien AJ, Forero-Torres A, et al. Pembrolizumab plus standard neoadjuvant therapy for high-risk breast cancer (BC): results from I-SPY 2. J Clin Oncol [Internet]. 2017 May 20;35(15_suppl):506. [cited 2019 Apr 3]. doi:10.1200/JCO.2017.35.15_suppl.506.
- Arce Vargas F, Furness AJS, Litchfield K, Joshi K, Rosenthal R, Ghorani E, Solomon I, Lesko MH, Ruef N, Roddie C, et al. Fc effector function contributes to the activity of human anti-CTLA-4 antibodies. Cancer Cell [Internet]. 2018 Apr 9;33(4):649–663.e4. [cited 2019 Apr 3]. http://www.ncbi.nlm.nih.gov/pubmed/29576375.
- Conrad C, Gregorio J, Wang Y-H, Ito T, Meller S, Hanabuchi S, Anderson S, Atkinson N, Ramirez PT, Liu Y-J, et al. Plasmacytoid dendritic cells promote immunosuppression in ovarian cancer via ICOS costimulation of Foxp3(+) T-regulatory cells. Cancer Res [Internet]. 2012 Oct 15;72(20):5240–5249. [cited 2019 Apr 3]. http://www.ncbi.nlm.nih.gov/pubmed/22850422.
- Toker A, Nguyen LT, Stone SC, Yang SYC, Katz SR, Shaw PA, Clarke BA, Ghazarian D, Al-Habeeb A, Easson A, et al. Regulatory T cells in ovarian cancer are characterized by a highly activated phenotype distinct from that in melanoma. Clin Cancer Res [Internet]. 2018 Nov 15;24(22):5685–5696. [cited 2019 Apr 3]. http://clincancerres.aacrjournals.org/lookup/doi/10.1158/1078-0432.CCR-18-0554.
- Johnson DB, Peng C, Sosman JA. Nivolumab in melanoma: latest evidence and clinical potential. Ther Adv Med Oncol [Internet]. 2015 Mar;7(2):97–106. [cited 2019 Apr 3]. http://www.ncbi.nlm.nih.gov/pubmed/25755682.
- Varga A, Piha-Paul SA, Ott PA, Mehnert JM, Berton-Rigaud D, Johnson EA, Cheng JD, Yuan S, Rubin EH, Matei DE, et al. Antitumor activity and safety of pembrolizumab in patients (pts) with PD-L1 positive advanced ovarian cancer: interim results from a phase Ib study. J Clin Oncol [Internet]. 2015 May 20;33(15_suppl):5510. [cited 2019 Apr 3]. http://ascopubs.org/doi/10.1200/jco.2015.33.15_suppl.5510.
- Hamanishi J, Mandai M, Ikeda T, Minami M, Kawaguchi A, Murayama T, Kanai M, Mori Y, Matsumoto S, Chikuma S, et al. Safety and antitumor activity of anti–PD-1 antibody, nivolumab, in patients with platinum-resistant ovarian cancer. J Clin Oncol [Internet]. 2015 Dec 1;33(34):4015–4022. [cited 2019 Apr 3]. http://www.ncbi.nlm.nih.gov/pubmed/26351349.
- Burr ML, Sparbier CE, Chan KL, Chan Y-C, Kersbergen A, Lam EYN, Azidis-Yates E, Vassiliadis D, Bell CC, Gilan O, et al. An evolutionarily conserved function of polycomb silences the MHC Class I antigen presentation pathway and enables immune evasion in cancer. Cancer Cell [Internet]. 2019 Oct 14;36(4):385–401.e8. [cited 2019 Oct 23]. http://www.ncbi.nlm.nih.gov/pubmed/31564637.
- Luo N, Nixon MJ, Gonzalez-Ericsson PI, Sanchez V, Opalenik SR, Li H, Zahnow CA, Nickels ML, Liu F, Tantawy MN, et al. DNA methyltransferase inhibition upregulates MHC-I to potentiate cytotoxic T lymphocyte responses in breast cancer. Nat Commun [Internet]. 2018;9(1):1–11. doi:10.1038/s41467-017-02630-w.