
ABSTRACT
Checkpoint inhibitors have revolutionized cancer therapy and validated immunotherapy as an approach. Unfortunately, responses are seen in a minority of patients. Our objective is to use engineered adenoviruses designed to increase lymphocyte trafficking and cytokine production at the tumor, to assess if they increase the response rate to checkpoint inhibition, as these features have been regarded as predictive for the responses. When Ad5/3-E2F-d24-hTNFa-IRES-hIL2 (an oncolytic adenovirus coding for TNFa and IL-2, also known as TILT-123) and checkpoint inhibitors were used together in fresh urological tumor histocultures, a significant shift toward immune activity (not only tumor necrosis alpha and interleukin-2 but also interferon gamma and granzyme B) and increased T-cell trafficking signals (CXCL10) was observed. In vivo, our viruses enabled an anti-PD-L1 (a checkpoint inhibitor) delivering complete responses in all the treated animals (hazard ratios versus anti-PD-L1 alone 0.057 [0.007; 0.451] or virotherapy alone 0.067 [0.011; 0.415]). To conclude, when an engineered oncolytic adenovirus was utilized to modify the tumor microenvironment towards what meta-analyses have pointed as predictive markers for checkpoint inhibitory therapy, the response to them increased synergistically. Of note, key findings were confirmed in fresh patient-derived tumor explants.
Introduction
The impressive complete responses seen in some patients receiving immune checkpoint inhibitors (ICIs), and the increasing number of approved indications, are an objective sign of their success in terms of cancer therapy. Even though this is an ongoing golden era for ICIs, the majority of solid tumor patients still do not experience a long-term response. Some patients benefit only for a limited time while the majority derive no detectable benefit, especially when it comes to common types of non-melanoma solid tumors. Thus, ICIs have definitely been validated as an approach, but since a minority of patients benefit from them, there is an unmet clinical need.
An example of such unmet need can be seen in renal cell carcinoma (RCC) for which an anti-PD-1, nivolumab, has been approved for second-line treatment. In a randomized phase 3 trial, the confirmed response rate was 21.5% in the ICI arm versus 3.9% in the everolimus (an inhibitor of the mammalian target of rapamycine) arm. Median overall survival (OS) was 25.0 and 19.1 months, respectively.Citation1 Another clinical trial combined the use of an ICI (atezolizumab, anti-PD-L1) with an anti-VEGF (sunitinib) drug, increasing the overall response rate (ORR) to 32% (25% for anti-PD-L1 as monotherapy and 29% for sunitinib as monotherapy).Citation2 RCC is a tumor type previously described as “immunogenic” and some patients respond to high dose IL-2 treatment,Citation3 but the majority show no response to immunotherapies. Clear room for improvement exists in most tumor types, since ORR is still low (melanoma 40%,Citation4 urothelial carcinoma 21,1%,Citation5 non-small-cell lung cancer 19.4%,Citation6 hepatocellular carcinoma 14.3%,Citation7 among others).
Increasing the frequency of responses to ICIs is now a paramount aim for the entire cancer immunotherapy field. To understand the differences between patients and to correlate those with their clinical outcomes, many retrospective analyses have been performed. The most consistent findings correlate outcome with the presence of tumor-infiltrating lymphocytes (TILs), PD-L1 expression, total mutational burden, and the expression of immunostimulatory cytokines including interferon gamma (IFNg), tumor necrosis factor alpha (TNFa), and interleukin-2 (IL-2) among others.Citation8-Citation14
T-cell trafficking, PD-L1 expression, and cytokine signatures are features that can be addressed by the use of viral platforms. The era of using oncolytic viruses (OVs) solely for their direct tumor oncolytic ability while ignoring the effect they have on the immune system has morphed into oncolytic immunotherapy,Citation15 since human data indicated that the most relevant result of viral oncolysis appears to be related to the induction of anti-tumor immunity.Citation16 New generation oncolytic viruses are designed taking into account their lytic activity, but more importantly, highlighting their immune-related features such as immunogenic cell death, the release of tumor-associated antigens, pathogen-associated molecular patterns (PAMPs), damage-associated molecular patterns (DAMPs) and upregulation of MHC. Thus, OVs can stimulate both innate and adaptive immune systems.Citation17
Besides the intrinsic ability of viruses to interact with the immune system, they can be engineered to express cytokines, enzymes, or other proteins to target certain immune pathways. In short, many current OVs aim to destroy the tumor by engaging the immune system to do it. Oncolytic replication is also important, but perhaps chiefly because of its immunostimulatory consequences. Ad5/3-E2F-d24-hTNFa-IRES-hIL2 (TILT-123) is an engineered oncolytic adenovirus with chimeric serotype 5/3 designed specifically to be coupled with T-cell-related therapies such as adoptive-cell transferCitation18(such as chimeric antigen receptor [CAR]T-cell therapyCitation19) or ICIs.Citation20 To go beyond the inherent immunostimulatory activity of the presence of adenovirus in tumors, TILT-123 was tailored to enhance the antitumor effect of CD8 T cells. After infection with the virus, the tumor cell will express virally delivered TNFa and IL-2 genes before dying. These two cytokines are released into the tumor microenvironment to attract T cells toward the tumor to sustain their proliferation and activity.Citation21–Citation23 The addition of ICIs would keep newly recruited or locally generated TILs protected from the inhibitory signals exploited by the tumor.
Our main hypothesis is that the use of a genetically modified adenovirus armed with TNFa and IL-2 changes the tumor circumstances toward those seen in patients with the best responses to ICI (“hot tumors,” understood as tumors highly infiltrated with antitumor immune cells), and those changes might help to increase the response rate to checkpoint blockade. To test the abovementioned hypothesis, we used human tumor histocultures and an in vivo model allowing us to approach the questions from different angles. These allowed us to study tumor microenvironment remodeling at the cellular and cytokine level but also anti-tumor efficacy and OS.
Materials and methods
Human tumor histocultures from urological tumor samples
Urological samples were collected from surgically removed kidneys and turned into single-cell suspension following the previously described methodology.Citation24 In short, tissues were cut into fragments of an approximate diameter of 5 mm and then incubated overnight in a medium containing various enzymes to create a single-cell suspension that was subsequently plated into 6-well plates. Single-cell cultures were treated with viruses (Ad5/3-E2 F-d24-hTNFa-IRES-hIL2, multiplicity of infection 100), 20 µg/mL of anti-human PD-L1 (Atezolizumab, Roche, Basel, Switzerland), or the both in triplicates. Cytokine production and cell viability were assessed after 1, 3, and 7 d.
Histopathology analyses
Hematoxylin and eosin (H&E), and CD8 (clone 4B11, CD8-4B11-L-CE-H, Leica Biosystems, Wetzlar, Germany) stainings were performed on patient samples and analyzed by a trained pathologist. For PD-L1 expression assessment, the PD-L1 VENTANA (SP142) assay (Roche, Basel, Switzerland) was performed by a trained pathologist and scored under routine protocols in the clinical set-up. Histopathological analyses from murine samples were carried out by a veterinary pathologist as described previously.Citation25
Cell viability assay
Human tumor histocultures were treated (as described before) up to 7 d. Cell viability was assessed with "Cell Titer 96 AQueous One Solution Cell Proliferation Assa" (G3582, Promega, Madison, Wisconsin, USA), following manufacturer indications. The viability of mock-treated cells was set to 100%.
In vivo experiments
To study treatment-induced changes in tumors, 2.5 × 10⁵ B16.OVA melanoma cells were implanted subcutaneously on 4–6 week old female C57BL/6JOlaHsd mice (Envigo Labs, Huntingdon, UK). Eleven days after engraftment, animals were randomized into groups (n = 12-14/group). Then, they received systemic treatments of 0.1 mg of anti-PD-L1 (clone 10 F.9G2, BE0101, BioXCell, Lebanon, New Hampshire, USA) and intratumoral injections of 1 × 10⁸ vp (including equal amounts of Ad5-CMV-mIL2 and Ad5-CMV-mTNFa viruses, non-replicative in mice) on days 0, 1, 3, and 6. PBS was injected intratumorally for groups that did not receive virus. On day 7, 6 animals per group were sacrificed and tumors collected to investigate immune-cell phenotyping and cytokine signatures. The rest of the animals (n = 6–8/group) continued to a 90-d OS study, where the treatments continued once every 3 d, until maximum tumor size reached (18 mm) or complete tumor regression.
Cell lines and viruses
B16.OVA, a mouse melanoma cell line was cultured under recommended conditions.Citation20 The cytokine-armed murine adenoviruses’ (Ad5-CMV-mIL2 and Ad5-CMV-mTNFa) construction and production have been described previouslyCitation23 and were used in the in vivo experiments. For the human tumor histoculture experiments, the oncolytic Ad5/3-E2 F-d24-hTNFa-IRES-hIL2 (known as TILT-123)Citation21 was used.
Cytokine analyses
Cell culture medium supernatants coming from tumor histocultures were collected after 1, 3, and 7 d. Sample size for the cytokine analyses was restricted on availability of tumor sample (mock; n = 4, aPD-L1; n = 6, virus; n = 3, virus+aPD-L1 (S); n = 2, virus+aPD-L1 (PB); n = 0). The cytokine levels (IFNg, TNFa, IL-2, IFNb, granzyme B, CXCL10, IL-6, arginase, and TGF-b1) on the samples were assessed with a custom Legendplex panel (Biolegend, Dedham, Massachusetts, USA) and a Free Active/Total TGF-b1 detection kit (740488, 740486, and 740487, Biolegend, Dedham, Massachusetts, USA). Cytometric Bead Array Mouse Th1/Th2/Th17 Cytokine kit (560485, BD, Franklin Lakes, New Jersey, USA) was used to study murine tumor samples as described before.Citation20 Both cytokine bead arrays were analyzed with Accuri® (BD, Franklin Lakes, New Jersey, USA). The obtained cytokine values were normalized to total protein concentration of the sample.
PD-L1/2 expression assays
When studying PD-L1 expression dynamics, B16.OVA cells were treated with 1000 U/mL of murine IFNg (315–05, Peprotech, Stockholm, Sweden), a known inducer for PD-L1 expression. Mock control cells were left untreated. After 24 h of culture, a fraction of the cells were checked for PD-L1 expression and the rest were washed twice with PBS and passed to duplicate 12-well plates. Part of the cells previously treated with IFNg stopped receiving the treatment (“withdrawn” group) and the other part continued with the treatment (“IFNg kept” group). The plates were analyzed 24 h and 72 h after the plating.
Similarly, the effect of IFNg (1000 U/mL), TNFa (1000 U/mL and 10000 U/mL), IL-2 (1000 U/mL and 10000 U/mL), Ad5-luc (1 and 100 vp/cell), Ad5-CMV-mIL2 (1 and 100 vp/cell), Ad5-CMV-mTNFa (1 and 100 vp/cell), or different combinations of those on PD-L1 and PD-L2 expression on B16.OVA cells. These expression levels were studied at 24- and 72-h time points.
Flow cytometry
Cell cultures and tumor samples were processed and labeled as described elsewhere.Citation20 Anti-CD4-FITC (clone GK1.5, 100406, Biolegend, Dedham, Massachusetts, USA), anti-CD3e-PE (clone 145-2C11, 12-0031-82, eBioscience, San Diego, California, USA), anti-CD69-PE-Dazzle (clone H1.2 F3, 104536, Biolegend, Dedham, Massachusetts, USA), anti-CD8-PE-Cy5 (clone 53.6–7, 100710, Biolegend, Dedham, Massachusetts, USA), anti-PD-1-PE-Cy-7 (clone 29 F.1A12, 135216, Biolegend, Dedham, Massachusetts, USA), anti-CD45-FITC (clone 30-F11, 103107, Biolegend, Dedham, Massachusetts, USA), anti-PD-L2-PE (clone MIH5, 558091, BD, Franklin Lakes, New Jersey, USA), anti-Gr-1-PE-Dazzle (RB6-8C5, 108452, Biolegend, Dedham, Massachusetts, USA), anti-CD11b-PE-Cy5 (M1/70, 101210, Biolegend, Dedham, Massachusetts, USA), anti-PD-L1-PE-Cy7 (TY-25, 107214, Biolegend, Dedham, Massachusetts, USA) were used for flow cytometric analyses under manufacturer’s indications. The analyses were performed with SH800Z cytometer (SONY, Minato, Japan).
Statistical analyses
Tumor growth evolution was studied by a mixed-model analysis of log-transformed tumor volumes with SPSS Statistics 25 (IBM, Armonk, New York, USA). GraphPad (San Diego, California, USA) software was used to present the data, to analyze OS (Kaplan–Meier, Log-rank Mantel–Cox test), Hazard Ratios (HRs), and 95% confidence intervals (CIs). In addition, GraphPad was used to evaluate the differences between groups in cytometry or cytokine analyses (unpaired t-test with Welch’s correction), correlation analyses between variables (Pearson’s r), over-time evolution of variables (two-way ANOVA), and linear regression. Synergy was calculated using the fractional tumor volume (FTV) method. P values < .05 were considered statistically significant. Data is available upon reasonable request.
Ethics approval and consent to participate
Central Hospital Operative Ethics Committee approved the studies (HUS/850/2017) performed on patients’ material and written informed consent was given by the patients. Experimental protocols for animal studies were reviewed and approved by the ethical committee from the National Animal Experiment Board of the Regional State Administrative Agency of Southern Finland, and all the procedures were carried out in accordance with the recommendations in the Act on the Protection of Animals Used for Scientific or Educational Purpose (497/2013) and Government Decree on the Protection of Animals Used for Scientific or Educational Purposes (564/2013) as well as the European Directive 2010/63/EU.
Results
Oncolytic adenovirus-mediated tumor cell lysis in patient-derived urological tumor histocultures
To understand how oncolytic virotherapy can enable responses to checkpoint inhibitors in solid tumors, three surgically removed tissues were studied. The tumor types (urothelial carcinoma: sample 1. Clear cell renal cell carcinoma: samples 2 and 3) are currently approvedCitation26 for anti-PD-L1 treatment or there are Phase III clinical studies showing evidence of benefit for the therapyCitation27. These tumors were pathological grade 3 (sample 2) or 4 (samples 1 and 3) as evaluated from the hematoxylin and eosin staining (). Because one of the primary effects of the virally delivered cargo affects CD8 + T cells, their presence was also assessed (), showing two samples with an immune-excluded (“cold”) phenotype (Samples 1 and 2) and one with an immune-inflamed (“hot”) phenotype (sample 3). In addition, of relevance for anti-PD-L1 targeting, an assay to determine PD-L1 positivity was performed. This showed PD-L1 expression below 5% in immune cells in all samples, making them negative according to the test guidelines ().
Figure 1. Urological cancer patient-derived samples respond to oncolytic virotherapy despite phenotypical differences.
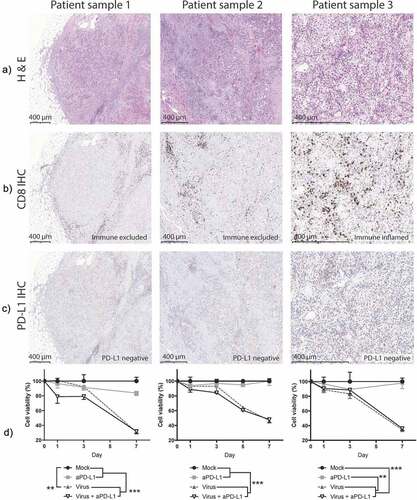
After sample processing, a viability assay was performed to measure how the treatments affected the survival of tumor histocultures (). By day 7, a statistically significant decrease in tumor viability was achieved with virotherapy in all three samples when compared with mock or anti-PD-L1 monotherapy (p < .01). At that time, the viability of the virally treated groups dropped 62% (95%CI = [54.19; 69.89]) compared with mock and 56% (95%CI = [38.49; 73.39]) when compared with anti-PD-L1-treated samples. Already on day 1, there were significant reductions on cell viability in two of the samples, when virus and anti-PD-L1 were given together.
Oncolytic virotherapy triggers a broad immunostimulatory response in human urological tumor histocultures
We also studied the histocultures for the impact of the treatments on cytokine levels (). Because of the heterogeneity typically seen in actual patient tumors, cytokine levels between samples varied. Nevertheless, groups receiving virotherapy displayed a clear trend for increased expression of immunostimulatory cytokines (IFNg, TNFa, IL-2, granzyme B, and CXCL10) (, Supp. ). Regarding IFNg, increased production was achieved when Ad5/3-E2 F-d24-hTNFa-IRES-hIL2 was administered together with anti-PD-L1 in comparison with “Mock” (p = .0182) and “anti-PD-L1” alone groups (p = .0181). The “Virus” alone group had a similar trend (p = .068). TNFa and IL-2 production were also increased in virally treated groups and the differences were significant when samples were analyzed individually (Supp. Figure 2b-c). IFNb production, on the other hand, was not as clearly affected as the other immunostimulatory cytokines, except for a peak in production on day 3 with the double treatment.
Figure 2. Responses to virotherapy and checkpoint inhibitor treatments at the cytokine level across 7 d of treatment.
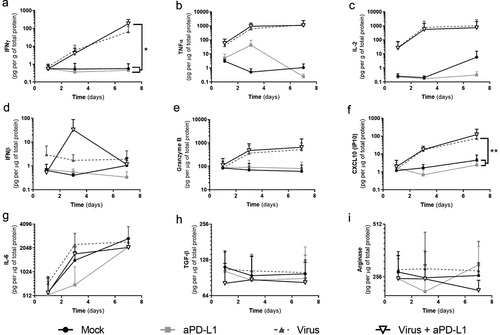
Granzyme B and CXCL10 had higher expression values in virally treated groups. The expression of these two proteins correlated with IFNg expression (IFNg/Granzyme B: r = 0.629 [0.376; 0.792], p < .001. IFNg/CXCL10: r = 0.494 [0.198; 0.708], p = .002). CXCL10 expression was significantly increased in “Virus” group when compared with “Mock” (p = .003) and with “anti-PD-L1” (p = .002). Treatment with aPD-L1 alone did not affect the expression of immunostimulatory markers compared with “Mock” group.
Statistically significant reduction of IL-6 was achieved by “anti-PD-L1” group and “Virus + anti-PD-L1” when compared with “Mock” or “Virus” in two out of three samples (Supp. Figure 2g). Regarding immunosuppressive mediators (TGF-b, and arginase), effects of treatments are not as clear as for the stimulatory ones. For TGF-b (Supp. Figure 2h) significant decreases were achieved in all samples for the “Virus + anti-PD-L1” group, while for “anti-PD-L1” group this was seen only in one sample. Arginase was included in the panel, despite the fact not being a cytokine but an enzyme affecting immune activity. For this enzyme, one sample displayed reduced expression in the “anti-PD-L1” group and “Virus + anti-PD-L1” when compared with “Mock” or “Virus” (Supp. Figure 2i).
Treatment-induced immunostimulatory cytokine production relates to the reduction of viability in solid tumor samples
To compare the differential expression of markers in tumor histocultures on day 7, average fold change compared with “Mock” was plotted side-by-side (). Among the six stimulatory markers analyzed, the increase in TNFa and IL-2 expression is likely related, at least partially, to viral expression of the transgenes and cannot be distinguished from the endogenous production. Of note, there was more than a 1000-fold increase in TNFa expression and around a 100-fold increase for IL-2. Regarding IFNg, virally treated groups displayed over a 100-fold increase compared with mock conditions. Interestingly, the addition of anti-PD-L1 to virus treatment results in 10 times higher expression when compared to virus alone (1000 times higher than in “Mock”). Additionally, virus treatments induced an average of 25-fold increase in CXCL10 levels.
Figure 3. Analyses of grouped cytokine responses to virotherapy and checkpoint inhibitor treatments on day 7.
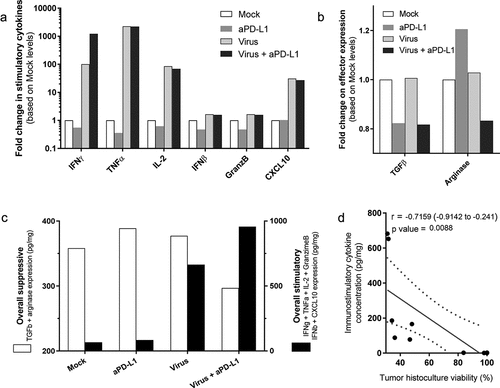
The treatments had a less drastic effect on the expression levels of TGF-b, and arginase (). Anti-PD-L1 therapy seemed to reduce the amount of TGF-b, while arginase expression was reduced only when both the virus and the checkpoint inhibitor were given together. To compare the presence of the measured immune-suppressors and immune-stimulators present at the tumor, average values of TGF-b and arginase were plotted against average values of IFNg, IFNb, granzyme B, and CXCL10 (), to have an overall view on the two types of signals for each group. The use of both treatments together induced a decrease in immune suppression, delivered by the checkpoint inhibitor, and immunostimulation via virotherapy. An inversely proportional correlation was seen between the production of immunostimulatory cytokines and the tumor histoculture cell viability (r = −0.716 [−0.914; −0.241], p = .009)(). No correlation was found between cell viability and immunosuppressive cytokines.
TNFa and IL-2 expressing adenoviruses enable anti-PD-L1 therapy in vivorendering 100% complete response rate
Next, we aimed to assess if immune-stimulation triggered by the virus and reduced suppression achieved by anti-PD-L1 was reproducible in vivo. In addition, we wanted to study the impact of tumor immune remodeling in terms of anti-tumor efficacy (). To understand the interaction between the treatments, two groups were treated with viruses and checkpoint inhibitors but with different administration regimens; while one group received both treatments simultaneously (S) the other received the virus treatment, in a “prime and boost” manner (PB). In the prime and boost group, the virus is given without anti-PD-L1 for two rounds and then anti-PD-L1 is included in the treatment.
Figure 4. In vivo testing of virotherapy to enable checkpoint inhibitory therapy.
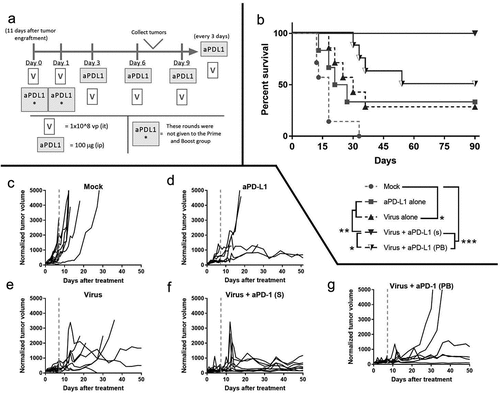
The two groups that received viruses and anti-PD-L1 together displayed better results in terms of survival than the other groups (). Particularly, when the viruses (intratumoral) were administered simultaneously with anti-PD-L1 (intravenous), 100% complete response rate was achieved. The “Virus + aPD-L1 (s)” group had significantly longer survival than any other group (p < .001 against “Mock,” p = .007 against “aPD-L1,” p = .005 against “Virus” and p = .025 against “Virus + aPD-L1 (PB)”). The hazard ratio of the “Virus + aPD-L1 (s)” strategy was superior over any other group studied (HR = 0.033 [0.006; 0.181] against “Mock,” HR = 0.057 [0.007; 0.451] against “aPD-L1,” HR = 0.067 [0.011; 0.415] against “Virus” and HR = 0.104 [0.014; 0.752] against “Virus + aPD-L1 (PB)”).
The “prime and boost” approach resulted in significantly longer OS (p < .001) and lower HR (0.059 [0.012; 0.290]) over mock. Virotherapy or checkpoint inhibitor monotherapy resulted in circa 33% CR. OS with virotherapy alone was statistically improved over mock (p = .016), with a lower HR (0.180 [0.044; 0.727]). Individual tumor volume graphs were also plotted () and synergistic effects were seen following dual therapy (Supp. Figure 3) as early as day 5. At day 90 after the treatments started, some of the animals that had undergone a complete response had a scar tissue in the peritumoral area. After the sacrifice of the animals, scars were collected and analyzed by a pathologist (Supp. Figure 4), who reported the presence of melanophages, plasma cells, and lymphocytes, but no malignant cells.
Virotherapy increases the amount of active CD8T cells intratumorally in vivo
To assess the early immunological impact of the treatments, six animals per group were randomly selected, sacrificed, and tumors collected on day 7. Virotherapy increased the proportion of CD8 + T cell trafficking to the tumor (). Statistical significances were achieved for the “Virus” group (p = .011) and in the “virus + aPD-L1 (PB)” (p = .003) when compared with “Mock,” which had almost no infiltration of CD8+ cells. The other virally treated group, “virus + aPD-L1 (s),” also had a sub-significant increase in CD8+ T cells (p = .093), but the highest mean levels among all the groups. Regarding the total CD8 T-cell population present in tumors, there were more activated cells (based on CD69 expression) when the animals were treated with virotherapy (p < .05 for all the virally treated groups) ().
Figure 5. In vivo responses to virotherapy and checkpoint inhibitor treatments on day 7 analyzed by flow cytometry.
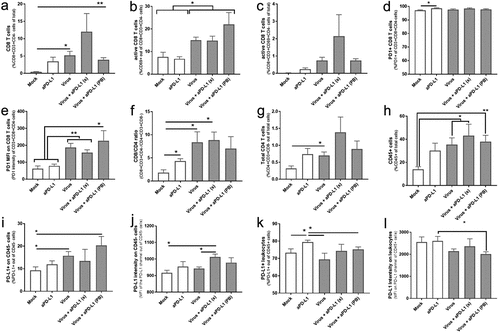
Upon measuring the proportion of active CD8 T cells out of total cells, the average values in virally treated groups were up to 100 times higher (virus + aPD-L1 (s)) when compared with “Mock” values (). The percentage of PD-1 positive cells among tumor-infiltrating CD8 T cells was nearly 100% for all groups (). When PD-1 expression intensity was addressed, significant differences were observed in the groups receiving viral vectors (). In fact, PD-1 expression intensities correlated with the percentage of active T CD8 cells (r = 0.927 [0.849; 0.9655], p < .0001) (Supp. ).
The CD8/CD4 ratio increased in treated groups (). There is also a trend toward an increase in CD4+ cells in the groups treated with both virus and ICI (), but in a less steep manner than CD8+cells. Regarding the overall trafficking of leukocytes (defined here as CD45+ cells), tumors treated with viruses displayed a significant increase ().
In the context of anti-PD-L1 therapy, it is especially relevant to understand the expression of tumor PD-L1 and PD-L2. For that reason, it was studied if any of the cytokines encoded by the viruses, the viruses themselves, or their combination was able to upregulate PD-L1 (Supp. Figure 6a) or PD-L2 (Supp. Figure 6b). Unlike IFNg, the cytokine-producing virus or the components separately did not upregulate PD-L1 or PD-L2. Interestingly, induction achieved with IFNg was reversible as the levels returned to the baseline after 72 h of culturing without IFNg (Supp. Figure 6c-e). In accordance, the groups with a higher presence of active CD8 T cells and higher IFNg production (see below) displayed a higher percentage of PD-L1+ tumor cells () and the highest PD-L1 intensity ().
Alteration of PD-L1 expression by IFNg did not occur in the leukocyte fraction. The only group with a statistically significant increase in the percentage of PD-L1+ cells () and PD-L1 intensity () was the one treated with anti-PD-L1 monotherapy.
PD-L2 expression was also studied (Supp. Fig 7a-d). In this case, virus monotherapy induced a significant increase in the percentage of positive cells when compared with every other group in both CD45- and CD45+ populations (“tumor” and “leukocyte,” respectively). It is noticeable that both monotherapies increased PD-L2 signals, but that increase did not occur when therapies were administered together. PD-L2 effects are of unknown significance at this point, since the role of this molecule in immunotherapy is unclear in general.
Myeloid-derived suppressor-like cells (MDSCs) constitute another relevant cell population due to their ability to disable immune activity. For that reason, they were studied in terms of suppressive ligands (Supp. Fig 7e-j). Their inherent suppressivity was observed as all of them expressed PD-L1 and PD-L2, the levels being more intense in the group treated with virus as monotherapy.
Oncolytic virotherapy triggers a broad immunostimulatory cytokine response in vivo
Similarly, as done with urological human tumor histocultures, we proceeded to study the differential expression of immune-stimulatory and immune-suppressive cytokines in melanoma tumors collected 7 d after treatments started. A trend for increased IFNg production was observed for the “virus+aPD-L1 (S)” group, which was less marked for groups treated with monotherapies (). The IFNg production correlated with the presence of CD8 T cells in the tumors (r = 0.720 [0.330; 0.900]) (Suppl ).
Figure 6. Responses to virotherapy and checkpoint inhibitor treatments at the cytokine level from in vivo experiment on day 7.
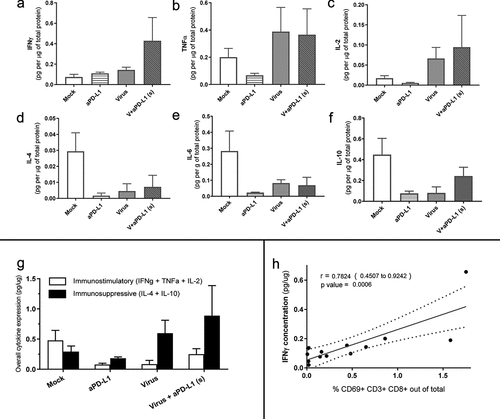
Regarding TNF and IL-2, virally treated animals expressed high levels (), most likely deriving from the viruses at least in part. Suppressive cytokines, such as IL-4 and IL-10, seemed to be higher in “Mock” conditions, while both checkpoint inhibitors and viruses reduced their expression (). When immunosuppressive and immunostimulatory cytokines were plotted together, we did not observe remarkable differences between the two groups receiving virotherapy, but there was a trend toward lower immunosuppression and increased immunostimulation when comparing those groups with “Mock” and “anti-PD-L1” ().
Another correlation was found between the presence of active (CD69+) CD8 T cells and IFNg in the tumor microenvironment (r = 0.782[0.451; 0.924]) (). The groups with higher IFNg also displayed increased PD-L1 expression on tumor cells (,j).
Discussion
In this study, we show how a viral platform coding for TNFa and IL-2 has a considerable impact on the immune tumor microenvironment, which led to higher responses in the context of anti-PD-L1 checkpoint inhibition. Similar results were observed both in human urological clinical sample histocultures (renal cell cancer and urothelial cancer) and in vivo, resulting in improved tumor growth control and survival. It is noteworthy that both monotherapies had a positive effect. When they were used together, synergistic antitumor control was clear in the context of tumor control when studied in immunocompetent models, and beneficial outcomes were observed when analyzing immune mediators. Importantly, checkpoint inhibition prevented the switching-off of crucial virus-mediated anti-tumor immune responses. It was only when both aspects were taken into account (activation and prevention of de-activation) that the immune system was able to completely eradicate tumors.
In patients, complete responses are quite rare, partial responses are more common, but even taken together, ORR with ICIs are between 10–40% following monotherapy in most solid tumor types. However, it has been noted that TIL presenceCitation8,Citation9 and upregulated inflammatory cytokine signatureCitation11-Citation13 are among the strongest predictive factors. In this regard, it is potentially important that the studied viral platform was able to make “cold” tumors “hot,” to enable effective ICI therapy, for an increased response rate and survival. In animal studies, we observed how the presence of TILs increased after virus treatment, and rose further when combined with a checkpoint inhibitor, showing again the rationale for their combination. This finding is especially relevant in the model used, where the presence of CD8 T cells is near zero in Mock conditions. The effect of the approach in inducing CD8 trafficking to solid tumors was later validated in a different in vivo model (Supp. Figure 8). The ability of the TNFa and IL2 coding adenovirus to increase TIL trafficking towards the tumor has been previously described by immunohistochemistryCitation19 and SPECT/CT.Citation23 In tumor histocultures, groups receiving virotherapy also showed higher expression of CXCL10, a chemokine able to promote TIL trafficking.Citation28 With regard to inflammatory cytokine signatures, extensive upregulation was seen both ex vivo and in vivo.
Other relevant predictive factors are total mutational burden and PD-L1 expression. The mutational burden relates to the probability of immune responses.Citation29,Citation30 In this regard, virotherapy probably does not increase or reduce the mutational burden actively, but it has been shown that oncolysis is a mechanism for releasing neoantigens, enhancing their availability to antigen-presenting cells.Citation31,Citation32 PD-L1 expression has been used as an indication-defining marker for some tumor types such as non-small-cell lung cancer.Citation33 However, its baseline expression is not a fully reliable marker.Citation10,Citation12,Citation34 The fact that PD-L1 can be expressed both on tumor and immune cells lowers its predictive value. Additionally, PD-L1 expression could imply different things if it is present as a response to IFNg or because of epigenetic dysregulation indicating immunosuppression.Citation35
In our studies, we observed that PD-L1 was upregulated in tumor cells in those groups with higher expression of IFNg. This observation raised the question whether PD-L1 upregulation could be explained by direct IFNg exposure or by some other component of the treatment. To address this issue, we exposed cancer cells to treatment components (backbone viruses and recombinant TNFa/IL-2, altogether and separately) and IFNg. We observed that IFNg stimulus directly produced PD-L1 upregulation on tumor cells but the same did not occur with the rest of the elements involved in the treatments.
In the previous work,Citation20 we addressed the issue of the sequencing administration of virus and anti-PD-1 ICI. We showed that delaying the administration of anti-PD-1 was beneficial for anti-tumor effects, and provided some speculation on the mechanism of the prime-and-boost. In contrast, our results reported here suggest that for PD-L1 blockade simultaneous administration is more effective. Zamarin, D et al.Citation36 arrived at similar conclusions when using Newcastle Disease Virus in combination with anti-PD-L1. A possible mechanistic explanation is that the first wave of PD-L1 upregulation in the tumor is related to a virotherapy-induced innate cytokine-mediated response, while after 4–5 d, when PD-1-positive lymphocytes get to the tumor, the adaptive responses trigger another wave of PD-L1 upregulation. This hypothesis suggests that PD-1 blockade would be needed only after 4–5 d, while PD-L1 blockade is useful from the moment the virus is delivered into the tumor. Another plausible explanation on the difference between antibodies could be that the anti-PD-L1 used here is able to trigger antibody-dependent cellular cytotoxicity while the anti-PD-1 used previously is not as suggested by Dahan, R. et al.Citation37 It is of importance to note that not all ICIs are alike when it comes to combination use with oncolytic viruses. Preclinical studies can be useful in providing a rationale for clinical translation.
Combination immunotherapy is being widely explored and the use of OVs with ICIs has produced promising results in early clinical trials.Citation38,Citation39 One of the most encouraging approaches features the combination of talimogene laherparepvec (herpes virus expressing granulocyte-monocyte colony-stimulating factor (GM-CSF)) with pembrolizumab (anti-PD-1).Citation40 This study reported an increase in response rate (when compared with historical ICI-treated cohorts) without any major increase in toxicity. A phase 3 trial with this approach is ongoing (NCT02263508). It also sets as a promising precedent for the combination of these two immunotherapies.
Unlike talimogene laherparepvec, which targets antigen-presenting cells, the virus used in this work (Ad5/3-E2F-d24-hTNFa-IRES-hIL2 (TILT-123)) was designed in a data-driven manner to enable T cells and T-cell therapies including ICI.Citation21,Citation22 TNFa, and IL-2 have a direct effect on effector T cells, while GM-CSF has only indirect effects. This may be a critical advantage in the context of T-cell therapies and ICI. In a complementary setting, we compared the virus coding for TNFa and IL-2 to the unarmed version, showing the critical importance of the transgenes in reshaping the immune microenvironment.Citation24 At the preclinical level, the use of virotherapy together with ICI has been studied by othersCitation39 but, achieving 100% OS and 100% tumor control rate in this model is an infrequent achievement. Another relevant feature regarding the experimental design used in the in vivo part of this study is that we allowed immunosuppression to develop by allowing tumors to grow longer before initiating therapy, as compared with other studies in the same model.Citation36,Citation41
Nevertheless, our study has some limitations. First, there are no optimal models to test the effect of both treatments. Human ex vivo tumor histocultures are an acceptable way to study tumor oncolysis and the local impact of the therapies, but the entire immune system is not present. Thus, cell trafficking and generation of adaptive responses are not possible. Regarding animal models, murine cells are not susceptible to adenoviral replication. Thus, even if the transgenes are expressed and the immune activation is achieved, late stages of the viral cycle do not occur, and there is practically no production of new viral particles.Citation42 Another model sometimes considered is the Syrian hamster (Mesocricetus auratus), as it supports human adenovirus replication and oncolysis.Citation43 Unfortunately, there are no checkpoint inhibitory antibodies available to study the combination with the virus.
In conclusion, we have described how an adenoviral platform coding for TNFa and IL-2 can be used to increase responses to PD-L1. The mechanism relates to the broad upregulation of stimulatory cytokines (IFNg, IFNb, granzyme B, and CXCL10 besides the virally produced TNFa and IL-2) and the attraction of active CD8 T cells and other leukocytes to the tumor. These changes in the tumor make them resemble immunologically “hot” tumors, which often respond to ICIs. Understanding what makes patients respond and extending this knowledge to other patients will expand the utility of tumor immunotherapy to larger patient populations. The data provided here set the stage for clinical translation of TILT-123 with anti-PD-L1.
Disclosure of potential conflicts of interest
A.H. is a shareholder in Targovax ASA (Oslo, Norway) and in TILT Biotherapeutics Ltd. (Helsinki, Finland). A.H., M.S., R.H., S.S., J.M.S., and V.CC. are employees of TILT Biotherapeutics Ltd. Other coauthors declare no potential conflict of interest.
Supplemental Material
Download ()Acknowledgments
We thank Susanna Grönberg-Vähä-Koskela, Riikka Kalliokoski, and Minna Oksanen for their assistance during the study. The Biomedicum Flow Cytometry Core Facility and the Tissue Preparation and Histochemistry Unit (University of Helsinki), as well as the Laboratory Animal Centre (University of Helsinki), are appreciated for their technical support. We are grateful for Tiina Gyllenberg, Hanna Kangasmäki, and the staff at the Docrates Cancer Clinic for their kind assistance.
Supplementary material
Supplemental data for this article can be accessed on the publisher’s website.
Additional information
Funding
References
- Xu JX, Maher VE, Zhang L, Tang S, Sridhara R, Ibrahim A, Kim G, Pazdur R, Approval Summary: FDA. Nivolumab in advanced renal cell carcinoma after anti-angiogenic therapy and exploratory predictive biomarker analysis. Oncologist. 2017;22:311–12. doi:10.1634/theoncologist.2016-0476.
- McDermott DF, Huseni MA, Atkins MB, Motzer RJ, Rini BI, Escudier B, Fong L, Joseph RW, Pal SK, Reeves JA, et al. Clinical activity and molecular correlates of response to atezolizumab alone or in combination with bevacizumab versus sunitinib in renal cell carcinoma. Nat Med. 2018;24:749–757. doi:10.1038/s41591-018-0053-3.
- Itsumi M, Tatsugami K. Immunotherapy for renal cell carcinoma. Clin Dev Immunol. 2010;2010:284581. doi:10.1155/2010/284581.
- Lugowska I, Teterycz P, Rutkowski P. Immunotherapy of melanoma. Contemp Oncol. 2018;22:61–67.
- Bellmunt J, de Wit R, Vaughn DJ, Fradet Y, Lee J-L, Fong L, Vogelzang NJ, Climent MA, Petrylak DP, Choueiri TK, et al. Pembrolizumab as second-line therapy for advanced urothelial carcinoma. N Engl J Med. 2017;376:1015–1026. doi:10.1056/NEJMoa1613683.
- Lim SH, Sun J-M, Lee S-H, Ahn JS, Park K, Ahn M-J. Pembrolizumab for the treatment of non-small cell lung cancer. Expert Opin Biol Ther. 2016;16:397–406. doi:10.1517/14712598.2016.1145652.
- El-Khoueiry AB, Sangro B, Yau T, Crocenzi TS, Kudo M, Hsu C, Kim TY, Choo SP, Trojan J, Welling THR, et al. Nivolumab in patients with advanced hepatocellular carcinoma (CheckMate 040): an open-label, non-comparative, phase 1/2 dose escalation and expansion trial. Lancet. 2017;389:2492–2502. doi:10.1016/S0140-6736(17)31046-2.
- Tumeh PC, Harview CL, Yearley JH, Shintaku IP, Taylor EJ, Robert L, Chmielowski B, Spasic M, Henry G, Ciobanu V, et al. PD-1 blockade induces responses by inhibiting adaptive immune resistance. Nature. 2014;515:568–571. doi:10.1038/nature13954.
- Nishino M, Ramaiya NH, Hatabu H, Hodi FS. Monitoring immune-checkpoint blockade: response evaluation and biomarker development. Nat Rev Clin Oncol. 2017;14:655–668. doi:10.1038/nrclinonc.2017.88.
- Chen DS, Mellman I. Elements of cancer immunity and the cancer-immune set point. Nature. 2017;541:321–330. doi:10.1038/nature21349.
- Ribas A, Robert C, Hodi FS, Wolchok JD, Joshua AM, Hwu W-J, Weber JS, Zarour HM, Kefford R, Loboda A, et al. Association of response to programmed death receptor 1 (PD-1) blockade with pembrolizumab (MK-3475) with an interferon-inflammatory immune gene signature. J Clin Oncol. 2015;33:3001. doi:10.1200/jco.2015.33.15_suppl.3001.
- Herbst RS, Soria JC, Kowanetz M, Fine GD, Hamid O, Gordon MS, Sosman JA, McDermott DF, Powderly JD, Gettinger SN, et al. Predictive correlates of response to the anti-PD-L1 antibody MPDL3280A in cancer patients. Nature. 2014;515:563–567. doi:10.1038/nature14011.
- Fehrenbacher L, Spira A, Ballinger M, Kowanetz M, Vansteenkiste J, Mazieres J, Park K, Smith D, Artal-Cortes A, Lewanski C, et al. Atezolizumab versus docetaxel for patients with previously treated non-small-cell lung cancer (POPLAR): a multicentre, open-label, phase 2 randomised controlled trial. Lancet. 2016;387:1837–1846. doi:10.1016/S0140-6736(16)00587-0.
- Jacquelot N, Roberti MP, Enot DP, Rusakiewicz S, Ternès N, Jegou S, Woods DM, Sodré AL, Hansen M, Meirow Y, et al. Predictors of responses to immune checkpoint blockade in advanced melanoma. Nat Commun. 2017;8:592. doi:10.1038/s41467-017-00608-2.
- Fukuhara H, Ino Y, Todo T. Oncolytic virus therapy: A new era of cancer treatment at dawn. Cancer Sci. 2016;107:1373–1379. doi:10.1111/cas.13027.
- Hemminki O, Hemminki A. A century of oncolysis evolves into oncolytic immunotherapy. Oncoimmunology. 2016;5:e1074377. doi:10.1080/2162402X.2015.1074377.
- Bommareddy PK, Shettigar M, Kaufman HL. Integrating oncolytic viruses in combination cancer immunotherapy. Nat Rev Immunol. 2018;18:498–513. doi:10.1038/s41577-018-0014-6.
- Santos JM, Cervera-Carrascon V, Havunen R, Zafar S, Siurala M, Sorsa S, Anttila M, Kanerva A, Hemminki A. Adenovirus coding for interleukin-2 and tumor necrosis factor alpha replaces lymphodepleting chemotherapy in adoptive T cell therapy. Mol Ther. 2018;26:2243–2254. doi:10.1016/j.ymthe.2018.06.001.
- Watanabe K, Luo Y, Da T, Guedan S, Ruella M, Scholler J, Keith B, Young RM, Engels B, Sorsa S, et al. Pancreatic cancer therapy with combined mesothelin-redirected chimeric antigen receptor T cells and cytokine-armed oncolytic adenoviruses. JCI Insight. 2018;3(7):e99573.
- Cervera-Carrascon V, Siurala M, Santos JM, Havunen R, Tahtinen S, Karell P, Sorsa S, Kanerva A, Hemminki A. TNFa and IL-2 armed adenoviruses enable complete responses by anti-PD-1 checkpoint blockade. Oncoimmunology. 2018;7:e1412902. doi:10.1080/2162402X.2017.1412902.
- Havunen R, Siurala M, Sorsa S, Gronberg-Vaha-Koskela S, Behr M, Tahtinen S, Santos JM, Karell P, Rusanen J, Nettelbeck DM, et al. Oncolytic adenoviruses armed with tumor necrosis factor alpha and interleukin-2 enable successful adoptive cell therapy. Mol Ther Oncolytics. 2017;4:77–86. doi:10.1016/j.omto.2016.12.004.
- Tahtinen S, Kaikkonen S, Merisalo-Soikkeli M, Gronberg-Vaha-Koskela S, Kanerva A, Parviainen S, Vaha-Koskela M, Hemminki A. Favorable alteration of tumor microenvironment by immunomodulatory cytokines for efficient T-cell therapy in solid tumors. PLoS One. 2015;10:e0131242. doi:10.1371/journal.pone.0131242.
- Siurala M, Havunen R, Saha D, Lumen D, Airaksinen AJ, Tahtinen S, Cervera-Carrascon V, Bramante S, Parviainen S, Vaha-Koskela M, et al. Adenoviral delivery of tumor necrosis factor-alpha and interleukin-2 enables successful adoptive cell therapy of immunosuppressive melanoma. Mol Ther. 2016;24:1435–1443. doi:10.1038/mt.2016.137.
- Santos JM, Heinio C, Cervera-Carrascon V, Quixabeira DCA, Siurala M, Havunen R, Butzow R, Zafar S, de Gruijl T, Lassus H, et al. Oncolytic adenovirus shapes the ovarian tumor microenvironment for potent tumor-infiltrating lymphocyte tumor reactivity. J Immunother Cancer. 2020;8:e000188.
- Santos JM, Havunen R, Siurala M, Cervera-Carrascon V, Tahtinen S, Sorsa S, Anttila M, Karell P, Kanerva A, Hemminki A. Adenoviral production of interleukin-2 at the tumor site removes the need for systemic postconditioning in adoptive cell therapy. Int J Cancer. 2017;141:1458–1468. doi:10.1002/ijc.30839.
- Kim TJ, Cho KS, Koo KC, Status C. Future perspectives of immunotherapy for locally advanced or metastatic urothelial carcinoma: a comprehensive review. Cancers (Basel). 2020;12. doi:10.3390/cancers12010192.
- Rini BI, Powles T, Atkins MB, Escudier B, McDermott DF, Suarez C, Bracarda S, Stadler WM, Donskov F, Lee JL, et al. Atezolizumab plus bevacizumab versus sunitinib in patients with previously untreated metastatic renal cell carcinoma (IMmotion151): a multicentre, open-label, phase 3, randomised controlled trial. Lancet. 2019;393:2404–2415. doi:10.1016/S0140-6736(19)30723-8.
- Bronger H, Singer J, Windmuller C, Reuning U, Zech D, Delbridge C, Dorn J, Kiechle M, Schmalfeldt B, Schmitt M, et al. CXCL9 and CXCL10 predict survival and are regulated by cyclooxygenase inhibition in advanced serous ovarian cancer. Br J Cancer. 2016;115:553–563. doi:10.1038/bjc.2016.172.
- Hugo W, Zaretsky JM, Sun L, Song C, Moreno BH, Hu-Lieskovan S, Berent-Maoz B, Pang J, Chmielowski B, Cherry G, et al. Genomic and transcriptomic features of response to anti-PD-1 therapy in metastatic melanoma. Cell. 2016;165:35–44. doi:10.1016/j.cell.2016.02.065.
- Rizvi NA, Hellmann MD, Snyder A, Kvistborg P, Makarov V, Havel JJ, Lee W, Yuan J, Wong P, Ho TS, et al. Cancer immunology. Mutational landscape determines sensitivity to PD-1 blockade in non-small cell lung cancer. Science. 2015;348:124–128. doi:10.1126/science.aaa1348.
- Nesslinger NJ, Ng A, Tsang K-Y, Ferrara T, Schlom J, Gulley JL, Nelson BH. A viral vaccine encoding prostate-specific antigen induces antigen spreading to a common set of self-proteins in prostate cancer patients. Clin Cancer Res. 2010;16:4046–4056. doi:10.1158/1078-0432.CCR-10-0948.
- Russell SJ, Peng K-W. Oncolytic virotherapy: a contest between apples and oranges. Mole Ther. 2017;25:1107–1116. doi:10.1016/j.ymthe.2017.03.026.
- Silva MA, Ryall KA, Wilm C, Caldara J, Grote HJ, Patterson-Kane JC. PD-L1 immunostaining scoring for non-small cell lung cancer based on immunosurveillance parameters. PLoS One. 2018;13:e0196464. doi:10.1371/journal.pone.0196464.
- Taube JM, Klein A, Brahmer JR, Xu H, Pan X, Kim JH, Chen L, Pardoll DM, Topalian SL, Anders RA. Association of PD-1, PD-1 ligands, and other features of the tumor immune microenvironment with response to anti-PD-1 therapy. Clin Cancer Res. 2014;20:5064–5074. doi:10.1158/1078-0432.CCR-13-3271.
- Kowanetz M, Zou W, Gettinger SN, Koeppen H, Kockx M, Schmid P, Kadel EE 3rd, Wistuba I, Chaft J, Rizvi NA, et al. Differential regulation of PD-L1 expression by immune and tumor cells in NSCLC and the response to treatment with atezolizumab (anti-PD-L1). Proc Natl Acad Sci U S A. 2018. doi:10.1073/pnas.1802166115.
- Zamarin D, Ricca JM, Sadekova S, Oseledchyk A, Yu Y, Blumenschein WM, Wong J, Gigoux M, Merghoub T, Wolchok JD. PD-L1 in tumor microenvironment mediates resistance to oncolytic immunotherapy. J Clin Invest. 2018;128:1413–1428. doi:10.1172/JCI98047.
- Dahan R, Sega E, Engelhardt J, Selby M, Korman AJ, Ravetch JV. FcgammaRs modulate the anti-tumor activity of antibodies targeting the PD-1/PD-L1 AXIS. Cancer Cell. 2015;28:285–295. doi:10.1016/j.ccell.2015.08.004.
- Chen CY, Hutzen B, Wedekind MF, Cripe TP. Oncolytic virus and PD-1/PD-L1 blockade combination therapy. Oncolytic Virother. 2018;7:65–77. doi:10.2147/OV.S145532.
- G. Pol J,Lévesque S, Workenhe ST, Gujar S, Le Boeuf F, R. Clements D, Fahrner J-E, Fend L, C Bell J, L. Mossman K, Fucikova J, Spisek R, et al. Trial watch: oncolytic viro-immunotherapy of hematologic and solid tumors. Oncoimmunology. 2018;;7:e1503032.
- Ribas A, Dummer R, Puzanov I, VanderWalde A, Andtbacka RHI, Michielin O, Olszanski AJ, Malvehy J, Cebon J, Fernandez E, et al. Oncolytic virotherapy promotes intratumoral T cell infiltration and improves anti-PD-1 immunotherapy. Cell. 2017;170(1109–1119):e10. doi:10.1016/j.cell.2017.08.027.
- Quetglas JI, Labiano S, Aznar MA, Bolanos E, Azpilikueta A, Rodriguez I, Casales E, Sanchez-Paulete AR, Segura V, Smerdou C, et al. Virotherapy with a Semliki forest virus-based vector encoding IL12 synergizes with PD-1/PD-L1 blockade. Cancer Immunol Res. 2015;3:449–454. doi:10.1158/2326-6066.CIR-14-0216.
- Blair GE, Dixon SC, Griffiths SA, Zajdel ME. Restricted replication of human adenovirus type 5 in mouse cell lines. Virus Res. 1989;14:339–346. doi:10.1016/0168-1702(89)90026-9.
- Siurala M, Vaha-Koskela M, Havunen R, Tahtinen S, Bramante S, Parviainen S, Mathis JM, Kanerva A, Hemminki A. Syngeneic syrian hamster tumors feature tumor-infiltrating lymphocytes allowing adoptive cell therapy enhanced by oncolytic adenovirus in a replication permissive setting. Oncoimmunology. 2016;5:e1136046. doi:10.1080/2162402X.2015.1136046.