
ABSTRACT
Prostate cancer (PCa) is one of the most common malignancies in male. We aim to establish a novel gene signature for immune infiltration and outcome (biochemical recurrence (BCR) and overall survival (OS)) of patients with prostate cancer (PCa) to augment Gleason patterns for evaluating prognosis and managing patients undergoing radical prostatectomy (RP). Combined with our microarray data and the Cancer Genome Atlas Project (TCGA) database (discovery set), we identified a six-gene signature. The Gene Expression Omnibus (GEO) database served as the test set. The databases of Fudan University Shanghai Cancer Center (FUSCC) and Third Affiliated Hospital of Nantong University (TAHNU) served as an external validation set. Immunohistochemistry was used to investigate the relationship between risk groups and the immune infiltrate. We identified a six-gene signature to predict immune cell infiltration and outcome of PCa patients. The AUC values used to predict early BCR in the discovery, test, FUSCC, and TAHNU sets were 0.73, 0.76, 0.72, and 0.81, respectively. Low-risk score patients in each dataset experienced significantly longer OS (P = .01, 0.04, 0.02, respectively). The signature also predicted high regulatory T cells (Tregs) and M2-polarized macrophages infiltration in high-risk score patients with PCa. Additionally, high mutation load, related signal pathways, and sensitivity to anticancer drugs that correlated with high-risk score of cancer progression and death were also identified. The six-gene signature may improve prognostic information, serve as a prognostic tool to manage patients after RP, and advance basic studies of PCa.
Introduction
Prostate cancer (PCa) is one of the most prevalent malignancies in aging male.Citation1 Most patients with localized cancer receive standard therapy such as radical prostatectomy (RP) or radiotherapy.Citation2 However, approximately 20–30% of patients will develop biochemical recurrence (BCR).Citation3 Patients with BCR develop clinical recurrence and metastasis, leading to death. Patients with BCR ≤2 y after prostatectomy (early BCR) are more likely to suffer metastases and cancer-specific mortality.Citation4 Thus, marker signatures that can classify patients as potential responders to adjuvant therapies have great clinical value. Time-to-BCR, Gleason score, and prostate-specific antigen doubling time are important prognostic factors.Citation5 Among them, the Gleason score is the most powerful prognostic factor, although its value is limited by interobserver variability, sampling error, and subjective assessment. Recently, immune infiltration is another hot point. Many studies found that different immune cell infiltrations are associated with clinical outcome in various cancers, including breast cancer, bladder cancer, and PCa.Citation6–Citation8
To better identify patients at higher risk from those at lower risk, previous studies focused on gene expression data to develop predictive signatures. Several of these biomarkers help confirm the Gleason score and some help predict early BCR after RP.Citation9–Citation11 However, most have similar limitations. For example, certain signatures include too many genes (e.g. 157- and 30-gene signatures), which are too expensive and technically difficult to use in the clinic. Further, few independent sets (≤3 independent cohorts) were identified by previous studies. Additionally, few previous signatures investigate the association with immune landscape.Citation12
Therefore, the present study was designed to develop a new and robust gene signature based on our own microarray database and The Cancer Genome Atlas Project (TCGA) database. A prognostic six-gene signature identified using a discovery set was validated using four independent cohorts. This new classification accurately predicted Tregs/M2-polarized macrophages infiltration and outcome in the western and eastern cohorts and helped identify a subset of patients with Gleason score 7 at high risk of early BCR associated with a fatal outcome. Further, analysis of mutation load, sensitivity to anticancer drugs, and associated signal transduction pathways may provide new insights into the molecular mechanism of PCa.
Results
Preparation of datasets
We enrolled 882 patients in our study, including 455 patients from the discovery set (TCGA), 175 patients from the test set (GEO, 36 and 139 patients from GSE46602 and GSE21032, respectively), and 252 patients from the validation set (141 and 111 patients from FUSCC and TAHNU datasets, respectively). The median follow-up was 27.5, 74.5, 49.0, and 47.0 months in TCGA, GEO, FUSCC, and TAHNU sets, respectively. There were 84, 22, 84, and 37 patients that had a BCR in TCGA, GEO, FUSCC, and TAHNU sets, respectively. The baseline clinical information for these patients is shown in Table S1.
Development of a gene panel from the discovery set
We identified 167 genes that were differentially expressed according to our microarray analyses of PCa tissues from patients with Gleason scores ≤6 and ≥8 (,b) and analysis of the TCGA database (). We used a LASSO Cox regression model to build a prognostic gene panel, comprising ZNF467, SH3 RF2, PPFIA2, MYT1, TROAP, and GOLGA7B (). Among the six genes, SH3R
Figure 1. Construction of gene signature.
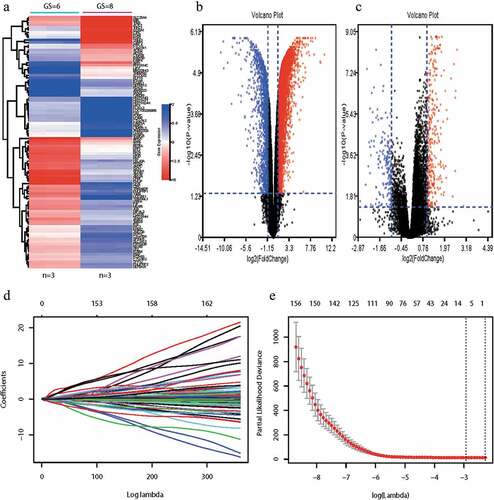
F2 was downregulated in PCa with Gleason scores ≥8 compared with that of Gleason scores ≤6. Conversely, ZNF467, PPFIA2, MYT1, TROAP, and GOLGA7B were upregulated in PCa with Gleason scores ≥8. A vertical line is drawn at the value chosen by 10-fold cross-validation, which yielded six optimal coefficients (). We then derived an equation to calculate a risk score for BCR according to the levels of these six mRNAs. Patients in the discovery set were divided into low (n = 300) or high (n = 155) risk groups, using the mean risk score as the cutoff value.
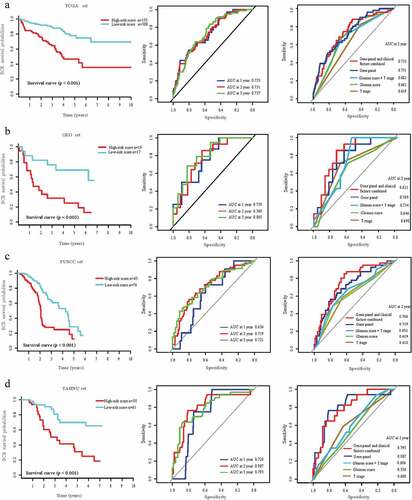
The percentages of patients without BCR at low risk after 1, 2, and 5 y were 95.67%, 93.67%, and 90.33%, respectively, compared with 85.81%, 79.35%, and 67.10% of those with high-risk score. BCR-free survival analysis was performed using the Kaplan–Meier method. Patients with lower risk scores generally experienced longer times to BCR survival compared with those with higher risk scores (hazard ratio [HR]: 0.28, 95%CI: 0.18–0.44; P < .01) (, left panel). We assessed the prognostic accuracy of our gene panel using the time-dependent ROC curves for BCR after 1, 2, and 5 y (, middle panel). The AUC values at these times were 0.74, 0.73, and 0.74, respectively. Our panel achieved higher accuracy compared with that of the Gleason score or T stage (0.73 vs. 0.66 and 0.62, , right panel). The AUC value increased from 0.73 to 0.74 when we combined these variables.
Figure 2. Prognostic value of gene signature in discovery set, test set, and validation set.
Validation of the prognostic value using the test and external validation sets
To determine if our gene panel had similar prognostic value for different populations, we applied it to the independent test and external validation sets. The BCR survival rates of patients in the test set with low-risk scores after 1, 2, and 5 y were 88.23%, 82.35%, and 70.59%, respectively; and 68.42%, 42.11%, and 21.05%, respectively, for those in the high-risk score group. The AUC values for predicting BCR after 1, 2, and 5 y were 0.76, 0.77, and 0.81, respectively. For early BCR, we confirmed the higher accuracy of our panel compared with that of the Gleason score or T stage using the test set (). Patients with low-risk scores had longer BCR-free survival compared with patients with high-risk scores (HR: 0.26, 95%CI: 0.10–0.68; P < .01, ). Our gene panel achieved significant discriminatory power. Thus, patients in the test set GSE21032 with low-risk scores experienced longer OS compared with those with high-risk scores (HR: 0.60, 95%CI: 0.40–0.91; P = .01, Figure S2A).
In the FUSCC set, the AUC values for predicting BCR after 1, 2, and 5 y were 0.64, 0.72, and 0.72, respectively. Low-risk score patients experienced longer BCR-free survival and OS compared with those of high-risk score patients (HR: 0.39, 95%CI: 0.25–0.61, P < .01; HR: 0.45, 95%CI: 0.21–0.96, P = .04, and Figure S2B). Similar results were obtained for the TAHNU set, for which the AUC values for predicting BCR after 1, 2, and 5 y were 0.73, 0.81, and 0.79, respectively. Patients with low-risk scores achieved longer BCR-free survival and OS (HR: 0.27, 95%CI: 0.13–0.56, P < .01; HR: 0.32, 95%CI: 0.13–0.80, P = .02, and Figure S2 C).
Prognostic value of the gene panel for patients with Gleason scores 7
To confirm the prognostic value of our gene panel for patients with Gleason score 7, we performed the same analyses (test set was not included because of few patients with detailed Gleason scores). The results suggest that our gene panel significantly discriminated between post-BCR survival in the discovery, FUSCC, and TAHNU sets (low-risk score patients vs high-risk score patients, HR: 0.20, 95%CI: 0.09–0.45, P < .01; HR: 0.38, 95%CI: 0.18–0.78, P = .01; and HR: 0.18, 95%CI: 0.06–0.54, P < .01, respectively, , left panel, Table S3). In addition, we confirmed the higher accuracy of our panel combined with T stage than gene panel or T stage alone for early BCR (Figure S3).
Figure 3. Prognostic value of gene signature in patients with Gleason score 7 in discovery set, FUSCC set, and TAHNU set.
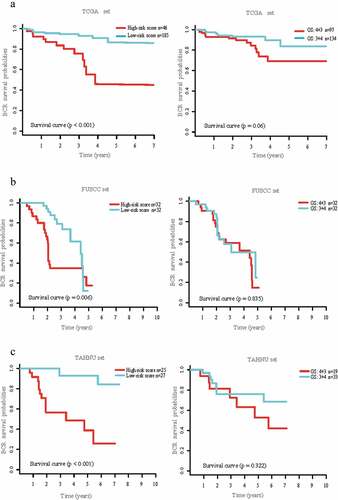
However, the differences between groups with Gleason scores 3 + 4 and those with Gleason scores 4 + 3 were not significant (discovery set, HR: 0.46, 95%CI: 0.20–1.05; P = .07; FUSCC set, HR: 0.92, 95%CI: 0.46–1.87; P = .83 and TAHNU set, HR: 0.90, 95%CI: 0.36–2.26; P = .82, , right panel). Similar results could be found in OS analysis in patients with Gleason scores 7 (Table S3).
Immunological landscape in patients with different risks
To investigate the relationship between the two risk groups and the immune infiltrate, we next analyzed the 22 immune cell phenotypes in the discovery set using CIBERSORT. CD4 or CD8 T cells, macrophages, and mast cells are the most common immune cell populations in patients with prostate cancer (). Further, infiltrations of Tregs as well as M1-polarized and M2-polarized macrophages in high-risk score patients were much more than those of low-risk score patients based on results of CIBERSORT (all P < .01, ). Tregs are required to establish and maintain immune homeostasis. M1-polarized and M2-polarized macrophages also play a critical role in tumor microenvironment. Previous studies also found that M2-polarized macrophages and Tregs promote an immunosuppressive environment in PCa. We also investigated the relationship between Gleason score (≤6, 7, ≥8) and infiltration of immune cells. There were some similar trends, such as infiltration of M2-polarized macrophages. The patients with higher Gleason score had more infiltration of M2-polarized macrophages. However, there were also some differences. For example, patients with Gleason score ≤7 had more infiltration of mast cells resting (Figure S5).
Figure 4. Immunological landscape associated with the risk of BCR.
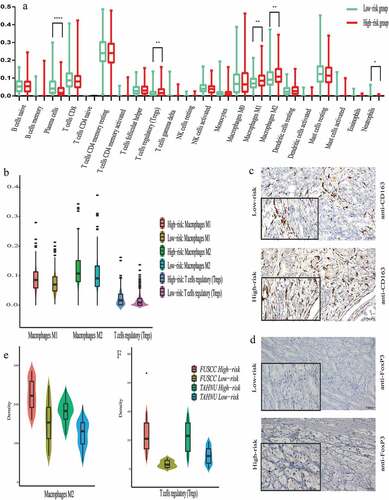
To validate the above observations in the FUSCC and TAHNU sets, the infiltration of Tregs as well as M1- and M2-polarized macrophages in the tumor stroma were detected within tissues (,d). However, only the numbers of Tregs and M2-polarized macrophages were higher in the tumor tissues of high-risk score patients compared with those of low-risk score patients (,f), which indicated our risk group may be associated with infiltration of M2 macrophages and Tregs.
Identification of a gene panel associated with signal transduction pathways and mutation load
We performed GSEA of the discovery set to identify a gene panel associated signal transduction pathways. Significant gene sets were visualized as an Enrichment Map. The gene panel was associated with the categories as follows: drug metabolism cytochrome P450, MTOR signaling pathway, mismatch repair, P53 signaling pathway, and nucleotide excision repair (,b).
Figure 5. Identification of this gene signature associated with signal transduction pathways and mutation load.
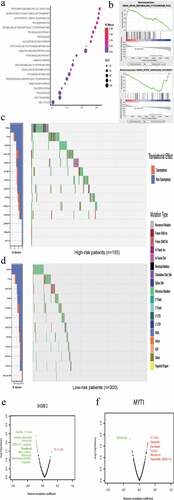
To further explore the potential mechanism of BCR in high-risk patients, we assessed the mutation load between patients with different risks of BCR as well as the associations between the six genes and sensitivity of prostate cancer cells to anticancer drugs. Investigation of the mutation load was performed by initially determining all mutations for each sample based on the discovery set. We generated a waterfall plot that illustrates the mutational burden and further differentiates between risk types. As ,d showed, 14.84% and 10.97% of patients in the high-risk score group had TP53 and TTN mutations, respectively, compared with 4.33% and 6.33% in low-risk score patients. We then calculated the tumor mutation burden (TMB) for each patient. The mean TMB in discover set was 1.36 mutations per MB. Additionally, the mean TMB in high-risk score patients was 2.63 mutations per MB, which was higher than those (0.66 mutations per MB) in low-risk score patients. However, this trend did not reach statistical significance (P = .08). This analysis revealed that high-risk score patients may have a higher mutation load compared with that of low-risk patients.
We next used the GDSC database to identify an association between sensitivity to anticancer drugs and the levels of the six genes in our panel. The results indicate that the six genes were associated with the sensitivities of prostate cancer cells to multiple anticancer drugs (,f, Figure S6). The most prominent genes were SH3RF2 and MYT1, which are associated with sensitivity to docetaxel. Moreover, the expression of SH3RF2 and MYT1 negatively or positively correlated with docetaxel resistance, respectively, consistent with their coefficients in our gene panel.
Discussion
In view of the heterogeneous nature of PCa, satisfactory risk assessment and management of patients after RP are difficult to accomplish.Citation13,Citation14 Thus, an important clinical challenge that PCa researchers face is the development of effective biomarkers that help determine whether prompt adjuvant therapy is warranted after patients undergo surgery or radiotherapy.Citation4,Citation15,Citation16
To address this daunting task, here we identified a novel six-gene signature that accurately predicted early BCR and OS. Given the validation using multicenter cohorts, we believe that this novel signature may serve as a valuable clinical tool. The signature can augment the use of Gleason patterns to improve prognosis and to develop appropriate management plans for patients after they undergo RP. Further, the candidate genes included in our signature were differentially expressed between patients with Gleason scores ≤6 and ≥8 in our microarray and TCGA databases. Combined with LASSO analysis, the novel gene panel helped stratify patients with Gleason score 7 into different risk groups. In the discovery and validation sets, the gene signature achieved greater discrimination of time-to-BCR survival and OS. Nevertheless, there was no significant difference among these variables of patients with Gleason score 4 + 3 or 3 + 4 in the discovery and validation sets. Although previous studies suggest that tumors with Gleason score 4 + 3 are more aggressive compared with those with Gleason score 3 + 4, our results confirm the limitations of Gleason patterns.Citation5,Citation17-Citation19 As noted above, the value of Gleason patterns as diagnostic markers is limited. Thus, novel gene signatures that augment accurate risk stratification and management of patients after they undergo RP, particularly for patients with Gleason score 7, will have significant clinical value.
Previous studies show that certain gene signatures distinguish PCa with Gleason scores ≤6 from those with Gleason scores ≥8 or provide prognostic information about BCR. Most signatures include too many genes and lack multicenter validation. Sinnott JA developed a 157- and 30-gene signature in 2011 and in 2017, respectively, to improve the prediction of prognosis of patients with Gleason score 7.Citation9,Citation10 In contrast, our novel signature only included a panel of six genes. In 2018, Abou-Ouf H developed a 10-gene signature to predict BCR, although its AUC was 0.65.Citation20 The AUCs values of our signature for early BCR in the discovery and test sets were 0.73 and 0.77, respectively. Moreover, this signature allowed us to classify patients into groups with high- or low-risk of early BCR and shorter OS. Tumor-risk stratification tools have significant clinical value for application to personalized medicine. Active surveillance is appropriate for low-risk patients, while high-risk patients may require adjuvant therapies, closer clinical management, or both. Thus, the use of our signature may help avoid unnecessary overtreatment of indolent disease and to select an optimal management strategy.
Further, Ye J found that TROAP regulates prostate cancer progression via the WNT3/survivin signaling pathway.Citation21 Leyten GH indicated that PPFIA2 is a promising biomarker in urine for the detection of prostate cancer.Citation22 Visconti R suggested that inhibition of MYT1 expression may improve the efficacy of antimicrotubule drugs and reduce the acquisition of drug resistance by tumor cells.Citation23 These studies, therefore, provide a functional rationale to explain the significant associations of the expression of TROAP, PPFIA2, and MYT1 with the risk of BCR after patients with PCa undergo RP.
Additionally, our signature identified an association of increased numbers of Tregs and M2-polarized macrophages in high-risk score patients. Additionally, the difference of immune cell infiltration between low- and high-risk score groups might be attributed to the difference of Gleason score. However, it lacks enough detail to be sure of the conclusion. Previous studies focused on macrophages and Tregs in the immunological landscape of PCa. Tregs may contribute to cancer development and macrophages may be associated with cancer metastasis, immune suppression. Flammiger A found that Tregs are associated with patients with advanced PCa, indicating that these cells contribute to an adverse clinical course.Citation24 Erlandsson A suggested that patients with high numbers of M2 macrophages in the tumor environment have an increased chance of dying from PCa.Citation25 A possible explanation is that M2 macrophages, together with other suppressor cells such as Tregs, contribute to an immunosuppressive environment. Together, our results indicate that Tregs and M2-polarized macrophages may represent novel targets of therapy for PCa. Moreover, Kalsbeek AM also found that mutation load is associated with pathological features and BCR, further supporting the conclusion that novel gene signatures can serve as reliable and effective clinical tools.Citation26
In the present study, GSEA identified signal transduction pathways associated with our novel gene signature such as drug and xenobiotic metabolism by cytochrome P450, the MTOR signaling pathway, and sensitivity to anticancer drugs. SH3RF2, ZNF467, and GOLGA7B are not functionally annotated as associated with PCa. In addition, the three genes and PPFIA2 are not associated with sensitivity to docetaxel. But, some are associated with other targeted therapies, such as dasatinib or bosutinib, which should lead to future research to study their roles in the mechanism of the progression of PCa. Nevertheless, the current study also had some limitations. First, the protein expression may not be consistent with RNA expression. It was an unavoidable research problem to validate signature in different sets. Additionally, previous studies found that PSA at diagnosis, PSA doubling time or PSA velocity also had values on the prediction models for PCa. It would be better to integrate these PSA parameters into our signature. However, test set had no PSA information and external validation sets had no information about PSA doubling time or PSA velocity. Therefore, our signature could not integrate these PSA parameters.
In summary, we show here that a novel six-gene signature accurately predicted Tregs/M2-polarized macrophages infiltration and outcome (BCR and OS) of patients with PCa. Moreover, the signature helped stratify patients with Gleason score 7 into high- or low-risk groups for BCR and shorter OS. Thus, our gene signature promises to improve prognostic prediction and to provide appropriate management plans for patients after RP. The signature also suggests that Tregs and M2-polarized macrophages were associated with risk of progression, and may, therefore, serve as novel potential therapeutic targets. In the future, randomized controlled trials can test the role of this signature for predicting the efficacy and safety of adjuvant therapy. Further, the genes included in our signature should be studied to gain a better understanding of the molecular mechanisms of oncogenesis and progression of PCa.
Methods
Patients’ samples and follow-up
Written informed consent was obtained from all patients, and the study was approved by the Ethics Committee of Fudan University Shanghai Cancer Center (FUSCC; Shanghai, China) and Third Affiliated Hospital of Nantong University (TAHNU; Wuxi, China). Tissue samples were obtained from patients with PCa who underwent RP from July 2008 to February 2016 at FUSCC and TAHNU. All patients were informed of the importance of follow-up and were regularly followed. The study design was shown in Figure S1.
RNA extraction and microarray assay
Tissues from six patients treated at FUSCC were acquired for microarray analysis. Three had a Gleason score = 8 and developed BCR 1 year after RP, three had a Gleason score = 6 and lived >5 y without BCR. Patients’ detailed information is summarized in Table S1. Total RNA was extracted from six patients’ tissues using TRIzol reagent following the manufacturer’s protocol. RNA quantity and quality were measured using a NanoDrop ND-1000 spectrophotometer. The details of the microarray assay are described in the Supplementary Methods.
Dataset selection and preparation
The TCGA database was used as the discovery set, and the Gene Expression Omnibus (GEO) databases (GSE46602 and GSE21032) were used as the test set. The FUSCC and TAHNU databases were used as the external validation set. The details are described in the Supplementary Methods.
Immunohistochemistry (IHC) and evaluation of immunostaining
Surgically resected tissue sections acquired from patients with PCa were stained with hematoxylin–eosin and reviewed by a pathologist (H.T). Tissue specimens enriched in tumor cells were selected for IHC, which was conducted according to a published protocol.Citation27 Three high-power fields (HPFs, ×200) of each specimen were randomly selected, and 100 tumor cells were counted in each field to determine the average percentage of positive cells in three HPFs. The scoring method was as follows (IHC-positive cells): score 0 = 0% positive; score 1 = 1–33% positive; score 2 = 34–66% positive, and score 3 ≥ 67% positive.Citation28 The CIBERSORT method was performed to analyze associations between our gene signature and 22 leukocyte phenotypes in TCGA cohort. The densities of regulatory T cells (Tregs) as well as M1- and M2-polarized macrophages in validation sets were evaluated as previously described.Citation29 The total number of cells was defined as the number of nucleated stained cells per field and was converted to cells/mm2. Antibodies used for these analyses are summarized in Table S2.
Development of a gene panel and statistical analysis
Genes expressed at significantly different levels between tissues with Gleason scores ≤6 vs those with Gleason scores ≥8 were identified in our Microarray and TCGA database using the linear models for microarray data method. Fold-changes (FCs) were calculated, and only mRNAs with log2|FC| >1.0 and adjusted P < .05 were defined as differentially expressed mRNAs. Only the overlapping differentially expressed mRNAs with the same relative changes in the FUSCC and TCGA databases were subjected to further analyses. The least absolute shrinkage and selection operator (LASSO) Cox regression model was used to select the mRNAs that served as significant prognostic factors of BCR. Such mRNAs were used to construct a novel gene panel as the discovery set. The prognostic or predictive accuracy of the gene panel was evaluated using time-dependent receiver operating characteristic (ROC) analysis. The area under the curve (AUC) at different cutoff times was used to measure prognostic or predictive accuracy. To assess associations between signatures and BCR, Kaplan–Meier curves and log-rank tests were used. TCGA mutation data for PCa samples were acquired from the TCGA data portal. The Genomics of Drug Sensitivity in Cancer (GDSC) database, a public resource for research on drug sensitivity in cancer cells, was used to investigate sensitivity to anticancer drugs associated with the selected genes. Gene Set Enrichment Analysis (GSEA) and mutation load analysis were performed to identify the mechanism of BCR. Statistical analysis was performed using R software version 3.5.1.
Ethics approval and consent to participate
Our study was approved by the Ethics Committee of FUSCC and TAHNU.
Author Contributors
Yao Zhu and Dingwei Ye had full access to all of the data in the study and take responsibility for the integrity of the data and the accuracy of the data analysis.
Concept and design: Yao Zhu and Dingwei Ye.
Acquisition, analysis, or interpretation of data: Ning Shao, Yuanyuan Mi, Fangning Wan.
Drafting of the manuscript: Ning Shao, Yuanyuan Mi, Yao Zhu.
Immunohistochemistry and Evaluation of Immunostaining: Hong Tang.
Critical revision of the manuscript for important intellectual content: Dingwei Ye.
Supplemental Material
Download ()Disclosure statement
The authors declare no conflict of interest.
Supplementary Material
Supplemental data for this article can be accessed here.
Additional information
Funding
References
- Siegel RL, Miller KD, Jemal A. Cancer Statistics. 2017. CA. 2017;67(1):7–10. doi:10.3322/caac.21387.
- Lalonde E, Ishkanian AS, Sykes J, Fraser M, Ross-Adams H, Erho N, Dunning MJ, Halim S, Lamb AD, Moon NC, et al. Tumour genomic and microenvironmental heterogeneity for integrated prediction of 5-year biochemical recurrence of prostate cancer: a retrospective cohort study. Lancet Oncol. 2014;15(13):1521–1532. doi:10.1016/S1470-2045(14)71021-6.
- Shao N, Wang Y, Jiang WY, Qiao D, Zhang SG, Wu Y, Zhang XX, Wang JL, Ding Y, Feng NH, et al. Immunotherapy and endothelin receptor antagonists for treatment of castration-resistant prostate cancer. Int J Cancer. 2013;133(7):1743–1750. doi:10.1002/ijc.28162.
- Roobol MJ, Carlsson SV. Risk stratification in prostate cancer screening. Nat Rev Urol. 2013;10(1):38–48. doi:10.1038/nrurol.2012.225.
- Yin Y, Zhang Q, Zhang H, He Y, Huang J. Molecular signature to risk-stratify prostate cancer of intermediate risk. Clin Cancer Res. 2017;23(1):6–8. doi:10.1158/1078-0432.CCR-16-2400.
- Ali HR, Chlon L, Pharoah PD, Markowetz F, Caldas C. Patterns of immune infiltration in breast cancer and their clinical implications: a gene-expression-based retrospective study. PLoS Med. 2016;13(12):e1002194. doi:10.1371/journal.pmed.1002194.
- Efstathiou JA, Mouw KW, Gibb EA, Liu Y, Wu CL, Drumm MR, da Costa JB, Du Plessis M, Wang NQ, Davicioni E, et al. Impact of immune and stromal infiltration on outcomes following bladder-sparing trimodality therapy for muscle-invasive bladder cancer. Eur Urol. 2019;76(1). doi:10.1016/j.eururo.2019.01.011
- Rodrigues DN, Rescigno P, Liu D, Yuan W, Carreira S, Lambros MB, Seed G, Mateo J, Riisnaes R, Mullane S, et al. Immunogenomic analyses associate immunological alterations with mismatch repair defects in prostate cancer. J Clin Invest. 2018;128(11):5185. doi:10.1172/JCI125184.
- Penney KL, Sinnott JA, Fall K, Pawitan Y, Hoshida Y, Kraft P, Stark JR, Fiorentino M, Perner S, Finn S, et al. mRNA expression signature of Gleason grade predicts lethal prostate cancer. J Clin oncol. 2011;29(17):2391–2396. doi:10.1200/JCO.2010.32.6421.
- Sinnott JA, Peisch SF, Tyekucheva S, Gerke T, Lis R, Rider JR, Fiorentino M, Stampfer MJ, Mucci LA, Loda M, et al. Prognostic utility of a new mrna expression signature of gleason score. Clin Cancer Res. 2017;23(1):81–87. doi:10.1158/1078-0432.CCR-16-1245.
- Ong CW, Maxwell P, Alvi MA, McQuaid S, Waugh D, Mills I, Salto-Tellez M. A gene signature associated with PTEN activation defines good prognosis intermediate risk prostate cancer cases. The Journal of Pathology: Clinical Research. 2018;4(2):103–113. doi:10.1002/cjp2.94.
- Kalina JL, Neilson DS, Lin YY, Hamilton PT, Comber AP, Loy EMH, Sahinalp SC, Collins CC, Hach F, Lum JJ, et al. mutational analysis of gene fusions predicts novel MHC class I-restricted T-cell epitopes and immune signatures in a subset of prostate cancer. Clin Cancer Res. 2017;23(24):7596–7607. doi:10.1158/1078-0432.CCR-17-0618.
- Scher HI, Fizazi K, Saad F, Taplin ME, Sternberg CN, Miller K, de Wit R, Mulders P, Chi KN, Shore ND, et al. Increased survival with enzalutamide in prostate cancer after chemotherapy. N Engl J Med. 2012;367(13):1187–1197. doi:10.1056/NEJMoa1207506.
- Hansen J, Bianchi M, Sun M, Rink M, Castiglione F, Abdollah F, Steuber T, Ahyai SA, Steurer S, Göbel C, et al. Percentage of high-grade tumour volume does not meaningfully improve prediction of early biochemical recurrence after radical prostatectomy compared with Gleason score. BJU Int. 2014;113(3):399–407. doi:10.1111/bju.12424.
- Intasqui P, Bertolla RP, Sadi MV. Prostate cancer proteomics: clinically useful protein biomarkers and future perspectives. Expert Rev Proteomics. 2018;15(1):65–79. doi:10.1080/14789450.2018.1417846.
- Kruck S, Bedke J, Kuczyk MA, Merseburger AS. Second-line systemic therapy for the treatment of metastatic renal cell cancer. Expert Rev Anticancer Ther. 2012;12(6):777–785. doi:10.1586/era.12.43.
- van den Bergh RC, Ahmed HU, Bangma CH, Cooperberg MR, Villers A, Parker CC. Novel tools to improve patient selection and monitoring on active surveillance for low-risk prostate cancer: a systematic review. Eur Urol. 2014;65(6):1023–1031. doi:10.1016/j.eururo.2014.01.027.
- Morlacco A, Cheville JC, Rangel LJ, Gearman DJ, Karnes RJ. Adverse disease features in gleason score 3 + 4 “favorable intermediate-risk” prostate cancer: implications for active surveillance. Eur Urol. 2017;72(3):442–447. doi:10.1016/j.eururo.2016.08.043.
- Yang DD, Mahal BA, Muralidhar V, Vastola ME, Boldbaatar N, Labe SA, Nezolosky MD, Orio PF, King MT, Martin NE, et al. Pathologic outcomes of gleason 6 favorable intermediate-risk prostate cancer treated with radical prostatectomy: implications for active surveillance. Clin Genitourin Cancer. 2018;16(3):226–234. doi:10.1016/j.clgc.2017.10.013.
- Abou-Ouf H, Alshalalfa M, Takhar M, Erho N, Donnelly B, Davicioni E, Karnes RJ, Bismar TA. Validation of a 10-gene molecular signature for predicting biochemical recurrence and clinical metastasis in localized prostate cancer. J Cancer Res Clin Oncol. 2018;144(5):883–891. doi:10.1007/s00432-018-2615-7.
- Ye J, Chu C, Chen M, Shi Z, Gan S, Qu F, Pan X, Yang Q, Tian Y, Wang L, et al. TROAP regulates prostate cancer progression via the WNT3/survivin signalling pathways. Oncol Rep. 2019;41(2):1169–1179. doi:10.3892/or.2018.6854.
- Leyten GH, Hessels D, Smit FP, Jannink SA, de Jong H, Melchers WJ, Cornel EB, de Reijke TM, Vergunst H, Kil P, et al. Identification of a Candidate Gene Panel for the Early Diagnosis of Prostate Cancer. Clin Cancer Res. 2015;21(13):3061–3070. doi:10.1158/1078-0432.CCR-14-3334.
- Visconti R, Grieco D. Fighting tubulin-targeting anticancer drug toxicity and resistance. Endocr Relat Cancer. 2017;24(9):T107–T17. doi:10.1530/ERC-17-0120.
- Flammiger A, Weisbach L, Huland H, Tennstedt P, Simon R, Minner S, Bokemeyer C, Sauter G, Schlomm T, Trepel M, et al. High tissue density of FOXP3+ T cells is associated with clinical outcome in prostate cancer. Eur J Cancer. 2013;49(6):1273–1279. doi:10.1016/j.ejca.2012.11.035.
- Erlandsson A, Carlsson J, Lundholm M, Falt A, Andersson SO, Andren O, Davidsson S. M2 macrophages and regulatory T cells in lethal prostate cancer. Prostate. 2019;79(4):363–369. doi:10.1002/pros.23742.
- Kalsbeek AM, Chan EF, Grogan J, Petersen DC, Jaratlerdsiri W, Gupta R, Lyons RJ, Haynes A-M, Horvath LG, Kench JG, et al. Mutational load of the mitochondrial genome predicts pathological features and biochemical recurrence in prostate cancer. Aging. 2016;8(11):2702–2712. doi:10.18632/aging.101044.
- Xu X, Shao N, Qiao D, Wang Z, Song N, Song N. Expression of vascular endothelial growth factor and basic fibroblast growth factor in extramammary Paget disease. Int J Clin Exp Pathol. 2015;8:3062–3068.
- Andre P, Denis C, Soulas C, Bourbon-Caillet C, Lopez J, Arnoux T, Bléry M, Bonnafous C, Gauthier L, Morel A, et al. Anti-NKG2A mab is a checkpoint inhibitor that promotes anti-tumor immunity by unleashing both T and NK cells. Cell. 2018;175(7):1731–1743. e13. doi:10.1016/j.cell.2018.10.014.
- Fu H, Zhu Y, Wang Y, Liu Z, Zhang J, Xie H, Fu Q, Dai B, Ye D, Xu J, et al. Identification and validation of stromal immunotype predict survival and benefit from adjuvant chemotherapy in patients with muscle-invasive bladder cancer. Clin Cancer Res. 2018;24(13):3069–3078. doi:10.1158/1078-0432.CCR-17-2687.