
ABSTRACT
One way that tumors evade immune destruction is through tumor and stromal cell expression of arginine-degrading enzyme arginase-2 (ARG2). Here we describe the existence of pro-inflammatory effector T-cells that recognize ARG2 and can directly target tumor and tumor-infiltrating cells. Using a library of 34 peptides covering the entire ARG2 sequence, we examined reactivity toward these peptides in peripheral blood mononuclear cells from cancer patients and healthy individuals. Interferon-γ ELISPOT revealed frequent immune responses against several of the peptides, indicating that ARG2–specific self-reactive T-cells are natural components of the human T-cell repertoire. Based on this, the most immunogenic ARG2 protein region was further characterized. By identifying conditions in the microenvironment that induce ARG2 expression in myeloid cells, we showed that ARG2-specific CD4T-cells isolated and expanded from a peripheral pool from a prostate cancer patient could recognize target cells in an ARG2-dependent manner. In the ‘cold’ in vivo tumor model Lewis lung carcinoma, we found that activation of ARG2-specific T-cells by vaccination significantly inhibited tumor growth. Immune-modulatory vaccines targeting ARG2 thus are a candidate strategy for cancer immunotherapy.
KEYWORDS:
Introduction
Although the immune system can detect and destroy transformed cells, most tumors evade this destruction through a wide range of escape mechanisms. The classical mechanisms include impairment of major histocompatibility complex (MHC)-mediated tumor antigen presentation and downregulation of the costimulatory molecules B7.1 Of importance, a growing body of evidence indicates that tumors can promote an immunosuppressive microenvironment by recruiting or generating immunoregulatory cells, such as regulatory T-cells (Tregs), tolerogenic myeloid populations (especially tumor-associated macrophages, TAMs), myeloid-derived suppressor cells (MDSCs), and cancer-associated fibroblasts (CAFs). Among the immunosuppressive mechanisms that tumors employ is production of anti-inflammatory mediators, such as transforming growth factor-β (TGF β) and interleukin (IL)-10, exploitation of inhibitory molecules of the B7 family, such as PD-L1, and expression of amino acid–degrading enzymes such as arginase and indoleamine 2,3-dioxygenase (IDO).
Arginase is a ubiquitous enzyme that catalyzes the degradation of L-arginine to L-ornithine and urea. There are two isoforms of arginase in mammals: arginase-1 (ARG1), a cytosolic enzyme predominantly present in the liver, and arginase-2 (ARG2), which is expressed in the mitochondrial matrix .Citation2 By regulating the availability of L-arginine and L-ornithine, arginase is important in normal and cancer cells. Its expression in the tumor microenvironment dampens cancer-specific immune responses through local and systemic suppression of T-cell proliferation, inhibition of T-cell activation, promotion of T-cell anergy and apoptosis, and macrophage reprogramming that promotes immunosuppressive phenotypes.Citation3–Citation5
In general, most studies of arginase have focused on ARG1, whereas ARG2 has received less attention to its potential role in cancer. Although studies have linked high arginase activity with various cancers and serum arginase activity with disease progression, these studies did not discriminate between ARG1 and ARG2. One group did show in 2005 that ARG2 is highly expressed in human prostate cancer,Citation4 and the enzyme was further described as suppressing tumor-infiltrating lymphocytes. Androgens enhance ARG2 expression, and androgen-depletion therapy that decreases ARG2 activity can boost immune responses by increasing T-cell activation and interferon (IFN)γ secretion in vivo.Citation6 ARG2 also distinguishes malignant follicular thyroid carcinoma from benign follicular thyroid adenoma.Citation7,Citation8 Likewise, in head and neck squamous cell carcinomas, ARG2 expression has been correlated with a poor prognosis .Citation9 Its expression in breast cancer cells has additionally been reported,Citation10 and its levels are significantly higher in breast cancer tissue and peripheral blood compared to healthy donors.Citation11 ARG2 activity is also described as being enhanced in gastric cancer when compared with healthy gastric tissue,Citation12 and the enzyme is released in vitro by gastric cancer cell lines and in the serum of patients with gastric cancer.Citation9,Citation13 In addition to solid tumors, enhanced ARG2 expression has been described in acute myeloid leukemia (AML). Of interest, circulating AML blasts are phenotypically similar to MDSCs but express and release ARG2 (rather than ARG1) in peripheral blood, suppressing T-cell activity.Citation14,Citation15 These results collectively suggest that ARG2 is a promising target for boosting tumor-specific immune responses and addressing the general state of immunosuppression and pancytopenia seen with AML.
Recently, CAFs have emerged as abundant and crucial components of the tumor mesenchyme. CAFs are involved in modulation of immune system factors, with recently revealed roles in immune evasion and poor responses to cancer immunotherapy.Citation16 Of interest, Ino et al. evaluated pancreatic ductal carcinoma tissues from 200 cases and detected ARG2 protein expression in CAFs, especially those located within and around necrotic areas of the tumor.Citation9 The presence of ARG2-expressing CAFs correlated with poor overall and disease-free survival, emphasizing their key role in immune regulation of the tumor microenvironment. ARG2 also is involved in obesity-associated pancreatic cancer.Citation11
Pro-inflammatory T-cells that specifically target immune-suppressive cells are intrinsically present in the periphery and counteract a range of regulatory immune-feedback signals (reviewed inCitation17). These T-cells (coined anti-regulatory T-cells or anti-TregsCitation18 because of their role in targeting regulatory immune mechanisms) recognize human leukocyte antigen (HLA)-restricted epitopes, generated from degraded intracellular self-antigens derived from immune inhibitory proteins, such as ARG1.Citation19–Citation21 We previously described the existence of ARG1-specific T-cells and demonstrated that they recognize and react against dendritic cells (DCs) and B cells expressing ARG1,Citation19 and that these preexisting T-cell responses against ARG1 are part of the T-cell memory repertoire.Citation20 A phase I vaccination trial with ARG1 peptides was recently initiated at our institution (NCT03689192).Citation22 In the current study, we examined if ARG2 likewise is a target for specific effector T-cells and if these cells can react toward cells expressing ARG2.
Results
Spontaneous immune responses toward ARG2
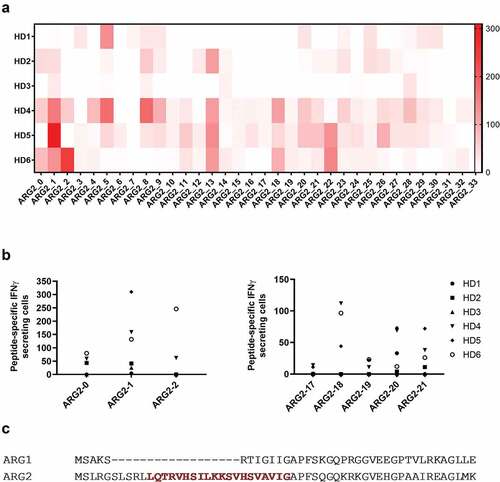
To determine whether antigens derived from ARG2 can be targeted by specific T-cells, we screened for ARG2 peptide epitopes that elicited an immune response in peripheral blood mononuclear cells (PBMCs) from healthy donors. For this purpose, we generated a library of 34 peptides covering the entire ARG2 protein sequence. All peptides were 20-mers, and each one overlapped with the first 10 amino acids of the subsequent sequence (supplementary table 1). We divided the peptides into 11 pools of 3–4 adjacent peptides (supplementary table 1) and used PBMCs from six healthy donors (HDs) to screen for immune responses to the library peptides. Briefly, PBMCs were stimulated once with each peptide pool before being examined in IFNγ ELISPOT assays with stimulation of each peptide individually. We observed immune responses toward several different ARG2 peptides with ARG2-1, ARG2-5, ARG2-8, ARG2-13, ARG2-18, ARG2-20, ARG2-21, and ARG2-22 showing the highest and most abundant responses (). We then validated the immune responses toward these eight peptides in IFNγ ELISPOT assays. PBMCs from the same HDs as above were stimulated with each peptide individually. In the immune responses against the peptides that are either covering the signal peptide region of ARG2 or the peptides located in the region corresponding to the most immunogenic region of the ARG1 sequence. Although we could detect immune responses in this region of ARG2, the most immunogenic peptide was ARG2-1(supplementary figure 1). Of interest, ARG2-1 is a part of the transit sequence (aa1–22) of ARG2. Signal peptide sequences represent an interesting type of epitopes that largely do not depend on proteasomal degradation or TAP (Transporter associated with antigen processing protein) for their processing and presentation in the context of HLA molecules.Citation23–Citation25 Furthermore, this part of ARG2 has very limited overlap with the corresponding sequence of ARG1 ().
Figure 1. Multiple ARG2 peptides are recognized by PBMCs from healthy donors. (a) IFNγ ELISPOT screening of responses against overlapping 20-mer ARG2 peptides from six healthy donors. 4–4.5 × 10⁵ cells were plated per well, and peptide and control stimulation were performed in duplicate or triplicate. Specific spot counts (peptide-specific IFNγ-secreting cells) are given as the difference in number of IFNγ spots between averages of the wells stimulated with peptide and control wells. (b) IFNγ ELISPOT responses from the screening toward the peptides here covering the signal peptide region of ARG2 (left; ARG2-0, ARG2-1, ARG2-2) or the peptides located in the region corresponding to the most immunogenic region of the ARG1 sequence (right; ARG2-17, ARG2-18, ARG2-19, ARG2-20 og ARG2-21). (c) Alignment of ARG1 and ARG2 amino acid sequence around the ARG2-1 sequence. The ARG2-1 sequence is highlighted and marked in red.
We then used ARG2-1 to screen for ARG2 immune responses in samples from 33 HDs and 19 cancer patients with metastatic solid tumor (11 melanoma, 1 breast and 7 prostate cancer patients) by IFNγ ELISPOT assay. Samples from both groups showed strong and frequent responses (), with significant responses in around 75% of the screened donors. Because ARG2 is reported to play an important role in the immunosuppressive microenvironment observed in patients with AML,Citation14,Citation15 we used IFNγ ELISPOT to assess for the presence of ARG2-specific T-cells among PBMCs from nine patients diagnosed with AML. Blood collection and subsequent PBMC isolation were performed independently of treatment status, thus the patients represent very different disease and treatment stages. We observed a significant response in three of the nine patients (), suggesting that ARG2-specific T-cells indeed can be present in patients with AML. In supplementary table 2 the clinical characteristics of the included AML patients are depicted. Intracellular cytokine staining for IFNγ and tumor necrosis factor (TNF)α production in HDs and cancer patients with solid tumors primarily showed CD4+responses to ARG2-1 ().
Figure 2. ARG2-1 is widely recognized by PBMCs from both healthy donors and cancer patients with solid tumors or AML. (a) IFNγ ELISPOT responses against ARG2-1 peptide in PBMCs from healthy donors (n = 33), cancer patients with solid tumors (n = 19), or cancer patients with AML (n = 19). 3–4 × 10⁵ cells were plated per well. Peptide and control stimulations were performed in triplicate. Each spot represents one donor and is the number of peptide-specific IFNγ-secreting cells (the difference between the average of wells stimulated with peptide and control wells). (b) Representative intracellular cytokine staining for IFNγ and TFNα production in samples from healthy donors (HD49 and HD50) and a cancer patient (AA27) with solid tumors stimulated with ARG2-1 or non-stimulated control.
Characterization of long ARG2 peptide epitopes
We have previously shown that a longer (38-mer) ARG1 peptide is superior at stimulating ARG1-specific T-cells compared to 20- and 30mer ARG1 peptides from the same region.Citation20 Here we sought to identify an optimal, immunogenic ARG2-derived peptide that broadly stimulates ARG2-specific T-cells in subjects with different tissue types. For this purpose, we designed a longer ARG2 peptide epitope spanning larger parts of the sequence around ARG2-1, based on HLA prediction algorithms (available at www.syfpeithi.de and cbs.dtu.dk). To test whether these long ARG2 peptides ( and supplementary table 1) could be used to identify ARG2 responses, PBMCs from six HDs were stimulated once with each of the three long peptides. Subsequently, PBMCs were used to screen for immune responses in IFNγ ELISPOT. As shown in , immune responses against all three long peptides were identified; however, the 33-mer A2L2 gave the strongest and most frequent immune responses of the three long peptides in the examined donors. Because ARG2-1 is contained within A2L2, we examined if this longer peptide more effectively stimulated ARG2-specific T-cells, using IFNγ ELISPOT assay of samples from six HDs, stimulated with either ARG2-1 or A2L2 once. In five of six donors, A2L2 immune responses were higher than ARG2-1 responses (), although not reaching significance (p = .06), suggesting that both peptides elicit frequent immune responses.
Figure 3. The long ARG2 peptide A2L2 elicits strong and frequent CD4 + T-cell responses in samples from healthy donors and cancer patients. (a) Aligned peptide sequences of the library peptides ARG2-0, ARG2-1, and ARG2-2 and the long peptides ARG2-Long1 (A2L1), ARG2-Long2 (A2L2), and ARG2-Long3 (A2L3). The signal sequence of ARG2 is shown for comparison. (b) IFNγ ELISPOT responses against the long peptides A2L1, A2L2, and A2L3 in PBMCs from six healthy donors. 4 × 10⁵ cells were plated per well, and peptide and control stimulation were performed in triplicate. Specific spot counts (peptide-specific IFNγ-secreting cells) are given as the difference in number of IFNγ spots between averages of the wells stimulated with peptide and control wells. Responses against peptide were too numerous to count (TNTC) in 3 settings and set to be >750 spots. (c) IFNγ ELISPOT responses to A2L2 and ARG2-1 in PBMCs from 6 healthy donors. 4 × 10⁵ cells were plate per well, and peptide and control stimulation were performed in triplicate. Specific spot counts (peptide-specific IFNγ-secreting cells) are given as the difference in number of IFNγ spots between averages of the wells stimulated with peptide and control wells. * p ≤ 0.05 or ** p ≤ 0.01 according to the distribution free resampling rule. (d) IFNγ ELISPOT responses against A2L2 peptide in PBMCs from healthy donors (n = 30) and cancer patients with solid tumors (n = 18). 3–4 × 10⁵ cells were plated per well. Peptide and control stimulations were performed in triplicate. Each spot represents one donor and is the number of peptide-specific IFNγ-secreting cells (the difference between the average of wells stimulated with peptide and control wells). (e) Representative intracellular cytokine staining for IFNγ and TFNα production in samples from healthy donors (HD48 and HD53) and a cancer patient (AA27) with solid tumors stimulated with A2L2 or non-stimulated control. (f) FNγ ELISPOT responses to ARG2-1 and A2L2 in PBMCs from healthy donors (n = 26) and cancer patients with solid tumors (n = 11) for comparison of the magnitude of responses to the two peptides. 4 × 10⁵ cells were plated per well, and peptide and control stimulation were performed in triplicate. Specific spot counts (peptide-specific IFNγ-secreting cells) are given as the difference in number of IFNγ spots between averages of the wells stimulated with peptide and control wells. ns: p = .7038.
To characterize the immunogenicity of A2L2, we screened PBMCs from 30 HDs and 18 patients with cancer (14 melanoma, 3 prostate, 1 breast) by IFNγ ELISPOT assay. We observed strong and frequent responses in both HDs and patients with cancer (). Intracellular cytokine staining for IFNγ and TNFα production showed only CD4+ responses to A2L2 stimulation (), similar to our observations for ARG2-1. The immune responses toward A2L2 were on average higher compared to ARG2-1 responses in the same donor, although not significantly so (p = .7) ().
Characterization of ARG2-specific T-cells
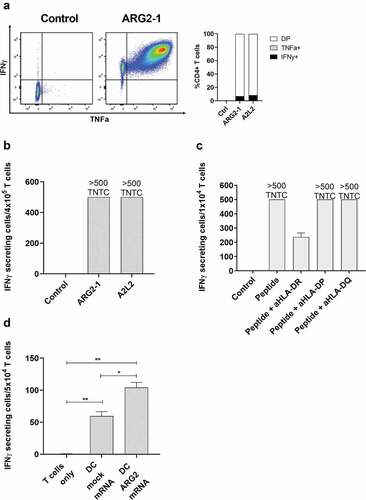
To further characterize the immune response toward ARG2, we generated an ARG2-specific CD4 + T-cell culture. To do so, we used ARG2-1 peptide–loaded autologous DCs to repeatedly stimulate PBMCs isolated from a patient with prostate cancer, followed by enrichment and rapid expansion of specific cells (supplementary figure 2a). The T-cell culture was highly specific toward both ARG2-1 and A2L2, based on intracellular cytokine staining for TNFα and IFNγ (ARG2-1, ) and IFNγ ELISPOT results (). Furthermore, we found that IFNy production from the ARG2-specific T-cell culture stimulated with peptide were inhibited by the addition of HLA-DR blockers, but not HLA-DP or HLA-DQ blockers in IFNy ELISPOT (). To assess the specificity of the ARG2-specific T-cell culture we looked at the ability of the ARG2-specific T-cell culture to recognize and react against cells with intracellular expression of ARG2. To this end, we transfected autologous DCs with mRNA encoding ARG2 fused to the DC-LAMP signal sequence, which targets a protein toward the lysosomal compartment and thus directs the protein toward HLA class II presentation.Citation26 We observed higher reactivity against ARG2 mRNA transfected DCs compared to mock transfected DCs (). FACS analysis of transfected cells showed >90% transfection efficiency (supplementary figure 2b) and mRNA analysis of mock and mRNA transfected DC showed a large increase in ARG2 expression 24hrs after transfection (supplementary figure 2c).
Figure 4. ARG2-specific T-cells recognize ARG2-expressing dendritic cells. (a) ARG2-specific T-cells were expanded from samples from a patient with prostate cancer. The specificity of the T-cell culture was assessed by intracellular cytokine staining for TFNα and IFNγ production in peptide-stimulated cells and a non-stimulated control. Left: Dot plot for ARG2-1 peptide-stimulated and non-stimulated (control) cells. Right: % CD4 T-cells producing IFNγ, TFNα, or both (DP: double positive) in response to control stimulation (no peptide), ARG2-1 peptide stimulation, or A2L2 peptide stimulation. (b) Specificity of the ARG2-specific T-cells assessed by ELISPOT responses to control stimulation (no peptide), ARG2-1 peptide, or A2L2 peptide. 4 × 10⁴ cells were plated per well. TNTC, too numerous to count (more than 500 spots). (c) he HLA-restriction of ARG2-specific T-cells were examined. IFNγ ELISPOT response of the ARG2-specific T-cells toward ARG2-1 peptide in the presence of different class II blockers. (d) IFNγ ELISPOT response by the ARG2-specific T-cells to autologous dendritic cells transfected with irrelevant control mRNA (mock mRNA) or ARG2 mRNA. Effector-to-target ratio 5:1 with 5 × 10⁴ effector cells plated per well. * p ≤ 0.05 or ** p ≤ 0.01 according to the distribution free resampling rule.
Having shown reactivity toward ARG2-producing immune cells we next set out to investigate the ability of the ARG2-specific T-cell culture to recognize and react against different cancer cells using IFNy ELISPOT assays. HLA sequencing analysis of the donor for the specific T-cell culture allowed us to choose three HLA-matched (HLA-DR01:01) AML cell lines with low endogenous ARG2 expression (OCI-AML2, THP-1 and MONO-MAC-1, supplementary figure 3) and pulse with ARG2-1 peptide to subsequently use as target T-cells for IFNy ELISPOT. Set2, another AML cell line with high endogenous ARG2 expression (supplementary figure 3) but HLA-mismatch with the ARG2-specific T-cell culture, was included as a negative control. OCI-AML2, THP-1 and MONO-MAC-1 pulsed with ARG2-1 peptide were effectively recognized by the ARG2-specific T-cells (), whereas Set2 was not. The HLA-DR restriction of the ARG2-specific T-cells was confirmed by the addition of two different HLA-DR specific antibodies, since addition of both HLA-DR blockers abrogated the recognition of ARG2-1 pulsed THP-1 cells ().
Figure 5. ARG2-specific T-cells recognize ARG2-expressing malignant myeloid cells. (a) To identify HLA-matched malignant T-cells, the ARG2-specific T-cells were examined in IFNγ ELISPOT response toward different relevant cancer cell lines pre-pulsed with ARG2-1 peptide. The same cancer cell lines without peptide stimulation were examined as control. Effector-to-target ratio 1:1 with 1 × 10⁴ effector cells plated per well. * p ≤ 0.05 or ** p ≤ 0.01 according to the distribution free resampling rule. TNTC, too numerous to count (>500). (b) FNγ ELISPOT response of the ARG2-specific T-cells toward THP-1 cells pulsed with ARG2-1 peptide and class II blockers. (c) ARG2 expression in THP-1 evaluated by RT-qPCR following 48-h incubation of THP-1 cells with different cytokines. Data are represented as fold change vs unstimulated THP-1 cells; mean+SD, n = 4. (d) FNγ ELISPOT response of the ARG2-specific T-cells toward THP-1 cells stimulated with the cytokine cocktail. Effector-to-target ratio 5:1 with 1.5 × 10⁵ effector cells plated per well. ** p ≤ 0.01 and ns = not significant according to the distribution free resampling rule. (e) Intracellular staining of TFNα and IFNγ production from CD4 + T-cells in the ARG2-specific T-cell culture when incubated with unstimulated THP-1 cells or THP-1 cells pre-stimulated with cytokine cocktail for 48 h. Effector-to-target ratio 2:1 with 500,000 effector cells used per condition. (f) RG1 and ARG2 expression in THP-1 cells evaluated by RT-qPCR following 48-h incubation with cytokine cocktail. Unstimulated THP-1 cells served as control. Data are represented as relative expression to the housekeeping gene ACTB; mean+SD, n = 4. (g) IFNγ ELISPOT response of the ARG2-specific T-cells toward THP-1 cells stimulated with the cytokine cocktail (THP-1 + cyto) and the class II blocker, aHLA-DR. Effector-to-target ratio 5:1 with 1.5 × 10⁵ effector cells plated per well. ** p ≤ 0.01 and ns = not significant according to the distribution free resampling rule. (h) ARG2 expression in THP-1 cells evaluated by RT-qPCR following 48-h stimulation with cytokine cocktail (Th2 cocktail) or IFNγ. Unstimulated THP-1 cells were included as control. Data are represented as relative expression to the housekeeping gene RPO; mean+SD, n = 4. (i) IFNγ ELISPOT response of the ARG2-specific T-cells toward THP-1 cells pre-stimulated with the cytokine cocktail (THP-1 + cytokines) or IFNγ (THP-1 + IFNγ). Effector-to-target ratio 2.5:1 with 5 × 10⁴ effector cells plated per well. ** p ≤ 0.01 and ns = not significant according to the distribution free resampling rule.
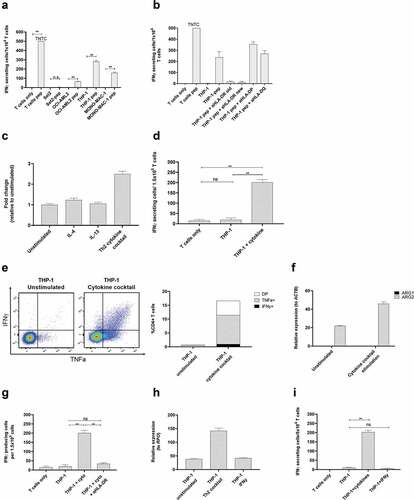
The THP-1 cell line is a monocytic cell line derived from peripheral blood of a patient with AML.Citation27 THP-1 cells are reported to have maintained some plasticity, with their function depending on the presence of specific cytokines in their surroundings. IL-4 and IL-13 are reported to be the main inducers of ARG1,Citation3 but their effect on ARG2 is not well known. Moreover, THP-1 cells are reported to acquire DC-like characteristics upon 48 hrs of stimulation with a cytokine cocktail of IL-4, GM-CSF, and TFNα.Citation28 We therefore examined if stimulation of THP-1 cells with IL-4, IL-13, or the cytokine cocktail would increase ARG2 expression in THP-1 cells. We found a more than 2-fold induction of ARG2 expression upon stimulation with the cytokine cocktail, whereas IL-4 and IL-13 did not have much effect on ARG2 expression levels (). We then turned to investigate if the increase in ARG2 expression after cytokine cocktail stimulation could elicit an immune response from ARG2-specific T-cells. Indeed, we found that the cytokine cocktail led to recognition of the stimulated THP-1 cells in IFNy ELISPOT () and production of TNFα and IFNy detected by intracellular cytokine staining (). Only ARG2 expression increased after treatment of the THP-1 cells with the cytokines, whereas ARG1 expression remained unchanged (). The response toward cytokine stimulated THP-1 cells could be blocked by HLA-DR specific antibodies (). Of note, the cytokine cocktail-stimulated THP-1 cells changed morphology compared to unstimulated cells with more colony-formation, small protrusions, and an acquired adherence (supplementary figure 4a). Importantly, the cytokine cocktail did not upregulate HLA-DR expression (supplementary figure 5a). In contrast, treatment of THP-1 cells with IFNy increased HLA-DR expression on the cell surface (supplementary figure 5a), but not ARG2 expression (), and IFNy stimulated THP-1 cells were not recognized by ARG2-specific T-cells in IFNy ELISPOT assay ().
MONO-MAC-1 is an AML cell line that, like THP-1 cells, can differentiate in response to or be affected by cytokine stimulation.Citation29 Similar to our observations for THP-1 cells, the cytokine cocktail could increase ARG2 expression in MONO-MAC-1 cells (). Stimulation of MONO-MAC-1 cells with the cytokine cocktail did not increase HLA-DR expression compared to unstimulated cells (supplementary Figure 5b). Furthermore, MONO-MAC-1 cells stimulated with IFNγ did not upregulate ARG2 expression (), and only cytokine cocktail-treated MONO-MAC-1 cells were recognized by the ARG2-specific T-cells in the IFNγ ELISPOT (). MONO-MAC-1 stimulated with the cytokine cocktail also changed morphology in ways similar to our observations with THP-1 cells (supplementary figure 4b).
Figure 6. ARG2-specific T-cells recognize several ARG2-expressing malignant myeloid cells. (a) RG2 expression in MONO-MAC-1 (MM1) cells evaluated by RT-qPCR following a 48-h incubation with cytokine cocktail. Data are represented as fold change vs unstimulated MM1 cells; mean+SD, n = 4. (b) ARG2 expression in MM1 cells evaluated by RT-qPCR following a 48-h incubation with cytokine cocktail or IFNγ. Data are represented as fold change vs unstimulated MM1 cells; mean+SD, n = 4. (c) IFNγ ELISPOT response of the ARG2-specific T-cells toward MM1 cells pre-stimulated with the cytokine cocktail (MM1 + cytokine cocktail) or IFNγ (MM1 + IFNγ). Effector-to-target ratio 2.5:1 with 5 × 10⁴ effector cells plated per well. ** p ≤ 0.01 and n = not significant according to the distribution free resampling rule.
To further test the notion of ARG2 expression–dependent T-cell recognition, we transfected THP-1 cells with ARG2 mRNA using the ARG2-DC-LAMP construct. The DC-LAMP sequence is reported to be specific for mature DCs, Citation26 but THP-1 cells can be differentiated into DC-like cells, so the construct can be applicable for transfection of THP-1 cells. We observed that the ARG2-specific T-cell culture reacted toward THP-1 cells transfected with ARG2-DC-LAMP mRNA (). The reactivity was significantly higher toward cells transfected with ARG2-DC-LAMP mRNA compared to those only mock-transfected (), emphasizing the specificity of the ARG2-specific T-cells. Furthermore, with 48 hours of cytokine cocktail stimulation before transfection, the immune response increased compared to cells that were only mRNA-transfected or only cytokine-cocktail-stimulated (). Intracellular cytokine staining for TNFα and IFNγ production showed a similar trend (). We assessed the electroporation efficiency at 24 hours post transfection by FACS analysis of green fluorescent protein (GFP)-expressing cells and showed efficient transfection (>99% GFP+ cells) (supplementary figure 6a). In line with this, we observed a large fold increase in ARG2 and ARG1 expression compared to mock-transfected cells at 24 hours post transfection with ARG2-DC-LAMP mRNA or ARG1-DC-LAMP mRNA, respectively (supplementary figure 6b and 6 c). ARG2 expression levels in mRNA-transfected THP-1 cells were high compared to endogenous ARG2 expression levels in Set2 cells (supplementary figure 6d).
Figure 7. The recognition of ARG2-expressing cells by ARG2-specific T-cells dependent on the level of ARG2 expression in addition to the antigen-processing apparatus of the target T-cells. (a) IFNγ ELISPOT response of the ARG2-specific T-cells toward THP-1 cells unstimulated or pre-stimulated with the cytokine cocktail and mock transfected or transfected with ARG1 or ARG2 mRNA. Effector-to-target ratio 2.5:1 with 5 × 10⁴ effector cells plated per well. ** p ≤ 0.01 and ns = not significant according to the distribution free resampling rule. (b) Intracellular staining of TFNα and IFNγ production from CD4 + T-cells in the ARG2-specific T-cell culture when incubated with unstimulated THP-1 cells or THP-1 cells pre-stimulated with cytokine cocktail followed by either mock (mock) or ARG2 mRNA (mRNA) transfection. Effector-to-target ratio 2:1 with 500,000 effector cells used per condition. DP: Double Positive. (c) ARG2 expression in THP-1 cells evaluated by RT-qPCR at 48 h post transfection with ARG2-specific siRNA. Data are represented as fold change vs mock-transfected THP-1 cells; mean+SD, n = 4. (d) Intracellular staining of TFNα and IFNγ production from CD4 + T-cells in the ARG2-specific T-cell culture when incubated with mock- or siRNA-transfected cells kept under unstimulated or cytokine cocktail stimulated conditions for 48 h prior to setup. Effector-to-target ratio 2:1 with 500,000 effector cells used per condition. (e) ARG2 expression in THP-1 cells evaluated by RT-qPCR at 48 h post transfection with ARG2-specific siRNA followed by cytokine cocktail stimulation. Data are represented as fold change vs unstimulated mock-transfected THP-1 cells; mean+SD, n = 4.
Next, we used small-interfering (si)RNA-mediated knockdown of ARG2 to further confirm that T-cell recognition and activation was dependent on ARG2 expression. Transfection of THP-1 cells with a pool of three ARG2-specific siRNAs led to efficient ARG2 knockdown (). We assessed TNFα and IFNγ production by intracellular cytokine staining at 48 hours after transfection with siRNAs and cytokine-cocktail stimulation. Both TNFα and IFNγ production decreased from ARG2-specific T-cells reacting toward siRNA+cytokine cells compared to mock+cytokine cells, even if production was not completely abrogated (). RT-qPCR of ARG2 expression in the cells also showed ARG2 knockdown in siRNA+cytokine cells, but ARG2 expression levels were slightly higher than the levels obtained with only siRNA knockdown ().
ARG2 vaccination in vivo
To examine a potential functional effect of ARG2-specific T-cells in vivo, we went on to identify relevant murine ARG2 peptide epitopes. We screened the murine ARG2 protein sequence for possible MHC binding peptide epitopes using the SYFPEITHI and NetMHC epitope prediction algorithms (available at www.syfpeithi.de and cbs.dtu.dk, respectively). Six high scoring peptide epitopes spread across ARG2 protein (supplementary table 3) were selected for evaluation. To this end, we screened for immune responses in C57BL/6 mice by s.c. vaccination of mice in a peptide-montanide emulsion. Three mice per group were vaccinated with each of the 6 candidate peptides, and 7 days later mice were sacrificed, spleens were retrieved, and PBMCs were isolated and analyzed in an ex vivo mIFNy ELISPOT assay. We observed strong immune responses in all 3 mice vaccinated with mARG2(188–197) (denoted P4) (). This was subsequently confirmed in a similar experiment with a larger number of mice per group ().
Figure 8. ARG2 vaccination results on LL/2 tumor growth delay. (a) Murine IFNy ELISPOT screening of PBMCs from the spleens of C57BL/6 mice vaccinated with one of six different predicted ARG2 epitopes. 8*10^5 cells were plated pr. well and peptide and control stimulation were performed in triplicates. Specific spot counts (peptide-specific IFNy secreting cells) are given as the difference in number of IFNy spots between averages of the wells stimulated with peptide and control wells. (b) Murine IFNy ELISPOT of PBMCs from the spleen of C57BL/6 mice vaccinated with ARG2 peptide P4 (M1-M5) or a control vaccination (Ctrl1-4). 8*10^5 cells were plated pr. well and peptide and control stimulation were performed in triplicates. Specific spot counts (peptide-specific IFNy secreting cells) are given as the difference in number of IFNy spots between averages of the wells stimulated with peptide and control wells.(c) ARG2 expression in engrafted tumors of different origin in C57BL/6 background. 3 engrafted tumors were evaluated pr. tumor type. Data are represented as relative expression to the housekeeping gene Hprt1, mean+SD, n = 3. (d) Treatment schedule for ARG2 (P4) vaccination in Lewis lung carcinoma (LL/2) challenged mice. On day 0, 0.5*10^6 LL/2 tumor cells were injected subcutaneously in the right flank of female C57BL/6 mice. Hereafter, mice were left untreated or received either control vaccination or ARG2 vaccination on day 0 and 7. (e) Average growth of LL/2 tumors in untreated or ARG2 (P4) vaccinated mice (n = 15 for each group). Female C57BL/6 mice were inoculated with LL/2 cells and were left untreated or received ARG2 (P4) vaccination on day 0 and 7, as indicated in (d). Error bars indicate the standard error of the mean (SEM). * = p = .013 (Two-way ANOVA with Bonferroni correction). (f) Individual tumor sizes from the treatment groups described in (e). Error bars indicate the standard deviation (SD). *** = p ≤ 0.001 (Two-tailed Student t-test). (g) Average tumor growth of LL/2 tumors in control vaccinated or ARG2 (P4) vaccinated mice (n = 20 for each group). Female C57BL/6 mice were inoculated with LL/2 cells and received either control vaccination or ARG2 (P4) vaccination on day 0 and 7, as indicated in (d). Error bars indicate the standard error of the mean (SEM). **** = p ≤ 0.0001 (Two-way ANOVA with Bonferroni correction). (h) Individual tumor sizes from the treatment groups described in (g). Error bars indicate the standard deviation (SD). **** = p ≤ 0.0001 (Two-tailed Student t-test).
To identify the most relevant tumor model for evaluating the therapeutic effect of ARG2 vaccination, we evaluated ARG2 expression in a panel of different engrafted tumors of C57BL/6 origin. Of the six tumor cells examined, Lewis lung carcinoma (LL/2) tumor cells were found to express consistently high levels of ARG2 () and were therefore chosen for evaluation of ARG2 vaccination in vivo. Challenge of C57BL/6 mice with LL/2 tumor cells followed by ARG2 (P4) vaccination on day 0 and day 7 () was found to cause a significant tumor growth delay compared to untreated control mice (). At all evaluated time points, the tumors from ARG2 vaccinated mice were significantly smaller than the tumors from the untreated control mice (). Mice were sacrificed at day 10 after tumor inoculation due to tumor ulceration. To confirm that the observed tumor growth delay was attributed to the effect of vaccine-primed ARG2-specific T cells and not merely due to unspecific immune activation from the adjuvant, we decided to compare the LL/2 tumor growth of ARG2 (P4) vaccinated to control vaccinated mice. As previously described, mice were challenged with LL/2 tumor cells and vaccinated with ARG2 (P4) peptide on day 0 and 7. Control vaccinated mice similarly received two vaccinations consisting of a Montanide:H20 emulsion (). Encouragingly, the ARG2 (P4) vaccination resulted in a significant tumor growth delay compared to the control vaccinated group (), indicating a therapeutic effect of ARG2-primed T cells. At all evaluated time points, the tumors were found to be significantly smaller in the ARG2 vaccinated group compared to the control vaccinated group (). Mice were sacrificed on day 12 after inoculation due to ulceration of tumors.
Discussion
Here we describe ARG2-specific effector T-cells that offer a potential, novel means of targeting ARG2-expressing immunosuppressive cells. By screening a peptide library covering the entire ARG2 sequence, we first identified peripheral ARG2-specific T-cells that are naturally present in the peripheral blood from patients with cancer and from HDs. Of interest, ARG2 contains multiple epitopes that peripheral T cells recognized amongst many subjects. The frequent T-cell responses against ARG2 emphasize the high immunogenicity of ARG2 and support the likelihood of boosting an ARG2-specific immune response in ARG2-expressing cancers, e.g., prostate cancer or AML. In AML we detected strong responses in 3 out of 9 examined patients. Interestingly these three patients with the strong ARG2-responses had de novo AML, whereas none of the patients who had progressed to AML from a more indolent disease (MPN or MPN) had an ARG2-response. This could suggest an exhaustion of ARG2-specific T-cells in the pre-AML phase in these patients that may subsequently have led to an escape. Furthermore, high frequency of ARG2-specific responses in healthy individuals suggest that these T-cells are a natural part of the immune system and may play an important role for immune homeostasis .Citation17 Naturally, this also suggests that the spontaneous T-cell response toward ARG2 is not necessarily directly linked to the malignant disease. However, our demonstration that ARG2 specific CD4 + T-cells are able to directly recognize and react to malignant myeloid cells in an ARG2-dependent manner, suggest that ARG2 specific T-cells will be able to react against both malignant and nonmalignant T-cells in an ARG2-expressing TME.
In general, tumors are now divided into different categories depending on the immune infiltration, as follows: (i) a scant immune infiltrate (‘cold’ tumors); (ii) an immune infiltrate precluded from contacting malignant T-cells ‘excluded’ tumors); and (iii) an abundant tumor infiltrate (‘hot’ tumors), held in check by robust immunosuppressive mechanisms.Citation30 An important therapeutic strategy involves using clinical combinations that convert ‘cold’ and ‘excluded’ tumors into ‘hot’ tumors, because the latter are generally associated with improved disease outcomes with immunotherapy, especially checkpoint blockade. An important characteristic of arginase is its expression in the ‘excluded’ tumor types because of arginase-expressing immune-suppressive cells in these tumors. ARG1 is upregulated in M2-like macrophages in response to cytokines such as IL-4 and IL-13, in addition to IL-10 and transforming growth factor-β.Citation31 In contrast, the regulation of ARG2 has been less well-characterized, but its expression can be induced in murine macrophages by Toll-like receptor ligands such as lipopolysaccharide and oligodeoxynucleotides containing high amounts of unmethylated cytosine guanine motifs.Citation32 Furthermore, IL1β and TNFα induce ARG2 in neuroblastoma cells.Citation33 Here we show that a mixture of cytokines (i.e., IL4, GM-CSF, and TNF-α) induces ARG2 in malignant myeloid cells. Thus, ARG2 seems to be induced by environments of both excluded tumors and the more ‘intermediate’ to ‘hot’ tumors. Our data shows that Arg-2-specific self-reactive T cells are a naturally occurring part of T-cell repertoire of the human immune system even in healthy donors. Interestingly, the T-cell responses against the individual peptides in the periphery varied. This may of cause simply reflect different HLA-types expressed among donors. However, it may also illustrate that T-cell responses in the periphery are fluctuating due to different inflammatory conditions of the hosts. In conditions where ARG2 are induced in cells a subsequent activation of ARG2-specific T-cells occurs. Some healthy donors that did not show a reaction toward a given peptide may thus have a positive reaction if they were examined at other time points.
Because of the differing microenvironments that lead to induction of ARG1 versus ARG2, it is no surprise that different T-cells and different tumor types in the tumor microenvironment express these two enzymes differentially. MDSCs and tumor-associated macrophages mainly express ARG1, whereas ARG2 has been described as being expressed by various solid tumor cells, AML blasts, and CAFs. For this reason, the combination of ARG1 and ARG2 for vaccination might capture different immunosuppressive arginase-expressing cells in the tumor microenvironment and benefit more patients.
Activated M1 macrophages that propagate inflammation arise in response to Th1 cytokines such as IFNγ.Citation34 Of note, many stroma cells are not terminally differentiated and can revert into immunocompetent T-cells under a pro-inflammatory stimulus. Activation of arginase-specific T-cells by a trigger such as vaccination should indeed cause Th1 inflammation at the tumor site.Citation22 We have reported that other types of anti-Tregs exist, including IDO- and PD-L1–specific pro-inflammatory T-cells.Citation35–Citation40 We have further reported that Th1-inflammation signals, such as IFNγ, spontaneously lead to the expansion of these IDO- and PD-L1–specific T-cells,Citation36,Citation41 suggesting a potential synergism of arginase with IDO- or PDL1-based vaccines. In this scenario, ARG1/ARG2 vaccination could induce Th1 inflammation at tumor sites, where arginase-expressing cells otherwise prevent lymphocyte infiltration. In turn, this effect would induce IDO and/or PD-L1, enabling further targeting by anti-Tregs that recognize epitopes derived from these targets. Thus, the combination of epitopes from different anti-Treg target antigens could be additive in a vaccination approach.
Combination therapy with ARG2 immune-modulatory vaccines that activate ARG2-specific T-cells and checkpoint-blocking antibodies should increase the number of patients able to respond to therapy compared to checkpoint blockade alone, which works only in inflamed tumors. Arginase-expressing cells prevent effector lymphocyte proliferation at the tumor site [8] and are an important reason for the lack of effect of anti-PD1 therapy in many patients with cancer. Here we confirmed that ARG2 is indeed expressed in poorly immunogenicCitation42 and anti-PD-1–resistantCitation43 tumor model Lewis lung carcinoma. We find that activation of ARG2-specific T-cells by vaccination significantly inhibits Lewis lung carcinoma tumor growth. ARG2-expression has previously been described in the LL model, and ARG2 seems to be expressed more in CAFs and TAMs than in cancer cellsCitation44 underlining the immune modulatory character of the ARG2 vaccine.
In summary, we report that ARG2-specific T-cells are a natural part of the immune system and can be readily employed to tip the balance away from immune suppression in cancer. Therapeutic vaccination against ARG2 should promote generation of an inflammatory tumor microenvironment that would favor cancer-specific immune responses against cancer cells. It is therefore likely that an ARG2-based vaccine would function synergistically with another immunotherapy, especially checkpoint inhibitors. The most immunogenic peptide used here efficiently stimulated ARG2-specific T-cell responses. This function may be vital for rebalancing the microenvironment and should increase the effect of T-cell–enhancing drugs, such as checkpoint blockers, compared to monotherapy or current vaccines that target only cancer cells.
Methods
Patient material
PBMCs from healthy donors were isolated using density gradient separation over Lymphoprep™ (Alere) and cryopreserved at −150°C in FBS (Life Technologies) supplemented with 10% DMSO. PBMCs from cancer patients with solid tumors were isolated from blood samples taken a minimum of four weeks after the termination of any anti-cancer therapy. PBMCs from patients with AML were isolated from blood samples taken from patients at different disease and treatment stages, thus including patients in therapy. PMBCs were maintained in X–vivo (BioNordika) supplemented with 5% human serum (Sigma Aldrich).
Cell culture
THP-1 were cultured in RPMI (Gibco) supplemented with 10% FBS. Set2 cells were cultured in RPMI with 20% FBS. OCI-AML-2 cells were cultured in Alpha-MEM (Life Technologies) with 10% FBS. MONO-MAC-1 cells were cultured in RPMI supplemented with 10% FBS, 1 mM sodium pyruvate (Life Technologies), 2 mM L-glutamine (Life Technologies) and 1x non-essential amino acids (Life Technologies). All cell lines were tested and confirmed negative for mycoplasma. Cells were passaged 2–3 times a week. Cytokine stimulation with IL-4 (400 U/ml), IL-13 (50 ng/ml), IFNy (100 U/ml) or cytokine cocktail (400 U/ml IL-4, 1000 U/ml GM-CSF and 1000 U/ml TNFα) was done by seeding of 0.5–0.75 mio cells pr. ml medium supplemented with the respective cytokines and 48 hrs of incubation before cells were harvested for various experiments. All cytokines are from Trichem.
Tumor derived cell line Lewis lung carcinoma (LL/2), B16.F10, MC38 and GL261 were cultured in DMEM supplemented with penicillin, streptomycin and 10% FBS. Pan02 cells were cultured in RPMI supplemented with penicillin, streptomycin and 10% FBS while EO771 cells were cultured in DMEM supplemented with 20% FCS and HEPES buffer. Cells were passaged 2–3 times a week by detachment from the flask with 0.25% Trypsin-EDTA (Gibco).
Peptides
The ARG2 peptide library of 34 20mer peptides was synthesized by PepScan and dissolved in DMSO at 10 mM for screening for immune responses. For remaining experiments, ARG2-1 was dissolved in sterile water at 2 mM. Long ARG2 peptides (A2L1, A2L2, A2L3) were synthesized by Schäfer and dissolved at 2 mM in sterile water. Peptides dissolved in sterile water was filtered through a 0.22 µm filter before use. Purity of the synthesized peptides were >90 %. For a list of all peptides, see supplementary table 1.
Peptide stimulation and ELISPOT assay
PBMCs from healthy donors or cancer patients were stimulated with 10 µM of ARG2-derived peptides in vitro to enhance assay sensitivity. On day 2, IL-2 was added to a total of 120 U/ml IL-2 (Novartis). After 7 days, 4–6 × 10⁵ PBMCs were placed at the bottom of an ELISPOT plate pre-coated with IFNy capture antibody (Mabtech). PBMCs from each donor or patient were set up in triplicates or quadruplicates for peptide (5 µM ARG2-derived peptide) and control stimulations. Cells were incubated in ELISPOT plates in the presence of an antigen for 14–16 hrs after which they were washed off and secondary biotinylated antibody (Mabtech) was added. After two hours of incubation the secondary antibody was washed off before addition of streptavidin conjugated alkaline phosphatase (Mabtech) for 1 hr. Next, unbound enzyme was washed off and the assay was developed by adding BCIP/NBT subtrate (Mabtech). Developed ELISPOT plates were analyzed on CTL Immunospot S6 Ultimate-V analyzer with ImmunoSpot software, version 5.1. Responses are reported as the difference between average number of spots in well stimulated with ARG2-derived peptides and control wells.
ELISPOT assays with ARG2-specific T-cells (effector cells) and various immune or cancer cells as target cells were setup by placing 1–5 × 10⁴ effector cells (as indicated) and 1–2.5 × 10⁴ targeT-cells (as indicated) in the bottom of an ELISPOT well. Peptide pulsing of targeT-cells were performed by incubation of cells with 20 µM peptide for 1 hr followed by two washes to remove unbound peptide. These cells served as positive control. Effector cells plated without target cells served as negative control. All conditions were setup in triplicates or quadruplicates.
Intracellular cytokine staining assay
Intracellular staining of cell cultures was performed on PBMCs after one week of ARG2-derived peptide stimulation in vitro. For the assay, 9 × 10⁵ PMBCs were re-stimulated with ARG2-derived peptides (or incubated with no peptide as a control) for 5 hours in the presence of BD GolgiPlugTM (added after the first hour of peptide stimulation). Stimulated cells were stained with fluorescently labeled antibodies for surface markers (CD3, CD4, CD8) and thereafter permeabilized by using Fixation/Permeabilization and Permeabilization Buffer (eBioscience, cat. 00–5123-43), according to manufacturer’s instructions. Permeabilized cells were then stained with fluorochrome-labeled antibodies for IFNγ and TNFα. Flow cytometry analysis was performed on a FACSCantoTM II (BD Biosciences). Antibodies used: IFNγ-APC, TNFα-BV421, CD4-PerCP, CD8-FITC, CD3-APC-H7, CD4-FITC, CD8-PerCP, and dead cells stain- FVS510 (all from BD Biosciences) according to manufacturer’s instructions. For intracellular cytokine staining to detect cytokine production of ARG2-specific T-cells in response to targeT-cells, 5 × 10⁵ ARG2 specific cells were incubated with 2.5 × 10⁵ targeT-cells for 5 hours with GolgiPlug™ added after the first hour.
Establishment of ARG2-specific T-cell cultures
The ARG2-specific T-cell culture was established by initial stimulation of PMBCs from a prostate cancer patient with irradiated ARG2-1 loaded autologous mature dendritic cells. The following day IL-12 (20 U/ml) and IL-7 (40 U/ml) was added. PBMCs were restimulated every 8 days with ARG2-1 peptide loaded autologous DCs followed by addition of IL-2 (120 U/ml) the next day. ARG2-specific T-cells were enriched using IFNy enrichment kit (MiltenyiBiotec) after 4 stimulations. Cells were expanded and ARG2-specific T-cells were further enriched using CD4+ enrichment kit (MiltenyiBiotec).
Production of in-vitro transcribed mRNA
The cDNA encoding ARG2 (NM_001172.4) was synthesized and cloned into the HLA Class II targeting plasmid pGEM-sig-DC.LAMP (kindly provided by Dr. K. Thielemans, Medical School of the Vrije Universiteit Brussel) using BamHI restriction sites. The pGEM-ARG2-DC-LAMP plasmid was linearized with SpeI before serving as DNA template for in vitro transcription .Citation45
Total RNA extraction
Cells were harvested, washed in PBS and pelleted by centrifugation. Cell pellets were kept on ice or frozen down at −80°C until RNA extraction. Total RNA was extracted using the RNAeasy Plus Mini Kit (Qiagen) according to manufacturer’s instruction with final elution in 30 µl of RNA-free water. The RNA concentration was measured on the NanoDrop 2000 Spectrophotometer (Thermo Scientific). RNA was stored at −80°C.
RT-qPCR
Total RNA was reverse transcribed using the High Capacity cDNA Reverse Transcription Kit (Applied Biosystems). For each reaction, 1000 ng RNA was reverse transcribed. For RT-qPCR, the cDNA was diluted 1:5 and subjected to RT-qPCR analysis using the TaqMan Gene Expression Assay on the Roche Lightcycler 480 Instrument. RT-qPCRs were run in quadruplicates and data was analyzed using the dCT-method with normalization to expression level of the house keeping gene RPLPO and control sample. For low concentration samples that were not amplified, Ct was set to 40. No-reverse transcriptase controls (cDNA reactions setup without reverse transcriptase) served as controls of specific amplification. A list of primers used in this study is found in supplementary table 4.
Electroporation
For mRNA, DCs or cancer cells were transfected with ARG1-DC-LAMP mRNA, ARG2-DC-LAMP mRNA or control mRNA encoding eGFP using electroporation parameters as previously described. Briefly, cells were washed twice in Opti-MEM medium (Thermo Scientific) and adjusted to a final cell concentration of 9–12 × 106 cells/ml. 350 µl cell suspension was preincubated on ice for 5 minutes before addition of 10 µg mRNA. The cell suspension was then quickly transferred into a 2-mm (cancer cells) or 4-mm (DCs) gap electroporation cuvette and electroporated.Citation45 After electroporation, cells were quickly transferred to a dish with pre-warmed medium and incubated in humidified atmosphere with 5% CO2 before use for different experimental analysis. mRNA transfected cells were rested for 1 hr before they were setup in ELISPOT assay or rested overnight before set-up in intracellular cytokine staining assay. Electroporation efficiency was determined 24 hours post transfection by FACS analysis of the GFP transfected cells.
siRNA mediated ARG2 silencing
A set of three siRNA duplexes targeting ARG2 was obtained from Ambion (ARG2 Silencer Select Validated siRNA, ID s1571, s1572, s1573). siRNAs were suspended in nuclease free water to 0.1 nmol stock solutions and stored at −80°C. For ARG2 silencing experiments, THP-1 cells were prepared for electroporation as described above and 10 µl of a working solution of 0.02 nmol siRNA solution was added of each of the three siRNA before transfection as previously described. Immediately after transfection, cells were transferred to pre-warmed medium and incubated for 1 hr. Transfected cells were then split in two, and to half of the cells cytokine cocktail (400 U/ml IL-4, 1000 U/ml GM-CSF and 1000 U/ml TNFα) was added. Cells were incubated in medium or medium containing cytokine cocktail for 48 hrs before they were set up in intracellular cytokine staining assay. Cells were pelleted for RNA after 48 hrs for accession of knock down efficiency by RT-qPCR.
Flow cytometric analysis of HLA-DR expression
HLA-DR expression analysis was performed on cells stimulated for 48 hrs with mock (no cytokines), IFNy (100 U/ml) or cytokine cocktail (400 U/ml IL-4, 1000 U/ml GM-CSF and 1000 U/ml TNFα). Briefly, cells were washed and stained with 7-AAD (cat: 51–68981E, BD Bioscience) and FITC-conjugated mouse anti-human HLA-DR, DP, DQ (cat: 5555581, BD Bioscience) or FITC-conjugated mouse IgG1 K isotype ctrl (FC) (cat: 400109, BD Bioscience) for 30 minutes at 4 °C. Excess antibody was washed off before cells were analyzed on FACSCanto™ II instrument. HLA-DR expression levels is given as the difference in MFI between MHC Class II stained live cells and isotype control stained live cells.
Animal experiments
Animal experiments were performed at the animal facility of the Department of Oncology, Herlev Hospital. Daily care and breeding of C57BL/6 mice was performed by animal caretakers of the animal facility. For the therapeutic vaccination studies, C57BL/6 mice were purchased from Taconic.
Tumor injections
LL2 cells (5*10^5) were resuspended in 100ul of serum free medium and were injected subcutaneously in the right flank of female C57BL/6 mice. Tumor volumes were measured by digital caliper and calculated according to the formula Volume = (Length x Width^2)/2. The endpoint of the tumor studies was a tumor reaching the threshold size of 1000 mm3 or due to the formation of ulcers on the tumor.
Peptide vaccination and murine ELISPOT
Murine ARG2 peptides (P1-P6) were synthesized by PepScan or Schäfer and dissolved in either ultrapure water or DMSO at 2 mM or 10 mM, respectively, depending on the reported solubility. Dissolved peptides were subsequently emulsified with Montanide adjuvant (50 αl/mouse) (Seppic Inc.) for an optimal dose of 100 αg total peptide given in a total volume of 100 αl. The emulsified peptide vaccination was injected subcutaneously at the base or the tail or the flank of 12–16 weeks old C57BL/6 mice with a 27 G needle. Control mice were given water and Montanide emulsification in a total volume of 100 αl. For therapeutic vaccine studies on tumor inoculated mice, vaccinations were given at day 0 and 7 after tumor inoculation at the flank of the tail and the left flank, respectively. For epitope screening – and validation experiments, a single dose of vaccine was given to mice at the right flank. One week later, mice were sacrificed, and spleens were recovered. Spleens were smashed through a 70 µM filter and red blood cells were lysed using Red Blood Cell Lysis Buffer (Qiagen). Cells were washed 4 times and counted before setup for murine IFNy ELISPOT assay with 8*106 cells pr. well.
Statistical analysis
ELISPOT responses were analyzed using distribution free resampling (DFR) method, described by Moodie et al.46 Statistical analysis of ELISPOT responses was performed using R studio. The difference in responses (specific IFNy-secreting cells) toward ARG2-1 and A2L2 were compared with the use of Wilcoxon matched pairs signed ranked t test (using Prism 8) with a significance level of 0.05. Two-tailed Student t-test was performed to determine statistical significance between tumor sizes at single timepoints and Two-way ANOVA with Bonferroni correction was used to determine statistical significance for entire tumor growth curves with comparison between multiple timepoints (using Prism 8).
Study approval
All protocols were approved by the Scientific Ethics Committee for the Capital Region of Denmark and conducted in accordance with the provisions of the Declaration of Helsinki. Permission to collect samples from AML patients was granted from the Scientific Ethics Committee of Region Zealand. Written informed consent from the patients was obtained before study entry. All animal experiments were reviewed and approved by the Danish Animal Experimentation Council.
Author contributions
Designing research (MHA), conducting experiments (SEW-B, MLH, MOH, MAJ, SKB, EM), acquiring data (ÖM, DHM, MHA), analyzing data (SEW-B, MLH, MOH, MAJ, SKB, EM, MC, IMS, NØ, AWP, ÖM, DHM, MHA), providing reagents (AWP, NØ, DHM), and writing the manuscript (SEW-B, MLH, MHA).
Disclosure of Potential Conflicts of Interest
No potential conflicts of interest were disclosed.
Supplemental Material
Download ()Acknowledgments
We would like to thank Merete Jonassen for excellent technical support and Tobias Wirenfeldt Clausen for highly valued statistical support. This work was supported by Herlev Hospital, the Danish Cancer Society, and the Danish Council for Independent Research. The funders had no role in the study design, data collection and analysis, decision to publish, or manuscript preparation.
Disclosure statement
MHA has made an invention based on the use of ARG2 for vaccinations. The rights of the invention have been transferred to Copenhagen University Hospital Herlev, according to the Danish Law of Public Inventions at Public Research Institutions. The capital region has licensed the rights to the company IO Biotech ApS, whose purpose is to develop immune-modulating vaccines for cancer treatments. The patent application was filed by IO Biotech ApS. MHA is a shareholder and board member of IO Biotech ApS. IMS is a shareholder of IO Biotech ApS. EM and AWP are employed at IO Biotech ApS.
Supplementary material
Supplemental data for this article can be accessed on the publisher’s website.
Additional information
Funding
References
- Wu AA, Drake V, Huang HS, Chiu S, Zheng L. Reprogramming the tumor microenvironment: tumor-induced immunosuppressive factors paralyze T cells. Oncoimmunology. 2015;4(7):e1016700. doi:10.1080/2162402X.2015.1016700.
- Caldwell RB, Toque HA, Narayanan SP, Caldwell RW. Arginase: an old enzyme with new tricks. Trends Pharmacol Sci. 2015;36(6):395–16. doi:10.1016/j.tips.2015.03.006.
- Bronte V, Zanovello P. Regulation of immune responses by L-arginine metabolism. Nat.Rev.Immunol. 2005;5(8):641–654. doi:10.1038/nri1668.
- Bronte V, Kasic T, Gri G, Gallana K, Borsellino G, Marigo I, Battistini L, Iafrate M, Prayer-Galetti T, Pagano F, et al. Boosting antitumor responses of T lymphocytes infiltrating human prostate cancers. J.Exp.Med. 2005;201(8):1257–1268. doi:10.1084/jem.20042028.
- Mondanelli G, Bianchi R, Pallotta MT, Orabona C, Albini E, Iacono A, Belladonna ML, Vacca C, Fallarino F, Macchiarulo A, et al. A relay pathway between arginine and tryptophan metabolism confers immunosuppressive properties on dendritic cells. Immunity. 2017;46(2):233–244. doi:10.1016/j.immuni.2017.01.005.
- Gannon PO, Godin-Ethier J, Hassler M, Delvoye N, Aversa M, Poisson AO, Péant B, Alam Fahmy M, Saad F, Lapointe R, et al. Androgen-regulated expression of arginase 1, arginase 2 and interleukin-8 in human prostate cancer. PLoS.One. 2010;5(8):e12107. doi:10.1371/journal.pone.0012107.
- Cerutti JM, Delcelo R, Amadei MJ, Nakabashi C, Maciel RMB, Peterson B, Shoemaker J, Riggins GJ. A preoperative diagnostic test that distinguishes benign from malignant thyroid carcinoma based on gene expression. J.Clin.Invest. 2004;113(8):1234–1242. doi:10.1172/JCI19617.
- Cerutti JM, Latini FR, Nakabashi C, Delcelo R, Andrade VP, Amadei MJ, Maciel RM, Hojaij FC, Hollis D, Shoemaker J, et al. Diagnosis of suspicious thyroid nodules using four protein biomarkers. Clin Cancer Res. 2006;12(11 Pt 1):3311–3318. doi:10.1158/1078-0432.CCR-05-2226.
- Bron L, Jandus C, Andrejevic-Blant S, Speiser DE, Monnier P, Romero P, Rivals J-P. Prognostic value of arginase-II expression and regulatory T-cell infiltration in head and neck squamous cell carcinoma. Int.J.Cancer. 2013;132(3):E85–E93. doi:10.1002/ijc.27728.
- Singh R, Pervin S, Karimi A, Cederbaum S, Chaudhuri G. Arginase activity in human breast cancer cell lines: N(omega)-hydroxy-L-arginine selectively inhibits cell proliferation and induces apoptosis in MDA-MB-468 cells. Cancer Res. 2000;60:3305–3312.
- Porembska Z, Luboiński G, Chrzanowska A, Mielczarek M, Magnuska J, Barańczyk-Kuźma A. Arginase in patients with breast cancer. Clin.Chim.Acta. 2003;328(1–2):105–111. doi:10.1016/S0009-8981(02)00391-1.
- Del Ara RM, González-Polo RA, Caro A, Del Amo E, Palomo L, Hernández E, Soler G, Fuentes JM. Diagnostic performance of arginase activity in colorectal cancer. Clin.Exp.Med. 2002;2(1):53–57. doi:10.1007/s102380200007.
- Takenawa H, Kurosaki M, Enomoto N, Miyasaka Y, Kanazawa N, Sakamoto N, Ikeda T, Izumi N, Sato C, Watanabe M, et al. Differential gene-expression profiles associated with gastric adenoma. Br.J.Cancer. 2004;90(1):216–223. doi:10.1038/sj.bjc.6601399.
- Mussai F, De Santo C, Abu-Dayyeh I, Booth S, Quek L, McEwen-Smith RM, Qureshi A, Dazzi F, Vyas P, Cerundolo V, et al. Acute myeloid leukemia creates an arginase-dependent immunosuppressive microenvironment. Blood. 2013;122(5):749–758. doi:10.1182/blood-2013-01-480129.
- Mussai F, Egan S, Higginbotham-Jones J, Perry T, Beggs A, Odintsova E, Loke J, Pratt G, U KP, Lo A, et al. Arginine dependence of acute myeloid leukemia blast proliferation: a novel therapeutic target. Blood. 2015;125(15):2386–2396. doi:10.1182/blood-2014-09-600643.
- Monteran L, Erez N. The dark side of fibroblasts: cancer-associated fibroblasts as mediators of immunosuppression in the tumor microenvironment. Front Immunol. 2019;10:1835. doi:10.3389/fimmu.2019.01835.
- Andersen MH. The balance players of the adaptive immune system. Cancer Res. 2018;78(6):1379–1382. doi:10.1158/0008-5472.CAN-17-3607.
- Andersen MH. Immune regulation by self-recognition: novel possibilities for anticancer immunotherapy. J Natl Cancer Inst. 2015;107(9):154. doi:10.1093/jnci/djv154.
- Martinenaite E, Mortensen REJ, Hansen M, Orebo Holmström M, Munir Ahmad S, Grønne Dahlager Jørgensen N, Met Ö, Donia M, Svane IM, Andersen MH, et al. Frequent spontaneous adaptive immune responses towards arginase. Oncoimmunology. 2017;7(3):e1404215. doi:10.1080/2162402X.2017.1404215.
- Martinenaite E, Ahmad SM, Svane IM, Andersen MH. Peripheral memory T cells specific for Arginase-1. Cell Mol Immunol. 2019;16(8):718–719. doi: 10.1038/s41423-019-0231-3.
- Martinenaite E, Ahmad SM, Bendtsen SK, Jørgensen MA, Weis-Banke SE, Svane IM, Andersen MH. Arginase-1-based vaccination against the tumor microenvironment: the identification of an optimal T-cell epitope. Cancer Immunol Immunother. 2019;68(11):1901-1907. doi: 10.1007/s00262-019-02425-6.
- Andersen MH. The targeting of tumor-associated macrophages by vaccination. Cell Stress. 2019;3(5):139–140. doi:10.15698/cst2019.05.185.
- Henderson RA, Michel H, Sakaguchi K, Shabanowitz J, Appella E, Hunt DF, Engelhard VH. HLA-A2.1-associated peptides from a mutant cell line: a second pathway of antigen presentation. Science. 1992;255(5049):1264–1266. doi: 10.1126/science.1546329.
- Wolfel C, Drexler I, Van Pel A, Thres T, Leister N, Herr W, Sutter G, Huber C, Wölfel T. Transporter (TAP)- and proteasome-independent presentation of a melanoma-associated tyrosinase epitope. Int.J.Cancer. 2000;88(3):432–438. doi:10.1002/1097-0215(20001101)88:3<432::AID-IJC16>3.0.CO;2-9.
- Martinenaite E, Munir Ahmad S, Hansen M, Met Ö, Westergaard MW, Larsen SK, Klausen TW, Donia M, Svane IM, Andersen MH, et al. CCL22-specific T cells: modulating the immunosuppressive tumor microenvironment. Oncoimmunology. 2016;5(11):e1238541. doi:10.1080/2162402X.2016.1238541.
- Bonehill A, Heirman C, Tuyaerts S, Michiels A, Breckpot K, Brasseur F, Zhang Y, van der Bruggen P, Thielemans K. Messenger RNA-electroporated dendritic cells presenting MAGE-A3 simultaneously in HLA class I and class II molecules. J.Immunol. 2004;172(11):6649–6657. doi:10.4049/jimmunol.172.11.6649.
- Tsuchiya S, Yamabe M, Yamaguchi Y, Kobayashi Y, Konno T, Tada K. Establishment and characterization of a human acute monocytic leukemia cell line (THP-1). Int.J.Cancer. 1980;26(2):171–176. doi:10.1002/ijc.2910260208.
- Chanput W, Mes JJ, Wichers HJ. THP-1 cell line: an in vitro cell model for immune modulation approach. Int.Immunopharmacol. 2014;23(1):37–45. doi:10.1016/j.intimp.2014.08.002.
- Steube KG, Teepe D, Meyer C, Zaborski M, Drexler HG. A model system in haematology and immunology: the human monocytic cell line MONO-MAC-1. Leuk.Res. 1997;21(4):327–335. doi:10.1016/S0145-2126(96)00129-4.
- Mariathasan S, Turley SJ, Nickles D, Castiglioni A, Yuen K, Wang Y, Kadel III EE, Koeppen H, Astarita JL, Cubas R, et al. TGFbeta attenuates tumour response to PD-L1 blockade by contributing to exclusion of T cells. Nature. 2018;554(7693):544–548. doi:10.1038/nature25501.
- Munder M, Eichmann K, Morán JM, Centeno F, Soler G, Modolell M. Th1/Th2-regulated expression of arginase isoforms in murine macrophages and dendritic cells. J.Immunol. 1999;163:3771–3777.
- Gotoh T, Sonoki T, Nagasaki A, Terada K, Takiguchi M, Mori M. Molecular cloning of cDNA for nonhepatic mitochondrial arginase (arginase II) and comparison of its induction with nitric oxide synthase in a murine macrophage-like cell line. FEBS Lett. 1996;395(2–3):119–122. doi:10.1016/0014-5793(96)01015-0.
- Fultang L, Gamble LD, Gneo L, Berry AM, Egan SA, De Bie F, Yogev O, Eden GL, Booth S, Brownhill S, et al. Macrophage-derived IL1beta and TNFalpha regulate arginine metabolism in neuroblastoma. Cancer Res. 2019;79(3):611–624. doi:10.1158/0008-5472.CAN-18-2139.
- Martinez FO, Helming L, Gordon S. Alternative activation of macrophages: an immunologic functional perspective. Annu.Rev.Immunol. 2009;27(1):451–483. doi:10.1146/annurev.immunol.021908.132532.451-483.
- Munir S, Andersen GH, Met O, Donia M, Frosig TM, Larsen SK, Klausen TW, Svane IM, Andersen MH. HLA-restricted cytotoxic T cells that are specific for the immune checkpoint ligand PD-L1 occur with high frequency in cancer patients. Cancer Res. 2013;73(6):1674–1776. doi:10.1158/0008-5472.CAN-12-3507.
- Sorensen RB, Hadrup SR, Svane IM, Hjortsø MC, Thor Straten P, Andersen MH. Indoleamine 2,3-dioxygenase specific, cytotoxic T cells as immune regulators. Blood. 2011;117(7):2200–2210. doi:10.1182/blood-2010-06-288498.
- Sorensen RB, Kollgaard T, Andersen RS, van den Berg JH, Svane IM, Straten PT, Andersen MH. Spontaneous cytotoxic T-Cell reactivity against indoleamine 2,3-dioxygenase-2. Cancer Res. 2011;71(6):2038–2044. doi:10.1158/0008-5472.CAN-10-3403.
- Munir S, Larsen SK, Iversen TZ, Donia M, Klausen TW, Svane IM, Straten PT, Andersen MH. Natural CD4+ T-cell responses against indoleamine 2,3-dioxygenase. PLoS One. 2012;7(4):e34568. doi:10.1371/journal.pone.0034568.
- Munir S, Andersen GH, Svane IM, Andersen MH. The immune checkpoint regulator PD-L1 is a specific target for naturally occurring CD4+ T cells. Oncoimmunology. 2013;2(4):e23991. doi:10.4161/onci.23991.
- Munir S, Andersen GH, Woetmann A, Ødum N, Becker JC, Andersen MH. Cutaneous T cell lymphoma cells are targets for immune checkpoint ligand PD-L1-specific, cytotoxic T cells. Leukemia. 2013;27(11):2251–2253. doi:10.1038/leu.2013.118.
- Munir S, Lundsager MT, Jørgensen MA, Hansen M, Petersen TH, Bonefeld CM, Friese C, Met Ö, Straten PT, Andersen MH, et al. Inflammation induced PD-L1-specific T cells. Cell Stress. 2019;3(10):319–327. doi:10.15698/cst2019.10.201.
- Lechner MG, Karimi SS, Barry-Holson K, Angell TE, Murphy KA, Church CH, Ohlfest JR, Hu P, Epstein AL. Immunogenicity of murine solid tumor models as a defining feature of in vivo behavior and response to immunotherapy. J.Immunother. 2013;36(9):477–489. doi:10.1097/01.cji.0000436722.46675.4a.
- Mosely SI, Prime JE, Sainson RCA, Koopmann J-O, Wang DYQ, Greenawalt DM, Ahdesmaki MJ, Leyland R, Mullins S, Pacelli L, et al. Rational selection of syngeneic preclinical tumor models for immunotherapeutic drug discovery. Cancer Immunol.Res. 2017;5(1):29–41. doi:10.1158/2326-6066.CIR-16-0114.
- Madsen DH, Jürgensen HJ, Siersbæk MS, Kuczek DE, Grey Cloud L, Liu S, Behrendt N, Grøntved L, Weigert R, Bugge TH, et al. Tumor-associated macrophages derived from circulating inflammatory monocytes degrade collagen through cellular uptake. Cell Rep. 2017;21(13):3662–3671. doi:10.1016/j.celrep.2017.12.011.
- Met O, Balslev E, Flyger H, Svane IM. High immunogenic potential of p53 mRNA-transfected dendritic cells in patients with primary breast cancer. Breast Cancer Res Treat. 2011;125(2):395–406. doi:10.1007/s10549-010-0844-9.
- Moodie Z, Price L, Janetzki S, Britten CM. Response determination criteria for ELISPOT: toward a standard that can be applied across laboratories. Methods Mol Biol. 2012;792:185–196. doi: 10.1007/978-1-61779-325-7_15.