
ABSTRACT
Background
Biomarkers predicting immunotherapy response in metastatic renal cell cancer (mRCC) are lacking. PD-L1 immunohistochemistry is a complementary diagnostic for immune checkpoint inhibitors (ICIs) in mRCC, but has shown minimal clinical utility and is not used in routine clinical practice.
Methods
Tumor specimens from 56 patients with mRCC who received nivolumab were evaluated for PD-L1, cell proliferation (targeted RNA-seq), and outcome.
Results
For 56 patients treated with nivolumab as a standard of care, there were 2 complete responses and 8 partial responses for a response rate of 17.9%. Dividing cell proliferation into tertiles, derived from the mean expression of 10 proliferation-associated genes in a reference set of tumors, poorly proliferative tumors (62.5%) were more common than moderately (30.4%) or highly proliferative (8.9%) counterparts. Moderately proliferative tumors were enriched for PD-L1 positive (41.2%), compared to poorly proliferative counterparts (11.4%). Objective response for moderately proliferative (29.4%) tumors was higher than that of poorly (11.4%) proliferative counterparts, but not statistically significant (p = .11). When cell proliferation and negative PD-L1 tumor proportion scores were combined statistically significant results were achieved (p = .048), showing that patients with poorly proliferative and PD-L1 negative tumors have a very low response rate (6.5%) compared to moderately proliferative PD-L1 negative tumors (30%).
Conclusions
Cell proliferation has value in predicting response to nivolumab in clear cell mRCC patients, especially when combined with PD-L1 expression. Further studies which include the addition of progression-free survival (PFS) along with sufficiently powered subgroups are required to further support these findings.
Introduction
Immune checkpoint inhibitors (ICIs) have revolutionized the treatment of metastatic renal cell carcinoma (mRCC). In 2015, nivolumab (Opdivo®) became the first programmed cell death 1 (PD-1, CD279, or PDCD1) inhibitor to be approved by the US Food and Drug Administration for use in patients with mRCC progressing after prior antiangiogenic therapy (sunitinib, pazopanib, or axitinib).1 This approval was based on the results of the Phase III Checkmate-025 trial,Citation2,Citation3 which randomized VEGF-refractory patients to either everolimus, an mTOR inhibitor, or nivolumab. In this study, both PD-L1 negative and PD-L1 positive patients benefited from nivolumab compared with everolimus; therefore, PD-L1 status was deemed not predictive for response. In 2018, the combination of nivolumab and ipilimumab (Yervoy®) was approved as first-line therapy in intermediate or poor risk, previously untreated advanced renal cell carcinomaCitation4 based upon the results of the Phase III Checkmate-214 trialCitation5 that randomized patients with mRCC to either ipilimumab-nivolumab or sunitinib. In this study PD-L1, positive tumors constituted the majority of patients who achieved a CR (34/40; 85%), but still did not significantly distinguish responders from nonresponders in the overall population. In 2019, the combinations of axitinib with avelumab and axitinib with pembrolizumab were approved as first-line therapy for previously untreated advanced renal cell carcinoma, based on the results of the phase III Javelin Renal 101Citation6 and Keynote 426,Citation7 respectively. In Javelin Renal 101, progression-free survival for the PD-L1-positive cohort was the primary endpoint, but did not differ between the PD-L1 positive cohort and the intention-to-treat population (median PFS 13.8 months for PD-L1 positive and ITT population treated with avelumab/axitinib).Citation6 In Keynote 426, the PD-L1 high and low cohorts had similar OS outcomes (HR 0.54 (95% CI 0.35–0.84) for PD-L1 high vs HR 0.59 (95% CI 0.34–1.03) for PD-L1 low).Citation7 Based on these results, PD-L1 status does not currently play a role in treatment selection for first-line management of mRCC. In the ongoing phase II trial KEYNOTE-427,Citation8 evaluating pembrolizumab (Keytruda®, from Merck) as first-line treatment for advanced RCC, interim results reported at ASCO 2018 for 82 patients in cohort A (clear cell RCC) did show a higher objective response rate for patients whose tumor expressed PD-L1 on neoplastic or immune cells in a combined positive score (CPS) ≥1. While similar observations in NSCLC have led to the FDA companion diagnostic for pembrolizumab treatment using PD-L1 expression levels assessed by the PD-L1 22C3 pharmDx assay (from Agilent),Citation9 in the management of patients with metastatic RCC, PD-L1 expression analysis has not demonstrated robust predictive clinical utility. Based upon the current evidence, PD-L1 IHC as a complementary biomarker for response to checkpoint inhibition in mRCC varies from no value for single-agent nivolumabCitation3 to less than 50% accuracy for pembrolizumab or combination therapy.Citation5,Citation8 A population of mRCC patients with negative PD-L1 expression, seemingly “negative biomarker” patients, will still respond to ICI-based therapy, while many of those with a positive result, seemingly “positive biomarker” patients, still do not respond. We have previously shown in non-small cell lung cancer (NSCLC) that the proliferation status of the tumor is an additional biomarker of response that enhances predictive utility compared to PD-L1 expression alone,Citation10 and therefore hypothesized that assessing proliferative status could have similar value in mRCC. In this prior study of 120 NSCLC patients treated with ICIs, we showed that a cell proliferation signature, derived from the mean expression of 10 proliferation-associated genes (namely BUB1, CCNB2, CDK1, CDKN3, FOXM1, KIAA0101, MAD2L1, MELK, MKI67, and TOP2A), improved survival predictions in patients with both PD-L1 positive and negative tumors. More specifically, there was a significant survival advantage for moderately proliferative tumors compared to their combined highly/poorly proliferative counterparts. Proliferation status also had an impact on response in patients with both PD-L1 positive and negative tumors. Herein, we explore the utility of adding proliferation status to PD-L1 in determining ICI responses in mRCC.
Results
Patients
Fifty-six nivolumab-treated clear cell RCC patients were included (16 females, 40 males; Table S2), with a median age of 59 (mean 59.3; range 37–79) at the time of diagnosis. There were 2 CR (3.6%), 8 PR (14.3%), 18 SD (32.1%), and 28 PD (50.0%), for an overall objective response rate of 17.9%. At the time of last follow-up (FU), 31 patients were alive (median FU 15.6 months, range 4.1–33.7 months) and 25 were deceased (median FU 11 months, range 3–31.2 months).
Proliferative status
As compared to our prior results in NSCLC where poorly proliferative tumors were uncommon, Citation10 in mRCC they were the most common group. Dividing cell proliferation into tertiles using the mean gene expression of 10 proliferation-related genes as compared to a separate reference population of 735 patients with multiple tumor types, highly proliferative tumors were uncommon accounting for 7.1% (4/56). There were 30.4% moderately proliferative tumors (17/56), while the majority were poorly proliferative tumors (35/56; 62.5%). (, Table S1).Citation11 To evaluate the impact of single gene proliferation results, e.g. Ki-67, to the mean expression rank values of all 10 proliferation-related genes, we evaluated accuracy (i.e. true positive plus true negatives divided by total number of results) for each gene individually (Table S3). Accuracy ranged from a low of 64.3% for MAD2L1 and Ki-67 to 75% for KIAA0101, as compared to the accuracy of 69.6% for the mean expression rank values of all 10 proliferation-related genes (Fig. S1). Sensitivity, positive predictive value, and negative predictive value were highest for the mean expression rank values of all 10 proliferation-related genes (50%, 29.4%, 87.2%, respectively). These results suggest that poorly proliferative tumors are much more common in RCC as compared to NSCLC, and it is possible to reach similar results for proliferative status using only single gene evaluations for any of the 10 genes evaluated.
PD-L1 levels, tumor inflammation, and proliferative status
The rate of PD-L1 positive results in this study was very similar to prior clinical trials, Citation2,Citation3,Citation5,Citation8 and tumors with positive PD-L1 expression were more frequently moderately proliferative as compared to poorly proliferative tumors. PD-L1 TPS status was positive in 21.4% (12/56) (), while PD-L1 CPS was positive (CPS ≥ 1) in 42.9% (24/56) (). Moderately proliferative tumors had a statistically higher number of PD-L1 positive results (41.2%; 7 positive,10 negative), as compared to poorly proliferative tumors (11.4%; 4 positive, 31 negative) by TPS scoring (p = .014) (). By CPS scoring, which includes expression in both neoplastic and immune cells, moderately proliferative tumors did not have a statistically higher number of PD-L1 positive results (58.8%; 10 positive, 7 negative), as compared to poorly proliferative tumors (31.4%; 11 positive, 24 negative) (p = .059) (). While highly proliferative tumors showed frequent positive PD-L1 expression, their total numbers were too small for meaningful conclusions. Overall these results support that as PD-L1 expression and moderately proliferative tumors are correlated, and there may be an increase in the frequency of PD-L1 expression in mRCC tumors as proliferation increases.
Tumor inflammation was assessed in a binary fashion similar to PD-L1 as negative or positive. Using RNA-seq CD8 rank as a surrogate marker of tumor inflammation cases were divided into the upper 50th percentile and considered as inflamed, and a lower 50th percentile as non-inflamed in comparison to a reference population. This arbitrary division resulted in one-half of all cases considered as inflamed (50%; 28/56), and one-half as non-inflamed (50%; 28/56) (), and showed no association with proliferation (p = .8306) with a nearly equal number of highly, moderately, and poorly proliferative tumors in each inflamed (2 highly, 8 moderately, 18 poorly proliferative) versus non-inflamed (2 highly, 9 moderately, 17 poorly proliferative) group. These results support that cell proliferation and tumor inflammation are separate variables, as opposed to the results for PD-L1.
Overall survival
For the two proliferation groups with sufficient patients for analysis, median survival was not reached for moderately proliferative tumors compared to 18 months for poorly proliferative tumors (p = .3) (). In a comparable fashion, for PD-L1 expression median survival was reached for both groups by either method of analysis, i.e. TPS (), or CPS (), but was not statistically significant for PD-L1 positive tumors (p = .6, p = .61, respectively). Combining cell proliferation and PD-L1 status using CPS, whereby the number of PD-L1 positive versus negative was similar, no trend for survival advantage was noted (p = .58) ().
Objective response
Proliferation and PD-L1 status was associated with best radiographic responses in patients treated with immune checkpoint blockade (objective response defined as complete or partial responses). The results (, ) show that patients with PD-L1 positive tumors have 2x or higher objective response rate for either TPS (positive 33.3%, 4/12; negative 13.6%, 6/44) or CPS (positive 25%, 6/24; negative 12.5%, 4/32) method of scoring, but statistical significance was not reached with either (p = .114, p = .227, respectively). Objective response for moderately proliferative (5/17, 29.4%) tumors was higher than that of their poorly (4/35, 11.4%) proliferative counterparts, but not statistically significant (p = .108). Statistically significant results were achieved when cell proliferation and negative PD-L1 TPS were combined (p = .048), showing that patients with poorly proliferative and PD-L1 negative tumors have a very low response rate (2/31, 6.5%) as compared to moderately proliferative PD-L1 negative tumors (3/10, 30%) (). These results support that the combination of proliferative and PD-L1 status may constitute a predictive biomarker for the propensity of RCC patients to respond to ICIs. More specifically, these results support that cell proliferation has additive value in predicting lack of response in RCC patients with negative PD-L1 expression, which represents the majority of cases.
Table 1. Patient characteristics.
Table 2. Objective response for cell proliferation and PD-L1 IHC.
The response rate in inflamed tumors (21.4%; 6/28) was slightly higher than in non-inflamed (14.3%; 4/28) tumors, but not statistically different (p = .73). Likewise, statistically significant results for OR were not achieved when cell proliferation and tumor inflammation were combined for both inflamed (p = .30) and non-inflamed (p = .90) tumors (). Overall these results support that tumor inflammation in this limited cohort did not have discriminatory value for OR, and that cell proliferation is independent of this variable for response analysis.
In further support of this conclusion, a multivariate analysis on all covariates using a binomial logistic regression model showed that poorly proliferative tumors with no expression of PD-L1 in neoplastic cells had a significant association with lack of objective response (; p < .1). Furthermore, the analysis of deviance of each covariate () suggests that combining proliferation and PD-L1 expression in neoplastic cells to a null model improved response prediction significantly (p < .1). Collectively these results suggest that the proliferative status of the tumor microenvironment may help further identify patients who will be unlikely to respond to single-agent immune checkpoint blockade.
Table 3. Multivariate analysis for prediction of no objective response.
Discussion
Our initial findings, which are limited by the size and retrospective nature of this study, suggest that poorly proliferative clear cell RCC tumors with a lack of expression of PD-L1 in neoplastic cells are associated with a lower clinical response to nivolumab. The ultimate goal of targeted RNA-seq to assess the proliferative status of the tumor microenvironment is to improve clinical decision-making surrounding the use of checkpoint inhibitors beyond assessment of a single biomarker such as PD-L1 IHC, Citation12 tumor mutational burden,Citation13 PD-L1 amplification,Citation14 recurrent genomic changes in RCC,Citation15 or in many instances the use of no biomarker at all.Citation16 A poorly proliferative, PD-L1 negative subset of RCC tumors encompassed the majority of cases in this study (n = 32/56), and the response rate of 6.5% should warrant further investigation for alternative strategies for these patients, such as combination approaches. Oncologists have not routinely used PD-L1 IHC as a complementary diagnostic for nivolumab therapy in RCC due to lack of clinical utility in large phase 3 clinical trials similar to results for other tumor types.Citation17,Citation18 Given the relatively recent approval of combination immunotherapy in RCC, we currently have no data to support that proliferation status is predictive of responses to combination immunotherapy.
While the number of moderately proliferative tumors in this study was much fewer than poorly proliferative tumors, our study suggests this subset of RCC may be more sensitive to nivolumab, independent of tumor PD-L1 status, as both moderately proliferative, PD-L1 positive and moderately proliferative, PD-L1 negative tumors had similar rates of response, of approximately 30%. Highly proliferative tumors, as defined by an unbiased assessment of tertiles in comparison to a reference population of 735 tumors of 29 different tumor types, were quite uncommon in this study and were only briefly mentioned for this reason. In our prior study of 120 NSCLC patients, highly and moderately proliferative tumors were equally common, while poorly proliferative were uncommon in NSCLC.Citation10 Differences between these studies were noted, as RCC tumors were noted to have a much lower overall rate of cell proliferation than NSCLC, but associations with response and survival were similar. In this study we show that RCC patients with poorly proliferative PD-L1 negative tumors have an extremely low rate of response to nivolumab, while patients with moderately proliferative, both PD-L1 positive and negative, constitute the majority of responders. A potential unifying concept for cell proliferation across various tumor types is that while the overall rate of proliferation is somewhat histology dependent, response is not. In other words, different tumor types will be noted for different proportions of poorly, moderately, and highly proliferative tumors, but moderate proliferation status trends toward an association with response to ICIs irrespective of this distribution of proliferation status. It is also interesting to note that tumor inflammation did not appear to have any relationship with cell proliferation in this study suggesting these are independent variables.
It is very important to note that the design of our study did not use machine learning, or other methods of artificial analysis of the data, to derive our conclusions. High, moderate, and poor rates of cell proliferation were based on an unbiased evaluation of the tertiles of a group of 56 RCC as compared to the proliferation status of a reference tumor population. At such a formative stage of development, we did not evaluate proliferation as a continuous variable for any single gene or the mean rank of 10 genes, but this is a factor that needs to be evaluated further in future studies. It is very possible that with much larger cohorts of RCC patients, cell proliferation could be used as a continuous risk score value. Certainly both of these studies suggest that cell proliferation can be used as a biomarker of response in PD-L1 negative tumors, independent of histology.
Cell proliferation, as assessed by Ki-67 positivity by IHC, has been extensively studied in RCC.Citation19–Citation41 While not all of these studies reached the same conclusion, a recent meta-analysis of the peer-reviewed literatureCitation42 of over 4,000 RCC patients with Ki-67 positivity by IHC and survival data supports the generally accepted idea that a higher rate of Ki-67 is associated with poorer survival, distant metastases, and higher stage at presentation. It should be noted that all of these studies supporting this meta-analysis were published prior to the approval of nivolumab in RCC. In our prior study of NSCLC we showed that cell proliferation by RNA-seq has a reasonable correlation with Ki-67 IHC. In this and our prior NSCLC study, we also showed that cell proliferation as measured by the mean RNA-seq value of 10 proliferation-related genes more accurately predicts response to ICIs than by single-gene assessment. This does not mean that Ki-67, or evaluation of other proliferation-related genes such as TOP2A by IHC, is not a valid assessment of response to ICIs in RCC, but these single markers of proliferation status do warrant further evaluation.
While our work was not based upon a single, well-structured clinical trial, samples were obtained from seven different institutions, and these data represent a heterogeneous, real-world clinical use of nivolumab in the metastatic clear cell RCC population. As a retrospective study across multiple institutions, there were also limitations for data collection. Risk stratification was not available from all sites and as such, was not a variable in the multivariate analysis. The exclusion of ICI-treated patients who died in less than 90 d post first dose checkpoint inhibitor did not allow for an analysis of this important group due to the lack of collection of ECOG performance score and our subsequent inability to distinguish rapid progressors from poor overall health. The number of patients in this study (n = 56) is also a major limitation, but represents a set of patients with careful clinical annotation and radiographic assessments matched with molecular data on the tumor microenvironment. Considering the limitations of this study in regard to the lack of PFS and its relationship to cell proliferation, as well as potentially underpowered subgroups, we believe that further clinical evaluation of this biomarker is warranted. However, we believe this study can create sufficient awareness of cell proliferation as a biomarker of response to ICI therapy until larger studies are performed.
In summary, we demonstrated initial findings that poorly proliferative tumors could be associated with resistance to ICI-based immunotherapy among PD-L1 negative clear cell RCC patients. Assessing the expression levels of 10 proliferation-related genes by RNA-seq stands out as a promising strategy for improving clinical decision-making for nivolumab-treated RCC patients.
Materials & methods
Patients and clinical data
Seven collaborating institutions obtained approval by their respective institutional review boards (IRBs) to submit existing de-identified specimens and associated clinical data for use in this study. A total of 56 patients were included in the study (), based on the following criteria: (1) history of advanced RCC treated with ICI; (2) availability of adequate archival formalin-fixed paraffin-embedded (FFPE) tissue collected prior to treatment with nivolumab; (3) availability of sequencing data; and (4) availability of demographic, diagnosis, follow-up and survival data. summarizes the baseline clinical characteristics of these patients (individual patient data provided in Table S1).
Figure 1. Summary of patient disposition and exploratory analysis. A total of 56 patients with advanced clear cell RCC previously treated with nivolumab were included in the study. All patients had survival data from the date of first dose of nivolumab, and were evaluable by RECIST v1.1 for response. Patients were evaluated for PD-L1 expression by IHC, cell proliferation, and a combination of these two variables.
Figure 2. Prevalence of cell proliferation and PD-L1 expression. (a) Proportion of RCC patients for cell proliferation by tertiles of poorly, moderately, and highly proliferative. (b) Proportion of RCC patients for PD-L1 expression by IHC using a tumor proportion score (TPS) value of ≥1% as a positive result, or (c) a combined positive score (CPS) value of ≥1 as a positive result. (d) Proportion of RCC tumors that are inflamed and non-inflamed. (e) Proportion of PD-L1 TPS positive or negative RCC patients for tertiles of poorly, moderately, and highly proliferative. (f) Proportion of PD-L1 CPS positive or negative RCC patients for tertiles of poorly, moderately, and highly proliferative.
Figure 3. Overall survival based upon PD-L1 IHC and cell proliferation status. (a) Overall survival upon stratification based on PD-L1 expression levels using TPS ≥ 1% as a cutoff for a positive result, or (b) CPS ≥ 1 as a cutoff for a positive result. Number at risk and p values are reported. (c) Overall survival of poorly versus moderately proliferative RCC patients. (d) Overall survival of poorly versus moderately proliferative RCC patients for PD-L1 TPS negative and positive results. Number at risk and p values are reported.
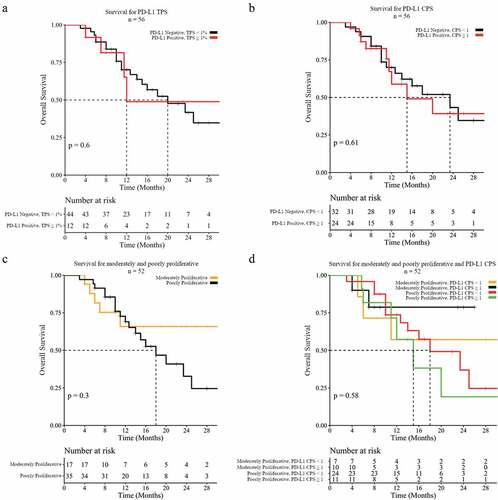
Figure 4. Objective response based upon PD-L1 IHC and cell proliferation status. (a) Objective response rate for PD-L1 expression by IHC using a tumor proportion score (TPS) value of ≥1% as a positive result, or (b) a combined positive score (CPS) value of ≥1 as a positive result. (c) Objective response rate for cell proliferation by tertiles of poorly, moderately, and highly proliferative, or (d) combined with PD-L1 TPS negative tumors.
Patients who were treated with nivolumab as approved by the FDA as of November 2015 and had follow-up and survival from first dose (n = 56) from 2015 to 2017 were included in this study. Patients who died within 90 d of first dose or who lacked sufficient follow-up time for response evaluation (less than 90 d from first dose) were excluded from analysis. All patients were evaluated for response based on RECIST v1.1 criteria and were designated as complete response (CR), partial response (PR), stable disease (SD), and progressive disease (PD). CR and PR were included in the objective response rate. The duration of response was not available for all patients and not included for final analysis.
Immunohistochemical studies
The expression of PD-L1 on the surface of cancer cells was assessed in all cases using the Dako Omnis Platform and the FDA-approved 22C3 pharmDx antibody (Agilent, Santa Clara, CA). PD-L1 levels were scored by a board-certified anatomic pathologist as per published FDA-approved guidelines,Citation17 with a tumor proportion score (TPS) in neoplastic cells of ≥1% considered positive. PD-L1 was also scored as a combined positive score (CPS)Citation18,Citation43,Citation44 evaluating both neoplastic and immune cells with a value of ≥1 considered positive, whereby the number of PD-L1 staining cells (tumor cells, lymphocytes, macrophages) divided by the total viable tumor cells is multiplied by 100.
RNA-sequencing
RNA was extracted from each sample and processed for targeted RNA-seq, as previously described.Citation11,Citation45 Gene expression was evaluated by amplicon sequencing of 394 immune transcripts on samples that met validated quality control (QC) thresholds (Table S2).Citation11 From this list of genes, we have previously identified 10 genes related to cell proliferation that supported response prediction in NSCLC,Citation8 and were utilized in this study to evaluate response in RCC.
Data analysis
Cell proliferation was evaluated for association with objective response and with PD-L1 IHC status as previously described.Citation10 Briefly, the mean expression rank values of 10 proliferation-related genes [BUB1, CCNB2, CDK1, CDKN3, FOXM1, KIAA0101, MAD2L1, MELK, MKI67 (better known as Ki-67), and TOP2A] were used as an indicator for the proliferative status of the tumor microenvironment. Tumors were stratified into poorly, moderately, and highly proliferative based on an unbiased tertile rank of expression of this gene signature as compared to a separate reference population of 735 patients with multiple tumor types. Survival analysis was performed using a log-rank test on 5-y Kaplan–Meier survival curves for PD-L1 levels assessed by IHC and the combined expression of 10 proliferation-related genes assessed by RNA-Seq. Comparison of objective response rate was performed using Chi-square test without Yate’s continuity correction. Multivariate analysis was performed by fitting a binomial logistic regression model to objective response labels and covariates such as proliferation status, PD-L1 status, histology, race, sex, and age category. Analysis of variance (ANOVA) was performed on the fitted model to study the table of deviance to determine the covariate that explains the most variance in objective response rate.
List of abbreviations
Author contributions
TZ, RG, JZ, ML, DJG, SMC, WB, KGM, KS, KD, LJT, PG, MZ, FD, RE, MP, RS, RJ, SG, and BX collected and submitted de-identified patient data with corresponding clinical cases from their respective institutions with IRB approval. TZ, SP, RK, MZ, and CM contributed to the experimental design of this analysis. TZ, RK, SP, FLL, JMC, MKN, STG, APS, BB, VG, JA, and YW prepared and analyzed patient datasets and corresponding clinical cases and were major contributors to writing and revising the manuscript. All authors read and approved the final manuscript.
Availability of data and materials
The datasets generated and/or analyzed during the current study are not publicly available due to a non-provisional patent filing covering the methods used to analyze such datasets but are available from the corresponding author upon reasonable request.
Consent for publication
Not applicable
Competing interests
MZ, PG, KD, KS, KGM, LJT, DM, JZ, ML, RS, SM, RE, MP, and RJ have no competing interests to disclose. SP, JMC, MKN, STG, APS, BB. JH, VG, JA, FLL, YW, and CM are employees of OmniSeq, Inc. (Buffalo, NY) and hold restricted stock in OmniSeq, Inc. SG, BX, WB, CM, STG, and JMC are employees of Roswell Park Comprehensive Cancer Center (Buffalo, NY), which is the majority shareholder of OmniSeq, Inc. TZ has received consulting fees from Genentech Roche, Sanofi-Aventis, Astra Zeneca, Bayer, Janssen, Pfizer, Foundation Medicine, Pharmacyclics, Bristol Myers Squibb, and Amgen, promotional service fees from Genentech Roche, Exelixis, and Sanofi Genzyme, contracted research with Janssen, Pfizer, OmniSeq, PGDx, Novartis, Merrimack, Abbvie/StemCentrx, Acerta, Merck, and Regeneron, and ownership interest in Capio Biosciences. FD has consulted for Roche Diagnostics Int, Exelixis, Eisai, and Genentech, and has participated in speakers bureaus for Genentech, Amgen, Bayer, Ipsen, and Sirtex. RK, has research funding from Incyte, Genentech, Merck Serono, Pfizer, Sequenom, Foundation Medicine, Guardant Health, Grifols, and Konica Minolta, as well as consultant fees from LOXO, X-Biotech, Actuate Therapeutics, Roche, and NeoMed, and receives speaker fees from Roche, and has equity in IDbyDNA, and CureMatch, Inc.
Disclosure of Potential Conflicts of Interest
No potential conflicts of interest were disclosed.
Ethical approval and consent to participate
De-identified specimens and data were analyzed by OmniSeq under IRB approved protocol BDR 080316 (Roswell Park Comprehensive Cancer Center, Buffalo, NY). Specimens and data were collected in accordance with institutional local IRB requirements and the Helsinki declaration, including (1) IRB approved protocols at Roswell Park Comprehensive Cancer Center, Buffalo, NY (BDR 073116), Duke Cancer Institute, Durham, North Carolina (IRB number Pro00088762), or (2) IRB exempt status based on OmniSeq IRB-exempt approved protocol BDR 080316 at Dartmouth-Hitchcock Medical Center (Lebanon, NH), Meharry Medical College (Nashville, Tennessee), and University of California, Irvine (Irvine, California), or; 3) consented prospective institutional biobanks at Fox Chase Cancer Center (Philadelphia, PA), and Oregon Health Sciences University (Portland, OR).
References
- Xu JX, Maher VE, Zhang L, Tang S, Sridhara R, Ibrahim A, Kim G, Pazdur R. FDA approval summary: nivolumab in advanced renal cell carcinoma after anti‐angiogenic therapy and exploratory predictive biomarker analysis. Oncologist. 2017;22(3):311–11. doi:10.1634/theoncologist.2016-0476.
- Escudier B, Sharma P, McDermott DF, George S, Hammers HJ, Srinivas S, Tykodi SS, Sosman JA, Procopio G, Plimack ER, et al. CheckMate 025 randomized phase 3 study: outcomes by key baseline factors and prior therapy for nivolumab versus everolimus in advanced renal cell carcinoma. Eur Urol. 2017;72(6):962–971. doi:10.1016/j.eururo.2017.02.010.
- Motzer RJ, Escudier B, McDermott DF, George S, Hammers HJ, Srinivas S, Tykodi SS, Sosman JA, Procopio G, Plimack ER, et al. Nivolumab versus everolimus in advanced renal-cell carcinoma. N Engl J Med. 2015;373(19):1803–1813. doi:10.1056/NEJMoa1510665.
- U.S. Food and Drug Administration. FDA approves nivolumab plus ipilimumab combination for intermediate or poor-risk advanced renal cell carcinoma. FDA.gov. 2018 [accessed 2019 Sep 1]. https://www.fda.gov/Drugs/InformationOnDrugs/ApprovedDrugs/ucm604685.htm.
- Motzer RJ, Tannir NM, McDermott DF, Arén Frontera O, Melichar B, Choueiri TK, Plimack ER, Barthélémy P, Porta C, George S, et al. Nivolumab plus Ipilimumab versus sunitinib in advanced renal-cell carcinoma. N Engl J Med. 2018;378(14):1277–1290. doi:10.1056/NEJMoa1712126.
- Motzer RJ, Penkov K, Haanen J, Rini B, Albiges L, Campbell MT, Venugopal B, Kollmannsberger C, Negrier S, Uemura M, et al. Avelumab plus axitinib versus sunitinib for advanced renal-cell carcinoma. N Engl J Med. 2019;380(12):1103–1115. doi:10.1056/NEJMoa1816047.
- Rini BI, Plimack ER, Stus V, Gafanov R, Hawkins R, Nosov D, Pouliot F, Alekseev B, Soulières D, Melichar B, et al. Pembrolizumab plus axitinib versus sunitinib for advanced renal-cell carcinoma. N Engl J Med. 2019;380(12):1116–1127. doi:10.1056/NEJMoa1816714.
- McDermott DF, Lee J-L, Szczylik C, Donskov F, Malik J, Alekseev BY, Larkin JMG, Matveev VB, Gafanov RA, Tomczak P, et al. Pembrolizumab monotherapy as first-line therapy in advanced clear cell renal cell carcinoma (accRCC): results from cohort A of KEYNOTE-427. J Clin Oncol. 2018;36(15_suppl):4500. doi:10.1200/JCO.2018.36.15_suppl.4500.
- Sul J, Blumenthal GM, Jiang X, He K, Keegan P, Pazdur R. FDA approval summary: pembrolizumab for the treatment of patients with metastatic non-small cell lung cancer whose tumors express programmed death-ligand 1. Oncologist. 2016;21(5):643–650. doi:10.1634/theoncologist.2015-0498.
- Pabla S, Conroy JM, Nesline MK, Glenn ST, Papanicolau-Sengos A, Burgher B, Hagen J, Giamo V, Andreas J, Lenzo FL, et al. Proliferative potential and resistance to immune checkpoint blockade in lung cancer patients. J Immunother Cancer. 2019;7(1):27. doi:10.1186/s40425-019-0506-3.
- Conroy JM, Pabla S, Glenn ST, Burgher B, Nesline M, Papanicolau-Sengos A, Andreas J, Giamo V, Lenzo FL, Hyland FCL, et al. Analytical validation of a next-generation sequencing assay to monitor immune responses in solid tumors. J Mol Diagnostics. 2018;20(1):95–109. doi:10.1016/j.jmoldx.2017.10.001.
- Patel SP, Kurzrock R. PD-L1 expression as a predictive biomarker in cancer immunotherapy. Mol Cancer Ther. 2015;14(4):847–856. doi:10.1158/1535-7163.MCT-14-0983.
- Goodman AM, Kato S, Bazhenova L, Patel SP, Frampton GM, Miller V, Stephens PJ, Daniels GA, Kurzrock R. Tumor mutational burden as an independent predictor of response to immunotherapy in diverse cancers. Mol Cancer Ther. 2017;16(11):2598–2608. doi:10.1158/1535-7163.MCT-17-0386.
- Goodman AM, Piccioni D, Kato S, Boichard A, Wang H, Frampton G. Prevalence of PDL1 amplification and preliminary response to immune checkpoint blockade in solid tumors. JAMA Oncol. 2018:0658. doi:10.1001/jamaoncol.2018.1701.
- Randall JM, Millard F, Kurzrock R. Molecular aberrations, targeted therapy, and renal cell carcinoma: current state-of-the-art. Cancer Metastasis Rev. 2014;33(4):1109–1124. doi:10.1007/s10555-014-9533-1.
- Khagi Y, Kurzrock R, Patel SP. Next generation predictive biomarkers for immune checkpoint inhibition. Cancer Metastasis Rev. 2017;36(1):179–190. doi:10.1007/s10555-016-9652-y.
- Büttner R, Gosney JR, Skov BG, Adam J, Motoi N, Bloom KJ, Dietel M, Longshore JW, López-Ríos F, Penault-Llorca F, et al. Programmed death-ligand 1 immunohistochemistry testing: a review of analytical assays and clinical implementation in non–small-cell lung cancer. J Clin Oncol. 2017;35(34):3867–3876. doi:10.1200/JCO.2017.74.7642.
- Kulangara K, Zhang N, Corigliano E, Guerrero L, Waldroup S, Jaiswal D. Clinical utility of the combined positive score for programmed death ligand-1 expression and the approval of pembrolizumab for treatment of gastric cancer. Arch Pathol Lab Med. 2018:arpa.2018–0043-OA. doi:10.5858/arpa.2018-0043-OA.
- Parker AS, Leibovich BC, Lohse CM, Sheinin Y, Kuntz SM, Eckel-Passow JE, Blute ML, Kwon ED. Development and evaluation of BioScore. Cancer. 2009;115(10):2092–2103. doi:10.1002/cncr.24263.
- Zubac DP, Bostad L, Kihl B, Seidal T, Wentzel-Larsen T, Haukaas SA. The expression of thrombospondin-1 and p53 in clear cell renal cell carcinoma: its relationship to angiogenesis, cell proliferation and cancer specific survival. J Urol. 2009;182(5):2144–2149. doi:10.1016/j.juro.2009.07.015.
- Gontero P, Ceratti G, Guglielmetti S, Andorno A, Terrone C, Bonvini D, Faggiano F, Tizzani A, Frea B, Valente G, et al. Prognostic factors in a prospective series of papillary renal cell carcinoma. BJU International. 2008;102(6):697–702. doi:10.1111/j.1464-410X.2008.07756.x.
- Weber T, Meinhardt M, Zastrow S, Wienke A, Fuessel S, Wirth MP. Immunohistochemical analysis of prognostic protein markers for primary localized clear cell renal cell carcinoma. Cancer Invest. 2013;31(1):51–59. doi:10.3109/07357907.2012.749267.
- Toma MI, Weber T, Meinhardt M, Zastrow S, Grimm M-O, Füssel S, Wirth MP, Baretton GB. Expression of the forkhead transcription factor FOXP1 is associated with tumor grade and Ki67 expression in clear cell renal cell carcinoma. Cancer Invest. 2011;29(2):123–129. doi:10.3109/07357907.2010.535059.
- Teng J, Gao Y, Chen M, Wang K, Cui X, Liu Y, Xu D. Prognostic value of clinical and pathological factors for surgically treated localized clear cell renal cell carcinoma. Chin Med J (Engl). 2014;127(9):1640–1644. doi:10.3760/cma.j..0366-6999.20132831.
- KIM H, SELIGSON D, LIU X, JANZEN N, BUI M, YU H, SHI T, BELLDEGRUN AS, HORVATH S, FIGLIN RA, et al. Using tumor markers to predict the survival of patients with metastatic renal cell carcinoma. J Urol. 2005;173(5):1496–1501. doi:10.1097/01.ju.0000154351.37249.f0.
- Yildiz E, Gokce G, Kilicarslan H, Ayan S, Goze OF, Gultekin EY. Prognostic value of the expression of Ki-67, CD44 and vascular endothelial growth factor, and microvessel invasion, in renal cell carcinoma. BJU Int. 2004;93(7):1087–1093. doi:10.1111/j.1464-410X.2004.04786.x.
- Lehmann J, Retz M, Nürnberg N, Schnöckel U, Raffenberg U, Krams M, Kellner U, Siemer S, Weichert-Jacobsen K, Stöckle M, et al. The superior prognostic value of humoral factors compared with molecular proliferation markers in renal cell carcinoma. Cancer. 2004;101(7):1552–1562. doi:10.1002/cncr.20549.
- Kim HL, Seligson D, Liu X, Janzen N, Bui MHT, Yu H. Using protein expressions to predict survival in clear cell renal carcinoma. Clin Cancer Res. 2004;10(16):5464–5471. doi:10.1158/1078-0432.CCR-04-0488.
- Bui MHT, VISAPAA H, SELIGSON D, KIM H, HAN K-R, HUANG Y, HORVATH S, STANBRIDGE EJ, PALOTIE A, FIGLIN RA, et al. Prognostic value of carbonic anhydrase ix and ki67 as predictors of survival for renal clear cell carcinoma. J Urol. 2004;171(6 Part 1):2461–2466. doi:10.1097/01.ju.0000116444.08690.e2.
- Cheville JC, Zincke H, Lohse CM, Sebo TJ, Riehle D, Weaver AL, Blute ML. pT1 clear cell renal cell carcinoma. Cancer. 2002;94(8):2180–2184. doi:10.1002/cncr.10433.
- Kankuri-Tammilehto MK, Söderström K-O, Pelliniemi -T-T, Vahlberg T, Pyrhönen SO, Salminen EK. Prognostic evaluation of COX-2 expression in renal cell carcinoma. Anticancer Res. 2010;30(7):3023–3030. http://www.ncbi.nlm.nih.gov/pubmed/20683050
- Yuba H, Okamura K, Ono Y, Ohshima S. Growth fractions of human renal cell carcinoma defined by monoclonal antibody Ki-67. Predictive values for prognosis. International Journal of Urology. 2001;8(11):609–614. doi:10.1046/j.1442-2042.2001.00379.x.
- Olumi AF, Weidner N, Presti JC. p53 immunoreactivity correlates with Ki-67 and bcl-2 expression in renal cell carcinoma. Urol Oncol Semin Orig Investig. 2001;6(2):63–67. doi:10.1016/S1078-1439(00)00109-5.
- Rioux-Leclercq N, Turlin B, Bansard J-Y, Patard -J-J, Manunta A, Moulinoux J-P, Guillé F, Ramée M-P, Lobel B. Value of immunohistochemical Ki-67 and p53 determinations as predictive factors of outcome in renal cell carcinoma. Urology. 2000;55(4):501–505. doi:10.1016/S0090-4295(99)00550-6.
- Gayed BA, Youssef RF, Bagrodia A, Darwish OM, Kapur P, Sagalowsky A, Lotan Y, Margulis V. Ki67 is an independent predictor of oncological outcomes in patients with localized clear-cell renal cell carcinoma. BJU Int. 2014;113(4):668–673. doi:10.1111/bju.12263.
- Rautiola J, Lampinen A, Mirtti T, Ristimäki A, Joensuu H, Bono P, Saharinen P. Association of angiopoietin-2 and Ki-67 expression with vascular density and sunitinib response in metastatic renal cell carcinoma. PLoS One. 2016;11(4):e0153745. doi:10.1371/journal.pone.0153745.
- Virman JP, Bono P, Luukkaala TH, Sunela KL, Kujala PM, Kellokumpu-Lehtinen P-LI. Combined angiogenesis and proliferation markers’ expressions as long-term prognostic factors in renal cell cancer. Clin Genitourin Cancer. 2016;14(4):e283–9. doi:10.1016/j.clgc.2015.12.014.
- Kankuri M, Söderström K-O, T-T P, Vahlberg T, Pyrhönen S, Salminen E. The association of immunoreactive p53 and Ki-67 with T-stage, grade, occurrence of metastases and survival in renal cell carcinoma. Anticancer Res. 2006;26(5B):3825–3833. http://www.ncbi.nlm.nih.gov/pubmed/17094408
- Kramer BA, Gao X, Davis M, Hall M, Holzbeierlein J, Tawfik O. Prognostic significance of ploidy, MIB-1 proliferation marker, and p53 in renal cell carcinoma. J Am Coll Surg. 2005;201(4):565–570. doi:10.1016/j.jamcollsurg.2005.04.018.
- Phuoc NB, Ehara H, Gotoh T, Nakano M, Yokoi S, Deguchi T, Hirose Y. Immunohistochemical analysis with multiple antibodies in search of prognostic markers for clear cell renal cell carcinoma. Urology. 2007;69(5):843–848. doi:10.1016/j.urology.2007.01.069.
- Tollefson MK, Thompson RH, Sheinin Y, Lohse CM, Cheville JC, Leibovich BC, Kwon ED. Ki-67 and coagulative tumor necrosis are independent predictors of poor outcome for patients with clear cell renal cell carcinoma and not surrogates for each other. Cancer. 2007;110(4):783–790. doi:10.1002/cncr.22840.
- Wang Z, Xie H, Guo L, Cai Q, Shang Z, Jiang N, Niu Y. Prognostic and clinicopathological value of Ki-67/MIB-1 expression in renal cell carcinoma: a meta-analysis based on 4579 individuals. Cancer Manag Res. 2017;9:679–689. doi:10.2147/CMAR.S141670.
- Zhu J, Armstrong AJ, Friedlander TW, Kim W, Pal SK, George DJ, Zhang T. Biomarkers of immunotherapy in urothelial and renal cell carcinoma: PD-L1, tumor mutational burden, and beyond. J Immunother Cancer. 2018;6(1):4. doi:10.1186/s40425-018-0314-1.
- Dako. PD-L1 IHC 22C3 pharmDx Gastric or Gastroesophageal Junction (GEJ) Adenocarcinoma. 1–2.
- Paluch BE, Glenn ST, Conroy JM, Papanicolau-Sengos A, Bshara W, Omilian AR, Brese E, Nesline M, Burgher B, Andreas J, et al. Robust detection of immune transcripts in FFPE samples using targeted RNA sequencing. Oncotarget. 2017;8(2):1–3. doi:10.18632/oncotarget.13691.
Supplemental Material
Download ()Acknowledgments
The following individuals participated with the collection of biospecimens and associated clinical data: Larson Hsu (Roswell Park Comprehensive Cancer Center), Ryan Winters (Biosample Repository Facility at Fox Chase Cancer Center), Rosemary Makar and Amy Fricke (Oregon Health & Science University Knight BioLibrary).
Supplementary material
Supplemental data for this article can be accessed on the publisher’s website.