
ABSTRACT
The ‘cancer cell fusion’ theory is controversial due to the lack of methods available to identify hybrid cells and to follow the phenomenon in patients. However, it seems to be one of the best explanations for both the origin and metastasis of primary tumors. Herein, we co-cultured lung cancer stem cells with human monocytes and analyzed the dynamics and properties of tumor-hybrid cells (THC), as well as the molecular mechanisms beneath this fusion process by several techniques: electron-microscopy, karyotyping, CRISPR-Cas9, RNA-seq, immunostaining, signaling blockage, among others. Moreover, mice models were assessed for in vivo characterization of hybrids colonization and invasiveness. Then, the presence of THCs in bloodstream and samples from primary and metastatic lesions were detected by FACS and immunofluorescence protocols, and their correlations with TNM stages established. Our data indicate that the generation of THCs depends on the expression of CD36 on tumor stem cells and the oxidative state and polarization of monocytes, the latter being strongly influenced by microenvironmental fluctuations. Highly oxidized M2-like monocytes show the strongest affinity to fuse with tumor stem cells. THCs are able to proliferate, colonize and invade organs. THC-specific cell surface signature CD36+CD14+PANK+ allows identifying them in matched primary tumor tissues and metastases as well as in bloodstream from patients with lung cancer, thus functioning as a biomarker. THCs levels in circulation correlate with TNM classification. Our results suggest that THCs are involved in both origin and spread of metastatic cells. Furthermore, they might set the bases for future therapies to avoid or eradicate lung cancer metastasis.
Introduction
According to The American Cancer Society, lung cancer is the leading cause of cancer-associated deaths.Citation1 Lung cancer is classified into small-cell (SCLC) and non-small-cell lung carcinoma (NSCLC). The latter accounts for more than 85% of cases and includes squamous-cell carcinoma, adenocarcinoma and large-cell carcinoma. Upon early detection, positive outcomes have improved during the last two decades using combinations of platinum-based drugs with radiotherapies, and an increase in life expectancy of more than 20 years has been achieved. However, a substantial proportion of patients – more than 65% – show tumor spread already at the time of diagnosis, and 40% of NSCLC patients have distant metastases at presentation,Citation2 which makes the search for efficient personalized treatments difficult.
Following the ‘seed and soil’ theory, there exists an extended consensus in describing metastasis as a process by which lost tumor cells, mainly known as circulating tumor cells (CTCs)Citation3,Citation4 travel through the bloodstream and the lymphatic system, arrive at new “specific organs to their primary tumour,” settle, and either colonize it or remain in a quiescent state, known as disseminated tumor cells,Citation5,Citation6 until several other still unknown stimuli reactivate them to restart colonization. Though this theory has been deemed reliable in explaining the spread of cancer,Citation7 it fails when accounting for explanations on metastatic cells origin. Viz, the description sounds insufficient due to the presence of a high number of “obstacles” and checkpoints that cancer cells released from tumors would never be able to pass through on their own. Published data in the context of breast cancer indicate that CTCs can be reflective of the bulk of primary tumor biomass, but do not seed to generate metastases;Citation8 moreover, to fully explain recent proof-of-concept of human-CTCs transmigration through mice blood-brain-barrier, researchers have postulated the active participation of microglia.Citation9 In fact, most current drugs and clinical strategies designed to prevent metastasis have failed. Therefore, the grounds on which they are based might be incorrect. Probably, the only likely cells with required properties for this process, which include migration and evasion of immune defense, are immune system cells.
In this regard, the hypothesis that potentially metastatic cells are originated by leukocyte-tumor cell fusion has been taken into consideration during some intervals throughout the history of cancer research and then successively abandoned.Citation10-Citation12 Most conclusive data reported are from several patients who received a bone marrow transplant: all had metastatic cells with DNA coming from the cancer-free donor.Citation12–Citation16 In addition to this clinical evidence, other authors have reported spontaneous hybridization between cells derived from bone marrow sarcomas,Citation17,Citation18 lymphoma,Citation19 melanoma,Citation20 breast cancerCitation21,Citation22 and insulinoma,Citation23 availing the putative role for immune cells in this phenomenon. Apparently, myeloid cells are better equipped than tumor cells to mediate metastasis. After fused with tumor cells, resulting hybrids potentially acquire the information required for “tumour behaviour.”Citation24
Our data herein supports the notion that metastasis might be due to the fusion of myeloid cells with tumor stem cells, and shed light on the molecular mechanisms beneath this fusion, positioning CD36 scavenger-receptor as a key molecule on this process. A minor fraction of tumor cells with stemness hallmarks can specifically fuse with macrophages, even in a higher proportion than with other cancer cells. In this way, it is feasible for tumor cells to reach the bloodstream without any obstacles and to pass through checkpoints. Both figuratively and literally, it is a type of “Trojan horse” that, with a defense system appearance, brings tumor cells to remote sites to colonize other specific organs, in the form of new hybrid cellular entities, which we have therefore coined as tumor-hybrid cells (THCs), or Trojan horse cells.
Materials and methods
Human samples
All participants provided written informed consent in accordance with ethical guidelines of the 1975 Declaration of Helsinki and the Committee for Human Subjects of La Paz University Hospital (HULP: PI-3521) and the Clinical Research Ethics Committees of the Hospitals of Madrid (17.10.1125-GHM). Participants were grouped into healthy donors, septic or lung cancer patients. Buffy-coats from healthy anonymous donors were supplied by the Transfusion Center of the Community of Madrid.
Circulating nucleated cells were isolated after red blood cell lysis (BD Biosciences) of whole blood samples. PBMCs and plasma from buffy-coats were obtained by Ficoll-Plus gradient protocol.Citation25
Mice
Animals were properly housed in temperature- and light-regulated rooms with food and water ad libitum. All experimental designs followed the guidelines and were approved by the Ethics Committee for Animal Research from La Paz University Hospital (CSIC: 733/2018). Humane end-point criteria: suddenly required euthanasia prescribed due to impoverished physical conditions.
Cell lines
Human H460 and A549 NSCLC lines were purchased from ATCC and cultured in DMEM (Gibco) with 10% FBS, at 37°C in a humidified atmosphere with 5% CO2. Puromycin-dependent (2.5 µg/mL) H460GFP line was developed.Citation26 Cancer stem cells (CSCs) from H460/A549 were obtained by culture in non-treated Costar plates with selective DMEM/F-12 (Gibco, 1:1) with 2 mmol/L L-glutamine, 5 mmol/L HEPES, 0.4% bovine serum albumin, N-2 supplement (Gibco), 20 ng/mL of EFG (PeproTech) and 10 ng/mL bFGF (PeproTech).
A549 CD36-KO/wt pool, CRISPR-engineered for targeting the fourth exon of CD36, was purchased from Synthego. Clonal expansions were developed and tested for CD36 expression by PCR-Sanger sequencing (gDNA level), RT-qPCR (mRNA level) and western blot (protein level; sc-70644).
All reagents were endotoxin-free, as assayed with Limulus amoebocyte lysate test (Cambrex).
Genomic DNA isolation/amplification
Invitrogen kit (K1820-02) was used after scrapping seeded cells. CD36 gene-targetedd region surrounding exon 4 was amplified with 5ʹ-GCC TTA AAA TCA ACA GTC GTG TCT-3ʹ (forward) and 5ʹ-AGA TTA GGA TTC TAT ACA GAC AGG AAA A-3ʹ (reverse) primers. A 540 bp gDNA was sequenced by Sanger procedure using an ABIPrism3.1 sequencer.
Reverse-transcription qPCR
Total RNA was purified by using the High-Pure RNA isolation kit (Roche). Gene expression levels were assayed by using specific primers shown in Supplemental Table 1.
Western blot assays
Aliquots of 40 μg of protein (Bradford) from cells or vesicles lysates were electrophoresed on 10% SDS-PAGE gels, and proteins were transferred to 0.2 µm polyvinylidene fluoride membranes (Trans-Blot® Turbo™ Midi PVDF Transfer Packs; BIORAD-17041577). Then, primary and secondary antibodies incubations were performed, and the signal was detected by an Enhanced Chemiluminescent detection kit (BIORAD-17050622), followed by autoradiography. Specific primary antibodies for each experiment are mentioned in corresponding sections.
Flow cytometry
Fluorescence-activated cell sorting (FACS) was performed using either BD Biosciences FACSCalibur/FACSCelesta/FACSCanto 3 L or Beckman-Coulter’s Navios flow cytometers and raw data analyzed with FlowJo software (Tree Star). Sorting and cell collection were performed using either Synergy 2 L (Sony) or FACSAria ll (BD Biosciences).
In vitro fusion assay protocol
Unless otherwise indicated, 1.8x10⁵/well PBMC-isolated monocytes from buffy-coats were routinely seeded (d0) on tissue culture-treated Costar 24-well plates and allowed to adhere for 1 h (RPMI), PBS-washed and cultured (RPMI+10%FBS) for 16 h before adding CSCs (0.2x10⁵ cells/well), thus starting d1 of experimental fusion. Cells were recovered at d5 by gentle tip-scraping, and measurement of surface markers expression by FACS was performed. Fused populations were assessed by gating CD14+GFP+ or CD14+PANK+ (PANK: Pan-cytokeratins; Miltenyi 130–080-101) double-positive cells.
In vivo invasiveness and migration assays
Twenty-four nu−/nu− female mice (Charles River, France) were i.v. inoculated with either 0.5 × 10⁶ H460GFP-CSC or CD14+GFP+ cells, and euthanized after 3, 6 or up to 28 weeks. Eighteen nu−/nu− female mice were inoculated with either CD36+CD14+PANK+ or CD36−CD14+PANK+ cells sorted from lung cancer patients’ PBMCs, and let developing for up to 28 weeks.
Lungs, ganglia and spleens were extracted, and further IHC analysis for THCs was performed with anti-human CD14 (ab45870), PANK (ab9377) and CD36 (Miltenyi 130–108-018). Spleens were stained with haematoxylin/eosin and morphology injury average-scored (0–3), after pathologists’ evaluation (ranging 0–3) of parameters:Citation27 i) minimized lymphoid follicles, ii) diffuse white pulp and distorted lymphoid architecture, iii) granular leukocytes in between lymphocytes in lymphoid follicles and iv) presence of giant macrophages. Thyroid transcription factor-1 expression was performed by IHC (TTF-1, DAKO-IR056) and percentage of the total area represented by dark-brown dots, calculated with ImageJ.
On the other hand, breast cancer 4T1 cells (105 in 50 µL PBS each) or PBS alone as control were injected into the right 4th inguinal mammary gland of female BALB/c mice. Animals were monitored daily for tumor evolution. After 5 weeks, blood was collected from the submandibular vein and mice were sacrificed. Blood (100 µL) was treated twice with Red Blood Cell Lysis Buffer (Sigma) for 5 minutes at RT. Remaining cells were stained in cold FACS buffer (PBS, 3% FBS, 1 mM EDTA) with a previous incubation with purified anti-FcɣRIII/II (2.4G2, TONBO Bioscience) to block Fc-receptors. The cocktail of antibodies used included: α-CD45-PerPCy5.5, α-Ly6 C-PE, α-Ly6 G-BV450, α-CD11b-PECy7 (all from BD Biosciences) and α-Cytokeratin-8-Alexa Fluor 647 (Abcam). In all stains, dead cells were excluded by Hoechst 33258 (Invitrogen, Carlsbad, CA) incorporation, together with neutrophils (Ly6 G+ cells) to avoid their autofluorescence.
Measurement of circulating cells in human peripheral blood
BD FACS lysing solution (1 mL of 1X solution; BD Biosciences, Cat No. 349202) was added to 500 µL of peripheral blood from lung cancer, aneurysm and septic patients, as well as controls, to lysate erythrocytes and preserve leukocytes. Tubes were thoroughly shaken at RT for 30 minutes, before washing twice with PBS. Resulting fixed leukocytes were assessed by FACS with the following human antibodies: CD14-PE, CD36-PerCP, CD45-APC-Cy7, EpCAM-APC and PANK-FITC. THCs (%) were gated as the CD14+ population expressing CD36 and PANK, then CD36+CD14+PANK+. This population was further assessed for the expression of CD45 and EpCAM, in order to compare them to CTCs (CD45−EpCAM+ population).
Organs and tumors immunohistochemistry
Tissues were fixed in 4% paraformaldehyde (SIGMA-P6148), embedded in OCT and cut into 10 μm sections with a Leica RM2255 microtome (Leica Biosystems). The antibodies-stained sections were analyzed by confocal scanning laser microscopy, using a Leica SPE laser-scanning microscope (Leica Biosystems), and images quantified with ImageJ.
Tissue array immunohistochemistry
Two lung cancer tissue microarrays (TMAs) were purchased from Biomax (LC817a) and Abcam (ab178194). The former comprises primary tumor and lymph node metastasis whereas the latter is a tissue array of progressive lung cancer changes. They were stained for CD36 (Abcam, ab23680), CD14 (Abcam, ab133335) and PANK, and scored as negative (-) or positive (+) for CD36 or CD36/CD14/PANK by two researchers in a blind manner.
Vital colorant assays
DID/DIO protocol (Vybrant Multicolor Cell-Labeling kit, Fisher) experiments were conducted with human DID-monocytes faced to DIO-H460 CSCs, and DIO-H460-CSCs/DID-H460 cells competing for monocytes. Fluorescence emission of DID (665 nm, red) and DIO (501 nm, green) was assayed either by FACS or fluorescence microscopy.
Nuclei fusion assessment
Monocytes (1.8x10⁵) from PBMCs were incubated with 10 nM EdU (Invitrogen-C10640) for 24 h, whereas H460GFP-CSCs were incubated with 0.36 pM DAPI (ROCHE-10236276001) for 30 min, before co-cultures. After 5 days, cells were fixed in 3.7% formaldehyde (SIGMA-252549) and secondary Alexa-Fluor647 antibody was added (EdU, Invitrogen-C10640) and evaluated by confocal microscopy.
In vitro migration assay
Corning transwell chambers (8 µm, Sigma) were embedded or not with collagen (0.024% in RPMI w/o FBS). Co-cultures, monocytes and CSCs were scraped on d5 into RPMI (w/o FBS) and seeded (105 cells) on the top compartment of transwell chambers; the bottom filled with 700 µL RPMI+10% FBS. After 48 h, top and bottom contents were recovered and cell migration (M) assessed as the percentage of each cell type in the bottom (B) with respect to the total amount seeded in the top compartment (A), according to: M = [B/(A + B)]x100. A control of 1000 inert beads (Reagent D from Mice CBA, BD Biosciences) was used to fit acquisition stop of sample collection during FACS.
In vitro proliferation assays
PBMCs (8.1x10⁶) and H460-CSCs (0.9x10⁶) were co-cultured for 5 days. After labeled, PANK+ tumor cells, CD14+ monocytes and PANK+CD14+ hybrids were sorted and a carboxyfluorescein succinimidyl ester (CFSE) proliferation assessment protocol was performed for each by FACS after 5 days.
Previous sorted cells (103 per well) were also co-cultured with CFSE-labeled PBMCs (2x10⁴ per well) isolated from HVs. Immune phenotyping of T-cells was analyzed by FACS after 48 h; cytokines levels on supernatants were measured by cytometric bead array (BD CBA Human Th1/Th2/Th17 Cytokine Kit™, BD Biosciences). After 5 days, T-cell proliferation induced by pokeweed mitogen (0.5 µg/mL) was also analyzed by FACS, in the presence/absence of 1 µg/mL α-CD36 (Abcam, ab23680), α-CD39 (Biolgend-328202), α-CD73 (Biolgend-344002), α-PD-1 (Bristol-Myers Squibb) and 200 ng/mL α-SigleC5 (ThermoFisher PA5-47058) human antibodies.
Automated cell clustering was performed with the viSNE algorithm available at Cytobank (www.cytobank.org).Citation28
Single hybrid cells growth monitoring
PANK+CD14+ labeled hybrid cells were sorted and each single cell seeded on cRPMI-filled wells of an ultra-low attachment (ULA) 96-wells plate. They were let to grow whilst periodic serial photos (Leica CTR6000) were taken throughout 20 days to register cells development. Eventually, in vitro tumors were disaggregated by thorough pipetting, and FACS analyzed for the expression of phenotyping epitopes with the following human antibodies: CD14-BUV395, CD45-PE-CF594, CD86-BUV737, HLA-DR-BV711, CD44-BV786, CD36-PerCP, PD-L1-BV421, EpCAM-BV605 and PANK-PE.
Cell imaging video-lapses
Monocytes (2x10⁴ cells/well) were labeled with DID and cultured on a 1μ-Slide 8 Well ibiTreat plate (ibidi, Germany). H460-CSCs (2x10³ cells) were labeled with DIO, added to DID-monocytes, and plates placed on a Cell Observer® Z1 system (ZEISS) with standard culture conditions. Fifteen positions were selected randomly to take photos at an initial 5 min, and then in a 15 min interval during 72 h. Images were qualitatively analyzed using AxioVision LE 4.8.2.0 software (ZEISS).
A quantitative analysis of populations’ dynamics and fusion kinetics was performed by seeding 1.8 × 10⁵ DID-monocytes from three HVs and 2 × 10⁴ DIO-H460-CSC cells, in a treated 24-well clear-film-bottom black plate (Eppendorf). Photos were taken every 20 min for the first 24 h, and every 90 min after to complete 120 h of video recording. Three fields per well were counted for red (DID+-monocytes)/green (DIO+-tumor cells)/tangerine (DID+DIO+-hybrids) dots with ImageJ.
In vitro myeloid-tumor cells fusion kinetics
Monocytes were grown for 15 days in order to check their developing to macrophages by specific antibodies: CD14-BUV395 (BD-563561), CD15-BV421 (BD-740086) and CD36-PerCP (Miltenyi-130 095 480). Simultaneously, the fusion event was followed-up with the above markers during the development process of both monocytes (d0 to d5) and macrophages (d10 to d15).
Neutrophils were isolated from healthy donors using dextran protocol,Citation25 and their development and fusion affinity were followed-up for 5 days by specific markers: CD14-BUV395, CD15-BV421, CD16-BV480 (BD-566108), CD16b-PE (BD-550868), CD36-PerCP and CD66b-PE (Miltenyi-130 104 396).
NK cell expansion, activation and cytolytic activity
K562mbIL15-41BBL feeder cell line (107 cells) was co-cultured with 1.5 × 10⁷ PBMCs for 2 weeks in stem cell growth medium (Cellgenix), with 10% human male AB serum (Sigma) to obtain highly purified NK cells. IL-2 (10 IU/mL) was added for the first week and 100 IU/mL thereafter. NK cells were then exposed to both sorted GFP+ and CD14+GFP+ cellular entities. After cell permeabilization (Cytofix/Cytoperm kit, BD Biosciences), CD3−CD56+CD16+ NKs perforin generation was detected with specific Perforin-FITC (Miltenyi-130 096 668). Cytotoxicity was monitored with conventional 2 h Europium lysis-terpyridine dicarboxylic acid (TDA) release assay (Perkin-Elmer). NK (effector) cells loaded TDA-labeled (target) H460-CSC-GFP+ and CD14+GFP+ hybrid cells, at effector-to-target cell ratios of 50:1, 25:1, 12.5:1 and 6.25:1. Fluorescent measures (ex: 340 nm; em: 612 nm) were assessed in a BioTek Epoch Microplate Spectrophotometer.
Transmission electron microscopy (TEM)
After co-cultures sorting, cells were fixed with 1.5% glutaraldehyde in 0.1 M cacodylate buffer (pH 7.4) for 1 h at 4°C and then treated with 1% osmium tetroxide (in 0.1 M cacodylate buffer) and embedded in epoxy resin. Ultrathin sections were stained with uranyl-lead and examined in a JEOL JEM 1010 transmission electron microscope (JEOL USA, Inc., MA, USA).
RNA-Seq protocol and analysis
Stranded mRNA RNA-Seq libraries were prepared by Vertis Biotech (Freising-Weihenstephan, Germany) and sequenced on a NextSeq500 device (Illumina) with 75 bp read-length (single end). Base calling and demultiplexing were performed with RTA Version 2.4.11 and bcl2fastq Version 2.18.0.2, and reads were mapped using the CLC genomics workbench with standard settings and the GRChr38 human reference annotation. The PCA analysis was carried out using the R-script prcomp (stats) and the rgl package based on row Z-scores of all mRNAs with a mean abundance ≥RPKM 1 in at least one cell type. Differentially expressed genes were identified using DESeq2 in R (padj ≤0.001). Heatmaps were generated using JAVATreeView. Enriched Kyoto Encyclopedia of Genes and Genomes pathways (≥10 genes mapped per pathway) were identified using ConsensusPathDB with the gene set “over-representation” and “induced network modules” functions. RNA-Seq reads have been deposited in the NCBI-GEO (GSE102512).
Karyotype analysis
The three cell types (CD14+ monocytes, GFP+ H460GFP-CSCs and CD14+GFP+ hybrids) were cultured according to standard techniques on culture slides and harvested. GTG banding was used for chromosome analysis. Images were analyzed on a Cytovision karyotyping system (Leica).
In vitro modulation of CD36 expression
Highly volatile 4HNE solution (64 mM, Merck) was quickly inoculated from −80ºC storage into cRPMI-diluted CSCs, and added to seeded monocytes at final concentrations of 10, 20 and 40 µM, in order to chemically stimulate CD36 expression via NRF2 enhancement in both cell types.
Commercial pUNO1-hCD36 (Nucliber) plasmid, hereafter pCD36, was used to perform independent transfections of each cell type. CSCs (7.5x10⁵ per well) were transfected on d−1 with Lipofectamine-LTX (Invitrogen), hereafter Lipo, at a pCD36:Lipo ratio of 5 µg:12.5 µL diluted in 1 mL Opti-MEM (Gibco) and added to monocytes after 16 h. We assayed two different approaches to overexpress CD36 in monocytes: a) transfection (d0) at a pCD36:Lipo ratio of 0.5 µg:1.25 µL diluted in 100 µL Opti-MEM per well; b) using Transfectosome® (Nanovex Biotechnologies SL, Spain) at a pCD36:Transfectosome ratio of 0.2 µg:0.6 µL diluted in Opti-MEM per well. A549 wt-CSCs and clone B10-CSCs, were also transfected with pCD36 following transfectosome protocol.
CD36 downregulation was evaluated with specific human CD36 siRNAs: (sense) CACUAUCAGUUGGAACAGAtt, (anti-sense) UCUGUUCCAACUGAUAGUGaa; s2647 and 105938 from Ambion and α-CD36 antibody (ab133625), in HiPerFect reagent (Qiagen), hereafter HFT. CSCs (7.5x10⁵ per well) were transfected with a (siRNA1+ siRNA2):HFT ratio of (2.5 µg+2.5 µg):12 µL. For monocytes, a (siRNA1+ siRNA2):HFT ratio of (0.5 µg+0.5 µg):6 µL diluted in cRPMI per well was used.
In vitro modulation of microenvironment and oxidation/polarization status
We used C11-BODIPY581/591 (ThermoFisher-D3861) 1 µM BODIPY (DMSO), hereafter called BODIPY, to measure the oxidative status of monocytes’ membranes. For FACS analysis, samples were excited using a 488 nm laser, and fluorescence emission was collected with 530 nm (FL1) and 585 nm (FL2) filters. An FL1/FL2 fluorescence quotient for oxidized/reduced BODIPY ratio was calculated.
Effects of oxLDL (ThermoFisher-L34357) and lactate (Sigma-07096) on both sole monocytes, and after they had been mixed with CSCs, were evaluated for 5 days. oxLDL was added on d0 at 50 µg/mL. Lactate (24 mM) was added either at d0 or for the last 16 h before the end of the experiment (d5). CD163 (BD-556 018) was tested for M2-polarization status.
Standardized monocyte polarization effects on fusion events were assayed with IFN-γ (1 ng/106 cells) and IL-4 (40 ng/106 cells) 48 h prior to facing CSCs (d−2) to achieve, respectively, M1 and M2 phenotypes.
We next assessed CD36 on H460GFP–CSCs at 50 µg/mL native LDL (ThermoFisher-L3486), in parallel with previously studied oxLDL, and anti-oxidative conditions (Tocopherol, 50 mM, SIGMA-T3251), by using both H460GFP-CSCwt and H460GFP-CSC silenced with siRNA-CD36. BODIPY oxidation and CD64 (BD555 527) M1-polarization, expressions were recorded.
Exosomes isolation and assessment
H460GFP-CSCs were grown as described (the formulation does not include FBS, and all components are exosomes-free). Monocytes (8x10⁶) from buffy-coats were cultured for 6 days with RPMI+10% exosomes-free FBS (Gibco-A25904DG). Supernatants were collected and exosomes vesicles (EVs) were isolated using a standardized protocol.Citation29
To determine EVs size, nanoparticle tracking analysis was performed using a NanoSIGHT LM10 (Malvern, USA) device. For western blot analysis, EVs were broken using a solution of equal parts of protease inhibitors (Complete protease inhibitor cocktail, SIGMA-P8340) and RIPA buffer (ThermoFisher-89900). Monoclonal antibodies α-CD63 (ab134045), α-ALIX (ab117600) and α-βACTIN (housekeeping, SIGMA-A5316) expression were assessed.
Next, 2 × 10³ H460GFP-CSC cells were incubated with 5, 10 or 20 µg of monocytes-exosomes, and 1.8 × 10⁴ monocytes (from HVs) were incubated with 5 or 10 µg of H460GFP-exosomes, in RPMI+10% exosomes-free FBS. A co-culture of 2 × 10³ H460GFP-CSC and 1.8 × 10⁴ monocytes (cRPMI) was run in parallel as control. Hybrids (CD14+PANK+ for monocyte-wells and CD14+GFP+ for tumors-wells) were analyzed by FACS after 5 days; note that although PANK and GFP expression will be driven by tumor cells, putative hybrid formation after monocytes incubation with H460GFP-exosomes, could only be detected with essential proteins such as PANK.
Statistical analysis
For all the experiments, an adequate sample size was determined using the results of pilot studies and no statistical method was used to determine sample size. Appropriately, t-Student, ANOVA followed by Tukey analysis or Mann–Whitney U tests were performed. The Chi-square was used to evaluate the concordance between PT (primary tumors) and M (metastasis) samples and the association between CD36 and CD36/CD14/PANK with metastasis. To predict metastasis, a logistic regression model was fit with Cohort#1, using circulating THCs (%) and gender (female = 0, male = 1) values as explanatory variables. The resulting formula was used to derive a simple scoring system: we used the weighted sum of the predictors from the logistic regression model multiplied by their regression coefficients, and then transformed these onto the (0.1) interval to yield a predicted probability of metastasis for each patient. Finally, in a validation Cohort#2, we estimated the probability of metastasis based on the formula, by examining the area under the curve (AUC) of the Receiver-Operating Characteristic (ROC). Thus, AUC measures how well the model discriminates between metastatic and non-metastatic patients. We also indicated sensitivity, specificity and the 95% Confidence Intervals (95% CI). Significance was set (*P < .05, **P < .01, ***P < .001, ****P < .0001) using Prism 6.0 software (GraphPad) and SPSS software (IBM Corp. Released 2015. IBM SPSS Statistics for Windows, Version 23.0. Armonk, NY: IBM Corp).
Results
Generation of hybrids from in vitro fusions between monocytes and tumor stem cells
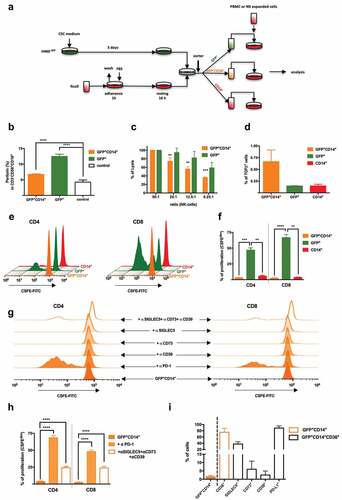
To test the potential implication of fusion events between monocytes and CSCs in metastasis, human lung cancer cell lines H460GFP, H460 and A549 were cultured in CSC-media under non-adherent conditions to drive tumor-initiating characteristics, including the formation of spheroid aggregates (Supplemental Figure 1a) and expression of proper markersCitation30 (Supplemental Figure 1b and 1c). On the other hand, monocytes were isolated from buffy coats, and fusion assays were performed as shown in , rendering double-positive cells GFP+CD14+ or PANK+CD14+, after a strict doublets discrimination ( and Supplemental Figure 1d). When co-culturing monocytes stained with vital colorant DID and H460-CSCs with DIO, double-positive cells defined as DID+DIO+ were quickly detected in about 30 minutes by confocal microscopy (). As these time-lapses were longer quantitatively performed (Supplemental video 1), the population’s dynamics showed flat-curve for (non-dividing)-monocytes, exponential-curve for (dividing)-tumor cells, and (≈16 h)-lag-period followed by an infinite growth for (emerging)-hybrids (Supplemental Figure 2). We detected significant differences in the efficiency of hybrids generation between CSCs and non-CSCs (). The phenomenon was specific for monocytes, given that lymphocytes and neutrophils co-cultures did not result in hybrids (). Moreover, no significant differences were observed neither among monocytes and macrophages nor in monocytes to macrophages transition in fusion efficiency, as evaluated by specific markers CD14, CD15 and CD36Citation31 ( and Supplemental Figure 3a-e). Note that CD14/CD15/CD36 levels on monocytes and neutrophils, and CD16/CD16b/CD66b on neutrophils, were analyzed during fusion kinetics monitoring, and fluctuations involving fusion event were related only to the former, since neutrophils die within the first 24 h of culture and do not support any significant proportion to whole fused-population (Supplemental Figure 3f-j). Moreover, CD15, the best marker describing neutrophils development, should be discarded as it is also expressed by most cancer stem-cell lines,Citation32 including those in this study (Supplemental Figure 3g). Eventually, a similar rate of hybrids was obtained for monocytes and macrophages ().
Figure 1. Co-culture in vitro of cancer stem cells and human monocytes generates hybrid cells.
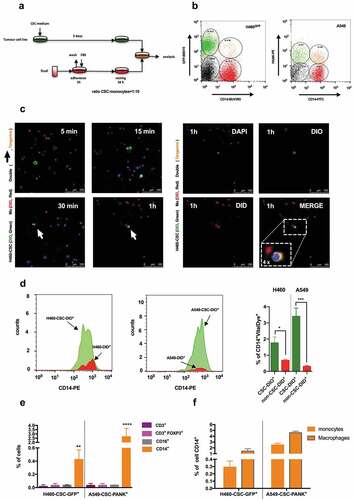
Of note, no changes in fusion rate were observed neither when monocytes were cultured in the presence of H460GFP-exosomes nor vice-versa (Supplemental Figure 4). Along these lines, Gast et al. have described double-positive cells using tumor and myeloid cells of murine origin, and neither detected phenomenon changes when each of them was cultured in the presence of supernatants from the other.Citation12
Tumor-hybrid cells show a well-defined identity
As shown in , multi-nucleated DAPI-labeled H460GFP-CSCs co-cultured with EdU-nuclei labeled monocytes generated multi-nucleated hybrids cells with fused-nuclei. This finding mirrors both karyotype and electron-microscopy analyses of hybrids (,). Although fused-cells preserved tumor-like multiple chromosomal aberrations, they showed a normal number of chromosomes according to diploid cells. They also lost the trisomy at chromosome-16 and an aberrant chromosome-A observed in H460 () thence a key point to discriminate between fusion and phagocytosis. Moreover, electron-microscopy confirmed the fusion process, showing clearly morphological H460-different,Citation33 GFP+CD14+-cells of 10.15 ± 3.05 µm, with pseudopod extensions and lamellipodia, large numbers of mitochondria, lysosomes and autophagic vacuoles, and often prominent nuclei surrounded by micronuclei-containing vacuoles ((i–vi)). Remarkably, electron-microscopy also ruled out possible phagocytic events mimicking fusion in cytometry analyses. Furthermore, we investigated transcriptome signatures and pathways characteristic of hybrids by performing RNA-Seq analysis of naïve CD14+-monocytes (CD14+n, blue) and cells resulting from fusion protocol (CD14+, red; CD14+GFP+, tangerine and GFP+, green). A principal component analysis (PCA) positioned hybrids far from CD14+n and in-between CD14+ and GFP+ cells (). At the molecular level, this result can be explained by the co-occurrence of transcriptional signatures of both cell types in hybrids (,). A thorough analysis of RNA-Seq data revealed that, transcripts associated with cancer and expressed primarily in GFP+, as well as transcripts involved in immune-associated pathways and expressed primarily in CD14+, were expressed by hybrids (Supplemental Figure 5a and 5b). A number of these genes were validated by RT-qPCR (Supplemental Figure 5c). Note also that CD14+ and CD14+n cells are quite different at the transcriptomic level (Supplemental Figure 6); the former shows a contrasting activated phenotype due to their interactions with the CSCs.Citation34
Figure 2. Fused-cells exhibit a patent entity.
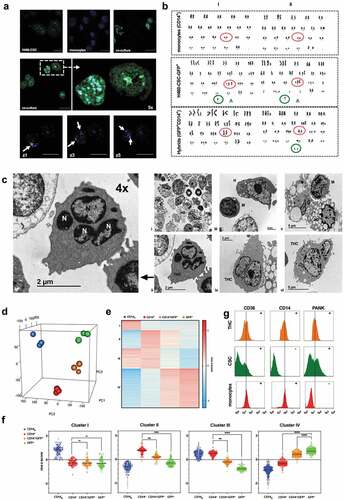
Ultimately, FACS analysis showed that, according to both RNA-Seq and CSCs phenotypes (Supplemental Figure 1c and Supplemental Figure 5), hybrids were mainly CD14+-cells expressing cancer-epithelial-cytokeratins markers (PANK) and CD36 (i.e., a CD36+CD14+PANK+ signature, ); hence, we coined as Tumor-Hybrid Cells (THC).
CD36 on lung primary tumor is crucial for the generation of THCs
Expression of CD36 by CD14+PANK+ hybrids seemed relevant as this scavenger-receptor not only had been recently reported to play a key role in the context of metastasis,Citation35,Citation36 but also because of its known fusogenic activity.Citation37 Moreover, as we moved to evaluate CD36 in H460, we noticed its expression increases either as mRNA () or protein ( insert) only in CSC-media, as H460 acquired stemness (Supplemental ). Therefore, we passed to assess the role of CD36 expression in mediating fusion amongst myeloid and tumor cells. The up-regulation of CD36 in both CSCs and monocytes () by hydroxyalkenal activator (4HNE)Citation38 resulted in a significant increase of THCs (). CD36 was then separately overexpressed in monocytes and H460GFP-CSC (). Only for H460GFP-CSC transfected with pCD36, an increase in THCs events was observed (). However, no significant increment was found when monocytes overexpressed CD36 by even two different protocols ( and insert). Consistently, though RNA-silencing reduced CD36 expression on both H460GFP-CSCs and CD14+-cells (), a significant reduction of hybrid occurrence was only observed for the former (); CD36 downregulation on CD14+-cells did not affect fusion rate as much as the presence of α-CD36 (). Remarkably, clone A549-B10, a CRISPR-engineered p.(Glu46Argfs*7) A549-CD36Δ/Δ cells ( and Supplemental Figure 7), which consequently did not yield THCs if co-cultured with monocytes, was able to rescue normal fusion values after transient-transfection with pCD36 ().
Figure 3. Fusion process efficacy depends on both the regulation of CD36 expression by CSCs and microenvironmental lipids fluctuations, and the oxidative status and M2-phenotype of MΦs.
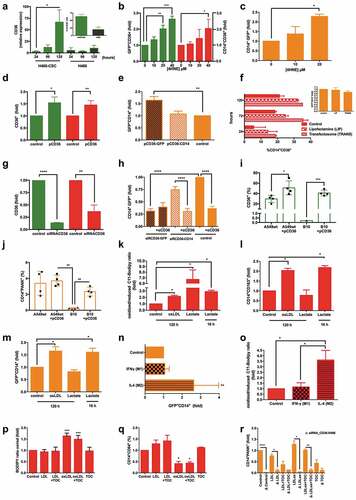
Taking into account CD36 affinity for oxidized molecules,Citation38–Citation40 we modified monocytes oxidative state by intermediate-metabolism manipulationCitation41,Citation42 (), finding that their oxidative boost after oxidizing low-density lipoprotein (oxLDL) treatment also provoked their polarization to M2-phenotypeCitation43 (). Likewise, the presence of lactate during the last 16 h of fusion-lag induced the same effect on monocytes,Citation41–Citation44 in contrast to longer lactate incubation periods (96 h), which in turn reverted to M1-phenotype (). Altogether, the oxidative boost and M2-polarization matched the increment in THCs (); note that those CD14+ cells that did not fuse in previous experiments showed an M1-polarization genotype (Supplemental Figure 6). It is noteworthy that previous IL4-polarization to M2-monocytes increased the hybrids formation ratio (). We observed that the oxidative state was also higher for IL4-treated monocytes than both control and IFNγ-treated cells (). Other authors have previously reported that M2-phenotype favored fusion events.Citation45 As expected, these phenomena were closely dependent on microenvironmental oxidative status, since native LDL was unable to boost neither oxidized () nor M2-monocytes (). Moreover, CD36-silencing for oxidative and non-oxidative microenvironmental conditions, and in the presence of tocopherol (a potent antioxidant and inhibitor of CD36Citation46) confirmed this scavenger-receptor to be crucial for the fusion event ().
THCs show a high rate of migration and proliferation
To explore whether fusion conferred any advantage to THCs in terms of migration and invasiveness, we performed both collagen-free and collagen (membrane) migration assays (, insert panel). The percentage of migrated cells showed clear differences between THCs and CSCs in passive (no membrane) and active migration. GFP+CD14+ but not H460GFP-CSCs, reached the lower compartment while, as expected, most human monocytes migrated through the insert (, left panel). Similar findings were obtained with THCs (PANK+CD14+) generated from A549 (, right panel).
Figure 4. THCs show migration and proliferation capabilities both in vitro and in vivo.
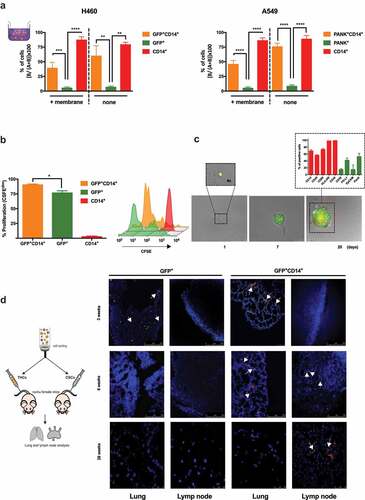
To test hybrids proliferative ability, CFSE assays were performed and higher proliferation rates of THCs than H460GFP-CSCs () were found. Moreover, after 20 days of sole single-cell seeding, a proliferative activity was documented (). Interestingly, those in vitro generated tumors were quite heterogeneous for a set of tumoral markers (PD-L1, EpCAM and cytokeratins), which might be a clue to explain metastases heterogeneity, though further in vivo studies will be needed (, insert).
Migration ability was also observed in vivo. When inoculating mice with THCs or H460GFP-CSC, a distribution pattern consistent with previous reports,Citation47 after evaluations at 3, 6 and 28 weeks post injection, was shown (). Most injected cells reached the lungs after 3 weeks. However, after 6- and 28-weeks THCs but not CSCs were found in lungs and lymph nodes, suggesting that THCs were able to colonize and then migrate to distant sites. In addition, when we came across spleens, a well-known tissue where metastasis by primary lung cancer organotropism cannot be justified by circulatory pattern,Citation7 we found that those mice inoculated with THCs had developed unstructured spleen morphology, with no demarcated limits among white and red pulps and THC-lumps development with tumor appearance (Supplemental Figure 8); high levels of TTF-1 lung cancer-marker expression were detected, emphasizing the lung-metastatic features (Supplemental Figure 8). Moreover, orthotopic in vivo model of metastasis showed that CD45+/Cytokeratin-8+ cells were present in the peripheral blood of mice bearing tumor development after 5 weeks (Supplemental Figure 9). As a whole, these data concur with previously reported in mice models showing metastasis-relatedd fusion events in mice models.Citation12
THCs avoid immune control
Following the experimental design shown in we moved to study the immune response against hybrids. As THCs were exposed to expanded human NK-cells, significant downregulation of immune response was observed: perforin generation by CD3−CD56+CD16+ cells was reducedCitation48 () and cytotoxicity significantly decreased (). Note that, hybrids exhibited a higher expression of well-known NK-cells inhibitors HLA class I members (HLA-B and HLA-E) than CSCs (Supplemental ). However, though the expression of TGF-β was higher in hybrids than CSCs and monocytes (), it was no significant enough to explain the effect observed in NK-cells.Citation49 Interestingly, both CD4+ and CD8+ T-cells showed a marked reduction in mitogen-induced proliferation after exposition to THCs with regards to CSCs (,). This effect was reverted in the presence of either α-PD-1 or a cocktail of α-CD39, α-CD73 and α-SIGLEC5 (,). According to our RNA-Seq analysis, these four molecules exhibited higher expression in hybrids than CSCs (Supplemental Figure 5), a pattern that was also verified by FACS ().
Figure 5. THCs downregulate in vitro immune response.
In agreement, a differential pro-inflammatory cytokine production was observed when hybrids and CSCs were co-cultured with PBMCs from HVs (Supplemental Figures 10a and 10b). Whilst CSCs up-regulated IFNγ, TNFα and IL-6, THCs did not. A global analysis of FoxP3 expression (master regulator of Tregcells) by PBMCs, and the immune checkpoints PD-1 and CTLA4, indicated an up-regulation of these regulatory factors when PBMCs interact with THCs (Supplemental Figure 10c, upper panel) with regards to CSCs (Supplemental Figure 10c, lower panel). Besides, overexpression of FoxP3 and PD-1 on CD4+-lymphocytes, and PD-1 and CTLA4 on CD8+-cells were induced by THCs but not by CSCs, as seen after co-culturing them with PBMCs (Supplemental Figure 10d). It is also noteworthy the differences observed in Treg and CD8+ T cells proliferation, after blocking the fusion essential-receptor CD36 in co-cultures of HVs’ lymphocytes with either CSCs or THCs. According to a mechanism recently reported,Citation50 CD36-blockade Treg cells were not able to expand in a CSCs’ microenvironment (Supplemental Figure 11a) then allowing anti-tumoral CD8+ T cells to proliferate (Supplemental Figure 11b). However, this effect seemed attenuated in THCs’ microenvironment. Whether or not a metabolic modulation involving CD36 amongst Treg cells and THCs occurs, will need further in vivo studies. Altogether, these data evidence THCs are able to both modulate and overcome immune surveillance.
THC-specific markers signature on primary lung tumors and in circulation correlate with metastatic events
We next used the signature CD36/CD14/PANK to localize “Trojan horses” in tissues and peripheral blood of lung cancer patients, looking for a correlation between dissemination pattern and origin of these metastatic cells. Notably, analysis of CD36 alone and the triad, along 87 lung samples from normal tissue (healthy, n = 4), inflammatory tissue (chronic pneumonia, n = 8) and lung cancer (squamous cell carcinoma, n = 29; adenosquamous carcinoma, n = 3; adenocarcinoma, n = 28; small-cell carcinoma, n = 9; bronchioloalveolar carcinoma, n = 1; large-cellundifferentiated carcinoma, n = 1; and papillary adenocarcinoma, n = 4) revealed high levels of CD36 in a number of these samples. However, there was no correlation with metastasis occurrence (Chi-square = 2.093, P = .148, Person Test) (CD36 columns in , Supplemental Figure 12, left panel and Supplemental Table 2). In contrast, triple-positive-cells were found only in the lungs of those patients who subsequently suffered metastasis (CD36/CD14/PANK columns in , left panel in , CD36/CD14/PANK column in Supplemental Figure 12, and Supplemental Table 2). There was a significant correlation between CD36/CD14/PANK co-localization in lung samples and metastasis occurrence (Chi-square = 36.737, P < .001, Pearson test, Supplemental Table 2).
Figure 6. THCs specific markers signatures in patients with lung cancer.
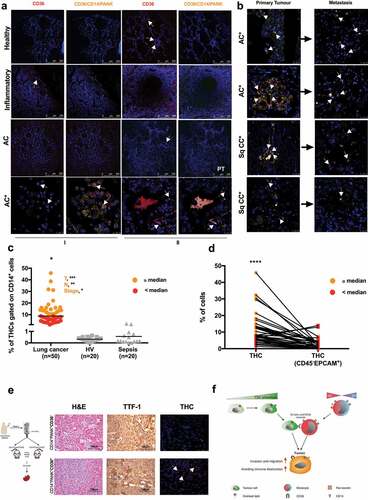
Remarkably, CD36+CD14+PANK+ cells were found in 60% of the primary tumors of those patients who subsequently developed metastasis (40 out of 87 patients) and the signature was also found in 80% of the metastatic tissues (, Supplemental Figure 12 and Supplemental Table 2). Besides, paired samples (primary tumors and their corresponding metastases) were not significantly different in this regard (n = 40, Chi-square = 0.395, P = .530, Supplemental Table 2).
On the other hand, following strategy shown in Supplemental Figure 13, presence of THCs was evaluated in circulating cells from 50 patients diagnosed with pulmonary tumors (Cohort#1, I in Supplemental Table 3) often metastatic, 24 HVs and 20 septic patients without any clinical history of cancer-related pathologies were also analyzed as controls (). THCs were not found in controls. However, lung cancer patients were positive for CD36/CD14/PANK signature. These patients had been diagnosed at a late stage and were included in the study before chemotherapy. In agreement, the presence of THCs correlated to the size and direct extent of the primary tumor as defined by the TNM (Spearman’s Rho = 0.447; P = .006). Moreover, when patients were classified into two groups according to the median of THC (%) in circulation ( and Supplemental Figure 14), those patients above the median showed significant correlation with size of the primary tumor (T, Spearman’s Rho = 0.797; P < .001), spread to regional lymph nodes (N, Spearman’s Rho = 0.723; P = .001) and stage (Spearman’s Rho = 0.447; P = .025). These results were further used to predict the metastatic status of another cohort of 28 patients with lung cancer (Cohort#2, II in Supplemental Table 3), showing that together %THC and gender may predict metastasis in a high extent (Supplemental Figure 15; AUC = 0.821; 95%CI, 0.679 to 0.963; P < .0001).
Curiously, THCs ultimately did not exhibit the main markers of CTCs (CD45−EPCAM+ on THCs gate, , see gating strategy in Supplemental Figure 13), reinforcing their uniqueness. Finally, when CD36−CD14+PANK+ and CD36+CD14+PANK+ subpopulations from lung-cancer patients’ PBMCs were inoculated into mice, only the latter was found in spleens after 28 weeks, along with unstructured morphology and high levels of TTF-1 ( and Supplemental Table 4).
Discussion
In this study, we have showed that tumors might “exploit” myeloid cells to expand toward other organs, following the rationale of Paget’s ‘seed and soil’ theory. THCs are able to free from primary lung-tumors then exhibiting almost all reported hallmarks of both cancer and metastasis,Citation51 including motility, microenvironment modulation, genome uniqueness, proliferation and active colonization of distant organs – even some not explained by the circulatory pattern-. On the other hand, though several theories have been proposed to formulate the origin of metastatic cells,Citation52 only the “cancer cell fusion” theory seems strong enough to explain THCs emergence data, by a mechanism () involving CD36, a scavenger-receptor also essential in their dissemination with the proper phenotype. Thence, these results grasp an adequate empirical support to linking both origin and dissemination pattern of metastatic cells in the body.
Our data indicate that fusion between macrophages/monocytes (MΦs) and CSCs takes place with a high dependency on CD36 expression by the latter, and polarization and oxidative status of MΦs. CD36 in its scavenger-receptor function adapts tumor cells to the fluctuating microenvironmental conditions mainly related to fuel supply, and through its fusogenic function recruits major M2-oxidized MΦs to complete fusion process for rendering THCs. In agreement with these observations, other authorsCitation35 have shown that neutralizing antibodies against CD36 cause inhibition of metastasis in immunocompetent orthotopic mouse models of human oral cancer. Altogether, these features open new horizons to explore CD36 in both cancer origin and metastasis therapeutics.
Due to the important role of the immune system in the elimination of aberrant cells, escaping from immune control is crucial for cancer and metastasis. Along these lines, in vitro obtained THCs expressed high levels of the immune checkpoint ligand PD-L1 and reduced CD8+-lymphocytes proliferation in a PD-L1/PD-1 interaction-dependent manner. Other molecules such as SIGLEC5, CD73 and CD39 were found overexpressed on THC, albeit only a significant effect on the interaction with T cells was observed when these three immune-modulators were simultaneously blocked. The presence of THCs induced a downregulation of NK-cells activity and an anti-inflammatory profile in T-cells, together with a modulation of Treg cells. Eventually, from in vivo approaches, we have learnt that human THCs are able to reach and colonize distant sites, and also to circulate in the peripheral blood of mice orthotopic metastasis models, hence demonstrating their potential to evade the immune surveillance.
Previous clinical reports have already supported the theory of cancer cell fusion to explain the origins of metastatic cells.Citation12-Citation16 Our data demonstrate the presence of THCs in patients with lung cancer. The identification of these cells, through CD36/CD14/PANK signature, in lung samples from patients who have had metastatic lung tumors, strongly supports a role for the hybrids in this context. Furthermore, finding the same THCs in their metastases suggests these must travel from the primary site to the final stage. These circulating cells have also been found in patients with cancer with an outcome of metastasis, but neither in healthy donors nor in patients with an unrelated inflammatory pathology. Remarkably, the detection of THCs in primary tumors correlated to metastasis incidence in the analyzed cohorts. In fact, the frequency of patients with CD36/CD14/PANK co-localization in primary tumor and who did not develop metastasis was zero. Similar results were obtained when we analyzed paired samples of primary tumors and metastases from the same patient, and a statistical correlation between the identification of THCs in primary tumors and metastatic samples was observed. Besides, we were able to predict metastasis occurrence in new lung cancer patients based on their circulating THCs and gender. A critical evaluation of these data could indicate that, as well as in primary tumors, THCs in metastases could be a result of new fusions between tumor and myeloid cells in this niche. Based on our data from human samples, we are not able to answer this question properly. However, previous reports have suggested that patients treated with Denosumab, a potent fusion inhibitor, exhibited a significant reduction of metastasis compared with non-treated populationCitation;53−Citation55 hence, even in case of de novo THCs presentation, our model might remain valid for new treatments development.
Finally, it is noteworthy that no influence of either CTCs or exosomes could be inferred from our data. Regardless of the controversy that several studies have shown a role for both CTCs and exosomes in the metastasis fusion contextCitation4,Citation56,Citation57 whilst some others have not,Citation12,Citation58,Citation59 our data did not exclude the importance of these two factors. First, we have demonstrated that THCs are independent events from CTCs but we did not dive into properties of the latter since it was not the aim of this study. Secondly, despite our findings had indicated that THC generation is independent of the presence of exosomes derived from their parental lineages, at large exosomes could be creating a favored microenvironment to the journey of THCs through the circulation to organs they will later colonize.Citation60 Further research will be then needed to address those open questions.
As “white walkers,” THCs are literally a type of ‘Trojan horse’ cell that, with its defense system appearance, could convey tumor cells to remote sites to colonize other organs, avoiding immune system recognition. Our data reinforce the extremely complex concept of the metastatic pith and shed light on possible improvements in clinical practice to fight metastasis.
Disclosure of potential conflicts of interest
No potential conflicts of interest were disclosed.
Ethics approval and consent to participate
This study was approved by the Committee for Human Subjects of La Paz University Hospital (HULP: PI-3521) and the Clinical Research Ethics Committees of the Hospitals of Madrid (17.10.1125-GHM). Written informed consent was obtained from all participants. All animal studies were approved by the Ethics Committee for Animal Research from La Paz University Hospital (CSIC: 733/2018).
Supplemental Material
Download ()Acknowledgments
We thank Arturo Martínez-Arroyo for exosomes characterisation; Covadonga Aguado and Francisco Rafael Urbano for electron-microscopyy technical assistance; José Luis Martín-Ventura for LDL reagents; Daniel Pando for Transfectosome® technology; Ismael Morales-Flores for informatics support; María Elena Mansilla for karyotype assistance; Jose Casas, Aníbal Varela and Aurora Muñoz for technical assistance.
Supplementary material
Supplemental data for this article can be accessed on the publisher’s website.
Additional information
Funding
References
- Siegel RL, Miller KD, Jemal A. Cancer statistics, 2016. CA Cancer J Clin. 2016;66:7–17. doi:10.3322/caac.21332.
- Reck M, Heigener DF, Mok T, Soria JC, Rabe KF. Management of non-small-cell lung cancer: recent developments. Lancet. 2013;382:709–719. doi:10.1016/S0140-6736(13)61502-0.
- Messaritakis I, Politaki E, Kotsakis A, Dermitzaki E-K, Koinis F, Lagoudaki E, Koutsopoulos A, Kallergi G, Souglakos J, Georgoulias V, et al. Phenotypic characterization of circulating tumor cells in the peripheral blood of patients with small cell lung cancer. PLoS One. 2017;12(7):e0181211. doi:10.1371/journal.pone.0181211.
- Jie XX, Zhang XY, Xu CJ. Epithelial-to-mesenchymal transition, circulating tumor cells and cancer metastasis: mechanisms and clinical applications. Oncotarget. 2017;8:81558–81571. doi:10.18632/oncotarget.18277.
- Massague J, Obenauf AC. Metastatic colonization by circulating tumour cells. Nature. 2016;529:298–306. doi:10.1038/nature17038.
- Azevedo AS, Follain G, Patthabhiraman S, Harlepp S, Goetz JG. Metastasis of circulating tumor cells: favorable soil or suitable biomechanics, or both? Cell Adh Migr. 2015;9:345–356. doi:10.1080/19336918.2015.1059563.
- Akhtar M, Haider A, Rashid S, Paget’s A-NA. “Seed and soil” theory of cancer metastasis: an idea whose time has come. Adv Anat Pathol. 2019;26:69–74. doi:10.1097/PAP.0000000000000219.
- Merino D, Weber TS, Serrano A, Vaillant F, Liu K, Pal B, Di Stefano L, Schreuder J, Lin D, Chen Y, et al. Barcoding reveals complex clonal behavior in patient-derived xenografts of metastatic triple negative breast cancer. Nat Commun. 2019;10(1):766. doi:10.1038/s41467-019-08595-2.
- Klotz R, Thomas A, Teng T, Han SM, Iriondo O, Li L, Restrepo-Vassalli S, Wang A, Izadian N, MacKay M, et al. Circulating tumor cells exhibit metastatic tropism and reveal brain metastasis drivers. Cancer Discov. 2020 Jan;10(1):86–103. doi:10.1158/2159-8290.CD-19-0384
- Goldenberg DM, Pavia RA, Tsao MC. In vivo hybridisation of human tumour and normal hamster cells. Nature. 1974;250:649–651. doi:10.1038/250649a0.
- Pawelek JM. Tumour cell hybridization and metastasis revisited. Melanoma Res. 2000;10:507–514. doi:10.1097/00008390-200012000-00001.
- Gast CE, Silk AD, Zarour L, Riegler L, Burkhart JG, Gustafson KT, Parappilly MS, Roh-Johnson M, Goodman JR, Olson B, et al. Cell fusion potentiates tumor heterogeneity and reveals circulating hybrid cells that correlate with stage and survival. Sci Adv. 2018;4(9):eaat7828. doi:10.1126/sciadv.aat7828.
- Yilmaz Y, Lazova R, Qumsiyeh M, Cooper D, Pawelek J. Donor Y chromosome in renal carcinoma cells of a female BMT recipient: visualization of putative BMT-tumor hybrids by FISH. Bone Marrow Transplant. 2005;35:1021–1024. doi:10.1038/sj.bmt.1704939.
- Lazova R, Laberge GS, Duvall E, Spoelstra N, Klump V, Sznol M, Cooper D, Spritz RA, Chang JT, Pawelek JM, et al. A melanoma brain metastasis with a donor-patient hybrid genome following bone marrow transplantation: first evidence for fusion in human cancer. PLoS One. 2013;8(6):e66731. doi:10.1371/journal.pone.0066731.
- Chakraborty A, Lazova R, Davies S, Bäckvall H, Ponten F, Brash D, Pawelek J. Donor DNA in a renal cell carcinoma metastasis from a bone marrow transplant recipient. Bone Marrow Transplantation. 2004;34(2):183–186. doi:10.1038/sj.bmt.1704547.
- Pawelek JM, Chakraborty AK. Fusion of tumour cells with bone marrow-derived cells: a unifying explanation for metastasis. Nat Rev Cancer. 2008;8:377–386. doi:10.1038/nrc2371.
- Kerbel RS, Lagarde AE, Dennis JW, Donaghue TP. Spontaneous fusion in vivo between normal host and tumor cells: possible contribution to tumor progression and metastasis studied with a lectin-resistant mutant tumor. Mol Cell Biol. 1983;3:523–538. doi:10.1128/MCB.3.4.523.
- Busund LT, Killie MK, Bartnes K, Seljelid R. Spontaneously formed tumorigenic hybrids of Meth A sarcoma cells and macrophages in vivo. Int J Cancer. 2003;106:153–159. doi:10.1002/ijc.11210.
- Larizza L, Schirrmacher V, Graf L, Pfluger E, Peres-Martinez M, Stohr M. Suggestive evidence that the highly metastatic variant ESb of the T-cell lymphoma Eb is derived from spontaneous fusion with a host macrophage. Int J Cancer. 1984;34:699–707. doi:10.1002/ijc.2910340518.
- Chakraborty AK, Sodi S, Rachkovsky M, Kolesnikova N, Platt JT, Bolognia JL, Pawelek JM. A spontaneous murine melanoma lung metastasis comprised of host x tumor hybrids.. Cancer Res. 2000;60:2512–2519.
- Noubissi FK, Harkness T, Alexander CM, Ogle BM. Apoptosis-induced cancer cell fusion: a mechanism of breast cancer metastasis. Faseb J. 2015;29:4036–4045. doi:10.1096/fj.15-271098.
- Lindstrom A, Midtbo K, Arnesson LG, Garvin S, Shabo I. Fusion between M2-macrophages and cancer cells results in a subpopulation of radioresistant cells with enhanced DNA-repair capacity. Oncotarget. 2017;8:51370–51386. doi:10.18632/oncotarget.17986.
- Zumsteg A, Baeriswyl V, Imaizumi N, Schwendener R, Ruegg C, Christofori G. Myeloid cells contribute to tumor lymphangiogenesis. PLoS One. 2009;4:e7067. doi:10.1371/journal.pone.0007067.
- Seyfried TN, Huysentruyt LC. On the origin of cancer metastasis. Crit Rev Oncog. 2013;18:43–73. doi:10.1615/CritRevOncog.v18.i1-2.40.
- Del Fresno C, Garcia-Rio F, Gomez-Pina V, Soares-Schanoski A, Fernández-Ruíz I, Jurado T, Kajiji T, Shu C, Marín E, Gutierrez Del Arroyo A, et al. Potent phagocytic activity with impaired antigen presentation identifying lipopolysaccharide-tolerant human monocytes: demonstration in isolated monocytes from cystic fibrosis patients. J Immunol. 2009;182(10):6494–6507. doi:10.4049/jimmunol.0803350.
- Lopez-Ayllon BD, Moncho-Amor V, Abarrategi A, de Cáceres II, Castro-Carpeño J, Belda-Iniesta C, Perona R, Sastre L. Cancer stem cells and cisplatin-resistant cells isolated from non-small-lung cancer cell lines constitute related cell populations. Cancer Medicine. 2014;3(5):1099–1111. doi:10.1002/cam4.291.
- Ibrahim KE, Al-Mutary MG, Bakhiet AO, Khan HA. Histopathology of the liver, kidney, and spleen of mice exposed to gold nanoparticles. Molecules. 2018 Jul 25;23(8):1848.
- Kotecha N, Krutzik PO, Irish JM. Web-based analysis and publication of flow cytometry experiments. Curr Protoc Cytom. 2010 Chapter 10: Unit10 17;53(1):10.17.1–10.17.24. doi:10.1002/0471142956.cy1017s53.
- Rider MA, Hurwitz SN, Meckes DG Jr. ExtraPEG: A polyethylene glycol-based method for enrichment of extracellular vesicles. Sci Rep. 2016;6:23978. doi:10.1038/srep23978.
- Takahashi K, Yamanaka S. Induction of pluripotent stem cells from mouse embryonic and adult fibroblast cultures by defined factors. Cell. 2006;126:663–676. doi:10.1016/j.cell.2006.07.024.
- Boyette LB, Macedo C, Hadi K, Elinoff BD, Walters JT, Ramaswami B, Chalasani G, Taboas JM, Lakkis FG, Metes DM, et al. Phenotype, function, and differentiation potential of human monocyte subsets. PLoS One. 2017;12(4):e0176460. doi:10.1371/journal.pone.0176460.
- Wang P, Wan WW, Xiong SL, Feng H, Wu N. Cancer stem-like cells can be induced through dedifferentiation under hypoxic conditions in glioma, hepatoma and lung cancer. Cell Death Discov. 2017;3:16105. doi:10.1038/cddiscovery.2016.105.
- Zhao R, Chen M, Jiang Z, Zhao F, Xi B, Zhang X, Fu H, Zhou K. Platycodin-D induced autophagy in non-small cell lung cancer cells via PI3K/Akt/mTOR and MAPK signaling pathways. J Cancer. 2015;6(7):623–631. doi:10.7150/jca.11291.
- Sainz B Jr., Carron E, Vallespinos M, Machado HL. Cancer stem cells and macrophages: implications in tumor biology and therapeutic strategies. Mediators Inflamm. 2016;2016:9012369. doi:10.1155/2016/9012369.
- Pascual G, Avgustinova A, Mejetta S, Martín M, Castellanos A, Attolini CSO, Berenguer A, Prats N, Toll A, Hueto JA, et al. Targeting metastasis-initiating cells through the fatty acid receptor CD36. Nature. 2017;541(7635):41–45. doi:10.1038/nature20791.
- Vilahur G. New role for CD36 in metastasis through fat intake. Cardiovasc Res. 2017;113:e16–e17. doi:10.1093/cvr/cvx075.
- Helming L, Winter J, Gordon S. The scavenger receptor CD36 plays a role in cytokine-induced macrophage fusion. J Cell Sci. 2009;122:453–459. doi:10.1242/jcs.037200.
- Ishii T, Mann GE. Redox status in mammalian cells and stem cells during culture in vitro: critical roles of Nrf2 and cystine transporter activity in the maintenance of redox balance. Redox Biol. 2014;2:786–794. doi:10.1016/j.redox.2014.04.008.
- Hale JS, Otvos B, Sinyuk M, Alvarado AG, Hitomi M, Stoltz K, Wu Q, Flavahan W, Levison B, Johansen ML, et al. Cancer stem cell-specific scavenger receptor CD36 drives glioblastoma progression. Stem Cells. 2014;32(7):1746–1758. doi:10.1002/stem.1716.
- He C, Carter AB. The metabolic prospective and redox regulation of macrophage polarization. J Clin Cell Immunol. 2015;6(6):371.
- Colegio OR, Chu N-Q, Szabo AL, Chu T, Rhebergen AM, Jairam V, Cyrus N, Brokowski CE, Eisenbarth SC, Phillips GM, et al. Functional polarization of tumour-associated macrophages by tumour-derived lactic acid. Nature. 2014;513(7519):559–563. doi:10.1038/nature13490.
- Yoshida H, Kisugi R. Mechanisms of LDL oxidation. Clin Chim Acta. 2010;411:1875–1882. doi:10.1016/j.cca.2010.08.038.
- Seo JW, Yang EJ, Yoo KH, Choi IH. Macrophage differentiation from monocytes is influenced by the lipid oxidation degree of low density lipoprotein. Mediators Inflamm. 2015;2015:235797. doi:10.1155/2015/235797.
- Rattigan YI, Patel BB, Ackerstaff E, Sukenick G, Koutcher JA, Glod JW, Banerjee D. Lactate is a mediator of metabolic cooperation between stromal carcinoma associated fibroblasts and glycolytic tumor cells in the tumor microenvironment. Exp Cell Res. 2012;318(4):326–335. doi:10.1016/j.yexcr.2011.11.014.
- Clawson GA, Matters GL, Xin P, Imamura-Kawasawa Y, Du Z, Thiboutot DM, Helm KF, Neves RI, Abraham T. Macrophage-tumor cell fusions from peripheral blood of melanoma patients. PLoS One. 2015;10(8):e0134320. doi:10.1371/journal.pone.0134320.
- Ricciarelli R, Zingg JM, Azzi A. Vitamin E reduces the uptake of oxidized LDL by inhibiting CD36 scavenger receptor expression in cultured aortic smooth muscle cells. Circulation. 2000;102:82–87. doi:10.1161/01.CIR.102.1.82.
- Wong CW, Lee A, Shientag L, Yu J, Dong Y, Kao G, Al-Mehdi AB, Bernhard EJ, Muschel RJ. Apoptosis: an early event in metastatic inefficiency.. Cancer Res. 2001;61:333–338.
- Krzewski K, Coligan JE. Human NK cell lytic granules and regulation of their exocytosis. Front Immunol. 2012;3:335. doi:10.3389/fimmu.2012.00335.
- Cubillos-Zapata C, Hernandez-Jimenez E, Avendano-Ortiz J, Toledano V, Varela-Serrano A, Fernández-Navarro I, Casitas R, Carpio C, Aguirre LA, García-Río F, et al. Obstructive sleep apnea monocytes exhibit high levels of vascular endothelial growth factor secretion, augmenting tumor progression. Mediators Inflamm. 2018;2018:7373921. doi:10.1155/2018/7373921.
- Wang H, Franco F, Tsui Y-C, Xie X, Trefny MP, Zappasodi R, Mohmood SR, Fernández-García J, Tsai C-H, Schulze I, et al. CD36-mediated metabolic adaptation supports regulatory T cell survival and function in tumors. Nat Immunol. 2020;21(3):298–308. doi:10.1038/s41590-019-0589-5.
- Welch DR, Hurst DR. Defining the hallmarks of metastasis. Cancer Res. 2019;79:3011–3027. doi:10.1158/0008-5472.CAN-19-0458.
- Hunter KW, Crawford NP, Alsarraj J. Mechanisms of metastasis. Breast Cancer Res. 2008;10(Suppl 1):S2. doi:10.1186/bcr1988.
- Stopeck AT, Lipton A, Body -J-J, Steger GG, Tonkin K, de Boer RH, Lichinitser M, Fujiwara Y, Yardley DA, Viniegra M, et al. Denosumab compared with zoledronic acid for the treatment of bone metastases in patients with advanced breast cancer: a randomized, double-blind study. J Clin Oncol. 2010;28(35):5132–5139. doi:10.1200/JCO.2010.29.7101.
- Steger GG, Bartsch R. Denosumab for the treatment of bone metastases in breast cancer: evidence and opinion. Ther Adv Med Oncol. 2011;3(5):233–243. doi:10.1177/1758834011412656.
- Smith MR, Saad F, Oudard S, Shore N, Fizazi K, Sieber P, Tombal B, Damiao R, Marx G, Miller K, et al. Denosumab and bone metastasis–free survival in men with nonmetastatic castration-resistant prostate cancer: exploratory analyses by baseline prostate-specific antigen doubling time. J Clin Oncol. 2013;31(30):3800–3806. doi:10.1200/JCO.2012.44.6716.
- Kim M-Y, Oskarsson T, Acharyya S, Nguyen DX, Zhang XHF, Norton L, Massagué J. Tumor self-seeding by circulating cancer cells. Cell. 2009;139(7):1315–1326. doi:10.1016/j.cell.2009.11.025.
- Jia S, Zhang R, Li Z, Li J. Clinical and biological significance of circulating tumor cells, circulating tumor DNA, and exosomes as biomarkers in colorectal cancer. Oncotarget. 2017;8:55632–55645. doi:10.18632/oncotarget.17184.
- Clawson G. The fate of fusions. Cells. 2018;8(1):13.
- Manjunath Y, Porciani D, Mitchem JB, Suvilesh KN, Avella DM, Kimchi ET, Staveley-O'Carroll KF, Burke DH, Li G, Kaifi JT. Tumor-cell-macrophage fusion cells as liquid biomarkers and tumor enhancers in cancer. Int J Mol Sci. 2020;21(5):1872.
- Lobb RJ, Lima LG, Moller A. Exosomes: key mediators of metastasis and pre-metastatic niche formation. Semin Cell Dev Biol. 2017;67:3–10. doi:10.1016/j.semcdb.2017.01.004.