
ABSTRACT
A large number of heterogeneous macrophages can be observed in solid tumor lesions. Classically activated M1 macrophages are a powerful killer of cancer cells. In contrast, tumor-associated macrophages (TAMs) are often referred to as M2 phenotype and usually impair tumor immunity mediated by cytotoxic lymphocytes, natural killer (NK) cells and CD8+ T cells. Therefore, orchestrating M2 to M1 reprogramming will provide a promising approach to tumor immunotherapy. Here we used a PyMT-induced spontaneous breast cancer model in which M2-polarized macrophages were abundant. This M2 phenotype was closely related to tumor progression and immune dysfunction of NK cells and CD8+ T cells. We then found that these TAMs showed increased energy expenditure and over-activation of two kinases, Akt and mammalian target of rapamycin (mTOR). Myeloid inactivation of phosphoinositide-dependent kinase-1 (PDK1), the upstream regulator for Akt and mTOR signaling, significantly reduced excessive metabolic activation of macrophages. Notably, the loss of PDK1 significantly led to regression of breast cancer and prevented lung metastasis. Mechanistically, PDK1 deficiency mainly inhibited the activation of mTOR complex 1 (mTORC1), transforming TAMs into M1 phenotype, thereby reversing tumor-related dysfunction of T cells and NK cells. Therefore, targeting PDK1 may be a new approach for M2 macrophage-enriched solid tumor immunotherapy.
Introduction
Macrophages usually exist in the tumor microenvironment and have different functions at different stages of tumor development. In the early stage of tumor development, macrophages exhibit M1 phenotype and have pro-inflammatory functions.Citation1 Activated M1 macrophages express opsonic receptors (e.g. FcγRIII/CD16), inducible nitric oxide synthase (iNOS), reactive oxygen intermediates (ROI).Citation2 Moreover, M1 macrophages produce cytokines, such as IL-1β, tumor necrosis factor (TNF)-α), interferon (IFN)-γ, interleukin (IL)-12 and IL-23, thereby stimulating tumor immunity mediated by cytotoxic lymphocytes, nature killer (NK) cells and CD8+ T cells.Citation3–Citation6 As CD11c and MHC II were reported to highly expressed in M1-like macrophages, these two molecules are widely used as the markers of M1 macrophages.Citation7–Citation9
The tumor progresses, the tumor microenvironment changes from type 1- to type 2-immunity status.Citation1,Citation10,Citation11 Stimulated by type 2-like cytokines (such as IL-4 and IL-10), tumor-associated macrophages (TAMs) form an M2 phenotype.Citation2,Citation12–Citation16 M2 macrophages highly express galactose, mannose, and scavenging receptors, as well as ornithine and polyamines through the arginase pathway.Citation2,Citation17,Citation18 Furthermore, M2 macrophages secret IL-10 and transforming growth factor-beta (TGF-β), which not only promote tumor invasion, angiogenesis and metastasis, but also inhibit antitumor responses executed by NK cells and CD8+ T cells.Citation1,Citation19–Citation24 M2 macrophages are also characterized by their high expression of CD206.Citation25 Therefore, CD206 is widely used as a marker of tumor-associated M2-like macrophage.Citation9,Citation26,Citation27
However, the M1/M2 model is oversimplified, and the typical M1 and M2 phenotypes represent extremes of a continuum in a universe of activation states. Phenotypes of macrophages are usually intermediate or overlapping, and the functional states of macrophage are heterogeneity and plasticity.Citation28–Citation30 Since the polarized M1-M2 macrophage phenotype can be reversed to some extent, reprogramming of M2 to M1 will provide a promising approach for tumor immunotherapy.
The polarization of macrophages is closely related to their metabolic status. The metabolism of M1 macrophages features as aerobic glycolysis, broken tricarboxylic acid (TCA) cycle and fatty acid synthesis.Citation31 Upon LPS stimulation, macrophages polarize to the M1 status and increases the aerobic glycolysis level. Glycolysis promotes the carbon flux into the oxidative pentose phosphate pathway (PPP) pathway to produce NADPH and then generate reactive oxygen species (ROS), which promotes phagocytosis of macrophages.Citation31 By inhibiting the activation of pyruvate dehydrogenase kinase1(PDK-1) or activate the pyruvate kinase M2 (PKM2) to inhibit aerobic glycolysis impairs the LPS-induced M1 macrophage polarization.Citation32,Citation33 Different from M1 status, M2 macrophages are thought to prefer fatty acid oxidation (FAO) and intact TCA cycle.Citation34–Citation36 Inhibition of FAO promotes the anti-tumor ability of TAMs and restricts tumor growth.Citation37 Glutamine synthetase (GS) facilitates M2 polarization through increasing glutamine levels, which ultimately results in the metastasis of tumors. The use of methionine sulfoxide (MSO) to pharmacologically inhibit GS promotes reprogramming of M2 to M1 macrophages with a decrease in intracellular glutamine, increased succinate levels and increased glucose flux through glycolysis.Citation38 These changes indicate that macrophage polarization status can be influenced by alternating cellular metabolism.
Mammalian target of rapamycin (mTOR) signaling is a key nutrient/energy sensor that links nutrient availability to downstream metabolic processes such as protein synthesis, glycolysis and de novo lipogenesis.Citation39 Phosphoinositide-dependent kinase-1 (PDK1) is considered to be a major regulator of mTOR signaling through phosphorylating Akt, which indirectly activates mTOR complex1 (mTORC1) as a serine/threonine kinase. PDK1 is an important signaling molecule downstream of PI3Ks. Overexpression of PDK1 relates to the occurrence and development of tumors.Citation40–Citation43 PDK1 is ubiquitously expressed in all normal cells. Although many chemical inhibitors targeting PDK1 are developed, clinical use of these potential drugs has the risk of lethal toxicity, which hinders further use of these inhibitors. Moreover, PDK1 is also expressed in all immune cells and is essential for the regulation of the immune system. This kinase is indispensable for T lymphocyte activation.Citation44,Citation45 Cell-type specific PDK1 deletion revealed that the absence of PDK1 leads to stunted development of all lymphocytes, including T cells, B cells or NK cells. Therefore, targeting PDK1 very likely causes significant side effects from an immune perspective.
We have previously reported that PDK1 is intrinsically required for tumorigenesis of a spontaneous breast cancer induced by polyoma virus middle T antigen (PyMT),Citation46 suggesting that PDK1 is a potential target. In addition, the deletion of PDK1 in myeloid cellspromoted the polarization of M1 macrophages in adipose tissue.Citation47 It is not clear whether PDK1 inactivation can enhance tumor immunity by reprograming tumor-promoting M2 macrophage into tumor-inhibiting M1macrophage is unclear at present. In this study, we found that in PyMT model, the myeloid cell-specific deletion of PDK1 inhibits the tumor progression and lung metastasis by reducing mTORC1 activation and promotes the M1-like polarization of macrophages. These accumulated M1 macrophages trigger antitumor responses through two types of cytotoxic lymphocytes, NK cells and CD8+ T cells.
Results
M2 macrophages may weaken anti-tumor immunity in breast cancer
In solid tumor, NK cell- and CD8+ T cell-mediated antitumor immunity is usually impaired in a suppressive microenvironment, characterized by the high presence of TAMs similar to M2 macrophages.Citation8,Citation48–Citation50 In order to understand whether M2 status causes impaired immune function, we first used a spontaneous PyMT-induced solid tumor mouse model in C57BL/6 background that mimics breast cancer. The transgenic mice specifically express PyMT in mammary gland under the transcriptional control of a long terminal repeat of the mouse mammary tumor virus (MMTV).Citation51 We first noticed that mammalian transgenic expression of PyMT induce breast carcinoma around 12 weeks, and then rapidlyprogress. 18 to 22 weeks, tumor-infiltrating NK cells and CD8+ T cells showed a significant defect in secreting IFN-γ, which is critical to the immunosurveillance by these two types of lymphocytes (). Especially in advanced tumors (22 weeks), NK cells were found to be unresponsive to PMA/ionomycin stimulation (), which indicated that at this stage NK cells have lost their function.Citation52–Citation54
Figure 1. M2 macrophage polarization is associated with impaired anti-tumor immunity in spontaneous breast cancer.
Furthermore, as the tumor progressed, the frequency of TAMs (Ly6G−F4/80+CD206+CD11c−) gradually increased, while the proportion of M1-like macrophages (Ly6G−F4/80+CD206−CD11c+) decreased. Accordingly, the ratio of M1 to M2 was significantly reduced in advanced tumors (). It is worth noting that the IL-10 concentration in the tumor tissue increased with the tumor progression (). We further noticed a positive correlation between the proportion of M2 macrophages and the amount of IL-10 in the tumor tissues (), which is supported by the published findings that IL-10 promoted M2 polarization.Citation55 The proportion of M2 macrophages is also positively correlated with the mice age that reflects the tumor stages. However, the proportion of M2 macrophages in tumors was inversely correlated to multiple parameters reflecting antitumor capacity, such as the percentages of NK cells and CD8+ T cells, and their ability to secret IFN-γ (). These findings indicate that TAMs (mainly M2 macrophages) are largely correlated to the anti-tumor immunity of NK cells and CD8+ T cells in advanced breast cancer.
Myeloid-specific deletion of PDK1 alleviates the abnormal activation of tumor-associated macrophages
Since M2-like macrophages are associated with the dysfunction of NK cell and CD8+ T cells, we wondered whether reprogramming macrophage polarization in the tumor microenvironment could restore the function of tumor-infiltrating NK cells and CD8+ T cells. It is recognized that M1- and M2-macrophages have distinct intracellular metabolisms. M1 macrophages rely on aerobic glycolysis, while M2 macrophages mainly employ oxidative glucose metabolism pathways.Citation34,Citation35 In addition, vitamins, fatty acids, amino acids, and iron metabolisms are also involved to macrophage polarization.Citation56 Thus, we first tested the cellular metabolic status of TAMs in the PyMT tumors. We examined expression levels of transferrin receptor CD71 and the amino-acid transporter CD98. Transferrin receptor (CD71) mediates the uptake of transferrin-iron complexes and is highly expressed on the surface of cells of the erythroid lineage, and cells with high proliferation.Citation57,Citation58 CD71 is therefore essential for cell growth and iron-requiring metabolic processes including DNA synthesis, electron transport, mitogenic signaling pathways. Consequently, rapidly growing cells require more iron and CD71 for their growth than resting cells.Citation59 Amino-acid transporter CD98 functions as an amino acid exchanger that can export glutamine in exchange for essential amino acids (EAAs) such as leucine and isoleucine. These functions also allow CD98 to regulate lymphocyte proliferation in adaptive immunity.Citation60–Citation62 Both CD71 and CD98 are considered as nutrition receptors that are essential in cellular metabolism.Citation63,Citation64
Compared with 18 weeks of mice age, two nutritional receptors CD71 and CD98 on tumor macrophages moderately increased at 20 weeks and significantly increased at 22 weeks (). This result indicates that macrophages in the tumor microenvironment may require more nutrients for their activation. Cellular uptake of iron and amino acid leucine through CD71 and CD98 respectively are involved in the regulation of mTORC1 activity.Citation58,Citation62,Citation65–Citation67 mTOR signaling is a key nutrient/energy sensor that links nutrient availability to downstream metabolic processes such as protein synthesis, glycolysis and de novo lipogenesis, and is also a vital link between immune function and metabolism.Citation39,Citation68–Citation70 Thus, we examined the phosphorylation level of AKT and S6 in the mTOR signaling pathway and found both increased in TAMs as tumor progressed (). These data suggest that excessive activation of AKT-mTOR signaling may be related to the activation of macrophage metabolism during tumor progression.
Figure 2. Myeloid-specific deletion of PDK1 reduces the abnormal metabolism of tumor-infiltrating macrophages.
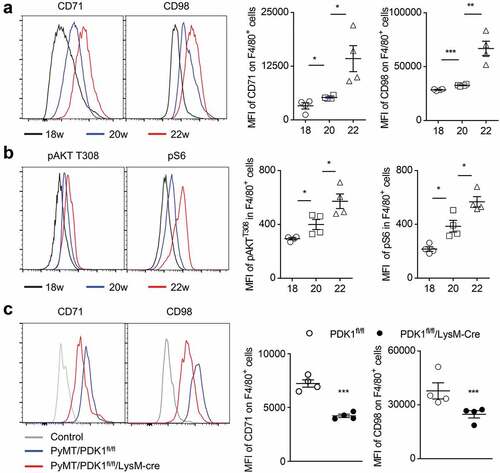
We have previously reported that the absence of PDK1, an upstream component of AKT-mTOR signaling, blocks metabolic activation in NK cells and breast cancer cells.Citation46,Citation64 Therefore, we investigated whether the deletion of PDK1 could alleviate the abnormal metabolism of tumor-infiltrating macrophages. We prepared the PDK1fl/fl/LysM-Cre mice, a mouse model in which Cre recombinase under the control of LysM promoter deleted the floxed exon of PDK1. Thus, PDK1 was deleted only in myeloid cells, including macrophages (Supplementary Figure 1). We measured the amount of two nutritional receptors, CD71 and CD98, in TAMs and found that myeloid-specific deletion of PDK1 significantly reduced the expression of these two nutritional receptors in F4/80+ macrophages (). Therefore, genetic deletion of PDK1 can offset the changes in macrophage metabolic activation upon tumor progression.
Myeloid-specific deletion of PDK1 inhibits tumor growth and metastasis
Next, we studied whether the myeloid-specific deletion of PDK1 in PyMT mice, had an effect on tumor progression. We crossed PDK1fl/fl/LysM-Cre mice with PyMT mice to produce PyMT/PDK1fl/fl/LysM-Cre mice. We found that tumor growth slowed down in PDK1-deleted mice compared with PyMT/PDK1fl/fl littermate, as evidenced by a reduction in tumor volumes and tumor weight (). Remarkably, metastatic lesions in PyMT/PDK1fl/fl mice accounted for approximately 25% of the entire lung in advanced breast cancer. However, it was rarely seen in PyMT/PDK1fl/fl/LysM-Cre mice (). Low power images of lung metastasis section were also shown (Supplementary Figure 2a).
Figure 3. Myeloid-specific deletion of PDK1 inhibits tumor growth and metastasis.
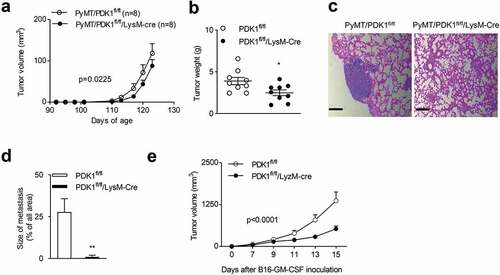
We then investigated whether PDK1 deletion influenced the growth of other tumor types. It has been reported that GM-CSF helps shape the tumor microenvironment by promoting myelopoiesis and recruitment of suppressive myeloid cells.Citation71–Citation75 Thus, we generated a B16-F10 variant that ectopically expressed GM-CSF. We found GM-CSF overexpressed B16-F10 tumors were more malignant than B16-F10 tumors (Supplementary Figure 3a). Furthermore, compared to the B16-F10, more M2-like macrophages found in B16-GM-CSF tumors (Supplementary Figure 3b). This indicated that GM-CSF facilitate the accumulation of M2-like macrophages in the tumor microenvironment. To investigate whether the inactivation of PDK1 delay the growth of tumors expressing GM-CSF, we subcutaneously inoculated the B16-GMCSF cells to PDK1fl/fl/LysM-Cre or PDK1fl/fl mice. We found that the myeloid-specific deletion of PDK1 also significantly inhibited the growth of transplanted B16-GM-CSF tumors ().
Myeloid deletion of PDK1 improves NK cell-mediated antitumor immunity
We then investigated whether the absence of PDK1 in myeloid cells could improve the function of NK cells and CD8+ T cells in tumor lesions. The percentage of NK cells and CD8+ T cells in the tumor tissues of PyMT/PDK1fl/fl/LysM-Cre mice was higher than that of PyMT/PDK1fl/fl control (approximately 5 times) (). In addition, after triggered by polyclonal stimuli, PMA plus ionomycin, IFN-γ-producing NK cells isolated from the tumors of PyMT/PDK1fl/fl/LysM-Cre was much more than that from control mice (). For tumor-infiltrating CD8+ T cells, we observed the similar phenotype (). We finally noticed that PDK1 deletion also significantly corrected the dysfunction of NK cells and CD8+ T cells in the context of GM-CSF-overexpressed tumors ().
Figure 4. Deletion of PDK1 enhances anti-tumor immunity and enhances LPS-induced acute inflammation by enhancing NK cell activation.
NK cell function is associated with macrophage activation
Intraperitoneal injection of anti-NK1.1 antibody (PK136) could efficiently kill most NK cells.Citation52,Citation53 The tumor growth inhibition caused by myeloid-specific deletion of PDK1 was compromised with the depletion of NK cells by the anti-NK1.1 antibody (PK136) (Supplemental Figure 4a). This indicated that the impact of PDK1-deleted TAMs on tumor growth could be mediated by NK cells. To further investigate the association between NK cells and macrophages, we established a mouse model, in which LPS-activated macrophages were inflammatory. We first examined whether the absence of NK cells could alleviate LPS-induced endotoxin shock. Eighty hours after LPS injection, a minority of PK136-treated mice but half of PBS-treated control group died, suggesting that the depletion of NK cells significantly reduced LPS-induced endotoxin shock (Supplemental Figure 4b).
We realized that PK136 treatment might eliminate NK1.1-positive NK-T cells. To rule out the possibility, we then used a mouse model of NK cell deficiency, DTASTOPCitation76/Ncr1-Cre. Briefly, the DTASTOP mice carries the diphtheria toxin A-subunit gene (DTA), whose expression is prevented by a loxP-flanked transcriptional stop sequence. However, upon Cre-mediated deletion of the floxed region, the DTA expression is triggered, leading to the specific ablation of Cre-expressing cells. Ncr1 is an NK Cell-activating receptor specifically expressing in terminal NK cells. We introduced the previously generated Ncr1-Cre mice, in which Cre is expressed under the control of the mouse Ncr1 promoter. We then crossed the DTASTOP mice with the Ncr1-Cre mice to generate the NK cell ablated DTASTOP/Ncr1-Cre mice. Compared with DTASTOP littermates, DTASTOP/Ncr1-Cre mice were highly resistant to LPS-induced lethal shock (Supplemental Figure 4c). Therefore, NK cells aggravate LPS-induced M1 macrophage-mediated inflammation.
Next, the ex vivo assays were performed to evaluate NK cell activity. The administration of LPS could pronouncedly trigger the expression of CD107a and production of IFN-γ in NK cells. Since toll-like receptor 4 (TLR4), which recognizes LPS, is mainly expressed on myeloid cells and almost undetectable on NK cells, the involvement of NK cells in LPS-induced shock might be extrinsic. To confirm it, mice were injected with clodronate-coated liposome to eliminate macrophages. Expectedly, liposome treatment partially inhibited the ex vivo activation of NK cells stimulated by the target cells, RMA-s and YAC-1 (Supplemental Figure 4d). RMA-s cells induce NK cell “missing-self” activation as they lack the MHC-I molecule on the cell surface. While YAC-1 cells highly express Rae1 on the cell surface, which is the ligand of NK cell activation receptor NKG2D. The recognition of Rae1 by NKG2D results in the “induced-self” activation of NK cells.Citation54,Citation64,Citation77 Other stimuli were further used to test NK cell function, such as a combination of cytokines (IL-12 and IL-18) or plate-coated antibodies (anti-NK1.1 or anti-Ly49D). We obtained a similar finding that the in vivo depletion of macrophages greatly reduced the activity of NK cells (Supplemental Figure 4e and F). Thus, LPS-activated, M1-like macrophages may contribute to NK cell activation at least during inflammation.
We further investigated whether the myeloid deletion of PDK1 could enhance NK cell activation in LPS-induced inflammation. First, we noticed that PDK1-deficient mice were more sensitive to LPS-induced lethal effect. However, NK cell depletion reduced the sensitivity to LPS challenge in PK136-treated mice (Supplemental Figure 4g). In vitro experiments showed that when NK cells were triggered by cellular stimuli, such as RMA-S and YAC-1, the absence of PDK1 in myeloid cells significantly increased NK cell production of IFN-γ and expression of CD107a (Supplemental Figure 4h and I). NK cells from PDK1-deficicent mice also showed the increased sensitivity to soluble cytokine (e.g. IL-12, IL-18, or both) (Supplemental Figure 4j). These results indicate that the myeloid deletion of PDK1 is associated with NK cell activation in tumors and LPS-induced acute inflammation.
Deletion of PDK1 promotes M1 macrophage polarization
We then sought to explore whether tumor-infiltrating M2 macrophages could be reprogrammed into M1 statues by deleting PDK1. We first calculated the numbers of two subsets of macrophage, and found that the absence of PDK1 in myeloid cells significantly reduced the percentage of M2 macrophages, while it increased the percentage of M1 macrophage. Thus, PDK1 deletion greatly increased the ratio of M1 to M2 (). Removal of PDK1 from myeloid cells abolished the increase of IL-10 in the breast tissues of PyMT mice (), but the amount of two typical M1-like cytokines, IL-6 and IFN-γ, were significantly up-regulated in PyMT/PDK1fl/fl/LysM-Cre mice ().
Figure 5. Deletion of PDK1 reprograms M1 macrophage polarization.
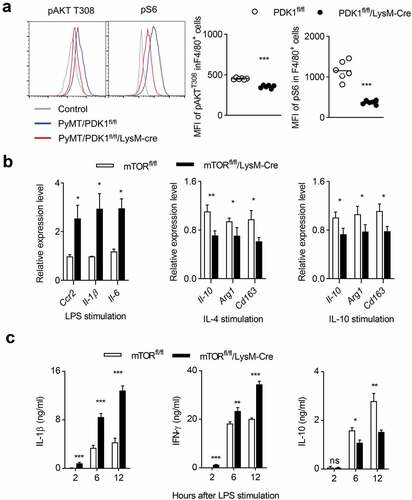
We then perform the extensive study on macrophage polarization after PDK1 inactivation in vitro. Bone marrow-derived macrophages (BMDMs) were generated for the following assays. Two subsets of polarized M1 and M2 macrophages were in vitro induced by LPS and recombinant IL-4 or IL-10, respectively. We found that PDK1 deletion greatly enhanced the expression of three M1-featured gene transcripts, including Ccr2, Il-1β and Il-6 (). In contrast, the absence of PDK1 significantly suppressed the induction of M2-featured gene expression, such as Il-10, Arg1, and Cd163, in IL-4- or IL-10-conditioned BMDMs ().
Using ELISA, we further validated some of these data at the protein level. After LPS stimulation, PDK1 deletion significantly reduced the amount of IL-10, but highly increased the amount of IL-1β and IFN-γ, in the serum of PDK1fl/fl/LysM-Cre mice (). Taken together, the kinase PDK1 is a key regulator of macrophage polarization in tumor and inflammation.
PDK1 deletion promotes M1 macrophage polarization by down-regulating mTOR pathway
Next, we investigated whether the absence of PDK1 could reduce the activation of AKT/mTOR signaling in tumor-infiltrating macrophages. We detected the phosphorylation status of AKT and S6 in tumor-infiltrating macrophages and found that the myeloid-specific deletion of PDK1 significantly inhibited the phosphorylation of AKT T308 and S6 in F4/80+ macrophages (). We next looked for genetic evidence that PDK1 promoted the differentiation of M2 macrophages, but restricted the generation of M1 macrophages by activating mTOR kinase. To this end, we established a mouse model, mTORfl/fl/LysM-Cre, in which mTOR was deleted only in myeloid cells. The deletion of mTOR significantly increased the transcription levels of genes with M1 characteristics in BMDMs stimulated in vitro by LPS, including Ccr2, Il-1β and Il-6, but it decreased the transcripts with M2 characteristics, like Il-10, Arg1 and Cd163 (). After LPS administration, the concentrations of M1-featured cytokines in the serum of mTORfl/fl/LysM-Cre mice, IL-1β and IFN-γ, were much higher than that in their littermates. Oppositely, the amount of IL-10 was less in the serum mTOR-deleted mice (). Thus, PDK1 deletion promotes M1 macrophage polarization possibly by down-regulating mTOR signaling.
Figure 6. PDK1 deletion may induce M1 macrophage polarization by downregulating the mTOR pathway.
Dissociation of mTORC1 induces polarization of M1 macrophage and enhances anti-tumor immunity of NK cells
Our results above indicate that the deletion of PDK1 leads to a decrease in the phosphorylation levels of T308 site of AKT and S6 in tumor-infiltrating macrophages, suggesting that PDK1 may affect the metabolism of tumor-infiltrating macrophages by regulating the mTORC1 pathway. Since Raptor is the main component of mTORC1, we made a mouse model, Raptorfl/fl/LysM-Cre. The deletion of Raptor in myeloid cells significantly increased the transcription levels of M1-featured genes in LPS-stimulated BMDMs, including Ccr2, Il-1β and Il-6 (). Meanwhile, when BMDMs were polarized by either IL-4 or IL-10, the absence of Raptor inhibited the induction of M2-featured transcripts including IL-10, Arg1 and CD163, (). We also measured the concentration of characteristic cytokines. After LPS challenge, Raptor-deficient mice showed more IL-1β and IFN-γ representing M1, and less M2-featured IL-10 compared to control mice (). In addition, the myeloid deletion of Raptor significantly inhibited tumor growth of transplanted B16-GMCSF tumors (). Further ex vivo analysis of tumor-infiltrating lymphocytes showed that both NK cell production of IFN-γ and CD107a expression and CD8+ T cell production of IFN-γ and TNF-α were significantly increased in Raptorfl/fl/LysM-Cre (,e). Therefore, the myeloid disruption of mTORC1 triggers NK cell- and CD8+ T cell-mediated antitumor immunity by reprogramming M1 macrophage.
Figure 7. The destruction of mTORC1 induces polarization of M1 macrophages and enhances the anti-tumor immunity of NK cells.
Discussion
The main executive lymphocytes of anti-tumor responses are CD8+ T cells of adaptive immunity and NK cells of innate immunity. However, the tumor microenvironment often weakens the cytotoxicity of these two immune cells, leading to their immune failure. Although blockage of immune chokepoint such as PD1 receptor substantially alleviates T cell suppression, other extrinsic factors can also tolerate T cell and NK cells. There are a large number of TAMs locally in the tumor tissues. In advanced tumors, these TAMs usually have an immune inhibitory M2 state, reducing the function of anti-tumor immune cells. In this study, we found that the PDK1 is a key kinase for macrophage polarization. Myeloid-cell specific deletion of PDK1 can effectively promote M1 macrophage polarization, while prevent M2 polarization, thus reversing of anti-tumor dysfunction mediated by CD8+ T cells and NK cells in PyMT-induced spontaneous breast cancer. This study suggests that targeting PDK1 in macrophage is a potential strategy for immunotherapy of M2-bias tumors.
Using PyMT-induced breast cancer model, we previously found that tumor-intrinsic inactivation of PDK1 could significantly reduce the initiation, progression and metastasis of breast cancer,Citation46 strongly suggesting that PDK1 is considered as a therapeutic target for the treatment of breast cancer. Our current study found that the inactivation of PDK1 in macrophages could indirectly activate NK cells and CD8+ T cells and promote anti-tumor activity in breast cancer. Therefore, macrophage-targeted drug delivery of PDK1 inhibitors will avoid the systematic lethal risk and immunosuppression. PDK1 as a serine/threonine kinase is consider as a critical metabolic regulator connecting PI3K and downstream mTOR activation.Citation78 In current study, we found that PDK1 deletion could significantly reduce mTOR activation and energy consumption. We also provided some genetic evidence supporting that the deletion of mTOR, in particular mTORC1, could mimic the phenotype observed in PDK1-deleted mice. Therefore, we make hypothesis that the inactivation of PDK1 promotes M1 macrophage polarization and prevent M2 polarization possibly via down-regulating mTOR. However, in addition to AKT and downstream mTOR signaling pathways, there are a number of other PDK1 substrates. Further studies need to address whether mTOR-independent signaling are involved in the effect of PDK1 deletion on M1 macrophage polarization.
Macrophage polarization is closely related to metabolism. M1 macrophages are known to obtain energy through Hypoxia-inducible factor 1 (HIF-1)-mediated aerobic glycolysis.Citation79 In response to the tumor cell adaption to hypoxia, HIF-1regulates the transcription of pyruvate dehydrogenase kinase 1(PDK-1). PDK-1 phosphorylation inhibits pyruvate dehydrogenase, preventing pyruvate from being converted to acetyl-CoA, thereby making it no longer a viable substrate for the tricarboxylic acid (TCA) cycle.Citation80,Citation81 PDK-1 promotes polarization of M1 macrophages, inhibits polarization of M2 macrophages.Citation33
On the other hand, M2 macrophages obtain energy through fatty acid oxidation (FAO) and oxidative phosphorylation (OXPHOS) metabolism.Citation82,Citation83 M2 macrophage activation induces the expression of components of the electron transport chain that undergo oxidative phosphorylation and drive pyruvate into the Krebs cycle. Blocking oxidative metabolism not only blocks the M2 phenotype, but also enables macrophages to enter the M1 state. Similarly, the enhancement of the oxidative metabolism of M1 macrophages can also enhance its M2 phenotype.Citation35,Citation82 In addition, the pentose phosphate pathway is also more limited in M2 macrophages than in M1 macrophages. These key metabolic differences in different activated macrophages have been widely accepted, but the switches responsible for coordinating M1 versus M2 status at the molecular level are still largely unknown. Thus, how PDK1 regulates macrophage polarization at metabolic levels is for further study.
The exact role of the mTORC2 signaling pathway in macrophage differentiation and function is unclear. Limited research has shown that the conditional knockout of Rictor in myeloid cells maintains the integrity of M1 phenotype, thereby inhibiting the polarization of macrophages to the M2 phenotype.Citation84 In breast cancer, we found here that the disassociation of mTORC1 causes the polarization of M1macrophages. The lack of mTOR or Raptor recapitulates the effect of PDK1 deficiency on macrophage polarization, suggesting the role of mTORC1 in promoting M1 polarization and preventing M2 polarization. However, it is unclear whether mTORC2 is also involved in this process.
In summary, we demonstrate that the genetic deletion of PDK1 in myeloid cells significantly inhibit tumor growth and metastasis in spontaneous breast cancer model. PDK1 inactivation promotes M1 polarization, reversing the dysfunction of cytotoxic lymphocytes, including NK cells and CD8+ T cells.
Methods
Cell lines
The murine melanoma cell lines (B16F10, referred to as B16) was obtained from ATCC. For overexpression of GMCSF, B16 cells were infected with a pMSCV retrovirus expressing GMCSF cDNA or control neomycin resistance gene. Twenty-four hours later, cells were selected in complete RPMI-1640 media (10 mM glucose, 2 mM L-glutamine, 100 U/ml of penicillin-streptomycin and 10% FBS, Gibco™) containing G418 (3.0 mg/ml, Gibco™) and single clones were picked by limited dilution. The GMCSF-expression B16 cell line (referred as to B16-GMCSF) was used to enrich myeloid cells in the tumor. The cell lines have been mycoplasma tested.
Mice
PyMT transgenic, mTORfl/fl, Raptorfl/fl, LysM-Cre and DTASTOPCitation85 mouse was bought from Jackson Laboratory (stock number 002374). The Ncr1-Cre transgenic mouse was designed as previous described.Citation64 PDK1fl/fl mouse was kindly provided by D. Alessi, University of Dundee, Dundee, Scotland, UK. All mice were bred and maintained in specific pathogen-free animal facilities and all procedures involving animals were approved by the Animal Ethics Committee of Tsinghua University.
Reagent
Antibodies recognizing mouse CD3 (145–2C11), NKp46 (29A1.4), NK1.1 (PK136), CD4(GK1.5), CD8(53–6.7), Ly49A (A1), Ly49C/I (5E6), NKG2D (A10), Ly49G2 (eBio4D11), Ly49H (3D10), NKG2A (20D5), CD11b (M1/70), F4/80 (BM8), CD11C (N418), CD206 (C068C2, Biolegend), Gr1 (RB6-8C5), Ly6C (HK1.4), CD45 (30-F11), CD71 (R17217), CD98 (RL388), KLRG1(2F1,BD) and isotype controls were purchased from eBioscience or BD.
Preparation of macrophages from bone marrow and macrophage activation
Bone marrow cells were cultured for 7 days in the presence of L-929 cell supernatant containing monocyte-colony stimulating factor (M-CSF) in complete medium (RPMI-1640 medium containing 10 mM glucose, 2 mM L-glutamine, 100 U/ml of penicillin-streptomycin and 10% FBS). Macrophages at day 7 were washed and then stimulated for 24 h with lipopolysaccharide (100 ng/ml; Sigma), IL-4 (20 ng/ml; PeproTech), or IL-10 (20 ng/ml; PeproTech). Macrophages were then harvested and analyzed for the expression of M1 or M2-featured genes.
Isolation of tumor-infiltrating/tissue lymphoid cells
Mouse tumors were harvested, and minced with scissors before incubation with 2.4 mg/ml collagenase A RPMI-1640 (no fetal bovine serum) at 37°C for 2 h. Tumor samples were washed once with complete RPMI-1640 and purified on a Percoll gradient to eliminate tumor cells. Then the cells were washed again with complete RPMI-1640 and filtered through a 100-μm nylon filter (BD Biosciences) in RPMI-1640 supplemented with 10% FCS to generate single-cell suspensions. Cells from mouse spleens were collected by grinding spleens with frosted glass and filtered through 40-μm filters. After red blood cell (RBC) lysis (ACK Lysing Buffer, Lonza), all cells were washed and re-suspended in FACS buffer (PBS/2% albumin) for further use.
Ex vivo cell restimulation
For the detection of cytokine production, splenocytes or tumor-infiltrated lymphocytes were re-stimulated in vitro with phorbol 12-myristate 13-acetate (PMA, 50 ng/ml, Sigma-Aldrich) plus ionomycin (1 μg/mL, R & D Systems) for 5 h in the presence of Brefeldin A (7 mg/mL, Biolegend). Cells were surface stained with anti-CD45, anti-NKp46, anti-CD3, anti-CD8 or isotype-matched control antibody before fixation and permeablization (using kits from BD or eBioscience), which was followed by intracellular staining.
Flow cytometry
Cell surface markers were stained with antibodies from eBioscience or BD and 4ʹ,6-diamidino-2-phenylindole (DAPI, Life Technlogies). Intracellular staining of cytokines was conducted for NK cells and CD8 T cells. For detection of phosphorylated signaling proteins, macrophages were fixed with Phosflow Lyse/Fix buffer, followed by permeabilization with phosflow Perm buffer III (BD) and stained with anti-phospho-S6 and anti-phospho-AKT antibodies (Cell Signaling Technology). Flow cytometry data were collected by LSR Fortessa (BD, Biosciences) and analyzed using FlowJo software. Net mean fluorescence intensity (MFI) was calculated.
Realtime PCR
RNA was extracted with TRIzol (Invitrogen, Carlsbad, MA, USA) and cDNA was acquired by utilizing reverse transcription system (Promega, Madison, WI, USA). Quantitative PCR was performed using SYBR Green-based detection. The primer sequences are provided in Supplementary Table 1.
ELISA
Supernatants of tissue samples or peripheral blood serum were collected in triple, centrifuged at 3,000 g for 5 min. Then the supernatants were collected for ELISA. Cytokine concentration was determined using IL-10, TNFα, IL-6, IL-1β, and IFN-γ ELISA kits purchased from eBioscience.
Western blot
Proteins were extracted from peritoneal macrophages and BMDMs, and 40 μg of protein were separated by sodium dodecyl sulfate–polyacrylamide gel electrophoresis (SDS-PAGE). Then proteins were transferred to polyvinylidene difluoride (PVDF) membranes, reacted with primary and secondary antibodies and then developed by enhanced chemiluminescence according to standard methods.
Macrophage activation and depletion
For the in vivo macrophage activation, LPS (22 mg/kg body weight, Sigma-Aldrich) was intraperitoneally injected 48 hours after administration (i.p.) of anti-NK1.1 antibody (PK136, 100 μg/mouse, mouse IgG2a as control) for NK depletion, or directly intraperitoneally injected in DTASTOP/Ncr1-Cre mice, and then the survival of mice was detected. For the macrophage depletion, liposome clodronate (Clodrolip) was used. Mice were intraperitoneally injected with Clodrolip (200ul/20 g body weight, Clophosome®) or equivalent volumes of control liposome. 24 h later, LPS (5 mg/kg body weight) were intraperitoneally injected. After 24 h, mice were sacrificed for the experiments. For the serum cytokine detection, LPS (22 mg/kg body weight) were intraperitoneally injected to mice of the different genotypes. Then serum was collected to detect the cytokines at the indicated time points.
In vitro NK cell assays
For measurement of the IFN-γ production and CD107a induction, splenocytes from liposome and/or LPS treated mice mentioned before were cultured together with the same number of target cells, or precoated antibodies, or cytokines (recombinant mouse IL-12 (10 ng/ml), recombinant mouse IL-18 (10 ng/ml)) in the presence of GolgiStop (eBiosciences) and Alexa Fluor 647–conjugated anti-CD107a (eBioH4A3) or isotype-matched control antibody. After 6 h, cells were stained with anti-NKp46 antibody and then fixed and permeabilized with Cytofix/Cytoperm Buffer (eBiosciences). Cells were then stained with anti-IFN-γ (XMG1.2) or isotype-matched control antibody.
Lung metastasis measurements
For histological examination of the metastases, lungs were fixed in 4% paraformaldehyde, embedded in paraffin. Three sections (1.5 μm) at distinct parts of one lung sample were stained with H&E and scanned by light microscopy for metastatic foci. Photomicrographs of H&E-stained slides of lung metastases were analyzed with the Image J software (Bethesda, MD, USA). The ratio of metastatic surface/lung was calculated and analyzed.
In vivo tumor analyzes
The individual tumor volume was calculated as V (tumor) = πlw2/6. Individual tumor volumes were summed to give the total tumor volume for each mouse. Mice were assigned to groups based on genotype, normally the number of groups was 6–10 (n = 6–10).
Transplanted tumor challenge
On day 0 of the experiments, tumor cells were injected subcutaneously in the right flank. For the B16-GMCSF model, 2.5 × 10⁵ B16-GMCSF cells were injected into PDK1fl/fl or PDK1fl/fl/LysM-Cre mice. The date of the first positive diagnosis was taken as the date the first tumor was found, provided that the diagnosis was confirmed by the following week. Tumor volume was assessed every 3 days by measuring the length and width of individual tumors with a caliper.
Statistical analysis
Data were analyzed with Graphpad Prism software (version 5). Comparisons of two groups were calculated by one-way ANOVA or unpaired two-tailed Student’s t-tests. All the comparisons of survival curves were calculated by Log-rank (Mantel-Cox) Test. Pearson’s correlation coefficient was used to analyze the correlations. Differences with P values below 0.05 were considered significant. No randomization or exclusion of data points was used. Pilot in vivo studies were used for estimation of the sample size required to ensure adequate power.
Disclosure of potential conflicts of interest
No potential conflicts of interest were disclosed.
Supplemental Material
Download ()Supplementary material
Supplemental data for this article can be accessed on the publisher’s website.
Additional information
Funding
References
- Balkwill F, Charles KA, Mantovani A. Smoldering and polarized inflammation in the initiation and promotion of malignant disease. Cancer Cell. 2005;7:211–14. doi:10.1016/j.ccr.2005.02.013.
- Mantovani A, Sozzani S, Locati M, Allavena P, Sica A. Macrophage polarization: tumor-associated macrophages as a paradigm for polarized M2 mononuclear phagocytes. Trends Immunol. 2002;23:549–555. doi:10.1016/S1471-4906(02)02302-5.
- Guerra AD, Yeung OWH, Qi X, Kao WJ, Man K. The anti-tumor effects of M1 macrophage-loaded poly (ethylene glycol) and gelatin-based hydrogels on hepatocellular carcinoma. Theranostics. 2017;7:3732–3744. doi:10.7150/thno.20251.
- Wanderley CW, Colón DF, Luiz JPM, Oliveira FF, Viacava PR, Leite CA, Pereira JA, Silva CM, Silva CR, Silva RL, et al. Paclitaxel reduces tumor growth by reprogramming tumor-associated macrophages to an M1 profile in a TLR4-dependent manner. Cancer Res. 2018;78:5891–5900. doi:10.1158/0008-5472.CAN-17-3480.
- Travers M, Brown SM, Dunworth M, Holbert CE, Wiehagen KR, Bachman KE, Foley JR, Stone ML, Baylin SB, Casero RA, et al. DFMO and 5-azacytidine Increase M1 macrophages in the tumor microenvironment of murine ovarian cancer. Cancer Res. 2019;79:3445–3454. doi:10.1158/0008-5472.CAN-18-4018.
- Verreck FA, de Boer T, Langenberg DML, Hoeve MA, Kramer M, Vaisberg E, Kastelein R, Kolk A, de Waal-malefyt R, Ottenhoff THM, et al. Human IL-23-producing type 1 macrophages promote but IL-10-producing type 2 macrophages subvert immunity to (myco)bacteria. Proc Natl Acad Sci U S A. 2004;101:4560–4565. doi:10.1073/pnas.0400983101.
- Laoui D, Van Overmeire E, Di Conza G, Aldeni C, Keirsse J, Morias Y, Movahedi K, Houbracken I, Schouppe E, Elkrim Y, et al. Tumor hypoxia does not drive differentiation of tumor-associated macrophages but rather fine-tunes the M2-like macrophage population. Cancer Res. 2014;74:24–30. doi:10.1158/0008-5472.CAN-13-1196.
- Movahedi K, Laoui D, Gysemans C, Baeten M, Stange G, Van den Bossche J, Mack M, Pipeleers D, In’t Veld P, De Baetselier P, et al. Different tumor microenvironments contain functionally distinct subsets of macrophages derived from Ly6C(high) monocytes. Cancer Res. 2010;70(14):5728–5739. doi:10.1158/0008-5472.CAN-09-4672.
- Arnold JN, Magiera L, Kraman M, Fearon DT. Tumoral immune suppression by macrophages expressing fibroblast activation protein-alpha and heme oxygenase-1. Cancer Immunol Res. 2014;2:121–126. doi:10.1158/2326-6066.CIR-13-0150.
- Sica A, Mantovani A. Macrophage plasticity and polarization: in vivo veritas. J Clin Invest. 2012;122:787–795. doi:10.1172/JCI59643.
- Lewis CE, Pollard JW. Distinct role of macrophages in different tumor microenvironments. Cancer Res. 2006;66:605–612. doi:10.1158/0008-5472.CAN-05-4005.
- Gocheva V, Wang H-W, Gadea BB, Shree T, Hunter KE, Garfall AL, Berman T, Joyce JA. IL-4 induces cathepsin protease activity in tumor-associated macrophages to promote cancer growth and invasion. Genes Dev. 2010;24(3):241–255. doi:10.1101/gad.1874010.
- Su S, Liu Q, Chen J, Chen J, Chen F, He C, Huang D, Wu W, Lin L, Huang W, et al. A positive feedback loop between mesenchymal-like cancer cells and macrophages is essential to breast cancer metastasis. Cancer Cell. 2014;25(5):605–620. doi:10.1016/j.ccr.2014.03.021.
- Gordon S. Alternative activation of macrophages. Nat Rev Immunol. 2003;3:23–35. doi:10.1038/nri978.
- Valeta-Magara A, Gadi A, Volta V, Walters B, Arju R, Giashuddin S, Zhong H, Schneider RJ. Inflammatory breast cancer promotes development of M2 tumor-associated macrophages and cancer mesenchymal cells through a complex chemokine network. Cancer Res. 2019;79(13):3360–3371. doi:10.1158/0008-5472.CAN-17-2158.
- Elgert KD, Alleva DG, Mullins DW. Tumor-induced immune dysfunction: the macrophage connection. J Leukoc Biol. 1998;64:275–290. doi:10.1002/jlb.64.3.275.
- Mantovani A. From phagocyte diversity and activation to probiotics: back to Metchnikoff. Eur J Immunol. 2008;38:3269–3273. doi:10.1002/eji.200838918.
- Gordon S, Taylor PR. Monocyte and macrophage heterogeneity. Nat Rev Immunol. 2005;5:953–964. doi:10.1038/nri1733.
- Condeelis J, Pollard JW. Macrophages: obligate partners for tumor cell migration, invasion, and metastasis. Cell. 2006;124:263–266. doi:10.1016/j.cell.2006.01.007.
- Pollard JW. Tumour-educated macrophages promote tumour progression and metastasis. Nat Rev Cancer. 2004;4:71–78. doi:10.1038/nrc1256.
- Qian BZ, Pollard JW. Macrophage diversity enhances tumor progression and metastasis. Cell. 2010;141:39–51. doi:10.1016/j.cell.2010.03.014.
- Ruffell B, Chang-Strachan D, Chan V, Rosenbusch A, Ho CT, Pryer N, Daniel D, Hwang E, Rugo H, Coussens L, et al. Macrophage IL-10 blocks CD8+ T cell-dependent responses to chemotherapy by suppressing IL-12 expression in intratumoral dendritic cells. Cancer Cell. 2014;26(5):623–637. doi:10.1016/j.ccell.2014.09.006.
- Petty AJ, Li A, Wang X, Dai R, Heyman B, Hsu D, Huang X, Yang Y. Hedgehog signaling promotes tumor-associated macrophage polarization to suppress intratumoral CD8+ T cell recruitment. J Clin Invest. 2019;129(12):5151–5162. doi:10.1172/JCI128644.
- Palumbo JS, Talmage KE, Massari JV, La Jeunesse CM, Flick MJ, Kombrinck KW, Hu Z, Barney KA, Degen JL. Tumor cell-associated tissue factor and circulating hemostatic factors cooperate to increase metastatic potential through natural killer cell-dependent and-independent mechanisms. Blood. 2007;110:133–141. doi:10.1182/blood-2007-01-065995.
- Satoh T, Takeuchi O, Vandenbon A, Yasuda K, Tanaka Y, Kumagai Y, Miyake T, Matsushita K, Okazaki T, Saitoh T, et al. The Jmjd3-Irf4 axis regulates M2 macrophage polarization and host responses against helminth infection. Nat Immunol. 2010;11(10):936–944. doi:10.1038/ni.1920.
- Nawaz A, Aminuddin A, Kado T, Takikawa A, Yamamoto S, Tsuneyama K, Igarashi Y, Ikutani M, Nishida Y, Nagai Y, et al. CD206(+) M2-like macrophages regulate systemic glucose metabolism by inhibiting proliferation of adipocyte progenitors. Nat Commun. 2017;8:286. doi:10.1038/s41467-017-00231-1.
- Carretero R, Sektioglu IM, Garbi N, Salgado OC, Beckhove P, Hämmerling GJ. Eosinophils orchestrate cancer rejection by normalizing tumor vessels and enhancing infiltration of CD8+ T cells. Nat Immunol. 2015;16(6):609–617. doi:10.1038/ni.3159.
- Biswas SK, Mantovani A. Macrophage plasticity and interaction with lymphocyte subsets: cancer as a paradigm. Nat Immunol. 2010;11:889–896. doi:10.1038/ni.1937.
- Shaul ME, Bennett G, Strissel KJ, Greenberg AS, Obin MS. Dynamic, M2-like remodeling phenotypes of CD11c+ adipose tissue macrophages during high-fat diet–induced obesity in mice. Diabetes. 2010;59:1171–1181. doi:10.2337/db09-1402.
- Chan G, Bivins-Smith ER, Smith MS, Smith PM, Yurochko AD. Transcriptome analysis reveals human cytomegalovirus reprograms monocyte differentiation toward an M1 macrophage. J Immunol. 2008;181:698–711. doi:10.4049/jimmunol.181.1.698.
- Thapa B, Lee K. Metabolic influence on macrophage polarization and pathogenesis. BMB Rep. 2019;52:360–372. doi:10.5483/BMBRep.2019.52.6.140.
- Palsson-McDermott EM, Curtis A, Goel G, Lauterbach MR, Sheedy F, Gleeson L, van den Bosch MM, Quinn S, Domingo-Fernandez R, Johnston DW, et al. Pyruvate kinase M2 regulates Hif-1alpha activity and IL-1beta induction and is a critical determinant of the warburg effect in LPS-activated macrophages. Cell Metab. 2015;21:65–80. doi:10.1016/j.cmet.2014.12.005.
- Tan Z, Xie N, Cui H, Moellering DR, Abraham E, Thannickal VJ, Liu G. Pyruvate dehydrogenase kinase 1 participates in macrophage polarization via regulating glucose metabolism. J Immunol. 2015;194(12):6082–6089. doi:10.4049/jimmunol.1402469.
- Huang SC, Everts B, Ivanova Y, O’Sullivan D, Nascimento M, Smith AM, Beatty W, Love-Gregory L, Lam WY, O’Neill CM, et al. Cell-intrinsic lysosomal lipolysis is essential for alternative activation of macrophages. Nat Immunol. 2014;15(9):846–855. doi:10.1038/ni.2956.
- Rodriguez-Prados J-C, Través PG, Cuenca J, Rico D, Aragonés J, Martín-Sanz P, Cascante M, Boscá L. Substrate fate in activated macrophages: a comparison between innate, classic, and alternative activation. J Immunol. 2010;185(1):605–614. doi:10.4049/jimmunol.0901698.
- Mehla K, Singh PK. Metabolic regulation of macrophage polarization in cancer. Trends Cancer. 2019;5:822–834. doi:10.1016/j.trecan.2019.10.007.
- Niu Z, Shi Q, Zhang W, Shu Y, Yang N, Chen B, Wang Q, Zhao X, Chen J, Cheng N, et al. Caspase-1 cleaves PPARgamma for potentiating the pro-tumor action of TAMs. Nat Commun. 2017;8:766. doi:10.1038/s41467-017-00523-6.
- Palmieri EM, Menga A, Martín-Pérez R, Quinto A, Riera-Domingo C, De Tullio G, Hooper DC, Lamers WH, Ghesquière B, McVicar DW, et al. Pharmacologic or genetic targeting of glutamine synthetase skews macrophages toward an M1-like phenotype and inhibits tumor metastasis. Cell Rep. 2017;20(7):1654–1666. doi:10.1016/j.celrep.2017.07.054.
- Duvel K, Yecies JL, Menon S, Raman P, Lipovsky AI, Souza AL, Triantafellow E, Ma Q, Gorski R, Cleaver S, et al. Activation of a metabolic gene regulatory network downstream of mTOR complex 1. Mol Cell. 2010;39(2):171–183. doi:10.1016/j.molcel.2010.06.022.
- Maurer M, Su T, Saal LH, Koujak S, Hopkins BD, Barkley CR, Wu J, Nandula S, Dutta B, Xie Y, et al. 3-phosphoinositide-dependent kinase 1 potentiates upstream lesions on the phosphatidylinositol 3-kinase pathway in breast carcinoma. Cancer Res. 2009;69:6299–6306. doi:10.1158/0008-5472.CAN-09-0820.
- Gagliardi PA, Di Blasio L, Orso F, Seano G, Sessa R, Taverna D, Bussolino F, Primo L. 3-phosphoinositide-dependent kinase 1 controls breast tumor growth in a kinase-dependent but Akt-independent manner. Neoplasia. 2012;14(8):719–731. doi:10.1593/neo.12856.
- Zeng X, Xu H, Glazer RI. Transformation of mammary epithelial cells by 3-phosphoinositide-dependent protein kinase-1 (PDK1) is associated with the induction of protein kinase Calpha. Cancer Res. 2002;62:3538–3543.
- Xie Z, Yuan H, Yin Y, Zeng X, Bai R, Glazer RI. 3-phosphoinositide-dependent protein kinase-1 (PDK1) promotes invasion and activation of matrix metalloproteinases. BMC Cancer. 2006;6:77. doi:10.1186/1471-2407-6-77.
- Park SG, Schulze-Luehrman J, Hayden MS, Hashimoto N, Ogawa W, Kasuga M, Ghosh S. The kinase PDK1 integrates T cell antigen receptor and CD28 coreceptor signaling to induce NF-kappaB and activate T cells. Nat Immunol. 2009;10:158–166. doi:10.1038/ni.1687.
- Kang JA, Choi H, Yang T, Cho SK, Park Z-Y, Park S-G. PKCtheta-mediated PDK1 phosphorylation enhances T cell activation by increasing PDK1 stability. Mol Cells. 2017;40:37–44. doi:10.14348/molcells.2017.2236.
- Du J, Yang M, Chen S, Li D, Chang Z, Dong Z. PDK1 promotes tumor growth and metastasis in a spontaneous breast cancer model. Oncogene. 2016;35:3314–3323. doi:10.1038/onc.2015.393.
- Kawano Y, Nakae J, Watanabe N, Fujisaka S, Iskandar K, Sekioka R, Hayashi Y, Tobe K, Kasuga M, Noda T, et al. Loss of Pdk1-Foxo1 signaling in myeloid cells predisposes to adipose tissue inflammation and insulin resistance. Diabetes. 2012;61(8):1935–1948. doi:10.2337/db11-0770.
- De Henau O, Rausch M, Winkler D, Campesato LF, Liu C, Cymerman DH, Budhu S, Ghosh A, Pink M, Tchaicha J, et al. Overcoming resistance to checkpoint blockade therapy by targeting PI3Kgamma in myeloid cells. Nature. 2016;539:443–447. doi:10.1038/nature20554.
- Han Q, Shi H, Liu F. CD163(+) M2-type tumor-associated macrophage support the suppression of tumor-infiltrating T cells in osteosarcoma. Int Immunopharmacol. 2016;34:101–106. doi:10.1016/j.intimp.2016.01.023.
- Liu L, Yi H, He H, Pan H, Cai L, Ma Y. Tumor associated macrophage-targeted microRNA delivery with dual-responsive polypeptide nanovectors for anti-cancer therapy. Biomaterials. 2017;134:166–179. doi:10.1016/j.biomaterials.2017.04.043.
- Guy CT, Cardiff RD, Muller WJ. Induction of mammary tumors by expression of polyomavirus middle T oncogene: a transgenic mouse model for metastatic disease. Mol Cell Biol. 1992;12:954–961. doi:10.1128/mcb.12.3.954.
- He J, Wang Y, Liu T, Liu G, Chen S, Li Q, Quan Y, Yang H, Feng J, Wang S, et al. Stage-specific requirement of kinase PDK1 for NK cells development and activation. Cell Death Differ. 2019;26:1918–1928. doi:10.1038/s41418-018-0263-8.
- Chen S, Yang M, Du J, Li D, Li Z, Cai C, Ma Y, Zhang L, Tian Z, Dong Z, et al. The self-specific activation receptor SLAM family is critical for NK cell education. Immunity. 2016;45(2):292–304. doi:10.1016/j.immuni.2016.07.013.
- Zhang X, Feng J, Chen S, Yang H, Dong Z. Synergized regulation of NK cell education by NKG2A and specific Ly49 family members. Nat Commun. 2019;10:5010. doi:10.1038/s41467-019-13032-5.
- Shrivastava R, Shukla N. Attributes of alternatively activated (M2) macrophages. Life Sci. 2019;224:222–231. doi:10.1016/j.lfs.2019.03.062.
- Zhu L, Zhao Q, Yang T, Ding W, Zhao Y. Cellular metabolism and macrophage functional polarization. Int Rev Immunol. 2015;34:82–100. doi:10.3109/08830185.2014.969421.
- Marsee DK, Pinkus GS, Yu H. CD71 (transferrin receptor): an effective marker for erythroid precursors in bone marrow biopsy specimens. Am J Clin Pathol. 2010;134:429–435. doi:10.1309/AJCPCRK3MOAOJ6AT.
- Habashy HO, Powe DG, Staka CM, Rakha EA, Ball G, Green AR, Aleskandarany M, Paish EC, Douglas Macmillan R, Nicholson RI, et al. Transferrin receptor (CD71) is a marker of poor prognosis in breast cancer and can predict response to tamoxifen. Breast Cancer Res Treat. 2010;119:283–293. doi:10.1007/s10549-009-0345-x.
- Daniels TR, Delgado T, Rodriguez JA, Helguera G, Penichet ML. The transferrin receptor part I: biology and targeting with cytotoxic antibodies for the treatment of cancer. Clin Immunol. 2006;121:144–158. doi:10.1016/j.clim.2006.06.010.
- Cantor JM, Ginsberg MH. CD98 at the crossroads of adaptive immunity and cancer. J Cell Sci. 2012;125:1373–1382. doi:10.1242/jcs.096040.
- Nicklin P, Bergman P, Zhang B, Triantafellow E, Wang H, Nyfeler B, Yang H, Hild M, Kung C, Wilson C, et al. Bidirectional transport of amino acids regulates mTOR and autophagy. Cell. 2009;136:521–534. doi:10.1016/j.cell.2008.11.044.
- Ip H, Sethi T. CD98 signals controlling tumorigenesis. Int J Biochem Cell Biol. 2016;81:148–150. doi:10.1016/j.biocel.2016.11.005.
- Wang F, Meng M, Mo B, Yang Y, Ji Y, Huang P, Lai W, Pan X, You T, Luo H, et al. Crosstalks between mTORC1 and mTORC2 variagate cytokine signaling to control NK maturation and effector function. Nat Commun. 2018;9(1):4874. doi:10.1038/s41467-018-07277-9.
- Yang M, Li D, Chang Z, Yang Z, Tian Z, Dong Z. PDK1 orchestrates early NK cell development through induction of E4BP4 expression and maintenance of IL-15 responsiveness. J Exp Med. 2015;212(2):253–265. doi:10.1084/jem.20141703.
- Sinclair LV, Rolf J, Emslie E, Shi Y-B, Taylor PM, Cantrell DA. Control of amino-acid transport by antigen receptors coordinates the metabolic reprogramming essential for T cell differentiation. Nat Immunol. 2013;14(5):500–508. doi:10.1038/ni.2556.
- Cibrian D, Saiz ML, de la Fuente H, Sánchez-Díaz R, Moreno-Gonzalo O, Jorge I, Ferrarini A, Vázquez J, Punzón C, Fresno M, et al. CD69 controls the uptake of L-tryptophan through LAT1-CD98 and AhR-dependent secretion of IL-22 in psoriasis. Nat Immunol. 2016;17:985–996. doi:10.1038/ni.3504.
- Loftus RM, Assmann N, Kedia-Mehta N, O’Brien KL, Garcia A, Gillespie C, Hukelmann JL, Oefner PJ, Lamond AI, Gardiner CM, et al. Amino acid-dependent cMyc expression is essential for NK cell metabolic and functional responses in mice. Nat Commun. 2018;9:2341. doi:10.1038/s41467-018-04719-2.
- Saxton RA, Sabatini DM. mTOR signaling in growth, metabolism, and disease. Cell. 2017;168:960–976. doi:10.1016/j.cell.2017.02.004.
- Powell JD, Pollizzi KN, Heikamp EB, Horton MR. Regulation of immune responses by mTOR. Annu Rev Immunol. 2012;30:39–68. doi:10.1146/annurev-immunol-020711-075024.
- Kim J, Guan KL. mTOR as a central hub of nutrient signalling and cell growth. Nat Cell Biol. 2019;21:63–71. doi:10.1038/s41556-018-0205-1.
- Lesokhin AM, Hohl TM, Kitano S, Cortez C, Hirschhorn-Cymerman D, Avogadri F, Rizzuto GA, Lazarus JJ, Pamer EG, Houghton AN, et al. Monocytic CCR2(+) myeloid-derived suppressor cells promote immune escape by limiting activated CD8 T-cell infiltration into the tumor microenvironment. Cancer Res. 2012;72:876–886. doi:10.1158/0008-5472.CAN-11-1792.
- Ugel S, De Sanctis F, Mandruzzato S, Bronte V. Tumor-induced myeloid deviation: when myeloid-derived suppressor cells meet tumor-associated macrophages. J Clin Invest. 2015;125:3365–3376. doi:10.1172/JCI80006.
- Gabrilovich D. Mechanisms and functional significance of tumour-induced dendritic-cell defects. Nat Rev Immunol. 2004;4:941–952. doi:10.1038/nri1498.
- Burga RA, Thorn M, Point GR, Guha P, Nguyen CT, Licata LA, DeMatteo RP, Ayala A, Joseph Espat N, Junghans RP, et al. Liver myeloid-derived suppressor cells expand in response to liver metastases in mice and inhibit the anti-tumor efficacy of anti-CEA CAR-T. Cancer Immunol Immunother. 2015;64:817–829. doi:10.1007/s00262-015-1692-6.
- Kohanbash G, McKaveney K, Sakaki M, Ueda R, Mintz AH, Amankulor N, Fujita M, Ohlfest JR, Okada H. GM-CSF promotes the immunosuppressive activity of glioma-infiltrating myeloid cells through interleukin-4 receptor-alpha. Cancer Res. 2013;73:6413–6423. doi:10.1158/0008-5472.CAN-12-4124.
- Ivanova A, Signore M, Caro N, Greene NDE, Copp AJ, Martinez-Barbera JP. In vivo genetic ablation by cre-mediated expression of diphtheria toxin fragment A. Genesis. 2005;43:129–135. doi:10.1002/gene.20162.
- Alter G, Malenfant JM, Altfeld M. CD107a as a functional marker for the identification of natural killer cell activity. J Immunol Methods. 2004;294:15–22. doi:10.1016/j.jim.2004.08.008.
- Finlay DK, Rosenzweig E, Sinclair LV, Feijoo-Carnero C, Hukelmann JL, Rolf J, Panteleyev AA, Okkenhaug K, Cantrell DA. PDK1 regulation of mTOR and hypoxia-inducible factor 1 integrate metabolism and migration of CD8+ T cells. J Exp Med. 2012;209:2441–2453. doi:10.1084/jem.20112607.
- Cramer T, Yamanishi Y, Clausen BE, Förster I, Pawlinski R, Mackman N, Haase VH, Jaenisch R, Corr M, Nizet V, et al. HIF-1alpha is essential for myeloid cell-mediated inflammation. Cell. 2003;112:645–657. doi:10.1016/s0092-8674(03)00154-5.
- Kim JW, Tchernyshyov I, Semenza GL, Dang CV. HIF-1-mediated expression of pyruvate dehydrogenase kinase: a metabolic switch required for cellular adaptation to hypoxia. Cell Metab. 2006;3:177–185. doi:10.1016/j.cmet.2006.02.002.
- Papandreou I, Cairns RA, Fontana L, Lim AL, Denko NC. HIF-1 mediates adaptation to hypoxia by actively downregulating mitochondrial oxygen consumption. Cell Metab. 2006;3:187–197. doi:10.1016/j.cmet.2006.01.012.
- Vats D, Mukundan L, Odegaard JI, Zhang L, Smith KL, Morel CR, Greaves DR, Murray PJ, Chawla A. Oxidative metabolism and PGC-1beta attenuate macrophage-mediated inflammation. Cell Metab. 2006;4:13–24. doi:10.1016/j.cmet.2006.05.011.
- Chawla A. Control of macrophage activation and function by PPARs. Circ Res. 2010;106:1559–1569. doi:10.1161/CIRCRESAHA.110.216523.
- Hallowell RW, Collins SL, Craig JM, Zhang Y, Oh M, Illei PB, Chan-Li Y, Vigeland CL, Mitzner W, Scott AL, et al. mTORC2 signalling regulates M2 macrophage differentiation in response to helminth infection and adaptive thermogenesis. Nat Commun. 2017;8:14208. doi:10.1038/ncomms14208.
- Srinivas S, Watanabe T, Lin C-S, William CM, Tanabe Y, Jessell TM, Costantini F. Cre reporter strains produced by targeted insertion of EYFP and ECFP into the ROSA26 locus. BMC Dev Biol. 2001;1:4. doi:10.1186/1471-213X-1-4.