
ABSTRACT
Tumor escape is often associated with abnormalities in the surface expression of the human leukocyte antigen class I (HLA-I) antigens thereby limiting CD8+ cytotoxic T cell responses. This impaired HLA-I surface expression can be mediated by deficient expression of components of the antigen processing and presentation machinery (APM) due to epigenetic, transcriptional and/or post-transcriptional processes. Since a discordant mRNA and protein expression pattern of APM components including the peptide transporter associated with antigen processing 1 (TAP1) has been frequently described in tumors of distinct origin, a post-transcriptional control of APM components caused by microRNAs (miR) was suggested. Using an in silico approach, miR-200a-5p has been identified as a candidate miR binding to the 3ʹ untranslated region (UTR) of TAP1. Luciferase reporter assays demonstrated a specific binding of miR-200a-5p to the TAP1 3ʹ-UTR. Furthermore, the miR-200a-5p expression is inversely correlated with the TAP1 protein expression in HEK293T cells and in a panel of melanoma cell lines as well as in primary melanoma lesions. High levels of miR-200a-5p expression were associated with a shorter overall survival of melanoma patients. Overexpression of miR-200a-5p reduced TAP1 levels, which was accompanied by a decreased HLA-I surface expression and an enhanced NK cell sensitivity of melanoma cells. These data show for the first time a miR-mediated control of the peptide transporter subunit TAP1 in melanoma thereby leading to a reduced HLA-I surface expression accompanied by an altered immune recognition and reduced patients’ survival.
Abbreviations
Ab: antibody; ACTB: β-actin; APM: antigen processing and presentation machinery; ATCC: American tissue culture collection; β2-m: β2-microglobulin; BSA: bovine serum albumin; CTL: cytotoxic T lymphocyte; FCS: fetal calf serum; FFL: firefly luciferase; FFPE: formalin-fixed paraffin-embedded; GAPDH: glyceraldehyde-3-phosphate dehydrogenase; HC: heavy chain; HLA: human leukocyte antigen; HLA-I: HLA class I; HRP: horseradish peroxidase; IFN: interferon; im-miR: immune modulatory miRNA; LMP: low molecular weight protein; luc: luciferase; MFI: mean fluorescence intensity; MHC: major histocompatibility complex; miR: microRNA; NC: negative control; NK: natural killer; NSCLC: non-small cell lung carcinoma; OS: overall survival; PBMC: peripheral blood mononuclear cells; RBP: RNA-binding proteins; RL: Renilla; RLU: relative light units; TAP: transporter associated with antigen processing; tpn: tapasin; UTR: untranslated region.
Introduction
The immune system operates as a significant barrier to tumor formation and progressionCitation1 mediated by the innate and adaptive immune system, which significantly contributes to immune surveillance and thus to tumor eradication.Citation2,Citation3 However, tumor cells often develop escape strategies including human leukocyte antigen class I (HLA-I) alterations. The physiologic function of HLA-I and components of the antigen processing and presentation machinery (APM) is required for T cell-mediated anti-tumor or anti-viral immunity. In contrast, tumor survival indicates a failure of the host immune surveillance, which is often associated with a dysfunction in the HLA-I antigen presentation.Citation4 This is mainly mediated by an impaired expression of HLA-I APM components, which is accompanied by disease progression, reduced patients’ survival as well as a diminished recognition by CD8+ cytotoxic T lymphocytes (CTLs).Citation5,Citation6 During the last years, a number of studies revealed that defects in the HLA-I APM component expression is mainly caused by deregulation rather than by structural alterations of these moleculesCitation7-Citation9 and is associated with a reduced HLA-I surface expression.Citation10 Although a transcriptional downregulation of HLA-I APM components frequently occurs in tumor cells, a post-transcriptional control of these molecules has been recently suggested due to altered expression of small non-coding microRNAs (miRs) or RNA-binding proteins (RBPs).Citation11
MiRs have a length of approximately 20–23 nucleotides and play important roles as fine tuners in animals and plants by pairing to the mRNAs of protein-coding genes to direct their post-transcriptional repression in normal and cancer cells.Citation12 This is mediated by their binding to the 3' untranslated region (UTR) of the targeted mRNA thereby preventing its translation or inducing its degradation.Citation13 Many miRs are abnormally expressed in hematologic and solid tumorsCitation14 including melanoma. MiRs could act as oncogenes or tumor suppressor genes, which influence tumor formation, infiltration, metastasis formation and disease progression.Citation15 Recent evidence supports the deregulation of miRs controlling signal transduction cascades, such as e.g. PI3K/AKT or RAS/MAPK pathways, but also of other cellular processes including immune modulation.Citation16 Indeed, miRs could be involved in the escape from immune surveillance or altered immune responses by affecting the expression of different immune modulatory molecules in tumor and immune cells.Citation11 The characterization of miRs involved in immune evasion mechanisms might contribute to a better understanding of the development and progression of tumors.Citation17 These deregulated miRs might also improve patients’ prognostic classification and provide new diagnostic and therapeutic tools.
Using distinct strategies, like e.g. in silico prediction, miR arrays, small RNA sequencing, RNA affinity approaches and luciferase (luc) reporter gene assays, we and others have identified a number of immune modulatory miRs (im-miRs).Citation11,Citation18,Citation19 These include members of the miR-148/-152 family, which have been shown to post-transcriptionally regulate the classical HLA-A, -B and -C molecules as well as the non-classical HLA-G antigen.Citation20-Citation25 Despite their emerging role as fine tuners in the regulation of anti-tumoral immune responses, there exists limited information about miRs suppressing components of the HLA-I APMCitation20,Citation26 in cancer cells.
So far, only a small number of im-miRs affecting APM components, and in particular the transporter associated with antigen processing 1 (TAP1), have been identified.Citation27-Citation29 For example, the mimic-based overexpression of the tumor suppressive miR-9 in nasopharyngeal carcinoma exerts a broad effect on many well-known interferon (IFN)-induced genes of the HLA-I APM pathway. TAP1, β2-microglobulin (β2-m), the proteasome subunits PSMB8 and PSMB10, the classical HLA-B, HLA-C antigens as well as the non-classical HLA-F antigen were up-regulated at the mRNA level by miR-9.Citation29Despite details about the underlying mechanisms of this deregulation remain unknown, it appears to occur indirectly. Furthermore, overexpression of the ER stress-induced miR-346 in Calu-3 and HeLa cells resulted in a reduced TAP1 mRNA expression, which correlated with decreased expression of major histocompatibility complex (MHC) class I surface antigens.Citation28
Based on these results it was postulated that the post-transcriptional downregulation of HLA-I pathway in tumors might be controlled by the expression of APM component-specific miRs. This study identified and characterized miR-200a-5p as a regulator of TAP1 expression in human melanoma cells, which was accompanied by a decreased HLA-I surface expression and an increased NK cell response. Furthermore, miR-200a-5p expression was inversely correlated to TAP1 expression in melanoma lesions, which was associated with a worse patients’ outcome.
Materials and methods
Cell lines and cell culture conditions
The human embryonic kidney cell line HEK293T was obtained from the American Tissue Culture Collection (ATCC), the human melanoma cell lines FM3 (ESTDAB-007) and FM81 (ESTDAB-026) from the European Searchable Tumor Cell Line and Data Bank (ESTDAB project; www.ebi.ac.uk/ipd/estdab)Citation30,Citation31 and BUF1379 from Soldano Ferrone (Department of Surgery, Massachusetts General Hospital, Harvard Medical School, Boston, USA). The HEK293T cells were cultured in Dulbecco’s Modified Eagles Medium (DMEM, Invitrogen, California, USA), while the melanoma cells were maintained in Roswell Park Memorial Institute 1640 medium (RPMI 1640, Invitrogen) supplemented with 10% (v/v) fetal calf serum (FCS) (PAN, Aidenbach, Germany), 2 mM L-glutamine (Lonza, Basel, Switzerland) and 1% penicillin/streptomycin (v/v, Sigma-Aldrich, Missouri, USA) at 37°C in 5% (v/v) CO2 humidified air. For IFN-γ treatment, the cell lines were cultured in the presence of recombinant 200 U/mL IFN-γ (PAN) for 24 h or 48 h, respectively.
Human melanoma tissues
Tissue samples from cutaneous malignant melanoma (n = 26) were collected between 2008 and 2016 in the Department of Dermatology of the University Hospital of Zurich, Zurich, SwitzerlandCitation32 and the University Hospital in Salzburg, Austria. The study was performed according to the declaration of Helsinki and approved by the ethical committees of the University Hospital in Zurich (KEK-ZH-No. 647 and 800) as well as of the University Hospital in Salzburg (E-Nr. 2142). The clinical data from the melanoma patients as well as the PD-L1 expression and immune cell infiltration of the tumor lesions are available.
Cloning of the miR expression vector
The miR-200a-5p expression vector was generated by cloning of miR-200a-5p into the multiple cloning site of the pmRm-cherry vector (Clontech, Mountain View, CA, USA) as previously described.Citation23 The used oligonucleotides are listed in the Supplementary Table S1.
Isolation of cellular RNA, miR and qPCR analysis
Total cellular RNA and miR from tissue cultures were isolated using the NucleoSpin RNA kit (Macherey Nagel, Schkeuditz, Germany) or the TRIzol reagent (Invitrogen) according to the manufacturer’s instructions, respectively. For RNA isolation from paraffin-embedded tissue sections, total RNA was extracted using the NucleoSpin Tissue kit (Macherey Nagel) according to the manufacturers’ protocol. The RNA was treated with DNaseI (New England Biolabs (NEB), Ipswich, MA, USA) for 30 min at 37 °C, inactivated with 50 mM EDTA for 10 min at 75°C and then served as template for cDNA synthesis.
Reverse transcribed quantitative PCR (RT-qPCR) was performed as previously described.Citation31,Citation33 Briefly, RNA was reversed transcribed into cDNA using RevertAidTM H Minus First Strand cDNA synthesis kit (Thermo Scientific, Waltham, Massachusetts, USA). For miR specific cDNA synthesis, miR specific stem loop primers where usedCitation33,Citation34 (Supplementary Table S1) whereas for the reverse transcription reaction of mRNA, oligo dT primers (Thermo Scientific) were used. For RT-qPCR reaction, the 2x SYBR Green qPCR Master Mix (Absource, Munich, Germany) was employed with target-specific primers (Supplementary Table S1). The reverse transcription reactions were carried out in a 96-well labcycler (Sensoquest, Göttingen, Germany) and the qPCR reactions in a BIO-RAD 96-well iCycler (BIO-RAD Laboratories, Inc., Hercules, CA, USA) for quantifying the expression of miRs and mRNAs. For qPCR, relative changes of RNA abundance were determined by the ΔCT method using the house-keeping genes glyceraldehyde-3-phosphate dehydrogenase (GAPDH), β-actin (ACTB) or delta-aminolevulinate synthase 1 (ALAS1) for normalization, whereas the relative miR expression levels were normalized to corresponding expression levels of the non-coding RNA RNU6A. The absolute copy numbers of miRs in the plasmid transfectants were determined by an external miR-specific TOPO-TA plasmid standards (Invitrogen Cat. no. K4510–22) generated by cloning the respective stem-loop PCR product of the miR of interest into this plasmid.Citation23 The reactions were performed at least in triplicates of biological replicates.
Protein extraction and Western blot analysis
For Western blot analysis, 50 μg protein/lane was separated in 10% SDS-PAGE gels, transferred onto nitrocellulose membranes (Schleicher & Schuell, Munich, Germany) and stained with Ponceau S as previously described.Citation35 Immune detection was performed with the following APM-specific primary antibodies (Ab): anti-TAP1 (ab13516, Abcam, Cambridge, United Kingdom), anti-TPN (ab13518, Abcam) and anti-TAP2, anti-MHC class I heavy chain (HC), anti-LMP2 and anti-LMP10, kindly provided by Soldano Ferrone. Staining with anti-GAPDH (Cell Signaling Technology) served as loading control. The membranes were then stained with suitable horseradish peroxidase (HRP)–conjugated secondary antibodies (DAKO, Hamburg, Germany or Cell Signaling Technology, Danvers, USA), before the signal was visualized with the Pierce Western Blot Signal Enhancer substrate (Thermo Scientific) and recorded with a LAS3000 camera system (Fuji LAS3000, Fuji GmbH, Düsseldorf) using the Image Reader LAS3000 software. The immunostaining signals were subsequently analyzed using the ImageJ software (NIH, Bethesda, MD). Relative protein expression levels are provided as arbitrary units by setting the peak values of the corresponding GAPDH signals to 1.
Luciferase reporter assay
The TAP1 3ʹ-UTR was cloned in the pmiR-Glo Dual-Luciferase miR target expression vector (Promega, Madison, Washington, USA) with the restriction enzymes NheI and SalI (Thermo Scientific). For the deletion of the binding side of miR-200a-5p on the TAP1 3ʹ-UTR, specific primers were designed according to the NeBaseChanger software (https://nebasechanger.neb.com/, NEB) and the Q5® Site-Directed Mutagenesis kit (NEB) was employed according to manufacturer’s instructions. On day zero, 1 × 10⁴ HEK293T cells were seeded into 96-well plates. After 12–16 h, the cells were co-transfected with 30 nM miR mimics and 5 ng TAP1 3ʹ-UTR pmiR-Glo vector using Lipofectamin 2000 (Invitrogen). The cells were washed with phosphate-buffered saline (PBS) 48 h post-transfection and lysed in lysis buffer (Promega). The firefly and renilla luciferase (luc) activities were determined using the DualGlo reagent (Promega) with the GloMax 96-Microplate luminometer (Promega) kindly provided by G. Posern (Institute of Biophysical Chemistry, Martin Luther University Halle-Wittenberg, Halle (Saale), Germany) with the Dual-Luciferase® Reporter Assay System (Promega) according to manufacturer’s instructions. Firefly luciferase (FFL) activities were internally normalized by Renilla (RL) activities yielding relative light units (RLU). An empty vector only containing the multiple cloning site served as negative control. RLU ratios were normalized to control populations. All experiments were performed at least three times in triplicates.
Transfection of miRs
To determine the impact of miRs on the expression and function of APM components, 3 × 10⁵ cells/well were seeded in 6-well plates and transiently transfected after 12–16 h with 30 nM mimics (miR-200a-5p or the mimic negative control (NC; Qiagen, Hilden, Germany) using 9 μL Lipofectamine RNAiMAX (Invitrogen) or with 2 μg/mL plasmids (miR expression or empty vector) using Effectene (Qiagen), according to the manufacturer’s instructions. The cells were harvested 48 h post-transfection for subsequent RNA, Western blot and flow cytometric analyses.
Flow cytometry
The antibodies (Abs) employed for flow cytometry were the PE-Cyanine7-labeled-anti-HLA-ABC (BioLegend, California, US), the APC-labeled-anti-HLA-BC (BioLegend), the unconjugated anti-HLA-A2 (kindly provided by Soldano Ferrone) and the PE-labeled-secondary goat anti-mouse Ab (Jackson ImmunoResearch, Cambridgeshire, UK). Flow cytometry was performed as previously described.Citation36 Briefly, 1–5 × 10⁵ cells were incubated with the appropriate amounts of antibodies at 4 °C in darkness for 30 min. The stained cells were further stained with propidium iodide (Biolegend), measured on a BD FACS LSRFortessa (Becton Dickinson (BD), New Jersey, USA) and subsequently analyzed with the FACS Diva analysis software (BD). The data are expressed as mean specific fluorescence intensities (MFI).
CD107a degranulation assay
Tumor cell susceptibility to NK cells was evaluated by a CD107a degranulation assay.Citation37,Citation38 Briefly, total peripheral blood mononuclear cells (PBMCs) were stimulated for 18 h with IL-12 (Immunotools), IL-15 (Immunotools) and IL-18 (Biovision) and then co-incubated at a 1:1 ratio with target cells at 37°C. After one hour of incubation, the APC-anti-CD107a Ab (Biolegend) was added and after additionally 3 h the effector cells were stained with anti-CD3, anti-CD16 (both from Biolegend) and anti-CD56 Ab (Thermo Scientific), before cells were analyzed by flow cytometry. The experiments were performed with PBMCs from at least three different donors. The data are expressed as percentage of CD107a positive NK cells after subtraction of the spontaneous degranulation obtained by incubating the effector cells in the absence of any target. Daudi cells served as controls to evaluate NK cell functionality (data not shown).
Immunohistochemical staining of the paraffin-embedded tissue sections of melanoma patients
Formalin-fixed paraffin-embedded (FFPE) tumor samples were processed and analyzed in collaboration with the Department of Dermatology of the University Hospitals in Zurich (Switzerland) and Salzburg (Austria). 4 µm thickness sections were cut from each FFPE tissue block. After deparaffinization in xylene and rehydration in decreasing concentrations of ethanol, tumor sections were boiled for epitope retrieval in pre-heated buffers in a pressure cooker for 40 min.
Thereafter, sections were cooled for 20 min and rinsed with deionized water. If necessary, endogenous peroxidases were blocked with 3% H2O2 solution for 10 min. Further staining steps were performed using the Dako Autostainer Plus platform (Agilent Technologies Inc., Santa Clara, USA) and have been described elsewhere in detail.Citation32
Immunohistochemical stains were evaluated by three independent dermatopathologists. A consensus-based score was derived for every single evaluation. Cell count was estimated by averaging at least ten high powered fields (HPF, 400x magnification) representative of the entire tumor. Expression of TAP1 in tumor cells was graded into four categories regarding the frequency (0%, 1–10%, 11–30%, >30%). For the present study, TAP1high (>30 %) and TAP1low (0–10 %) lesions were processed.
Bioinformatics – survival analysis
In silico analysis was performed using the R2 web tool (http://r2.amc.nl) in order to predict the association of the expression of miR-200a-5p, TAP1 and HLA-I molecules with the survival of metastatic melanoma patients. The statistical differences in the gene expression values between the patients’ groups with ‘high’ and ‘low’ mRNA expression levels were evaluated by ANOVA tests implemented in the R2 web tool. The p-values were corrected for multiple testing according to the false discovery rate. All cutoff expression levels and their resulting groups were correlated with the patients’ survival and used for the generation of the Kaplan-Meier curves, which allowed to discriminate patients into ‘good’ and ‘bad’ prognosis cohorts. Kaplan Meier analysis was performed to estimate the disease specific survival probability and distant metastasis free survival probability according to mRNA expression status using this tool.
For this reason, the “R2: Tumor Melanoma – Jöhnsson – 214 – custom – ilmnht12v4”Citation39 dataset was chosen and 214 unique metastatic melanoma patients were included for the analysis. Total RNA was extracted from fresh-frozen melanoma tumors and genome-wide expression profiling was performed using Illlumina Human HT-12V4.0 BeadChip arrays by standard methods and after removal of replicate samples, 214 unique melanoma samples were analyzed. For determination of high and low expression of TAP1, HLA-A and miR-200a, the cutoff modus “median” divided the patients into two groups containing the same number of patients. The raw p-value significance was calculated for every graph with the web database. Correlation of miR-200a expression with TAP1 and HLA-A was determined with the same dataset. Pearson’s correlation was calculated with the transform 2log setting. The 2log expression ratio was compared and a linear regression was calculated. The expression pattern of TAP1 and HLA-I molecules were compared to that of miR-200a and correlated to the clinical parameters. A p-value < 0.05 was considered as significant.
Statistical analysis
Microsoft Excel 2010 (Microsoft Corporation), SPSS version 15.0 and GraphPad Prism version 8 were used for analysis and a p-value < 0.05 was considered statistically significant using the t test.
Results
Heterogeneous expression of HLA class I components in melanoma cell lines
A large panel of melanoma cell lines (n = 42) has been previously analyzed for the mRNA and/or protein expression of TAP1 and HLA-I heavy chain (HC) and/or HLA-I surface expression. Based on their “APM score” and/or on their HLA-I surface expression in comparison to melanocyte samples, the melanoma cell lines were categorized into three groups named high, intermediate and low expressors (). The HLA-I APM score represents the sum of TAP1, TAP2, tapasin (TPN), β2-m and HLA-ABC mRNA or protein expression levels normalized to housekeeper genes/proteins. A low, intermediate and high APM score was detected at the mRNA level in 40.38%, 33.33% and 26.19% of the melanoma cell lines when compared to the melanocyte samples (), respectively, while a low, intermediate and high APM score was found in 38.11%, 21.43% and 40.48% of the melanoma cell lines at the protein level relative to melanocytes (), respectively. The mRNA levels of the HLA-I APM components were quantified using reverse transcribed quantitative PCR (RT-qPCR) and compared with the protein expression data obtained by Western blot analysis for the different melanoma cell lines. When compared to melanocytes, lower, intermediate and higher HLA-I surface expression was found in 45.24%, 26.19% and 28.57% of melanoma cell lines, respectively (). This was accompanied by a heterogeneous, but often statistically significant reduced mRNA and/or protein expression of APM components and HLA-I HC in melanoma cell lines. The impaired APM component expression was mainly due to deregulation of these molecules, since it could be upregulated by IFN-γ (Supplementary Figure S1). Based on their profiles, three melanoma cell lines BUF1379, FM3 and FM81 belonging to the high, intermediate and low HLA-I APM expressor categories, respectively, were selected for further analyses.
Figure 1. Characterization of the expression of HLA-I APM components in melanoma cell lines.
Clinical relevance of TAP1 and HLA-I molecules with survival of metastatic melanoma patients
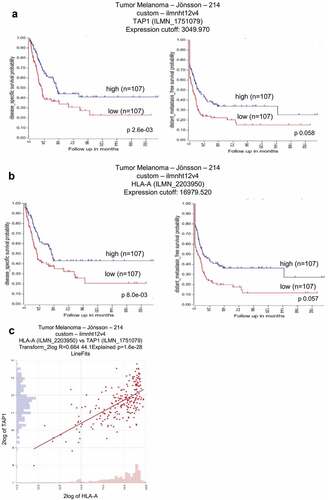
Independent studies reported an association of a decreased expression of TAP1 and HLA-I molecules (HLA-A, HLA-B and HLA-C) with poor prognosis in several cancer types including melanoma. This was reevaluated using the dataset “R2: Tumor Melanoma – Jöhnsson – 214 – custom – ilmnht12v4”Citation39 available at the R2 genomics analysis and visualization platform (http://r2.amc.nl) in order to determine the prognostic relevance of TAP1 and HLA–I molecules (HLA-A, HLA-B and HLA-C) expression patterns in 214 melanoma patients.
As shown in , higher TAP1 and HLA-A mRNA transcript levels were correlated with an increased disease specific survival probability and higher distant metastasis free survival probability (,) linking higher TAP1 and HLA-I levels with a better survival of metastatic melanoma patients. In particular the TAP1 expression was significantly correlated with the HLA-A mRNA level ().
Figure 2. Correlation of TAP1 and HLA-A expression with the survival probability in metastatic melanoma patients.
Direct interaction of miR-200a-5p with TAP1 3ʹ-UTR
Since a discordant TAP1 mRNA and protein level was observed in some melanoma cell lines analyzed, a post-transcriptional regulation of TAP1 by miRs was suggested. In silico analysis using the microrna.orgCitation40 (http://www.microrna.org/microrna/home.do) and RNAhybridCitation41 (https://bibiserv.cebitec.uni-bielefeld.de/rnahybrid) algorithms predicted miR-200a-5p as a candidate miR targeting the TAP1 3ʹ-UTR (). The binding affinity of complementary structures between the putative miRs and the target mRNA demonstrated a high free binding energy of −26.3 kcal/mol for miR-200a-5p and TAP1 3ʹ-UTR () indicating a high probability of interaction.
Figure 3. Identification of miR-200a-5p interaction with the 3ʹ-UTR of TAP1.
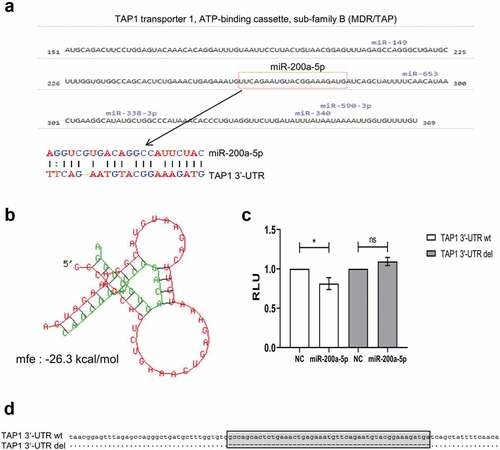
Furthermore, the direct interaction between miR-200a-5p and the TAP1 3ʹ-UTR was validated by the dual luc reporter assay. After the transient transfection of HEK293T cells with the pMir-Glo vector containing the TAP1 3ʹ-UTR in the presence of miR-200a-5p mimics, the luc activity significantly decreased upon miR-200a-5p overexpression in comparison to the miR mimic negative control (NC) (). As expected, the deletion of the miR-200a-5p binding site did neither alter the luc activity with miR-200a-5p nor with the NC (,).
Differential expression of miR-200a-5p in melanoma cell lines
The different melanoma cell lines were analyzed by RT-qPCR for the expression of miR-200a-5p in correlation to TAP1. MiR-200a-5p was heterogeneously expressed in these cells (). A threshold of ˂ 20 cycles difference between the expression of miR-200a-5p and the housekeeper gene RNAU6 was considered as “detectable” miR-200a-5p expression, while melanoma cell lines with > 20 cycles difference between the expression of miR-200a-5p and RNAU6 were defined as undetectable miR-200a-5p expression. In 32/42 melanoma cell lines (76.19%) including BUF1379, FM3 and FM81 cells, miR-200a-5p expression was detectable. In 12 melanoma cell lines (28.57%), low TAP1 protein expression was accompanied by miR-200a-5p higher expression levels compared to melanocyte samples.
Figure 4. Basal expression of miR-200a-5p and TAP1 in different melanoma cell lines.
Downregulation of TAP1 expression by miR-200a-5p
As an initial proof of principle, HEK293T cells were transiently transfected with miR-200a-5p recombinant plasmid and the mock control vector, respectively. MiR-200a-5p overexpression in HEK293T cells () results in a more than 40% downregulation of TAP1 mRNA () and protein expression levels () when compared to the mock control vector transfectants.
Figure 5. Effect of miR-200a-5p overexpression on TAP1 expression in HEK293T cells.
To further determine the effect of miR-200a-5p on TAP1 expression in melanoma cell lines, miR-200a-5p mimics and a miR mimic NC were transiently transfected into BUF1379, FM3 and FM81 cells. Overexpression of miR-200a-5p was obtained in all three melanoma cell lines, while cells transfected with the NC showed a relative expression pattern when compared to parental cells (). For Western blot analysis, melanoma cells only transfected with the transfection reagent named “Control” served as an additional control to the NC. Overexpression of miR-200a-5p in BUF1379 and FM3 cells caused a 40% downregulation of TAP1 mRNA and protein levels compared to that of the NC or control samples (,,). Furthermore, miR-200a-5p overexpression only caused a downregulation of TAP1, but not of other APM components, such as TAP2, TPN, LMP2 and HLA-I HC (–). This was accompanied by a decreased HLA-I surface expression particularly of HLA-BC in the miR-200a-5p transfectants (–K). As expected, the mRNA and protein expression levels of control transfectants were comparable to that of parental samples.
Figure 6. Effect of miR-200a-5p overexpression on the expression of HLA-I APM components in melanoma cell lines.
Correlation of the miR-200a-5p-mediated downregulation of TAP1 with enhanced NK cell recognition
To assess the functional relevance of miR-200a-5p-induced suppression of TAP1 and consequently of HLA-I surface expression, NK cell-mediated recognition was determined using the CD107a degranulation assay. Due to a comparable effect of miR-200a-5p on BUF1379 and FM3 cells, analysis was performed with FM3 cells, since they express a Bw4 allele and thus have one additional “restriction” element for inhibition of NK cells. Higher levels of CD107a positive NK cells were found in response to FM3 cells overexpressing miR-200a-5p than to NC transfectants (). This might be due to the miR-200a-5p-mediated silencing of TAP1 expression followed by a reduced HLA-I surface expression.
Figure 7. Increased recognition of miR-200a-5p overexpressing FM3 melanoma cells by NK cells.
Correlation between miR-200a-5p expression with TAP1 and immune cell infiltration
To determine the in vivo relevance of the in vitro data, miR-200a-5p levels were evaluated by RT-qPCR analysis in 26 FFPE sections of human primary melanoma that have been scored as TAP1 low (n = 10) and TAP1 high (n = 16) based on immunohistochemical staining. MiR-200a-5p expression was found statistically significant inversely related to the TAP1 score () thereby supporting our in vitro data. The same melanoma samples were also analyzed regarding their immune cell infiltration, in particular of CD8+, CD4+, Foxp3+ and CD163+ immune cells, using IHC. The TAP1 expression scores were directly correlated to the frequency of CD8+ (), CD163+ (), CD4+ and FoxP3+ (data not shown) immune cells, since TAP1low/TAP1high scored melanoma patients showed low/high scores of immune cell subpopulations, respectively. Furthermore, a direct link between the low TAP1 score with CD8+ T cell infiltration, but high miR-200a-5p expression and vice versa exists ().
Figure 8. Inverse correlation of miR-200a-5p expression with TAP1 levels and survival probability in melanoma patients.
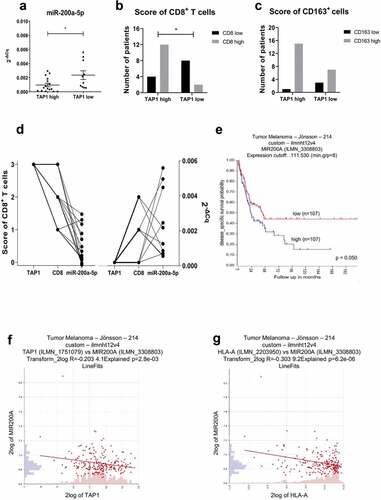
Association of miR-200a-5p expression with clinical parameters
In order to correlate the expression of miR-200a-5p with the disease specific survival probability of metastatic melanoma patients and the expression of TAP1 and HLA-I molecules (HLA-A, HLA-B and HLA-C), the same melanoma datasetCitation39 of the R2 web tool was used. Higher expression of miR-200a was significantly associated with worse disease specific survival probability of patients with metastatic melanoma (), but not with the distant metastasis free survival probability (Supplementary Figure S2). Furthermore, the miR-200a expression was inversely correlated to the expression of TAP1 and of all HLA-I molecules as representatively shown for HLA-A (,).
Discussion
Our study suggests that TAP1 expression in melanoma cells can be controlled by miR-200a-5p leading to a downregulation of HLA-I surface expression, which is linked to a reduced survival of melanoma patients. The miR-200 family has become a hot topic and includes 5 members (miR-200a, miR-200b, miR-200c, miR-141 and miR-429) located on two different genomic clusters: the first cluster consists of miR-200a, miR-200b and miR-429 on chromosome 1, the second of miR-200c and miR-141 on chromosome 12.Citation42,Citation43 Moreover, miR-200a-5p overexpression has recently been described in non-small cell lung cancer (NSCLC),Citation44 ovarian cancer,Citation45 breast cancerCitation46 and papillary thyroid carcinoma, but so far not linked to HLA-I and APM component expression.Citation47
Alterations in the surface expression and/or function of the HLA-I antigens are frequently found in human tumors and equip neoplastic cells with mechanisms to escape immune surveillance.Citation5 Furthermore, tumors with acquired resistance to checkpoint inhibitor therapy or adoptive T cell transfer can acquire genetic deficiencies or downregulation of APM components resulting in the loss or reduced expression of either constitutive or HLA-I surface antigens.Citation48 The abnormalities are significantly associated with a higher tumor staging, grading, disease progression and a reduced survival of patients as well as a failure to CD8+ T cell-based immunotherapies. The aberrant expression of HLA-I molecules can be caused by structural alterations or deregulations of genes encoding the classical HLA-I antigens and/or APM components. Inactivating mutations in the human HLA-I HC and β2-m genes have been mainly described in melanoma and colorectal carcinoma with a low frequency,Citation49 while mutations in other APM components, like TAP1, TAP2, TPN and the proteasomal subunits occur more rarely in melanoma, lung and cervical cancer.Citation5 The deregulation of HLA-I APM components could also occur at the epigenetic, transcriptional or post-transcriptional levelCitation50 providing tumors cells with different mechanisms to inactivate immune responses, which result in tumor growth and evasion from host immune surveillance. In some malignancies, both “soft” (reversible) and “hard” (irreversible) downregulation of HLA-I may limit effective T cell immune responses.Citation51,Citation52 Interestingly, reduced HLA-I expression is very common in melanoma prior to immune checkpoint therapy and associated with primary resistance to ipilimumab, but not to nivolumab.Citation51 In metastatic melanoma patients, regression of metastasis after immunotherapy is associated with the expression of HLA-I APM components and IFN-regulated rejections genes.Citation53 Furthermore, the expression of HLA-I molecules and APM components is directly correlated with an improved overall and progression-free survival of melanoma patients in several TCGA datasets.Citation39,Citation54,Citation55
A reduced mRNA and/or protein expression of various APM components was identified in a large series of melanoma cell lines and lesions, which could be correlated with an increased tumor gradingCitation17,Citation56 implying a deregulated APM component and HLA-I molecule expression. During the last years, some miRs have been reported to target APM components and HLA-I molecules suggesting an important role for post-transcriptional control in the antigen processing and presentation process.Citation17 So far, only miR-346 has been identified to directly regulate TAP1 during ER stress,Citation28 suggesting that miRs might be key players and fine tuners of the post-transcriptional regulation of TAP1.Citation57,Citation58 Their deregulation in melanoma was found by analysis of genomic characteristics of these tumors, which were significantly enriched in miR genes.Citation59 Several miRs profiles of melanoma cell lines or tissues revealed altered expression patterns compared to melanocytes or nevi, respectively.Citation60 Functional in vitro and/or in vivo testing of some deregulated miRs suggested potential contributions of specific miRs to the molecular complexity of this malignancy.Citation61
The miR-200 family is known for its role in cancer metastasis by inhibiting epithelial-mesenchymal transition and differentially regulating morphological plasticity and mode of melanoma cell invasion.Citation62 The expression of three family members, miR-200a, miR-200b and miR-429, is upregulated in three epithelial cancers (breast, ovarian and melanoma) as determined by high-resolution array based comparative genomic hybridization.Citation59 In particular, the expression of miR-200a-5p is significantly increased in several cancer typesCitation44,Citation45,Citation47 and heart diseases.Citation63,Citation64
In our study, miR-200a-5p has been shown to regulate TAP1 expression in HEK293T and melanoma cells. MiR-200a-5p was initially found by in silico prediction to bind to the TAP1 3ʹ-UTR. This binding was further confirmed by the dual luc reporter assay. Moreover, a specific effect of miR-200a-5p overexpression on TAP1 protein expression, but not at the TAP1 mRNA level, was found in two melanoma cell lines. MiRs direct the RISC complex to downregulate target expression by mRNA cleavage and/or translational repression.Citation13,Citation65-Citation67 Although often typically relatively mild,Citation68,Citation69 the most relevant readout of the miR regulatory effects are at the protein level.Citation65 Upon overexpression of miR-200a-5p either with mimics or an overexpression vector, a specific downregulation of TAP1 protein level was observed resulting in a downregulation of HLA-ABC surface expression. Since in particular HLA-BC expression was affected by this miR, possible HLA allele specific functional consequences of TAP1 downregulation could be suggested. Interestingly, this might depend at the HLA-I surface expression levels of melanoma cells, since miR-200a-5p affects HLA-I expression of BUF1379 and FM3 cells, but not of the HLA-I low expressing cell line FM81. Furthermore, the miR-200a-5p-mediated reduced HLA-I expression was accompanied by an increased number of CD107a positive NK cells upon co-culture with miR-200a-5p expressing melanoma cells. As expected, no effect of miR-200a-5p overexpression was detected on other APM components suggesting a TAP1-specific effect of miR-200a-5p.
MiR-200a-5p levels were also found inversely related with TAP1 levels of paraffin-embedded tissue sections of melanoma patients. High levels of miR-200a-5p were found in melanoma lesions with low TAP1 expression levels supporting our hypothesis of a post-transcriptional regulation of TAP1 via miR-200a-5p. Interestingly, the immune cell infiltrate, such as CD8+ cells determined by immunohistochemistry analysis, was also inversely correlated with the levels of miR-200a-5p further supporting its role as an immune modulatory miR.
In conclusion, we described for the first time a possible immune modulatory role of miR-200a-5p, since this miR targets the TAP1 3ʹ-UTR accompanied by downregulation of TAP1 protein expression associated with a reduced HLA-I surface expression in melanoma cell lines and an increased NK cell recognition. It is noteworthy that miR-200a-5p only moderately affects TAP1 expression suggesting that other miRs controlling TAP1 expression might exist. Furthermore, the clinical relevance of miR-200a-5p should be analyzed in trials, in which treatment options are determined based on HLA-I expression and APM components expression. MiR-200a-5p might serve as a novel target for the treatment of melanoma or for selection/prediction of melanoma patients undergoing the most effective immunotherapy.
Declaration of interest statement
The authors declare that they have no conflicts of interest.
Supplemental Material
Download ()Acknowledgments
We would like to thank Maria Heise for excellent secretarial work.
Supplementary material
Supplemental data for this article can be accessed on the publisher’s website.
Additional information
Funding
References
- Hanahan D, Weinberg RA. Hallmarks of cancer: the next generation. Cell. 2011;144(5):646–14. doi:10.1016/j.cell.2011.02.013.
- Teng MW, Swann JB, Koebel CM, Schreiber RD, Smyth MJ. Immune-mediated dormancy: an equilibrium with cancer. J Leukoc Biol. 2008;84(4):988–993. doi:10.1189/jlb.1107774.
- Kim M-Y, Oskarsson T, Acharyya S, Nguyen DX, Zhang XHF, Norton L, Massagué J. Tumor self-seeding by circulating cancer cells. Cell. 2009;139(7):1315–1326. doi:10.1016/j.cell.2009.11.025.
- Hasim A, Abudula M, Aimiduo R, Ma J-Q, Jiao Z, Akula G, Wang T, Abudula A. Post-transcriptional and epigenetic regulation of antigen processing machinery (APM) components and HLA-I in cervical cancers from Uighur women. PLoS One. 2012;7(9):e44952. doi:10.1371/journal.pone.0044952.
- Bukur J, Jasinski S, Seliger B. The role of classical and non-classical HLA class I antigens in human tumors. Semin Cancer Biol. 2012;22(4):350–358. doi:10.1016/j.semcancer.2012.03.003.
- Leone P, Shin E-C, Perosa F, Vacca A, Dammacco F, Racanelli V. MHC class I antigen processing and presenting machinery: organization, function, and defects in tumor cells. JNCI Journal of the National Cancer Institute. 2013;105(16):1172–1187. doi:10.1093/jnci/djt184.
- Seliger B, Ferrone S, Class HLA I antigen processing machinery defects in cancer cells-frequency, functional significance, and clinical relevance with special emphasis on their role in T cell-based immunotherapy of malignant disease. Methods Mol Biol (Clifton, NJ). 2020;2055:325–350. doi:10.1007/978-1-4939-9773-2_15.
- Aptsiauri N, Ruiz-Cabello F, Garrido F. The transition from HLA-I positive to HLA-I negative primary tumors: the road to escape from T-cell responses. Curr Opin Immunol. 2018;51:123–132. doi:10.1016/j.coi.2018.03.006.
- Chang C-C, Pirozzi G, Wen S-H, Chung I-H, Chiu B-L, Errico S, Luongo M, Lombardi ML, Ferrone S. Multiple structural and epigenetic defects in the human leukocyte antigen class I antigen presentation pathway in a recurrent metastatic melanoma following immunotherapy. J Biol Chem. 2015;290(44):26562–26575. doi:10.1074/jbc.M115.676130.
- Kulkarni S, Ramsuran V, Rucevic M, Singh S, Lied A, Kulkarni V, O’hUigin C, Le Gall S, Carrington M. Posttranscriptional regulation of HLA-A protein expression by alternative polyadenylation signals involving the RNA-binding protein syncrip. The Journal of Immunology. 2017;199(11):3892–3899. doi:10.4049/jimmunol.1700697.
- Eichmuller SB, Osen W, Mandelboim O, Seliger B. Immune modulatory microRNAs involved in tumor attack and tumor immune escape. JNCI. 2017;109(10). doi:10.1093/jnci/djx034.
- Bartel DP. MicroRNAs: target recognition and regulatory functions. Cell. 2009;136(2):215–233. doi:10.1016/j.cell.2009.01.002.
- Bartel DP. MicroRNAs: genomics, biogenesis, mechanism, and function. Cell. 2004;116(2):281–297. doi:10.1016/s0092-8674(04)00045-5.
- Jiang C, Chen X, Alattar M, Wei J, Liu H. MicroRNAs in tumorigenesis, metastasis, diagnosis and prognosis of gastric cancer. Cancer Gene Ther. 2015;22(6):291–301. doi:10.1038/cgt.2015.19.
- Nana-Sinkam SP, Croce CM. MicroRNA regulation of tumorigenesis, cancer progression and interpatient heterogeneity: towards clinical use. Genome Biol. 2014;15(9):445. doi:10.1186/s13059-014-0445-8.
- Segura MF, Greenwald HS, Hanniford D, Osman I, Hernando E. MicroRNA and cutaneous melanoma: from discovery to prognosis and therapy. Carcinogenesis. 2012;33(10):1823–1832. doi:10.1093/carcin/bgs205.
- Meyer S, Handke D, Mueller A, Meinhardt A, Jasinski-Bergner S, Mages S, Bukur J, Donia M, Straten P, Seliger B, et al. Role of signal transduction and microRNAs on the immunogenicity of melanoma cells. J Transl Med. 2015;13(Suppl 1):K15. doi:10.1186/1479-5876-13-s1-k15.
- Friedrich M, Jasinski-Bergner S, Lazaridou M-F, Subbarayan K, Massa C, Tretbar S, Mueller A, Handke D, Biehl K, Bukur J, et al. Tumor-induced escape mechanisms and their association with resistance to checkpoint inhibitor therapy. CII. 2019;68(10):1689–1700. doi:10.1007/s00262-019-02373-1.
- Tsukerman P, Yamin R, Seidel E, Khawaled S, Schmiedel D, Bar-Mag T, Mandelboim O. MiR-520d-5p directly targets TWIST1 and downregulates the metastamiR miR-10b. Oncotarget. 2014;5(23):12141–12150. doi:10.18632/oncotarget.2559.
- Kulkarni S, Savan R, Qi Y, Gao X, Yuki Y, Bass SE, Martin MP, Hunt P, Deeks SG, Telenti A, et al. Differential microRNA regulation of HLA-C expression and its association with HIV control. Nature. 2011;472(7344):495–498. doi:10.1038/nature09914.
- Tan Z, Randall G, Fan J, Camoretti-Mercado B, Brockman-Schneider R, Pan L, Solway J, Gern JE, Lemanske RF, Nicolae D, et al. Allele-specific targeting of microRNAs to HLA-G and risk of asthma. Am J Hum Genet. 2007;81(4):829–834. doi:10.1086/521200.
- Zhu X-M, Han T, Wang X-H, Li Y-H, Yang H-G, Luo Y-N, Yin G-W, Yao Y-Q. Overexpression of miR-152 leads to reduced expression of human leukocyte antigen-G and increased natural killer cell mediated cytolysis in JEG-3 cells. Am J Obstet Gynecol. 2010;202(6):e591–e597. doi:10.1016/j.ajog.2010.03.002.
- Jasinski-Bergner S, Reches A, Stoehr C, Massa C, Gonschorek E, Huettelmaier S, Braun J, Wach S, Wullich B, Spath V, et al. Identification of novel microRNAs regulating HLA-G expression and investigating their clinical relevance in renal cell carcinoma. Oncotarget. 2016;7(18):26866–26878. doi:10.18632/oncotarget.8567.
- Friedrich M, Pracht K, Mashreghi M-F, Jäck H-M, Radbruch A, Seliger B. The role of the miR-148/-152 family in physiology and disease. Eur J Immunol. 2017;47(12):2026–2038. doi:10.1002/eji.201747132.
- Manaster I, Goldman-Wohl D, Greenfield C, Nachmani D, Tsukerman P, Hamani Y, Yagel S, Mandelboim O. MiRNA-mediated control of HLA-G expression and function. PLoS One. 2012;7(3):e33395. doi:10.1371/journal.pone.0033395.
- Mari L, Hoefnagel SJM, Zito D, van de Meent M, van Endert P, Calpe S, Sancho Serra MDC, Heemskerk MHM, van Laarhoven HWM, Hulshof MCCM, et al. microRNA 125a regulates MHC-I expression on esophageal adenocarcinoma cells, associated with suppression of antitumor immune response and poor outcomes of patients. Gastroenterology. 2018;155(3):784–798. doi:10.1053/j.gastro.2018.06.030.
- Colangelo T, Polcaro G, Ziccardi P, Pucci B, Muccillo L, Galgani M, Fucci A, Milone MR, Budillon A, Santopaolo M, et al. Proteomic screening identifies calreticulin as a miR-27a direct target repressing MHC class I cell surface exposure in colorectal cancer. Cell Death Dis. 2016;7(2):e2120. doi:10.1038/cddis.2016.28.
- Bartoszewski R, Brewer JW, Rab A, Crossman DK, Bartoszewska S, Kapoor N, Fuller C, Collawn JF, Bebok Z. The unfolded protein response (UPR)-activated transcription factor X-box-binding protein 1 (XBP1) induces microRNA-346 expression that targets the human antigen peptide transporter 1 (TAP1) mRNA and governs immune regulatory genes. J Biol Chem. 2011;286(48):41862–41870. doi:10.1074/jbc.M111.304956.
- Gao F, Zhao Z-L, Zhao W-T, Fan Q-R, Wang S-C, Li J, Zhang Y-Q, Shi J-W, Lin X-L, Yang S, et al. miR-9 modulates the expression of interferon-regulated genes and MHC class I molecules in human nasopharyngeal carcinoma cells. Biochem Biophys Res Commun. 2013;431(3):610–616. doi:10.1016/j.bbrc.2012.12.097.
- Pawelec G, Marsh SG. ESTDAB: a collection of immunologically characterised melanoma cell lines and searchable databank. CII. 2006;55(6):623–627. doi:10.1007/s00262-005-0117-3.
- Wulfanger J, Biehl K, Tetzner A, Wild P, Ikenberg K, Meyer S, Seliger B. Heterogeneous expression and functional relevance of the ubiquitin carboxyl-terminal hydrolase L1 in melanoma. Int J Cancer. 2013;133(11):2522–2532. doi:10.1002/ijc.28278.
- Koelblinger P, Emberger M, Drach M, Cheng PF, Lang R, Levesque MP, Bauer JW, Dummer R. Increased tumour cell PD -L1 expression, macrophage and dendritic cell infiltration characterise the tumour microenvironment of ulcerated primary melanomas. JEADV. 2019;33(4):667–675. doi:10.1111/jdv.15302.
- Chen C, Ridzon, D. A., Broomer, A. J., Zhou, Z., Lee, D. H., Nguyen, J. T., Barbisin, M., Xu, N. L., Mahuvakar, V. R., Andersen, M. R. et al., Real-time quantification of microRNAs by stem-loop RT-PCR. Nucleic Acids Res. 2005;33(20):e179. doi: 10.1093/nar/gni178.
- Varkonyi-Gasic E, Wu R, Wood M, Walton EF, Hellens RP. Protocol: a highly sensitive RT-PCR method for detection and quantification of microRNAs. Plant Methods. 2007;3(1):12. doi:10.1186/1746-4811-3-12.
- Bukur J, Herrmann F, Handke D, Recktenwald C, Seliger B. Identification of E2F1 as an important transcription factor for the regulation of tapasin expression. J Biol Chem. 2010;285(40):30419–30426. doi:10.1074/jbc.M109.094284.
- Steven A, Leisz S, Massa C, Iezzi M, Lattanzio R, Lamolinara A, Bukur J, Müller A, Hiebl B, Holzhausen H-J, et al. HER-2/neu mediates oncogenic transformation via altered CREB expression and function. MCR. 2013;11(11):1462–1477. doi:10.1158/1541-7786.mcr-13-0125.
- Alter G, Malenfant JM, Altfeld M. CD107a as a functional marker for the identification of natural killer cell activity. J Immunol Methods. 2004;294(1–2):15–22. doi:10.1016/j.jim.2004.08.008.
- Lorenzo-Herrero S, Sordo-Bahamonde C, Gonzalez S, Lopez-Soto A. CD107a degranulation assay to evaluate immune cell antitumor activity. Methods Mol Biol (Clifton, NJ). 2019;1884:119–130. doi:10.1007/978-1-4939-8885-3_7.
- Cirenajwis H, Ekedahl H, Lauss M, Harbst K, Carneiro A, Enoksson J, Rosengren F, Werner-Hartman L, Törngren T, Kvist A, et al. Molecular stratification of metastatic melanoma using gene expression profiling: prediction of survival outcome and benefit from molecular targeted therapy. Oncotarget. 2015;6(14):12297–12309. doi:10.18632/oncotarget.3655.
- Betel D, Wilson M, Gabow A, Marks DS, Sander C. The microRNA.org resource: targets and expression. Nucleic Acids Res. 2007;36(Database):D149–D153. doi:10.1093/nar/gkm995.
- Rehmsmeier M. Fast and effective prediction of microRNA/target duplexes. RNA (New York, NY). 2004;10(10):1507–1517. doi:10.1261/rna.5248604.
- Lee JS, Ahn, Y. H., Won, H. S., Sun, S., Kim, Y. H., Ko, Y. H. Prognostic role of the microRNA-200 family in various carcinomas: a systematic review and meta-analysis. Biomed Res Int. 2017;2017:1928021. doi:doi:10.1155/2017/1928021
- Senfter D, Madlener S, Krupitza G, Mader RM. The microRNA-200 family: still much to discover. Biomol Concepts. 2016;7(5–6):311–319. doi:10.1515/bmc-2016-0020.
- Xie K, Wang C, Qin N, Yang J, Zhu M, Dai J, Jin G, Shen H, Ma H, Hu Z, et al. Genetic variants in regulatory regions of microRNAs are associated with lung cancer risk. Oncotarget. 2016;7(30):47966–47974. doi:10.18632/oncotarget.10299.
- Wang Y, Qiu C, Lu N, Liu Z, Jin C, Sun C, Bu H, Yu H, Dongol S, Kong B, et al. FOXD1 is targeted by miR-30a-5p and miR-200a-5p and suppresses the proliferation of human ovarian carcinoma cells by promoting p21 expression in a p53-independent manner. Int J Oncol. 2018;52(6):2130–2142. doi:10.3892/ijo.2018.4359.
- Zeng X, Qu X, Zhao C, Xu L, Hou K, Liu Y, Zhang N, Feng J, Shi S, Zhang L, et al. FEN1 mediates miR-200a methylation and promotes breast cancer cell growth via MET and EGFR signaling. The FASEB Journal. 2019;33(10):10717–10730. doi:10.1096/fj.201900273R.
- Wang X, Huang S, Li X, Jiang D, Yu H, Wu Q, Gao C, Wu Z. A potential biomarker hsa-miR-200a-5p distinguishing between benign thyroid tumors with papillary hyperplasia and papillary thyroid carcinoma. PLoS One. 2018;13(7):e0200290. doi:10.1371/journal.pone.0200290.
- Gettinger S, Choi J, Hastings K, Truini A, Datar I, Sowell R, Wurtz A, Dong W, Cai G, Melnick MA, et al. Impaired HLA class I antigen processing and presentation as a mechanism of acquired resistance to immune checkpoint inhibitors in lung cancer. Cancer Discov. 2017;7(12):1420–1435. doi:10.1158/2159-8290.cd-17-0593.
- Maleno I, Aptsiauri N, Cabrera T, Gallego A, Paschen A, López-Nevot MA, Garrido F. Frequent loss of heterozygosity in the β2-microglobulin region of chromosome 15 in primary human tumors. Immunogenetics. 2011;63(2):65–71. doi:10.1007/s00251-010-0494-4.
- Seliger B. Novel insights into the molecular mechanisms of HLA class I abnormalities. CII. 2012;61(2):249–254. doi:10.1007/s00262-011-1153-9.
- Rodig SJ, Gusenleitner D, Jackson DG, Gjini E, Giobbie-Hurder A, Jin C, Chang H, Lovitch SB, Horak C, Weber JS, et al. MHC proteins confer differential sensitivity to CTLA-4 and PD-1 blockade in untreated metastatic melanoma. Sci Transl Med. 2018;10(450):eaar3342. doi:10.1126/scitranslmed.aar3342.
- Cao J, Brouwer NJ, Jordanova ES, Marinkovic M, van Duinen SG, de Waard NE, Ksander BR, Mulder A, Claas FHJ, Heemskerk MHM, et al. HLA class I antigen expression in conjunctival melanoma is not associated with PD-L1/PD-1 status. Investigat ophthalmol Vis Sci. 2018;59(2):1005–1015. doi:10.1167/iovs.17-23209.
- Carretero R, Wang E, Rodriguez AI, Reinboth J, Ascierto ML, Engle AM, Liu H, Camacho FM, Marincola FM, Garrido F, et al. Regression of melanoma metastases after immunotherapy is associated with activation of antigen presentation and interferon-mediated rejection genes. Int J Cancer. 2012;131(2):387–395. doi:10.1002/ijc.26471.
- Akbani R, Akdemir K, Aksoy B, Albert M, Ally A, Amin S, Arachchi H, Arora A, Auman J, Ayala B. Genomic classification of cutaneous melanoma. Cell. 2015;161(7):1681–1696. doi:10.1016/j.cell.2015.05.044.
- Thorsson V, Gibbs, D. L., Brown, S. D., Wolf, D., Bortone, D. S., Ou Yang, T. H., Porta-Pardo, E., Gao, G. F., Plaisier, C. L., Eddy, J. A. et al. The immune landscape of cancer. Immunity. 2018;48:812–830.e814. doi: 10.1016/j.immuni.2018.03.023.
- Guennoun A, Sidahmed H, Maccalli C, Seliger B, Marincola FM, Bedognetti D. Harnessing the immune system for the treatment of melanoma: current status and future prospects. Expert Rev Clin Immunol. 2016;12(8):879–893. doi:10.1080/1744666x.2016.1176529.
- Lagos-Quintana M. Identification of novel genes coding for small expressed RNAs. Science (New York, NY). 2001;294(5543):853–858. doi:10.1126/science.1064921.
- Bartel DP, Chen C-Z. Micromanagers of gene expression: the potentially widespread influence of metazoan microRNAs. Nature Reviews Genetics. 2004;5(5):396–400. doi:10.1038/nrg1328.
- Zhang L, Huang J, Yang N, Greshock J, Megraw MS, Giannakakis A, Liang S, Naylor TL, Barchetti A, Ward MR, et al. microRNAs exhibit high frequency genomic alterations in human cancer. Proc Natl Acad Sci U S A. 2006;103(24):9136–9141. doi:10.1073/pnas.0508889103.
- Bonazzi VF, Stark MS, Hayward NK. MicroRNA regulation of melanoma progression. Melanoma Res. 2012;22(2):101–113. doi:10.1097/CMR.0b013e32834f6fbb.
- Seliger B, Meinhardt A, Falke D. The role of immune modulatory microRNAs in tumors. INTEC. 2016. doi:10.5772/61805.
- Elson-Schwab I, Lorentzen A, Marshall CJ, Danen EHJ. MicroRNA-200 family members differentially regulate morphological plasticity and mode of melanoma cell invasion. PLoS One. 2010;5(10):e13176. doi:10.1371/journal.pone.0013176.
- Yang T, Cao C, Yang J, Liu T, Lei XG, Zhang Z, Xu S. miR-200a-5p regulates myocardial necroptosis induced by Se deficiency via targeting RNF11. Redox Biol. 2018;15:159–169. doi:10.1016/j.redox.2017.11.025.
- Yang T, Liu T, Cao C, Xu S. miR-200a-5p augments cardiomyocyte hypertrophy induced by glucose metabolism disorder via the regulation of selenoproteins. J Cell Physiol. 2019;234(4):4095–4103. doi:10.1002/jcp.27206.
- Baek D, Villén J, Shin C, Camargo FD, Gygi SP, Bartel DP. The impact of microRNAs on protein output. Nature. 2008;455(7209):64–71. doi:10.1038/nature07242.
- Stavast CJ, Erkeland SJ. The non-canonical aspects of microRNAs: many roads to gene regulation. Cells. 2019;8(11):1465. doi:10.3390/cells8111465.
- Seo J, Jin D, Choi C-H, Lee H, Unver T. Integration of microRNA, mRNA, and protein expression data for the identification of cancer-related microRNAs. PLoS One. 2017;12(1):e0168412. doi:10.1371/journal.pone.0168412.
- van Rooij E, Olson EN. MicroRNA therapeutics for cardiovascular disease: opportunities and obstacles. Nat Rev Drug Discov. 2012;11(11):860–872. doi:10.1038/nrd3864.
- Selbach M, Schwanhäusser B, Thierfelder N, Fang Z, Khanin R, Rajewsky N. Widespread changes in protein synthesis induced by microRNAs. Nature. 2008;455(7209):58–63. doi:10.1038/nature07228.