
ABSTRACT
Glioma represents a serious health burden in terms of morbidity and mortality. The prognostic significance of the lymphoid and myeloid infiltrates in glioma is not clearly determined. Moreover, the characterization of different leukocyte subsets in the tumor microenvironment relies mainly on immunohistochemistry observations, and data about their association with prognosis are contradictory. Here, we performed acomprehensive study of both the tumor-infiltrating and circulating immune compartments of patients with high-grade glioma. Nineteen tumor biopsies and 30 PBMC samples were analyzed by RNA sequencing. Validation was performed on The Cancer Genome Atlas (TCGA) RNA sequencing data from glioma and on additional 39 tumor biopsies analyzed by flow cytometry. We identified prognostic tumor and peripheral immune signatures, which associate increased inflammation, immune infiltration and activation with shorter overall survival in high-grade glioma patients. Importantly, we confirmed our observations by flow cytometry analysis and validated the tumor-signature using the TCGA dataset. In addition, both tumor genotype and grade associated with the degree of glioma immune infiltration. Unlike in the majority of cancers, lymphocyte infiltration at the tumor site is anegative prognostic factor in glioma, suggesting the ambivalent pro-tumorigenic role of immune responses in glioma.
Introduction
Glioma represents a serious health burden in terms of morbidity and mortality. Patients with high-grade glioma (WHO grade III and IV tumors) have a very poor prognosis, the median survival (interquartile range) for grade IV glioma being 16.0 (9.3–27.5) months.Citation1,Citation2 The lack of a robust and effective antitumor immune response, possibly due to the presence of an immunosuppressive microenvironment, may contribute to the clinical aggressiveness of the disease. In particular, the composition and activity of the immune infiltrate at the tumor site may yield information relevant to prognosis. The tumor microenvironment is a spatially organized landscape, and the relative abundance of different immune cell types has been associated with prognosis in different cancers.Citation3
Macrophages are a major component of the tumor microenvironment and are often classified as M1 and M2 polarized macrophages. M1-like macrophages produce mainly pro-inflammatory factors, such as TNF-alpha, and are associated with acute inflammation; M2-like macrophages are associated with chronic inflammation and produce pro-angiogenic and cell growth-promoting factors such as IL-6 and IL-13. M2-like macrophages are generally associated with poor prognosis in several cancers, such as melanoma, breast, bladder, ovarian and gastric cancer.Citation3 In glioma, tumor-associated macrophages (TAMs) comprise two populations: brain-resident microglial cells and macrophages that differentiate from bone marrow-derived monocytes and migrate to the brain upon inflammation.Citation4 Single-cell RNA profiling showed a significant increase in glioblastoma (GBM) versus lower-grade glioma in blood-derived (but not microglial) TAMs, characterized by co-expression of both M1 and M2 -like genes.Citation5 Another study demonstrated a correlation between survival and degree of microglial cell infiltration in tissues from GBM patients using immunohistochemistry (IHC) staining, and suggested as well a mixed M1/M2 polarization of glioma-associated macrophages.Citation6 The prognostic relevance of TAMs in high-grade glioma was shown to be positive, negative or absent in different studies,Citation7 but, generally, M2-like markers were positively associated with grade of malignancy and with poor survival in glioma.Citation7–Citation9
Other cell types, such as myeloid-derived suppressor cells (MDSCs), have been described predominantly in the invasive margins of glioma samples, and MDSCs presence was shown to correlate with an unfavorable outcome.Citation3 Recent studies in glioma patientsCitation10-Citation12 have characterized gene signatures related to single immune markers and reported a correlation between myeloid marker expression and poor prognosis in GBM; however myeloid cell marker expression did not correlate with grade in glioma.Citation13
Typically, the presence of T-lymphocyte subsets correlates with a favorable prognosis in several cancers.Citation3 Furthermore, a high density of CD3+ T cells in the tumor microenvironment, often associated with the presence of CD8+ T cells, correlates with progression-free survival in patients with ovarian cancer and is associated with a favorable prognosis in many cancers such as breast, melanoma, pancreatic and colorectal cancer.Citation14 However, this has not been shown for renal cell carcinoma.Citation3 In glioma, data on the prognostic value of tumor-infiltrating lymphocyte (TILs), performed mainly in GBM, are contradictory: lymphocytic infiltration was either associated with longer survival, or no correlationCitation3,Citation7 was observed. Similarly, elevated numbers of effector T cells either correlated with longer survival in GBM,Citation15 or no association was found.Citation16 On the contrary, Zhai et al.Citation17 showed that infiltrating human T cells directly increase indoleamine 2,3-dioxygenase 1 (IDO1) expression in GBM, correlating with decreased survival. Furthermore, the prognostic value of regulatory T cells is inconsistent across different studies, and no associationCitation18,Citation19 or a negative correlation with prognosisCitation16,Citation19 was described.
Finally, the characterization of different leukocyte subsets in the tumor microenvironment in glioma relies mainly on IHC observations, and data about their association with prognosis are contradictory.
Here, combining RNA sequencing (RNAseq) and flow cytometry profiling of patients biopsies, we identified a signature negatively associated with prognosis in gliomas, which exclusively depends on the immune contexture of tumors, especially lymphoid infiltrates. Importantly, the lymphocyte component is an independent predictor of patient outcome.
Results
A gene signature enriched in inflammatory and immune infiltrate markers is associated with poor prognosis in high-grade glioma patients
To understand how inter-tumor heterogeneity influences the prognosis of glioma patients, we analyzed a cohort of 19 high-grade glioma patients by collecting and profiling their biopsies before chemoradiation treatment (Supplementary Figure 1 and Supplementary Table 1). The samples were grouped based on median overall survival (OS): 1513 genes were differentially expressed between patients with OS above 24 months (good prognosis) and patients with shorter survival (poor prognosis). We then analyzed which pathways were enriched using DAVID Functional Annotation Clustering.Citation20,Citation21 The most enriched cluster comprised immune response pathways (Cluster 1, Enrichment Score = 1.96, Supplementary File 1). Using GSEA,Citation22 we estimated which major subpopulations of immune cells were enriched in each of the two groups of patients, using previously defined sets of genes specific of 26 classes of immune subsets.Citation23 Poor prognosis patients had a greater immune infiltration, particularly lymphocyte infiltration (activated CD4 T cells) (). Similar results were obtained when checking the immunophenotype by plotting the immunophenogramCitation23 of each patient (Supplementary Figure 2).
The differential expression analysis showed 146 immune gene candidates that were significantly more expressed in patients with poor prognosis and that belonged to the following families: inflammation (TLRs, proinflammatory cytokines and receptors and associated signaling pathways), leukocyte recruitment (common leukocytes markers and chemokines ligands and receptors), antigen presentation (MHC and antigen processing), myeloid cells (neutrophils, monocytes, macrophages and dendritic cells specific markers), lymphoid cells (T, B lymphocyte and NK cell specific markers) and vessel coagulation (endothelial and hemodynamic markers) (Supplementary File 2). We then defined a gene signature by selecting the top candidates of our differential expression analysis (). This signature encompasses genes implicated in the signaling and production of the proinflammatory cytokines IL-18 (IL18RAP and IL18R1) and IL-1 (GBP5 and IL1R2) and of type I and II interferons (IRF4 and ZBP1), but also in the adhesion (AMICA1 and SLAMF7) and homing of both myeloid (CCL13, CXCR2 and CCR2) and lymphoid cells (CXCL9 and CXCL10). It also includes various subset-specific genes attesting the diversity of the immune infiltrate, comprising neutrophils (FCGR3B), monocyte-derived myeloid cells (CD209, CLEC12A and CLEC4E), but also B (MZB1, CD79A, JCHAIN, FCER2, NUGGC and IKZF3) and cytotoxic (ZNF683, ITK, LAX1, ICOS, TNFRSF9, HSH2D, CD27 and CD3G) lymphocytes, as well as genes associated with both pro- (IDO1) and anti- (GZMA) tumoral immune function. The genes in the signature were grouped into four components (inflammation, leukocyte, lymphocyte and myeloid) on the basis of their ontology and function (). Importantly, the expression of representative myeloid markers significantly correlated with the expression of both T ( and () lymphocyte markers, suggesting both myeloid and lymphoid subsets are enriched in the tumor infiltrate of poor prognosis patients.
The immune signature correlates with specific genomic and clinical features in glioma and the lymphocyte component is predictive of survival in glioma
To confirm our data, we used The Cancer Genome Atlas (TCGA) glioma dataset as a validation cohort (n = 669).Citation24 As in our patient cohort, the four components (inflammation, leukocyte, lymphocyte and myeloid) of our immune signature were highly correlated in the tumor infiltrate of each patient from the TCGA dataset (p < .001) (). We then analyzed the association of the signature with prognostic genotypes, such as IDH mutation and TERT expression, and biomarkers predicting treatment response, such as MGMT promoter methylation.Citation25 Absence of IDH mutations and expression of TERT were associated with high expression of the signature (). These results suggest that patients with these particular clinicopathologic features present a distinct tumor microenvironment, characterized by high inflammation and increased leukocyte infiltration, both of the lymphocyte and myeloid subsets. However, patients with IDH mutation had low signature values even when methylation of the MGMT promoter was present (). In addition, the signature was correlated with tumor grade (). Altogether, by combining genotype profiling and grade, we showed differential expression of the signature according to distinct clinicopathologic features (Supplementary Figure 3), which reflects important differences in the immune microenvironment and could help explain tumor heterogeneity in glioma.
In order to explore the prognostic value of the components (inflammation, leukocyte, lymphocyte and myeloid) of our immune signature, Cox regression analysis was carried out for each component, together with IDH mutation, TERT expression status, and grade, previously shown to be prognostic molecular markers in glioma.Citation25 All parameters were significantly associated with patient survival in univariable analysis (). However, the multivariable regression model revealed that only the lymphocyte component was an independent predictor of survival in glioma when IDH status, grade and TERT status were considered (HR = 1.581, p = .004, ).
Table 1. Univariable and multivariable cox regression model in TCGA. Univariable and multivariable cox regression analysis of average expression score of distinct immune families on patient survival, grade, IDH mutation and TERT expression status.
TCGA samples were classified based on the lymphocyte component of the signature with a median cutoff. Patients with high expression of the lymphocyte signature had shorter survival; on the opposite, patients with low expression of the signature had longer survival, and the difference in survival between the groups was significant, (p < .001, Log-rank Mantel-Cox test, ), suggesting that high expression of lymphocyte genes is associated with poor prognosis in glioma patients. The expression of the lymphocyte signature correlated with distinct clinicopathologic features in glioma (Supplementary Table 4). In addition, we observed similar results when comparing survival in stratified cohorts according to IDH status (HR = 2.223, p < .0001 in IDH wildtype cohort; HR = 1.608, p < .05 in IDH mutant cohort).
In conclusion, the lymphocyte component of the signature is associated with unfavorable prognosis, even when known predictors of survival are taken into account.
Flow cytometry analysis confirms that immune cell infiltration is enriched in poor prognosis glioma patients
We used flow-cytometry analysis of tumor-infiltrating leukocytes to confirm our results in a cohort of 39 patients with grade II, III and IV glioma (median OS: 24 months) (Supplementary Figure 4 and 5). Immune cell marker expression correlated with cell counts measured by flow cytometry in matching samples from the same patient (Supplementary Figure 6).
According to previous reports, we found that patients with poor survival have a statistically significant (p = .01) increase in the number of myeloid cells infiltrating the tumor (). In addition, we observed a significant enrichment of lymphoid subsets generally involved in anti-tumor immune responses, such as CD8+ (, p = .02) and CD4+ helper (, p = .002) T cells and NK cells (, p = .02) in poor prognosis patients. No difference in T regulatory cell counts was observed (). Moreover, activated (CD69+) T (, p = .004), B (, p = .001) and NK (, p = .003) cells were also significantly enriched in tumor biopsies of patients with poor OS. Interestingly, statistically significant associations were also observed between the aforementioned lymphoid cell subsets and tumor grade (Supplementary Figure 7). Finally, as in our gene-expression data, we observed highly significant correlations between the intra-tumoral cell counts of the myeloid and main (T, B or NK cells) lymphoid subset (j-o, p < .0001). Overall, these data demonstrate that in glioma patients, both myeloid and lymphoid infiltrates increase with tumor grade and are significantly associated with shorter OS.
Inflammation and immune markers are enriched in peripheral immune cells of poor prognosis patients in high-grade glioma
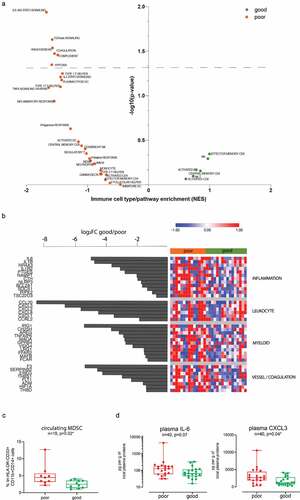
In order to investigate whether an informative profile could be detected in the peripheral immune compartment, we analyzed PBMCs obtained from 30 patients with high-grade tumors using RNAseq. Samples were classified based on a median OS cutoff (median OS: 21 months) to investigate the genes differentially expressed between patients with poor and good prognosis. As for tumor biopsies, we estimated which pathways were enriched in the two groups of patients, using previously defined sets of genes specific of 26 different subpopulations of immune subsetsCitation23 as well as selected hallmark gene sets.Citation22 GSEACitation22 showed an increased inflammatory response in poor prognosis patients: IL-6 signaling was significantly enriched in poor prognosis patients (); GSEA also suggested enhanced vascular remodeling with increased TGF-beta signaling, angiogenesis, coagulation and hypoxia in poor prognosis patients. Finally, both innate (complement) and adaptive (IL2/STAT5 signaling) responses were also upregulated in poor prognosis patients.
This differential expression analysis showed candidates belonging to similar gene families as the signature obtained from the tumor biopsies: inflammation, leukocyte recruitment, myeloid cells, and coagulation, which were more expressed in patients with a worse prognosis. The top candidates of our analysis () included master proinflammatory cytokines (IL6 and IL1B) and associated signaling pathways (IL1R2, NR4A3, NLRP3, and RIPK2) and targets (PTGES, NAMPT, CTH, BCL2A1, SOCS1 and TSC22D3). In addition, we found several chemokines (CCL20, CXCL3, CXCL2, CXCL8 and CXCL1) or receptor (CCRL2) mostly implicated in the attraction and migration of myeloid cells (i.e. dendritic cells, neutrophils, monocytes/macrophages and MDSCs), as well as various genes associated with myeloid cell development (LRG1 and MAFB) or responses to inflammation and danger signals (IRG1, CH25 H, AREG, TNFAIP6, MAOA, GPR84, VSIG4, FFAR2 and FCAR). Finally, several genes associated with coagulation (F3, SERPINB2, and THBD), hypoxia response and vascular remodeling (EREG, THBS1, FLT1, ADM, HIF1A) were also more expressed within poor prognosis patients. Altogether, the results in the peripheral immune cells are consistent with the tumor microenvironment signature associating increased inflammation and immune activation markers in patients with a worse prognosis. We also observed an enrichment of MDSCs in the PBMC of patients with poor prognosis (). However, we did not see an enrichment in the lymphocyte compartment as seen in the tumor, and this was confirmed by flow cytometry analysis of circulating, B, T, CD4 and CD8 T cell subsets (not shown).
To further confirm our results, ELISA analysis of plasmatic IL-1β, IL-6, CCL20 and CXCL3 were conducted in a cohort of 40 patients with grade II, III and IV glioma (median OS: 24 months). IL-1β and CCL20 levels where too low to allow proper detection. A statistically significant association was observed between plasmatic CXCL3 protein levels and patient prognosis (), as well as tumor grade (Supplementary Figure 7 J), but it was not the case for IL-6.
Discussion
In our study, we profiled the transcriptome of patients with high-grade glioma to explore the differences in the tumor and the peripheral immune compartment of patients with different outcomes. We identified a prognostic gene expression signature, which is associated with lower survival in high-grade patients and is based exclusively on immune genes. Importantly, we validated our cell infiltration estimates from the transcriptome analysis by flow cytometry analysis.
Our tumor-derived signature suggests that poor prognosis patients present a more infiltrated, pro-inflammatory microenvironment, characterized by expression of both lymphoid markers including effector molecules such as granzymes, as well as immunosuppressive factors such as IDO1 associated with pro-tumoral myeloid cells.Citation26 Interestingly, lymphoid cells (T, B, and NK lymphocyte-specific markers), whose presence in the tumor microenvironment correlates with a favorable prognosis in several cancers,Citation3 are enriched in glioma tumors with poor prognosis, as previously described in renal cell carcinoma.Citation3 This is in contrast to what has been shown in several studies in glioma,Citation7 although rare reports suggested a possible association between some immunological parameters and bad prognosis.Citation17,Citation27
The expression of lymphocyte-related genes was an independent predictor of survival in glioma patients, in a multivariable regression model including grade, IDH mutation, and TERT expression status. Lymphocytic infiltration increased with grade, together with the expression of myeloid-related genes. Hence, GBM presented a more intense immune response than grade II and III tumors, in agreement with previous findings from Chen et al.Citation28
Our observations about the association between the genotypes and immune phenotypes suggest that the microenvironment is strongly influenced by the genomic profile of the tumor. Several studies have previously characterized the association of the immune composition of gliomas with distinct transcriptional subtypes, showing that the mesenchymal GBM subtype presented an enrichment of inflammation and immune response-related gene expression,Citation11,Citation29 in particular of tumor-associated glial and microglia cells.Citation30,Citation31 In addition, other molecular alterations have important clinical implications for glioma prognosis. IDH1/2 status has been well established as a major molecular prognostic marker in gliomas, together with TERT expression.Citation25 Previous studies showed that IDH mutated samples had a lower macrophageCitation12,Citation30,Citation32 and CD4+ T-cell component,Citation33–Citation36 consistent with our findings that patients with IDH mutated tumors exhibit a lower inflammatory and immune response-related gene expression. Moreover, in the present study, we showed that expression of TERT was associated with higher immune infiltration and high expression of the lymphocyte signature, which constituted an independent prognostic factor and could refine the classification of glioma and its association with prognosis. On the other hand, MGMT promoter methylationCitation37 per se did not correlate with signature expression, suggesting that it is a factor predictive to treatment response rather than a prognosis factor.
Our data suggest that the intra-tumoral lymphocyte infiltrate predicts survival of patients with glioma. However, tumor biopsies are not always available. Furthermore, as GBM tends to be a heterogeneous cancer, relying on a sample from a single location has limitations. Thus, blood- and serum-based biomarkers represent attractive candidates due to ease of access and relative lack of invasiveness to the patient. Using PBMCs, we identified an immune gene expression signature that was associated with glioma prognosis. Similar to the tumor-derived signature, patients with shorter survival showed a peripheral increase in expression of markers of inflammation, immune and vascular activation, yet with higher activation of the myeloid compartment and a detectable increase in circulating MDSC. Leukocyte markers were enriched in worse prognosis patients, without an increase of specific lymphocyte genes as seen in the tumor.
Interestingly, this peripheral signature encompasses several soluble factors (IL-6, Il-1beta, CCL20, CXCL3, CXCL2, CXCL8, and CXCL1) that could be measured in the serum for patient monitoring. Accordingly, increases in IL-6, CXCL8 peripheral expression,Citation38 and IL-6 serum concentrationCitation39 have already been reported in glioma patients compared with healthy donors. Furthermore, a previous study reported an association between the OS of glioma patients and the serum concentration of IL-6.Citation40 Our study highlights a statistically significant association between CXCL3 plasmatic levels and patient prognosis, as well as tumor grade. Besides seric markers, increased expression of monocytes chemo-attractant proteins, as well as genes implicated in myeloid cell development and activation, suggests that considerable changes occur within the peripheral myeloid compartment. This observation is consistent with previous studies describing the prognostic value of elevated circulating neutrophilsCitation41-Citation44 and MDSCsCitation45-Citation48 in glioma patients. Whether such systemic changes reflect variable levels of immune cell tropism and sequestration in the bone marrow, as recently described,Citation49 was not possible to explore in this study in the absence of bone marrow samples.
In conclusion, our study associated increased inflammation, immune infiltration and immune activation with unfavorable prognosis and higher tumor grade in patients with glioma. Our data identified a prognostic signature associated with shorter survival, which comprises lymphocyte-specific genes in the tumor infiltrate. These findings strengthen the concept that the immune environment supports tumor progression in glioma. Indeed, previous studies have shown that inflammatory cytokines (IL-1β, IL-6, and IL-8) promote glioma carcinogenesis and/or progression through activation of proliferative mechanisms and signaling pathways involved in migration, invasiveness and angiogenesis.Citation50 In addition, analysis of tumor samples collected after CAR T cell therapies showed dramatic adaptive immune changes favoring tumor escape, and confirming that immune response is a delicate dynamic balance promoting pro- and anti-tumor effects.Citation51 Together, these data show that targeting the glioma inflammatory environment will be critical to reach therapeutic benefit. Considering the limited impact of each individual strategy, combining different immunotherapeutic approaches will certainly be required. Indeed, vaccines are not yet practice changingCitation52,Citation53 and the potential of immune checkpoint inhibitors alone is debated. Recent studies showed immunomodulation of the tumor microenvironment by anti-PD1 treatment,Citation54,Citation55 although these results were questioned by another report demonstrating that anti-PD1-responding patients displayed higher levels of immunosuppression-related genes following immunotherapy.Citation56 In this regard, our study shows the importance of understanding the immune microenvironment of patients before therapeutic intervention, and encourages the development of noninvasive dynamic imaging tools to capture the status of the tumor immune microenvironment and help design prognostic models in cancer patients receiving immunotherapies.
Materials and methods
Patient samples
Tumor biopsies and peripheral blood samples were collected from grade II–IV glioma patients at the time of surgery before chemoradiation. Tumor biopsies were snap-frozen for RNAseq, or mechanically and enzymatically digested (collagenase IA, Sigma-Aldrich) and cryopreserved in 10% DMSO (AppliChem) for flow cytometry and stored in liquid nitrogen until further use. Peripheral blood mononuclear cells (PBMCs) were isolated on a Lymphoprep (Axis-Shield) density gradient, cryopreserved in 10% DMSO and stored in liquid nitrogen until further use. Plasma samples were isolated on a Lymphoprep (Axis-Shield) density gradient and stored at −80°C until further use. Biological sample and health-related data collection was approved by the Ethics Committee of the state of Geneva. All participating patients provided signed informed consent. The study was conducted in accordance with the 1975 Declaration of Helsinki. Patient clinical characteristics are summarized in Supplementary Table 1 (Tumor Biopsies used for RNAseq), Supplementary Table 2 (Tumor biopsies used for flow cytometry analysis), Supplementary Table 3 (PBMCs samples used for RNAseq) and Supplementary Table 5 (Plasma samples used for ELISA). Whenever possible, matching samples were used from the same patients for different analyses (Supplementary Figure 1A).
RNAseq gene expression analysis
RNA was extracted using the RNeasy Plus MiniKit (Qiagen). RNA-seq (TruSeq Stranded mRNA protocol, Illumina) was performed in our patient cohorts (n = 19 tumor biopsies, and n = 30 PBMC samples). Reads (100 bp) were mapped using TopHat.Citation57 Biological quality control and summarization were done with PicardTools v1.80. Counts (total number of reads aligning to each genomic feature) were generated by HTSeq v.0.6.1 (http://www.huber.embl.de/users/anders/HTSeq/). MDS analysis was also used to check the quality of the samples. The normalization and differential expression analysis were performed with the R/Bioconductor package edgeR v.3.4.2.Citation58 The data were filtered and normalized by the library size and gene length, differentially expressed genes were estimated using the GLM approach (Generalized Linear Model). TCGA glioma patient data (https://www.cancer.gov/tcga), downloaded from GlioVis (http://gliovis.bioinfo.cnio.es/), were analyzed as a validation cohort. Heatmaps were generated through Morpheus (https://software.broadinstitute.org/morpheus). Waterfalls were generated with R version 3.3.2 (https://www.R-project.org/). The signature value was calculated as the average expression of the genes in each component. Maximally selected rank statistics was used to determine the optimal cutoff for survival analysis of continuous variables, as provided in the ’survminer’ package.
Statistical analysis was performed using SPSS software, version 25.0. The differences in survival between groups were calculated by the log-rank test. Baseline TCGA patient characteristics were compared using the Chi-square test for categorical variables and Mann-Whitney U test for continuous variables. All statistical tests were two-tailed at an α of 0.05.
GSEA analysis and immunophenoscore
Gene set enrichment analysis (GSEA) was performed as previously described.Citation22 The following gene sets were tested: i) selected gene sets (Supplementary file 3) from the Molecular Signatures Database (MSigDB) hallmark gene set collectionCitation59 and ii) subsets of genes representative for specific immune cell types,Citation23 and filtered by size after being restricted to the specific dataset (minimum size = 15, maximum = 500). The immunophenoscore (IPS) was calculated based on the sum of the weighted averaged Z score and an immunophenogram was constructed for each patient, as previously described.Citation23
Flow cytometry analysis
Thawed digested tumor samples (n = 39) were washed, Fc-blocked (BioLegend), split into two and stained for 15 min at RT in PBS 0.05%NaN3 with mouse anti-human BV711 anti-CD69 (BD Horizon), or with the corresponding isotype. Samples were washed with PBS 0.05%NaN3 and stained for 15 min at RT in PBS 0.05%NaN3 with a second panel of antibodies: BB515 anti-CD3, BV510 anti CD4, BUV737 anti-CD19, BV421 anti-CD45, A647 anti-CD127 (BD Horizon), PECy5.5 anti-CD8 (BD Pharmingen), PECy7 anti-CD11b (Beckman Coulter), BB700 anti-CD16/56 (BD OptiBuild) and PE anti-CD25 (BD Biosciences). Finally, samples were washed, stained with DRAQ7 (BD Pharmingen) and acquired on a LSRFortessa (BD Biosciences) analyzer. Leukocyte subset counts and statistics were analyzed using FlowJo (v.10.4.2) and Prism (v7.02) software by Mann-Whitney (2 groups) or Kruskal-Wallis (3 groups) tests. The associated p-values and sample sizes are indicated throughout. The number of total cells per sample ranged from 53ʹ482 to 13ʹ900ʹ000 (median 3ʹ630ʹ000). Samples with fewer than 50ʹ000 cells were not considered. The number of CD45+ leukocytes per sample ranged from 372 to 231ʹ411 (median 6823).
PBMCs were similarly stained in two different panels with BV421 anti-CD45, PE anti-CD3, PE-CF594 anti-CD4, FITC anti-CD19 (BD Pharmingen) and PE-Cy7 anti-CD11b (Beckman Coulter) or APC anti-CD16, PerCPCy5.5 anti-HLA-DR, PE-Cy7 anti-CD11b and FITC anti-CD14 (BD Pharmingen), APC anti-CD3, APC anti-CD19, APC anti-CD56 and APC-A750 anti-CD33 (Beckman Coulter).
ELISA analysis
IL-1β, IL-6, CCL20 (MIP3A), CXCL3 protein were measured in thawed plasma samples using the corresponding Human ELISA Kits (Abcam) and according to the manufacturer’s instructions. Levels were normalized to total plasma protein as assessed using the BCA Protein Assay Kit (Thermo Scientific), and statistics were analyzed using Prism (v7.02) software by Mann-Whitney (2 groups) or Kruskal-Wallis (3 groups) tests. The associated p-values and sample sizes are indicated throughout.
Figure 1. Immune gene families are enriched in poor prognosis patients. (a) Plot showing the enrichment of immune cell types and immune signaling pathways in good prognosis patients (green, n = 10) and poor prognosis patients (orange, n = 9) calculated based on Normalized enrichment score (NES) from the GSEA and the – log10(p-value) for each of the families tested. (b) Heatmap showing the Z score of immune candidates differentially expressed (FDR≤0.15) between good prognosis (green bar) and poor prognosis (orange bar) patients, grouped by immune gene families. The waterfall graph shows the log2 fold change in expression between good prognosis and poor prognosis patients for each gene. (c) and (d) Spearman correlation between log10 (1+ average normalized counts per million) of T cell markers (CD3E, CD3G, CD3D, CD274) and myeloid markers (IDO1, ITGAM) (c), B cell markers (BLK, CD19, CD79A, CD79B, FCER2, FCRLA, JCHAIN, MS4A1) and myeloid markers (d).
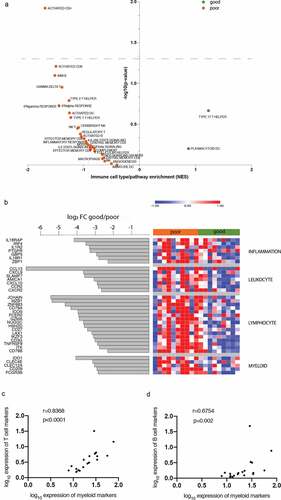
Figure 2. Validation of the identified signature with the TCGA cohort. (a) Correlation matrix (Spearman r) between average gene expression of the four immune signature components (all correlations, p < .001). (b) and (c) heatmaps showing the Z score of the signature gene expression according to the genotype (b) and grade (c). (d) Survival curves from patients with high and low expression of the signature; p < .001, Log Rank test (Mantel-Cox). Black curve: median survival = 25.9 months, gray: median survival = 93.2 months. The Hazard ratio (HR) between high and low expression of the signature was 3.05 (95% CI, 2.318 to 4.013, p < .001).
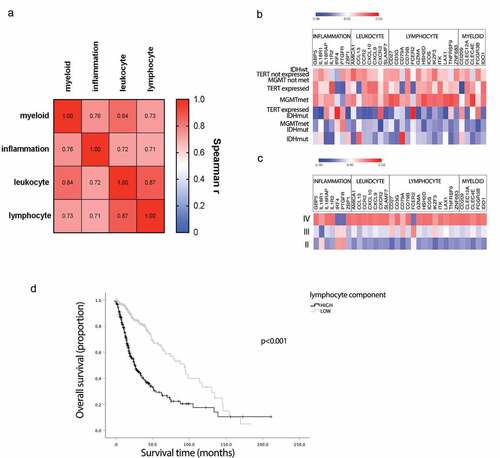
Figure 3. Flow cytometry analysis of glioma leukocyte infiltration according to patient prognosis. Quantitative analysis of myeloid cells (a), CD8 T cells (b), CD4 T cells (c), regulatory T cells (d), B cells (e), NK cells (f), CD69-positive T cells (g), CD69-positive B cells (h) and CD69-positive NK cells (i) in patients with poor (mOS < 24 months) and good (mOS ≥ 24 months) prognosis. Data are expressed as counts per million of total cells and depicted as box (25th to 75th percentiles) and whisker (10th to 90th percentiles) with the middle line representing the median. Samples for which a specific cell subset was not detected are depicted as “no count”. Correlations between myeloid (j-l), T (j, mand n), B (k, mand o) and NK (l, nand o) cell counts per million. Numbers of glioma samples (n), as well as Mann-Whitney test and Spearman correlation (α = 0.05)-derived p values are indicated in the graph.
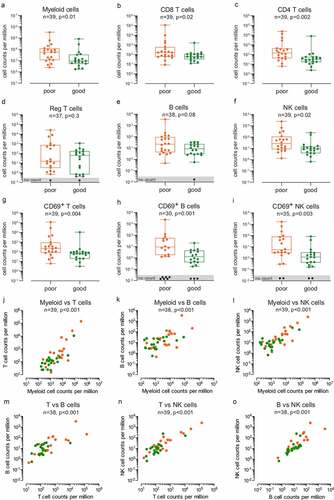
Figure 4. Immune and inflammation pathways are enriched in peripheral immune cells of poor prognosis patients. (a) Plot showing the enrichment of immune cell types and immune signaling pathways in good prognosis patients (green, n = 16) and poor prognosis patients (orange, n = 14) calculated based on Normalized enrichment score (NES) from the GSEA and the – log10(p-value) for each of the families tested. (b) Heatmap showing the Z score of immune candidates differentially expressed (FDR≤0.1) between good prognosis (green bar) and poor prognosis (orange bar) patients, grouped by immune gene families. The waterfall graph shows the log2 fold change in expression between good prognosis and poor prognosis patients for each gene. (c) Percentage of MDSCs in PBMCs of patients with poor (mOS < 21 months) and good (mOS ≥ 21 months) prognosis. Data are expressed as %lin-HLA-DR-CD33+ CD11b+CD14+ cells and depicted as box (25th to 75th percentiles) and whisker (10th to 90th percentiles) with the middle line representing the median. Numbers of glioma samples (n), as well as Mann-Whitney test-derived p value are indicated in the graph. (d) Quantitative analysis of plasmatic IL-6 and CXCL3 in patients with poor (mOS < 24 months) and good (mOS ≥ 24 months) prognosis. Data are expressed as pg per g of total plasmatic proteins and depicted as box (25th to 75th percentiles) and whisker (10th to 90th percentiles) with the middle line representing the median. Numbers of glioma samples (n), as well as Mann-Whitney test-derived p values are indicated in the graph.
Authorship
Conception and design of the project: EM, MA, VD, PYD; analysis and interpretation of the data: EM, MA, PT, VD, PYD; generation and acquisition of data: EM, MA, VW, RG, GP; writing of the manuscript: EM, MA, VW, RG, GP, VD, PYD; revision of the manuscript: EM, MA, VW, RG, GP, DM, PT, VD, PYD.
Disclosure of interest
The authors report no conflict of interest
Supplemental Material
Download ()Acknowledgments
We thank the core genomic facility of the University of Geneva (iGE3 platform support from Mylène Docquier, Didier Chollet and Natacha Civic) for advice and assistance and Carole Verdan for technical help. We thank Paul Walker and Erika Cosset for helpful comments and discussions
Supplementary
Supplemental data for this article can be accessed on the publisher’s website.
Additional information
Funding
References
- Stupp R, Mason WP, van den Bent MJ, Weller M, Fisher B, Taphoorn MJB, Belanger K, Brandes AA, Marosi C, Bogdahn U, et al. Radiotherapy plus concomitant and adjuvant temozolomide for glioblastoma. N Engl J Med. 2005;352(10):987–12. doi:10.1056/NEJMoa043330.
- Stupp R, Taillibert S, Kanner A, Read W, Steinberg DM, Lhermitte B, Toms S, Idbaih A, Ahluwalia MS, Fink K, et al. Effect of tumor-treating fields plus maintenance temozolomide vs maintenance temozolomide alone on survival in patients with glioblastoma: a randomized clinical trial. JAMA. 2017;318(23):2306–2316. doi:10.1001/jama.2017.18718.
- Fridman WH, Zitvogel L, Sautes-Fridman C, Kroemer G. The immune contexture in cancer prognosis and treatment. Nat Rev Clin Oncol. 2017;14(12):717–734. doi:10.1038/nrclinonc.2017.101.
- Ginhoux F, Lim S, Hoeffel G, Low D, Huber T. Origin and differentiation of microglia. Front Cell Neurosci. 2013;7:45. doi:10.3389/fncel.2013.00045.
- Muller S, Kohanbash G, Liu SJ, Alvarado B, Carrera D, Bhaduri A, Watchmaker PB, Yagnik G, Di Lullo E, Malatesta M, et al. Single-cell profiling of human gliomas reveals macrophage ontogeny as a basis for regional differences in macrophage activation in the tumor microenvironment. Genome Biol. 2017;18(1):234. doi:10.1186/s13059-017-1362-4.
- Annovazzi L, Mellai M, Bovio E, Mazzetti S, Pollo B, Schiffer D. Microglia immunophenotyping in gliomas. Oncol Lett. 2018;15(1):998–1006. doi:10.3892/ol.2017.7386.
- Bienkowski M, Preusser M. Prognostic role of tumour-infiltrating inflammatory cells in brain tumours: literature review. Curr Opin Neurol. 2015;28(6):647–658. doi:10.1097/WCO.0000000000000251.
- Liu S, Zhang C, Maimela NR, Yang L, Zhang Z, Ping Y, Huang L, Zhang Y. Molecular and clinical characterization of CD163 expression via large-scale analysis in glioma. Oncoimmunology. 2019;8(7):1601478. doi:10.1080/2162402X.2019.1601478.
- Yuan Y, Zhao Q, Zhao S, Zhang P, Zhao H, Li Z, Du Y, Tian X, Lu J. Characterization of transcriptome profile and clinical features of a novel immunotherapy target CD204 in diffuse glioma. Cancer Med. 2019; doi:10.1002/cam4.2312.
- Vauleon E, Tony A, Hamlat A, Etcheverry A, Chiforeanu DC, Menei P, Mosser J, Quillien V, Aubry M. Immune genes are associated with human glioblastoma pathology and patient survival. BMC Med Genomics. 2012;5(1):41. doi:10.1186/1755-8794-5-41.
- Arimappamagan A, Somasundaram K, Thennarasu K, Peddagangannagari S, Srinivasan H, Shailaja BC, Samuel C, Patric IRP, Shukla S, Thota B, et al. A fourteen gene GBM prognostic signature identifies association of immune response pathway and mesenchymal subtype with high risk group. PLoS One. 2013;8(4):e62042. doi:10.1371/journal.pone.0062042.
- Cheng W, Ren X, Zhang C, Cai J, Liu Y, Han S, Wu A. Bioinformatic profiling identifies an immune-related risk signature for glioblastoma. Neurology. 2016;86(24):2226–2234.
- Moyes KW, Davis A, Hoglund V, Haberthur K, Lieberman NA, Kreuser SA, Deutsch GH, Franco S, Locke D, Carleton MO, et al. Effects of tumor grade and dexamethasone on myeloid cells in patients with glioma. Oncoimmunology. 2018;7(11):e1507668. doi:10.1080/2162402X.2018.1507668.
- Zhang L, Conejo-Garcia JR, Katsaros D, Gimotty PA, Massobrio M, Regnani G, Makrigiannakis A, Gray H, Schlienger K, Liebman MN, et al. Intratumoral T cells, recurrence, and survival in epithelial ovarian cancer. N Engl J Med. 2003;348(3):203–213. doi:10.1056/NEJMoa020177.
- Kmiecik J, Poli A, Brons NH, Waha A, Eide GE, Enger PØ, Zimmer J, Chekenya M. Elevated CD3+ and CD8+ tumor-infiltrating immune cells correlate with prolonged survival in glioblastoma patients despite integrated immunosuppressive mechanisms in the tumor microenvironment and at the systemic level. J Neuroimmunol. 2013;264(1–2):71–83. doi:10.1016/j.jneuroim.2013.08.013.
- Yue Q, Zhang X, Ye HX, Wang Y, Du Z-G, Yao Y, Mao Y. The prognostic value of Foxp3+ tumor-infiltrating lymphocytes in patients with glioblastoma. J Neurooncol. 2014;116(2):251–259. doi:10.1007/s11060-013-1314-0.
- Zhai L, Ladomersky E, Lauing KL, Wu M, Genet M, Gritsina G, Győrffy B, Brastianos PK, Binder DC, Sosman JA, et al. Infiltrating T Cells Increase IDO1 Expression in Glioblastoma and Contribute to Decreased Patient Survival. Clin Cancer Res. 2017;23(2):6650–6660. doi:10.1158/1078-0432.CCR-17-0120.
- Lohr J, Ratliff T, Huppertz A, Ge Y, Dictus C, Ahmadi R, Grau S, Hiraoka N, Eckstein V, Ecker RC, et al. Effector T-cell infiltration positively impacts survival of glioblastoma patients and is impaired by tumor-derived TGF-beta. Clin Cancer Res. 2011;17(13):4296–4308. doi:10.1158/1078-0432.CCR-10-2557.
- Sayour EJ, McLendon P, McLendon R, De Leon G, Reynolds R, Kresak J, Sampson JH, Mitchell DA. Increased proportion of FoxP3+ regulatory T cells in tumor infiltrating lymphocytes is associated with tumor recurrence and reduced survival in patients with glioblastoma. Cancer Immunol Immunother. 2015;64(4):419–427. doi:10.1007/s00262-014-1651-7.
- Huang da W, Sherman BT, Lempicki RA. Systematic and integrative analysis of large gene lists using DAVID bioinformatics resources. Nat Protoc. 2009;4(1):44–57. doi:10.1038/nprot.2008.211.
- Huang da W, Sherman BT, Lempicki RA. Bioinformatics enrichment tools: paths toward the comprehensive functional analysis of large gene lists. Nucleic Acids Res. 2009;37(1):1–13. doi:10.1093/nar/gkn923.
- Subramanian A, Tamayo P, Mootha VK, Mukherjee S, Ebert BL, Gillette MA, Paulovich A, Pomeroy SL, Golub TR, Lander ES, et al. Gene set enrichment analysis: a knowledge-based approach for interpreting genome-wide expression profiles. Proc Natl Acad Sci U S A. 2005;102(43):15545–15550. doi:10.1073/pnas.0506580102.
- Charoentong P, Finotello F, Angelova M, Mayer C, Efremova M, Rieder D, Hackl H, Trajanoski Z. Pan-cancer immunogenomic analyses reveal genotype-immunophenotype relationships and predictors of response to checkpoint blockade. Cell Rep. 2017;18(1):248–262. doi:10.1016/j.celrep.2016.12.019.
- Ceccarelli M, Barthel FP, Malta TM, Sabedot T, Salama S, Murray B, Morozova O, Newton Y, Radenbaugh A, Pagnotta S, et al. Molecular profiling reveals biologically discrete subsets and pathways of progression in diffuse glioma. Cell. 2016;164(3):550–563. doi:10.1016/j.cell.2015.12.028.
- Aquilanti E, Miller J, Santagata S, Cahill DP, Brastianos PK. Updates in prognostic markers for gliomas. Neuro Oncol. 2018;20(suppl_7):vii17–vii26. doi:10.1093/neuonc/noy158.
- Holmgaard RB, Zamarin D, Li Y, Gasmi B, Munn D, Allison J, Merghoub T, Wolchok J. Tumor-expressed IDO recruits and activates MDSCs in a treg-dependent manner. Cell Rep. 2015;13(2):412–424. doi:10.1016/j.celrep.2015.08.077.
- Roufas C, Chasiotis D, Makris A, Efstathiades C, Dimopoulos C, Zaravinos A. The expression and prognostic impact of immune cytolytic activity-related markers in human malignancies: a comprehensive meta-analysis. Front Oncol. 2018;8:27. doi:10.3389/fonc.2018.00027.
- Cheng W, Ren XF, Zhang CB, Cai J, Liu Y, Han S, Wu A. Bioinformatic profiling identifies an immune-related risk signature for glioblastoma. Neurology. 2016;86(24):2226–2234.
- Doucette T, Rao G, Rao A, Shen L, Aldape K, Wei J, Dziurzynski K, Gilbert M, Heimberger AB. Immune heterogeneity of glioblastoma subtypes: extrapolation from the cancer genome atlas. Cancer Immunol Res. 2013;1(2):112–122. doi:10.1158/2326-6066.CIR-13-0028.
- Bockmayr M, Klauschen F, Maire CL, Rutkowski S, Westphal M, Lamszus K, Schüller U, Mohme M. Immunological profiling of mutational and transcriptional subgroups in pediatric and adult high-grade gliomas. Cancer Immunol Res. 2019;7(9):1401–1411. doi:10.1158/2326-6066.CIR-18-0939.
- Wang QH, Hu BL, Hu X, Kim H, Squatrito M, Scarpace L, deCarvalho AC, Lyu S, Li P, Li Y, et al. Tumor Evolution of Glioma-Intrinsic Gene Expression Subtypes Associates with Immunological Changes in the Microenvironment. Cancer Cell. 2017;32(1):42-+. doi:10.1016/j.ccell.2017.06.003.
- Qian ZH, Li YM, Fan X, Zhang C, Wang Y, Jiang T, Liu X. Molecular and clinical characterization of IDH associated immune signature in lower-grade gliomas. Oncoimmunology. 2018;7(6):e1434466. doi:10.1080/2162402X.2018.1434466.
- Luoto S, Hermelo I, Vuorinen E, Hannus P, Kesseli J, Nykter M, Granberg K. TMIC-30. computational characterization of suppressive immune microenvironments in glioblastoma. Neuro-Oncology. 2018;20(suppl_6):262. doi:10.1093/neuonc/noy148.1089.
- Berghoff AS, Kiesel B, Widhalm G, Wilhelm D, Rajky O, Kurscheid S, Kresl P, Wöhrer A, Marosi C, Hegi ME, et al. Correlation of immune phenotype with IDH mutation in diffuse glioma. Neuro-Oncology. 2017;19(11):1460–1468. doi:10.1093/neuonc/nox054.
- Bunse L, Pusch S, Bunse T, Sahm F, Sanghvi K, Friedrich M, Alansary D, Sonner JK, Green E, Deumelandt K, et al. Suppression of antitumor T cell immunity by the oncometabolite (R)-2-hydroxyglutarate. Nat Med. 2018;24(8):1192-+. doi:10.1038/s41591-018-0095-6.
- Kohanbash G, Carrera DA, Shrivastav S, Ahn BJ, Jahan N, Mazor T, Chheda ZS, Downey KM, Watchmaker PB, Beppler C, et al. Isocitrate dehydrogenase mutations suppress STAT1 and CD8+ T cell accumulation in gliomas. J Clin Invest. 2017;127(4):1425–1437. doi:10.1172/JCI90644.
- Hegi ME, Diserens AC, Gorlia T, Hamou M-F, de Tribolet N, Weller M, Kros JM, Hainfellner JA, Mason W, Mariani L, et al. MGMT gene silencing and benefit from temozolomide in glioblastoma. N Engl J Med. 2005;352(10):997–1003. doi:10.1056/NEJMoa043331.
- Samaras V, Piperi C, Levidou G, Zisakis A, Kavantzas N, Themistocleous MS, Boviatsis EI, Barbatis C, Lea RW, Kalofoutis A, et al. Analysis of interleukin (IL)-8 expression in human astrocytomas: associations with IL-6, cyclooxygenase-2, vascular endothelial growth factor, and microvessel morphometry. Hum Immunol. 2009;70(6):391–397. doi:10.1016/j.humimm.2009.03.011.
- Reynes G, Vila V, Martin M, Parada A, Fleitas T, Reganon E, Martínez-Sales V. Circulating markers of angiogenesis, inflammation, and coagulation in patients with glioblastoma. J Neuro-Oncol. 2011;102(1):35–41. doi:10.1007/s11060-010-0290-x.
- Shan Y, He X, Song W, Han D, Niu J, Wang J. Role of IL-6 in the invasiveness and prognosis of glioma. Int J Clin Exp Med. 2015;8:9114–9120.
- Gabrusiewicz K, Rodriguez B, Wei J, Hashimoto Y, Healy LM, Maiti SN, Thomas G, Zhou S, Wang Q, Elakkad A, et al. Glioblastoma-infiltrated innate immune cells resemble M0 macrophage phenotype. Jci Insight. 2016;1(2). doi:10.1172/jci.insight.85841.
- Bambury RM, Teo MY, Power DG, Yusuf A, Murray S, Battley JE, Drake C, O’Dea P, Bermingham N, Keohane C, et al. The association of pre-treatment neutrophil to lymphocyte ratio with overall survival in patients with glioblastoma multiforme. J Neuro-Oncol. 2013;114(1):149–154. doi:10.1007/s11060-013-1164-9.
- McNamara MG, Lwin Z, Jiang HY, Templeton AJ, Zadeh G, Bernstein M, Chung C, Millar B-A, Laperriere N, Mason WP, et al. Factors impacting survival following second surgery in patients with glioblastoma in the temozolomide treatment era, incorporating neutrophil/lymphocyte ratio and time to first progression. J Neuro-Oncol. 2014;117(1):147–152. doi:10.1007/s11060-014-1366-9.
- Mason M, Maurice C, McNamara MG, Tieu MT, Lwin Z, Millar B-A, Menard C, Laperriere N, Milosevic M, Atenafu EG, et al. Neutrophil-lymphocyte ratio dynamics during concurrent chemo-radiotherapy for glioblastoma is an independent predictor for overall survival. J Neuro-Oncol. 2017;132(3):463–471. doi:10.1007/s11060-017-2395-y.
- Gielen PR, Schulte BM, Kers-Rebel ED, Verrijp K, Petersen-Baltussen HMJM, Ter Laan M, Wesseling P, Adema GJ. Increase in both CD14-positive and CD15-positive myeloid-derived suppressor cell subpopulations in the blood of patients with glioma but predominance of cd15-positive myeloid-derived suppressor cells in glioma tissue. J Neuropath Exp Neur. 2015;74(5):390–400. doi:10.1097/NEN.0000000000000183.
- Gielen PR, Schulte BM, Kers-Rebel ED, Verrijp K, Bossman SAJFH, Ter Laan M, Wesseling P, Adema GJ. Elevated levels of polymorphonuclear myeloid-derived suppressor cells in patients with glioblastoma highly express S100A8/9 and arginase and suppress T cell function. Neuro-Oncology. 2016;18(9):1253–1264. doi:10.1093/neuonc/now034.
- Dubinski D, Wolfer J, Hasselblatt M, Schneider-Hohendorf T, Bogdahn U, Stummer W, Wiendl H, Grauer OM. CD4 + T effector memory cell dysfunction is associated with the accumulation of granulocytic myeloid-derived suppressor cells in glioblastoma patients. Neuro-Oncology. 2016;18(6):807–818. doi:10.1093/neuonc/nov280.
- Alban TJ, Alvarado AG, Sorensen MD, Bayik D, Volovetz J, Serbinowski E, Mulkearns-Hubert EE, Sinyuk M, Hale JS, Onzi GR, et al. Global immune fingerprinting in glioblastoma patient peripheral blood reveals immune-suppression signatures associated with prognosis. JCI Insight. 2018;3(21). doi:10.1172/jci.insight.122264.
- Chongsathidkiet P, Jackson C, Koyama S, Loebel F, Cui X, Farber SH, Woroniecka K, Elsamadicy AA, Dechant CA, Kemeny HR, et al. Sequestration of T cells in bone marrow in the setting of glioblastoma and other intracranial tumors. Nat Med. 2018;24(9):1459–1468. doi:10.1038/s41591-018-0135-2.
- Yeung YT, McDonald KL, Grewal T, Munoz L. Interleukins in glioblastoma pathophysiology: implications for therapy. Brit J Pharmacol. 2013;168(3):591–606. doi:10.1111/bph.12008.
- O’Rourke DM, Nasrallah MP, Desai A, Melenhorst JJ, Mansfield K, Morrissette JJD, Martinez-Lage M, Brem S, Maloney E, Shen A, et al. A single dose of peripherally infused EGFRvIII-directed CAR T cells mediates antigen loss and induces adaptive resistance in patients with recurrent glioblastoma. Sci Transl Med. 2017;9(399):eaaa0984. doi:10.1126/scitranslmed.aaa0984.
- Reardon DA, Desjardins A, Vredenburgh JJ, O’Rourke DM, Tran DD, Fink KL, Nabors LB, Li G, Bota DA, Lukas RV, et al. Rindopepimut with bevacizumab for patients with relapsed eGFRvIII-expressing glioblastoma (ReACT): results of a double-blind randomized phase ii trial. Clin Cancer Res. 2020;26(7):1586–1594. doi:10.1158/1078-0432.CCR-18-1140.
- Weller M, Butowski N, Tran DD, Recht LD, Lim M, Hirte H, Ashby L, Mechtler L, Goldlust SA, Iwamoto F, et al. Rindopepimut with temozolomide for patients with newly diagnosed, EGFRvIII-expressing glioblastoma (ACT IV): a randomised, double-blind, international phase 3 trial. Lancet Oncol. 2017;18(10):1373–1385. doi:10.1016/S1470-2045(17)30517-X.
- Schalper KA, Rodriguez-Ruiz ME, Diez-Valle R, López-Janeiro A, Porciuncula A, Idoate MA, Inogés S, de Andrea C, López-diaz de Cerio A, Tejada S, et al. Neoadjuvant nivolumab modifies the tumor immune microenvironment in resectable glioblastoma. Nat Med. 2019;25(3):470–476. doi:10.1038/s41591-018-0339-5.
- Cloughesy TF, Mochizuki AY, Orpilla JR, Hugo W, Lee AH, Davidson TB, Wang AC, Ellingson BM, Rytlewski JA, Sanders CM, et al. Neoadjuvant anti-PD-1 immunotherapy promotes a survival benefit with intratumoral and systemic immune responses in recurrent glioblastoma. Nat Med. 2019;25(3):477–486. doi:10.1038/s41591-018-0337-7.
- Zhao J, Chen AX, Gartrell RD, Silverman AM, Aparicio L, Chu T, Bordbar D, Shan D, Samanamud J, Mahajan A, et al. Immune and genomic correlates of response to anti-PD-1 immunotherapy in glioblastoma. Nat Med. 2019;25(3):462–469. doi:10.1038/s41591-019-0349-y.
- Trapnell C, Pachter L, Salzberg SL. TopHat: discovering splice junctions with RNA-Seq. Bioinformatics. 2009;25(9):1105–1111. doi:10.1093/bioinformatics/btp120.
- Robinson MD, McCarthy DJ, Smyth GK. edgeR: a Bioconductor package for differential expression analysis of digital gene expression data. Bioinformatics. 2010;26(1):139–140. doi:10.1093/bioinformatics/btp616.
- Liberzon A, Birger C, Thorvaldsdottir H, Ghandi M, Mesirov JP, Tamayo P. The molecular signatures database (MSigDB) hallmark gene set collection. Cell Syst. 2015;1(6):417–425. doi:10.1016/j.cels.2015.12.004.