
ABSTRACT
Objective
The purpose of this study was to explore the composition of tumor-infiltrating immune cells (TIIC) and prognostic significance of tumor-infiltrating mast cells (TIMC) in adrenocortical carcinoma (ACC).
Methods
The gene expression profiles of ACC were downloaded from the Cancer Genome Atlas (TCGA) and Gene Expression Omnibus (GSE90713, GSE12368). The abundance of TIICs in ACC samples was calculated by CIBERSORT algorithm and immunohistochemistry was used to identify mast cells of 39 tumor samples from Fudan University Shanghai Cancer Center (FUSCC). Differentially expressed genes (DEGs) were analyzed by LIMMA package using R software. Survival analysis was analyzed by Kaplan-Meier method and Cox regression models.
Results
The abundance of mast cells (p = .008) was positively correlated with ACC patients’ outcome in TCGA cohort and was also positively correlated with both overall survival (p < .05) and progression-free survival (p < .05) in FUSCC cohort. Different TIMC infiltrations showed significant changes in signaling pathways including DNA replication, nuclear chromosome segregation, and meiotic cell cycle process of ACC. In addition, elevated expression of eight hub genes (KIF18A, CDCA8, SKA1, CEP55, BUB1, CDK1, SGOL1, SGOL2) related to the abundance of TIMC in ACC was significantly correlated with the poor prognosis of the patients.
Conclusion
In conclusion, higher TIMC infiltration was positively correlated with ACC patients’ outcome in both TCGA and FUSCC cohort. Lower TIMC infiltration and elevated expression of hub genes (KIF18A, CDCA8, SKA1, CEP55, BUB1, CDK1, SGOL1, SGOL2) are markedly correlated with aggressive progression and poor prognosis, which might shed lights on novel targets for treatment strategies.
Introduction
Adrenocortical carcinoma (ACC) is a very rare endocrine malignancy, the Surveillance, Epidemiology, and End Results (SEER) database estimates that the annual incidence rate is about 0.72 per million cases, resulting in 0.2% of all cancer deaths in the United States.Citation1 Due to difficulties in early diagnosis of ACC, most patients have appeared metastasis at first diagnosis, and thus leading to few opportunities for surgery and extremely poor prognosis.Citation2 At present, mitotane remains the only nemesis approved by the U.S. Food and Drug Administration for ACC treatment,Citation3 and high-risk ACC patients can only be treated with mitotane alone or in combination with cytotoxic drugs, while these treatments could merely bring them limited survival benefits.Citation4 In recent years, management of immune microenvironment and immunotherapy development has made a great breakthrough in many cancers, including melanoma, clear cell renal cell carcinoma, non-small cell lung cancer, etc.Citation5,Citation6 Hence, future progress and opportunities in immunotherapy may be able to bring novel treatment managements of ACC.Citation7 Tumor immune microenvironment plays an important role in the occurrence and progression of cancer and can greatly affect the effect of immunotherapy.Citation8 Therefore, it is of great significance to evaluate tumor immune microenvironment and investigate major promotion to cancer aggressive progression and unfavorable prognosis of ACC.
In the past few decades, more and more evidences show that the malignant phenotype of tumor is determined by the inherent activity of tumor cells and the complex interaction of various cell types in the tumor microenvironment (TME), especially the tumor-infiltrating immune cells (TIICs).Citation9,Citation10 There is a rising awareness that TIICs can interact with the tumor cells, change the tumor immune microenvironment, and even affect the management of cancer.Citation11,Citation12 Ren et al.Citation13 reported that the interaction between stromal cells and epithelial cells affects the progression of pancreatic cancer and Bingle L et al.Citation14 reported that tumor-related macrophage infiltration has a negative effect on the prognosis of patients with breast and bladder cancer. However, the role TIICs play in ACC remains blurred and it needs to be further studied.
Mast cell is a kind of granulocyte immune cell, which exists in tissues exposed to the external environment. Current studies revealed that the function of tumor-infiltrating mast cell (TIMC) varies greatly with the type of tumor. For instance, Rajput AB et alCitation15 found that matrix-infiltrating mast cells suggest a good prognosis for invasive breast cancer. While Imada A et al.Citation16 claimed that stromal mast cells correlate with angiogenesis and poor outcome in stage I lung adenocarcinoma.
To investigate the differential infiltration amplification of TIICs and elucidate their potential prognostic value in ACC patients, we measured TIICs of ACC by CIBERSORT algorithm and constructed interaction networks of differentially expressed genes (DEGs) by LIMMA package using R software. We hypothesized that the possible carcinogenic activity of TIMC may impact multiple hallmarks related to tumor development and lead to poor prognosis of ACC. These findings may reveal potential therapeutic targets and provide insights into the molecular mechanisms of ACC microenvironment.
Materials and methods
An overview of this work
In this work, we firstly used CIBERSRT algorithm to evaluate the microenvironment of 79 ACC in TCGA cohort. Then, survival analyses were applied to identify the prognostic value of tumor-infiltrating immune cells (TIICs), and tumor-infiltrating mast cells (TIMCs) were found positively correlated with patients’ overall survival. In the next step, GSE90713, GSE12368 and FUSCC cohort were used to identify TIMC’s role in microenvironment and prognostic value as external validation. Finally, correlation analysis was applied to evaluate the relationship between TIMCs and other kinds of TIICs. Gene set enrichment analysis and identification of differentially expressed genes were used to explore potential mechanism behind TIMC’s positive prognostic value. A flow chart is drawn in Supplementary figure 1.
Evaluation of TIICs in ACC
The Gene expression profiles and clinical information of patients with ACC were downloaded from the Cancer Genome Atlas (TCGA). Clinical information and transcriptome data are combined into a matrix. The CIBERSORTCitation17 analysis tool is a deconvolution algorithm that uses a set of barcode gene expression values (corresponding to a “signature matrix” of 547 genes) to accurately determine the composition of immune cells in tumor sample data. The expression profile was normalized and R software was used to run the CIBERSORT algorithm with the number of permutations was set to 100 to explore the proportion of 22 kinds of TIICs in ACC samples. The bar chart and heat map were drawn to show the composition of TIICs of each sample; correlations between TIICs’ abundance were discussed and a heat map was drawn to display the correlation between cells using pheatmap package.Citation18 TIMC abundance was equal to the sum of abundance of mast cell resting and mast cell activated.
Survival analysis of TIICs abundance of ACC
After calculating the TIICs’ abundance, we sought to identify whether the kinds of TIICs have prognostic value. Clinical information of patients and TIICs’ abundance data are combined into a matrix. According to the median of TIICs’ abundance, the samples were divided into high abundance group and low abundance group. R software was applied to draw survival curves to visualize the impact of TIICs’ abundance on patients’ overall survival using survival package.Citation19 TIICs with prognostic value were included in the multivariate Cox regression analysis.
Evaluating microenvironment of ACC and normal tissues from Gene Expression Omnibus (GEO) data sets
The p value of TIMC is the smallest in multivariate Cox regression analysis, so we aim to explore the impact of TIMC on ACC microenvironment in other cohorts. Two chip datasets GSE90713 and GSE12368 were downloaded from GEO (Affymetrix GPL15207 platform, Affymetrix GPL570 platform, respectively). The corresponding genes transformed into a probe were converted into a symbol according to the annotation information on the platform. CIBERSORT was applied to evaluate the microenvironment of ACC and normal tissues.
Validation of TIMCs’ prognostic significance in Fudan university Shanghai cancer center cohort
To further validate TIMCs’ prognostic significance, real-world data were also collected from our institute. This study included 39 ACC patients who underwent surgical treatment from Fudan University Shanghai Cancer Center (FUSCC) between 2013 and 2019, and tumor specimens were obtained with informed consent. Anti-tryptase monoclonal antibody (Ab2378, diluted 1:10,000; Abcam) was used to identify mast cells using immunohistochemistry (IHC). The positive or negative staining was evaluated by two experienced pathologists and determined as follows. The overall IHC score from 0 to 12 was evaluated according to the multiplying of the staining intensity and extent score, as previously described.Citation20 The IHC scores 0–3, 4–12 are defined as low TIMC group and high TIMC group. Scatter diagram was drawn to explore the correlations between TIMC abundance with phenotype, and Kaplan-Meier method was applied to validate TIMC’s prognostic significance by comparing two groups survival rates.
Impact of TIMC on ACC microenvironment
Correlation analysis, Gene set enrichment analysis (GSEA), and differential gene expression analysis were applied to explore potential mechanism behind TIMC’s positive prognostic value. According to the median value of TIMC abundance, ACC samples were divided into high TIMC group and low TIMC group. To investigate the impact of TIMC on ACC microenvironment, other types of TIICs’ abundance in two groups were calculated and illustrated. Correlation analysis was applied, and Spearman’rho and p values were calculated to confirm the relationship between TIMC and other kinds of TIICs. GSEA was used to explore the potential involved signal pathways of ACC microenvironment.
Identification of differentially expressed genes (DEGs) related to TIMC
The limma packageCitation21 was used to analyze the data (adjusted p-value < 0.05 and fold change of at least 2x) and volcano map was drawn. In the high TIMC group, the genes with increased expression were marked with red, and the genes with decreased expression were marked with blue. Heat map was drawn according to the expression matrix of the samples to show the difference of gene expression between the two groups. Biological characteristics, such as biological process (BP), molecular functional (MF) and cellular component (CC), were extracted from gene ontology (GO)Citation22 enrichment analysis to determine the role of DEGs in ACC. The pathways associated with DEGs were explored by searching the Kyoto Encyclopedia of Genome and Genome (KEGG)Citation23 which is a database resource for understanding advanced functions and biological systems from large-scale molecular data generated by high-throughput experimental techniques. Functional enrichment analyses were completed by using ClusterProfiler package.Citation24
Further screening, identification and functional enrichment analysis on DEGs
To find the most important genes which exert subtle impact on TIMC abundance, it is necessary to further screen the DEGs. DEGs were uploaded to the Search Tool for the Retrieval of Interacting Genes (STRING; http://string-db.org) (version 10.0) online databaseCitation25 to predict protein–protein interaction (PPI) networks of DEGs and analyze the functional interactions between proteins. This may help to further understand the potential mechanism of the occurrence and development of ACC. Cytoscape (version 3.5)Citation26 is an open-source bioinformatics software platform for visualizing molecular interaction networks. MCODE (version 1.4.2),Citation27 a Cytoscape plug-in, was used to find the most significant hub genes with MCODE Score≥5. According to the expression level of the screened hub genes in the high and low TIMC group, the scatter plot was drawn using R, and functional enrichment analyses were carried out.
Survival analysis and functional annotations of hub genes associated with TIMC
Survival analysis and functional annotations of hub genes associated with TIMC were carried out to find potential therapeutic targets. According to the expression level of hub genes, the samples were divided into high expression group and low expression group, and Kaplan–Meier method was applied to evaluate the prognostic value of hub genes. The age, sex, pTNM stage, clinical stage, and expression level of hub genes were brought into the univariate regression analysis to find out the factors related to the prognosis of patients. While multivariate Cox regression models, including common prognostic factors (pTNM stage, clinical stage) and expression level of hub genes, were also established to find independent prognostic variables.
Flow cytometry
Flow cytometry (FCM) was used to detect CD8+T and CD4+T cells frequency of CD45+ cells in low and high TIMC samples. Then, some molecules were also detected (IFN-γ, IL-22, IL-17A, IL-4 reveal CD4+T cells’ plasticity and IFN-γ, TNF-α, GZMB, PRF1, Ki-67 act as CD8+T cells’ effector molecules). Fresh ACC tissues were obtained from tissue bank of Fudan University Shanghai Cancer Center. Staining of molecules was established by using Fixation/Permeabilization Solution Kit according to the manufacturer’s instructions. The stained cells were washed and re-suspended in the cell staining buffer. FCM was analyzed by BD Celesta and FlowJo software (Tree Star). All the FCM antibodies and reagents are summarized in Supplementary table 2.
Results
Profile of TIICs in ACC microenvironment
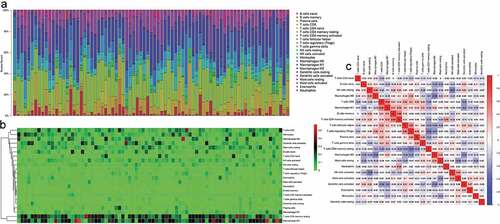
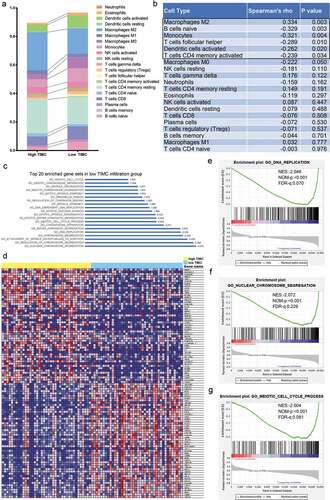
According to CIBERSORT algorithm, the proportion of 22 types of TIICs in 79 cases of ACC was calculated and displayed by bar chart. As depicted in , the abundance of TIICs in each sample is different, and T cells, natural killer cells, macrophages account for most of the TIICs in ACC microenvironment. Additionally, TIICs’ infiltration levels show strong correlation with each other in ACC microenvironment (). For example, T cells CD8 is positively correlated with macrophages M1 (Correlation coefficient = 0.48) and T cells CD4 memory activated is positively correlated with B cells memory (Correlation coefficient = 0.48)
Figure 1. CIBERSRT algorithm was used to evaluate the microenvironment of 79 ACC in TCGA cohort. (a-b) The abundance of TIICs in each sample is different and it can also be found that most of the TIICs in ACC are T cells, natural killer cells, macrophages, etc. (c) Different kinds of TIICs in ACC can interact with each other. For example, T cells CD8 is positively correlated with macrophages M1 (Correlation coefficient = 0.48) and T cells CD4 memory activated is positively correlated with B cells memory (Correlation coefficient = 0.48).
The prognostic value of TIICs in ACC samples
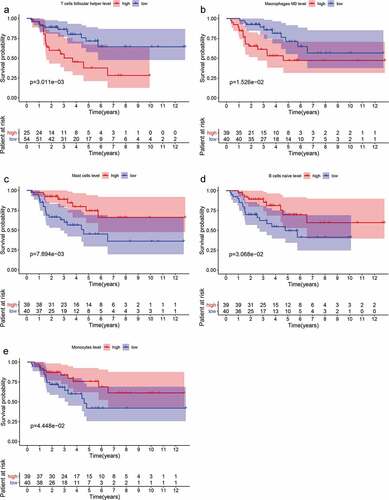
The samples were divided into high abundance group and low abundance group according to the median of each type of TIICs and survival analysis was carried out. As depicted in , the abundance of T cells follicular helper (p = .003), macrophages M0 (p = .015) were significantly correlated with poor prognosis of ACC. While the abundance of mast cells (p = .008), B cells naive (p = .031) and monocytes (p = .044) were positively associated with patient outcome. Multivariate Cox regression analysis () suggested that mast cells were mostly correlated with patients’ outcome with smallest p value (p = .007). Survival curves of TIICs with no significant prognostic value are shown in Supplementary Figure 2.
Table 1. Multivariate Cox regression analysis of Tumor-infiltrating immune cells.
Figure 2. Survival analyses were applied to identify the prognostic value of tumor-infiltrating immune cells (TIICs). (a-e) The abundance of T cells follicular helper (p = .003), macrophages M0 (p = .015) was significantly correlated with poor prognosis of ACC. While the abundance of mast cells (p = .008), B cells naive (p = .031) and monocytes (p = .044) was positively associated with patient outcome.
Microenvironment of ACC and normal tissues from Gene Expression Omnibus (GEO) data sets
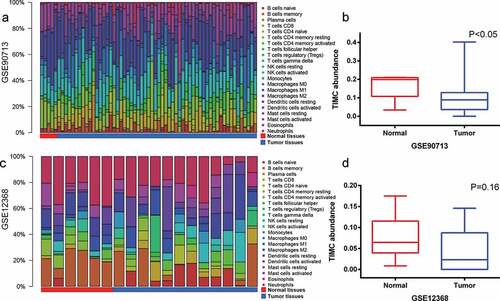
As is depicted in , the abundance of TIICs varies from sample to sample and TIMC abundance of normal samples is higher than that of tumor tissues in both GSE90713 and GSE12368. Survival analysis cannot be done due to the lack of survival information.
Figure 3. GSE90713 and GSE12368 cohort were used to validate TIMC’s role in microenvironment. (a-d) The abundance of TIICs varies from sample to sample and TIMC abundance of normal samples is higher than that of tumor tissues in both GSE90713 and GSE12368.
Prognostic significance of TIMC in FUSCC cohort
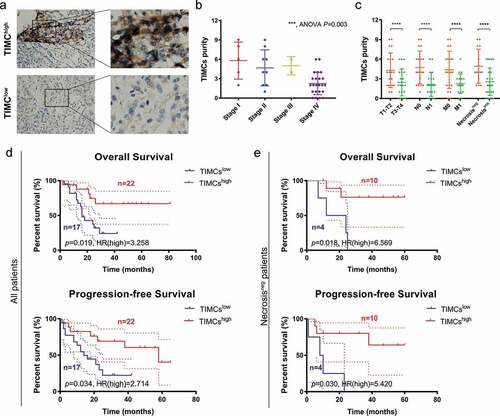
Clinicopathological characteristics in relation to TIMC infiltration status of 39 ACC patients (Fudan University Shanghai Cancer Center cohort) are listed in . Low and high magnification views of two groups’ TIMCs are shown in . Higher TIMCs’ abundance was correlated with lower AJCC stage, pT stage, pN stage, pM stage and samples presenting necrosis showed higher TIMCs (). In , higher TIMCs’ infiltration was positively correlated with both overall survival (p < .05) and progression-free survival (p < .05). In samples which did not present necrosis (), higher TIMCs’ infiltration was still positively correlated with both overall survival (p < .05) and progression-free survival (p < .05).
Table 2. Clinicopathological characteristics in relation to TIMC infiltration status of 39 ACC patients (Fudan University Shanghai Cancer Center cohort).
Figure 4. Validating TIMC’s positive prognostic value in Fudan University Shanghai Cancer Center (FUSCC) cohort. (a) Low and high magnification views of two groups’ TIMCs. (b-c) Higher TIMCs abundance was correlated with lower AJCC stage, pT stage, pN stage, pM stage, and samples presenting necrosis showed higher TIMCs. (d) Higher TIMCs infiltration was positively correlated with both overall survival (p < .05) and progression-free survival (p < .05). (e) In samples which did not present necrosis, higher TIMCs infiltration was still positively correlated with both overall survival (p < .05) and progression-free survival (p < .05).
Microenvironmental changes caused by differential TIMC levels on ACC
Other TIICs’ abundance was different between two groups when the samples were stratified with the median TIMC abundance (). As shown in , there is a positive association between Macrophage M2 and mast cells (Spearman’rho = 0.334, p = .003). While B cells naive, Monocytes, T cells follicular helper, Dendritic cells activated and T cells CD4 memory activated are negatively correlated with mast cells (Spearman’rho = −0.329, p = .003; Spearman’rho = −0.321 p = .004; Spearman’rho = −0.289, p = .010; Spearman’rho = −0.262, p = .020; Spearman’rho = −0.239, p = .034). GSEA was applied to explore the possible cellular explanations of the microenvironmental change and there was a significant difference in gene expression between two groups (). As is depicted in , gene expression was significantly enriched in DNA replication, nuclear chromosome segregation, and meiotic cell cycle process in the low TIMC group (Top 20 enriched pathway were listed in ). These possible functions are closely associated with activation and proliferation of various immune cells and can cause changes in the abundance of TIICs.
Figure 5. Correlation analysis and Gene set enrichment analysis (GSEA) were applied to explore microenvironmental changes caused by TIMC and potential mechanism behind TIMC’s positive prognostic value. (a) Other TIICs abundance was different between two groups When the samples were stratified with the median TIMC abundance. (b) There is a positive association between Macrophage M2 and mast cells (Spearman’rho = 0.334, p = .003). While B cells naive, monocytes, T cells follicular helper, Dendritic cells activated and T cells CD4 memory activated are negatively correlated with mast cells (Spearman’rho = −0.329, p = .003; Spearman’rho = −0.321 p = .004; Spearman’rho = −0.289, p = .010; Spearman’rho = −0.262, p = .020; Spearman’rho = −0.239, p = .034). (c) Top 20 enriched pathway. (d) There was a significant difference in gene expression between two groups. (e-g) Gene expression was significantly enriched in DNA replication, nuclear chromosome segregation, and meiotic cell cycle process in the low TIMC group.
Identification and functional enrichment analysis of DEGs related to TIMC
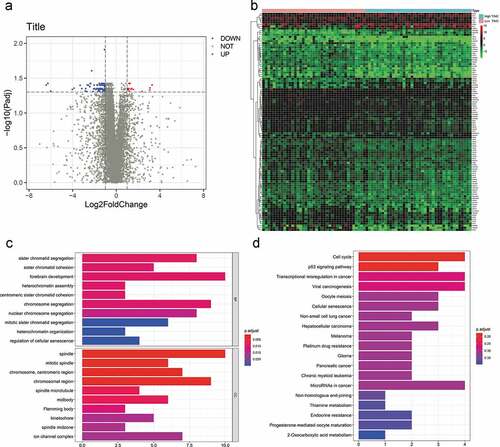
As shown in the volcanic map, expression of 88 genes decreased and 16 genes increased in the high TIMC group (). The expression level of the 104 genes is different between two groups (), and these genes are associated with sister chromatid segregation, sister chromatid cohesion, cell cycle, p53, signaling pathway, etc. ().
Figure 6. Differential gene analysis was applied to identify DEGs related to TIMC. (a) Expression of 88 genes decreased and 16 genes increased in the high TIMC group. (b-d) The expression level of the 104 genes is different between two groups and these genes are associated with sister chromatid segregation, sister chromatid cohesion, Cell cycle, p53, signaling pathway, etc.
Screening and functional annotations of hub genes
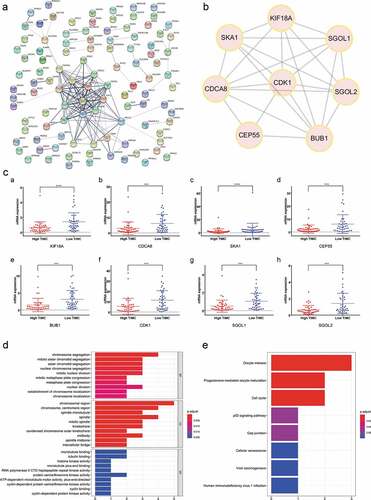
The PPI network among all DEGs was constructed with interacted specificity score equal to 0.4 (). The most relevant protein interaction group was selected as hub genes cluster, including KIF18A, CDCA8, SKA1, CEP55, BUB1, CDK1, SGOL1, SGOL2 (). As shown in , expression of the hub genes was significantly decreased in the high TIMC group compared with low TIMC group (p < .001). Functional enrichment analysis showed that the hub genes were mainly enriched in chromosome segregation, chromosome region, and cell cycle ().
Figure 7. The most significant genes were screened and functional enrichment analysis indicated the hub genes were mainly enriched in chromosome segregation, etc. (a-b) The PPI network among all DEGs was constructed and hub genes of Cluster1 are KIF18A, CDCA8, SKA1, CEP55, BUB1, CDK1, SGOL1, SGOL2. (c) Expression of the hub genes decreased in the high TIMC group compared with the low TIMC group. (d-e) Functional enrichment analysis showed that the hub genes were mainly enriched in chromosome segregation, chromosome region, and cell cycle.
Survival analysis of hub genes in ACC
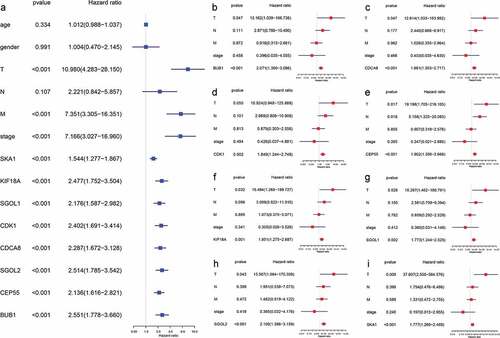
As depicted in , the overexpression of hub genes associated with TIMCs abundance is significantly correlated with poor prognosis in ACC patients (p < .05). Univariate Cox regression model suggested that pTstage, pMstage, clinical stage, and expression of hub genes were significantly correlated with prognosis in (p < .001; ). In the multivariate Cox regression models (), the expression of hub genes was still significantly correlated with prognosis in ACC patients (p < .05).
Figure 8. The overexpression of hub genes associated with TIMCs abundance in ACC is significantly associated with poor prognosis.
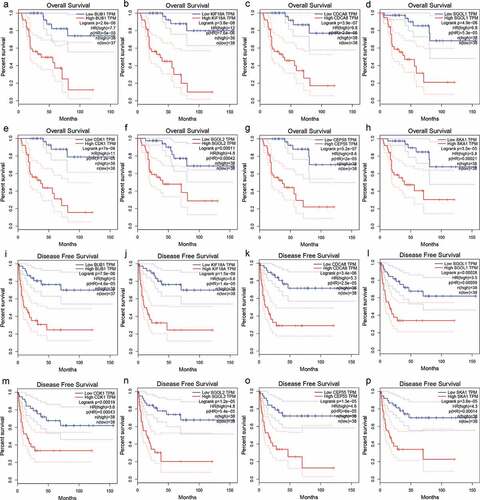
Figure 9. The expression of hub genes was significantly correlated with prognosis in both univariate and multivariate cox regression. (a) pTstage, pMstage, clinical stage, and expression of hub genes were significantly correlated with prognosis in univariate regression model (p < .001). (b-i) In the multivariate cox regression models, the expression of hub genes was still significantly correlated with prognosis (p < .05).
Mast cell infiltration may exert favorable influence on plasticity of CD8 + T and CD4 + T cells
FCM validated that both CD8 + T and CD4 + T cells’ abundance was significantly higher in high TIMC group (Supplementary figure 3A). As is shown in Supplementary figure 3B, IL-4 of CD4 + T cells was significantly higher in high TIMC group. PRF1 and Ki-67 of CD8 + T cells also elevated significantly in high TIMC group (Supplementary figure 3 C). These findings implied that TIMC might potentially promote the accumulation of both CD8 + T and CD4 + T cells and enhanced their plasticity. And this might partly explain that TIMC infiltration act as a favorable prognostic factor.
Discussion
Tumor microenvironment plays an important role in the occurrence and development of cancer. It is composed of various immune cells, cancer-related fibroblasts, and endothelial cells,Citation28 and the interaction between these cells also involves kinds of chemokines, cytokin3es, angiogenic mediators, growth factors, and so on.Citation29 Recent evidences suggest that the influence of TIICs is a double-edged sword in cancer,Citation30 and mast cells, T cells follicular helper, macrophages, B cells, monocytesCitation31-Citation34 have been found to have independent prognostic significance in different tumors. In this study, we also found that these types of TIICs are significantly associated with the prognosis of ACC patients, which suggests that the tumorigenesis and progression of ACC are closely related to the TME and shed light on the future research direction.
Because of the great variability in the type, grade, or stage of tumor and the distribution of mast cells, it is difficult to clearly define the function of TIMC as pro- or anti-tumorigenic. Current studies revealed that mast cells can mobilize and regulate the activity of T cells, regulatory T cells, and antigen-presenting cells (APC) through soluble media or cell-cell contact.Citation35 In addition to inflammatory effects, mast cells are also thought to synthesize and release effective angiogenic factors, such as VEGF.Citation36 Many studies have shown that TIMC may be related to tumor microvessels density and promote tumor angiogenesis.Citation37 This study found that TIMC abundance is a favorable prognostic factor in ACC, while the change of TIMC abundance is accompanied by a wide range of other types of TIICs’ abundance changes which may suggest that TIMC does play a key role in the TME of ACC. In FUSCC cohort, we also found that higher TIMC infiltration was positively correlated with both overall survival and progression-free survival. Thus, TIMC may be a potential therapeutic target. Previous studies have found that cell cycle and chromosome aberration are very important in ACC tumorigenesis.Citation38 GSEA results show that genes related to cell cycle and chromosome replication are enriched in low TIMC group, indicating that the activation of mast cells is also regulated by them.
In view of the breakthrough progress of immunotherapy in cancer in recent years, whether immunotherapy can be applied to ACC is a problem to be solved.Citation7 The response to immunotherapy usually depends on the interaction between tumor cells and TME, Citation8,Citation39 so it is of great significance to explore the composition of ACC microenvironment. This study found that there is a significant correlation between TIMC and a variety of TIICs (Macrophage M2,B cells naive, monocytes, T cells follicular helper, Dendritic cells activated and T cells CD4 memory activated) in ACC microenvironment; TIMC can be used as a potential target, which may be beneficial to ACC immunotherapy. We also found that hub genes (KIF18A, CDCA8, SKA1, CEP55, BUB1, CDK1, SGOL1, SGOL2) related to TIMC have independent prognostic significance. These eight genes may be used as biomarkers for diagnosis and prognosis and are expected to provide new potential targets for treatment.
Thus, our research has some limitations. The main thing is the retrospective design of our study. Multicenter prospective studies are needed to verify the conclusions. However, because of the rarity of tumor, it is very difficult to carry out randomized controlled study in ACC. In addition, there is an urgent need to conduct in vitro and in vivo experiments to reveal the underlying mechanism of mast cell infiltration in ACC.
Conclusion
In conclusion, types of TIICs abundance significantly correlated with the prognosis of ACC. Lower TIMC infiltration and elevated expression of hub genes (KIF18A, CDCA8, SKA1, CEP55, BUB1, CDK1, SGOL1, SGOL2) markedly correlated with aggressive progression and poor prognosis, which might shed lights on novel targets for treatment strategies.
Abbreviations
Disclosure of potential conflicts of interest
No potential conflicts of interest were disclosed.
Ethics approval and consent to participate
The Ethics approval and consent to participate in the current study were approved and consented by the ethics committee of Fudan University Shanghai Cancer center.
Authors’ contributions
The work presented here was carried out in collaboration with all authors. YDW, ZHL, and QYY defined the theme of the study and discussed analysis, interpretation, and presentation. TX, XWH, and WYC drafted the manuscript, analyzed the data, developed the algorithm, and explained the results. Aihetaimujiang, WHK and WFN, participated in the collection of relevant data and helped draft the manuscript. ZY and CDL helped to perform the statistical analysis. ZYP and SGH helped revise the manuscript and provided guiding suggestions. All the authors read and approved the final manuscript.
Supplemental Material
Download ()Acknowledgments
We thank the TCGA databases and GEO (ID: GSE90713, GSE12368) for providing ACC gene expression profiles.
Availability of data and material
The datasets during and/or analyzed during the current study available from the corresponding author on reasonable request.
Supplementary material
Supplemental data for this article can be accessed on the publisher’s website.
Additional information
Funding
References
- Kebebew E, Reiff E, Duh Q-Y., Clark OH, McMillan A. Extent of Disease at Presentation and Outcome for Adrenocortical Carcinoma: Have We Made Progress?. 2006. 30(5):872-12.
- Xu W-H, Wu J, Wang J, Wan F-N, Wang H-K, Cao D-L, Qu -Y-Y, Zhang H-L, Ye D-W. Screening and identification of potential prognostic biomarkers in adrenocortical carcinoma. Front Genet. 2019;10:821. doi:10.3389/fgene.2019.00821.
- Schteingart DE, Doherty GM, Gauger PG, Giordano TJ, Hammer GD, Korobkin M, Worden FP. Management of patients with adrenal cancer: recommendations of an international consensus conference. Endocr-Relat Cancer. 2005;12(3):667-680.
- Jasim S, Habra MA. Management of adrenocortical carcinoma. Curr Oncol Rep. 2019;21(3):20. doi:10.1007/s11912-019-0773-7.
- Xu WH, Xu Y, Wang J, Wan F-N, Wang H-K, Cao D-L, Shi G-H, Qu -Y-Y, Zhang H-L, Ye D-W. Prognostic value and immune infiltration of novel signatures in clear cell renal cell carcinoma microenvironment. Aging (Albany NY). 2019;11(17):6999–7020. doi:10.18632/aging.102233.
- Hegde PS, Chen DS. Top 10 challenges in cancer immunotherapy. Immunity. 2020;52(1):17–35. doi:10.1016/j.immuni.2019.12.011.
- Varghese J, Habra MA. Update on adrenocortical carcinoma management and future directions. Curr Opin Endocrinol Diabetes Obes. 2017;24(3):208-214.
- Petitprez F, Vano YA, Becht E, Giraldo NA, de Reyniès A, Sautès-Fridman C, Fridman WH. Transcriptomic analysis of the tumor microenvironment to guide prognosis and immunotherapies. Cancer Immunol Immunother. 2018;67(6):981–988. doi:10.1007/s00262-017-2058-z.
- Candido J, Hagemann T. Cancer-related inflammation. J Clin Immunol. 2013;33 Suppl 1 :S79-S84
- Swann JB, Smyth MJ. Immune surveillance of tumors. J Clin Immunol. 2007;117(5):1137-1146.
- Fridman WH, Pagès F, Sautès-Fridman C, Galon J. The immune contexture in human tumours: impact on clinical outcome. Nat Rev Cancer. 2012;12(4):298–306. doi:10.1038/nrc3245.
- Zitvogel L, Kepp O, Kroemer G. Immune parameters affecting the efficacy of chemotherapeutic regimens. Nat Rev Clin Oncol. 2011;8(3):151–160. doi:10.1038/nrclinonc.2010.223.
- Ren B, Cui M, Yang G, Wang H, Feng M, You L, Zhao Y. Tumor microenvironment participates in metastasis of pancreatic cancer. Mol Cancer. 2018;17(1):108. doi:10.1186/s12943-018-0858-1.
- Bingle L, Brown NJ, Lewis CE. The role of tumour-associated macrophages in tumour progression: implications for new anticancer therapies. J Pathol. 2002;196(3):254–265. doi:10.1002/path.1027.
- Rajput AB, Turbin DA, Cheang MC, Voduc DK, Leung S, Gelmon KA, Gilks CB, Huntsman DG. Stromal mast cells in invasive breast cancer are a marker of favourable prognosis: a study of 4,444 cases. Breast Cancer Res Treat. 2008;107(2):249–257. doi:10.1007/s10549-007-9546-3.
- Imada A. Mast cells correlate with angiogenesis and poor outcome in stage I lung adenocarcinoma. Eur Respir J. 2000;15(6):1087–1093. doi:10.1034/j.1399-3003.2000.01517.x.
- Newman AM, Liu CL, Green MR, Gentles AJ, Feng W, Xu Y, Hoang CD, Diehn M, Alizadeh AA. Robust enumeration of cell subsets from tissue expression profiles. Nat Methods. 2015;12(5):453–457.
- Kolde R. pheatmap: Pretty Heatmaps. 2019.
- Therneau TM, Grambsch PM, editor. Modeling Survival Data: Extending the Cox Model. In Statistics for Biology and Health. 2000; New York, NY: Springer. p. 39-77.
- Wang J, Xu W-H, Wei Y, Zhu Y, Qin XJ, Zhang HL,Ye DW. Elevated MRE11 expression associated with progression and poor outcome in prostate cancer. J Cancer. 2019;10(18):4333–4340.
- Ritchie ME, Phipson B, Wu D, Hu Y, Law CW, Shi W, Smyth GK. Limma powers differential expression analyses for RNA-sequencing and microarray studies. Nucleic Acids Res. 2015;43(7):e47.
- Ashburner M, Ball CA, Blake JA, Botstein D, Butler H, Cherry JM, Davis AP, Dolinski K, Dwight SS, Eppig JT, et al. Gene ontology: tool for the unification of biology. The Gene Ontology Consortium. Nat genet. 2000;25(1):25-29.
- Kanehisa M, Symposium NF, Kanehisa M. The KEGG Database. 2002.
- Yu G, Wan L-G, Han Y, He Q-Y. clusterProfiler: an R Package for Comparing Biological Themes Among Gene Clusters. OMICS: A Journal of Integrative Biology. 2012;16(5):284–287.
- Franceschini A, Szklarczyk D, Frankild S, Kuhn M, Simonovic M, Roth A, Lin J, Minguez P, Bork P, Mering VC, et al. STRING v9.1: protein-protein interaction networks, with increased coverage and integration. Nucleic acids research. 2013;41(Database issue):D808–D815.
- Smoot ME, Ono K, Ruscheinski J, Wang P-L, Ideker T. Cytoscape 2.8: new features for data integration and network visualization. Bioinformatics. 2011;27(3):431–432. doi:10.1093/bioinformatics/btq675.
- Bandettini WP, Kellman P, Mancini C, Booker OJ, Vasu S, Leung SW, Wilson JR, Shanbhag SM, Chen MY, Arai AE. MultiContrast Delayed Enhancement (MCODE) improves detection of subendocardial myocardial infarction by late gadolinium enhancement cardiovascular magnetic resonance: a clinical validation study. J Cardiovasc Magn Reson. 2012;14:83.
- Senbabaoglu Y, Gejman RS, Winer AG, Liu M, Van Allen EM, de Velasco G, Miao D, Ostrovnaya I, Drill E, Luna A, et al. Tumor immune microenvironment characterization in clear cell renal cell carcinoma identifies prognostic and immunotherapeutically relevant messenger RNA signatures. Genome Biol. 2016;17(1):231. doi:10.1186/s13059-016-1092-z.
- Bremnes RM, Al-Shibli K, Donnem T, Sirera R, Al-Saad S, Andersen S, Stenvold H, Camps C, Busund L-T. The role of tumor-infiltrating immune cells and chronic inflammation at the tumor site on cancer development, progression, and prognosis: emphasis on non-small cell lung cancer. J Thorac Oncol. 2011;6(4):824–833. doi:10.1097/JTO.0b013e3182037b76.
- de Visser KE, Eichten A, Coussens LM. Paradoxical roles of the immune system during cancer development. Nat Rev Cancer. 2006;6(1):24–37. doi:10.1038/nrc1782.
- Liu Z, Zhu Y, Xu L, Zhang J, Xie H, Fu H, Zhou Q, Chang Y, Dai B, Xu J. Tumor stroma-infiltrating mast cells predict prognosis and adjuvant chemotherapeutic benefits in patients with muscle invasive bladder cancer. Oncoimmunology. 2018;7(9):e1474317. doi:10.1080/2162402X.2018.1474317.
- Gu-Trantien C, Loi S, Garaud S, Equeter C, Libin M, Wind AD, Ravoet M, Buanec HL, Sibille C, Manfouo-Foutsop G, et al. CD4⁺ follicular helper T cell infiltration predicts breast cancer survival. J Clin Invest. 2013;123(7):2873–2892.
- Lee H-W, Choi H-J, Ha S-J, Lee K-T, Kwon Y-G. Recruitment of monocytes/macrophages in different tumor microenvironments. Biochim Biophys Acta. 2013;1835(2):170–179.
- Tadmor T, Zhang Y, Cho H-M, Podack ER, Rosenblatt JD. The absence of B lymphocytes reduces the number and function of T-regulatory cells and enhances the anti-tumor response in a murine tumor model. Cancer Immunol Immunother. 2011;60(5):609–619. doi:10.1007/s00262-011-0972-z.
- Rigoni A, Colombo MP, Pucillo C. The Role of Mast Cells in Molding the Tumor Microenvironment. Cancer Microenviron. 2015;8(3):167–176.
- Crivellato E, Nico B, Ribatti D. Mast cells and tumour angiogenesis: New insight from experimental carcinogenesis. Cancer letters. 2008;269(1):1-6.
- Sari A, Calli A, Cakalagaoglu F, Altınboga AA, Bal K. Association of mast cells with microvessel density in urothelial carcinomas of the urinary bladder. Ann Diagn Pathol. 2012;16(1):1-6.
- Giordano TJ, Kuick R, Else T, Gauger PG, Vinco M, Bauersfeld J, Sanders D, Thomas DG, Doherty G, Hammer G. Molecular classification and prognostication of adrenocortical tumors by transcriptome profiling. Clin Cancer Res. 2009;15(2):668–676.
- Wood SL, Pernemalm M, Crosbie PA, Whetton AD. The role of the tumor-microenvironment in lung cancer-metastasis and its relationship to potential therapeutic targets. Cancer Treat Rev. 2014;40(4):558–566.