
ABSTRACT
Soft tissue sarcomas are a group of rare and aggressive connective tissue neoplasms for which curative therapeutic opportunities are limited in advanced phase. Clinical trials assessing immunotherapy in these tumors have so far reported limited efficacy. The objective of this study is to provide a description of the immunologic landscape of sarcomas to guide the next clinical trials of immunotherapy in these diseases. The gene expression profile of 93 immune checkpoint (ICP) and membrane markers (MM) of immune cells was analyzed in a series of 253 soft tissue sarcoma (synovial sarcoma, myxoid liposarcoma, sarcoma with complex genomic and GIST) using Agilent Whole Human Genome Microarrays. The unsupervised hierarchical clustering of gene expression level was found able to properly group patients according to the histological subgroup of sarcoma, indicating that each sarcoma subgroup is associated with a specific immune signature defined by its gene expression pattern. Using the prognostic impact of CIBERSORT signature on metastatic-free survival in each subgroup, specific target could be proposed for each of the four groups: Treg through ICOS and GITR in GIST, M0 macrophages in all four sarcoma subtypes, OX40 in SS, CD40 in GIST and SS. The immune landscape of sarcoma was found to be as heterogeneous as the histotypes and molecular subtypes, but strongly correlated to the histotype. Histotype adapted immunotherapeutic approaches in each sarcoma subtypes must be considered in view of these results, consistently with the already reported specific response of histotypes of ICPs.
Introduction
Soft tissue sarcomas (STS) are a group of rare and aggressive connective tissue neoplasms with limited curative therapeutic opportunities in advanced phase. Sarcoma is a heterogeneous group of different diseases in terms of histological subtypes and molecular alterations, natural history, prognosis and variable drugs sensitivity. Histological classification includes more than 150 different sarcoma subtypes, while molecular characterization further increases nosologic fragmentation and the complexity of this classification.Citation1 STS are classically divided into sarcoma with complex genomic profile (SCG) and sarcoma driven by a specific genomic abnormality (translocation, mutation, amplification).
A large body of clinical and biological observations supports the relevance of the use of immunotherapy in sarcoma but their heterogeneity for histological and molecular subtypes has limited generalized approaches of immunotherapy in these tumors. Single-agent PD-1/PD-L1 antibodies (Ab) have limited efficacy in unselected series of sarcomas included in phase II clinical trials.Citation2–Citation4 Response rates are consistently low, with a median progression-free survival (PFS) of 3 months or less, and virtually no long-term PFS. Combination of anti-CTLA-4 with PD-1/or PD-L1 Ab may provide higher response rates and PFS but at the cost of higher toxicity. Biomarkers are lacking in these clinical trials.Citation5 Somewhat unexpectedly, immunotherapy provides higher tumor control rates in Alveolar Soft Part Sarcoma (ASPS) and chordoma than other sarcoma types.Citation6,Citation7
Biomarkers of response in other cancer types than sarcoma, such as mutational load, infiltrating immune cells, PD-L1 expression, and ploidy have however been identified in subsets of sarcomas.Citation2,Citation8 Translocation-driven sarcomas harbor specific immunogenic potential: fusion breakpoint sequences associated with synovial sarcoma (SS), clear cell sarcoma, desmoplastic small round cell tumor and Ewing sarcoma may serve as tumor-specific neo-antigen.Citation9 Therefore, sarcoma patient selection for immunotherapy with anti-PD1 is challenging and may be based on histotypes classification, somatic mutations, immune infiltrates and possibly other markers. The exploration of other ICP in therapy should also benefit from a systematic analysis of the expression of the different ICP in each tumor type.
A better description of the immune landscape of sarcomas is therefore needed to promote the rational development of immunotherapy in these tumors. To study inter- and intra-tumor immunologic heterogeneity across the different subtypes, high throughput transcriptomic data of a series including different sarcoma subtypes were analyzed: 1/by expression levels of 93 genes related to immune checkpoint (ICP) and membrane markers (MM) of immune cells and 2/using the LM22 CIBERSORT signature to distinguish prognostic subgroup. These results show that immune landscape strongly correlated to histotype and molecular subtypes, and identifies specific ICP associated with individual sarcoma histotypes.
Results
Population characteristics
This study included a total of 253 localized STS and gastrointestinal stromal tumor (GIST); 85 were STS with complex genetics (SCG), 60 gastrointestinal stromal tumors (GIST), 58 synovial sarcomas (SS) and 50 myxoïd liposarcoma (MLPS), the two later being contributing to classical “translocation-related sarcoma” with specific fusion transcripts. The group of 85 SCG includes 30 undifferentiated pleomorphic sarcoma (UPS) (35%), 24 leiomyosarcoma (LMS)(28%), 11 dedifferentiated liposarcoma (DDLPS)(13%), 7 myxofibrosarcoma (8%), 6 pleomorphic rhabdomyosarcoma (7%), 4 pleomorphic liposarcoma (5%), 3 adult fibrosarcoma (4%). summarizes the tumor characteristics (localization, size, and grade) and the disease outcome (local or metastatic relapse).
Table 1. Clinical characteristics of patients among the different cohorts.
As expected, the distribution of tumor localization is related to histological subtypes. Tumor size was above 5 cm in the majority of cases. After a median follow-up of more than 3 y, 36 (15%) of patients had presented a local relapse and 86 (34%) a metastatic recurrence.
Immune landscape discriminates sarcoma histological subtypes
Fifty of the 93 ICP/MM genes (54%) had consistently low expression levels regardless of the sarcoma subgroups (e.g. GITRL, CCR9, FoxP3, N2DL1) while some others had consistently high levels of overexpression (e.g. CD4, HVEM, CSF-1R, TNFR1). However, the majority of genes were differentially expressed in the four sarcoma subgroups allowing the unsupervised analysis to match with histological subtypes cluster.
Indeed, an unsupervised hierarchical clustering of the gene expression level of the 93 ICP/MM was applied to the 253 sarcoma to correlate expression level of ICP/MM genes and sarcoma subgroups (). The pattern of gene expression yielded a regrouping of the sarcoma samples matching closely their histological subtypes. In addition, two groups of MLPS (including 10 and 33 samples in the left and right groups, respectively) and two groups of GIST (including 21 and 29 samples in the left and right groups, respectively) were identified by the clustering analysis. The role of several clinical (tumor location, Armed Forces Institute of Pathology (AFIP) classification) and biological (mutation location according to KIT or PDGFR gene and exon location, genomic index) criteria on the partition in two groups of GIST was tested. None of these criteria led to different representations in these two sub-groups of GIST. The unsupervised clustering was also applied to the 85 SCG did not distinguish the different histotypes included in this group.
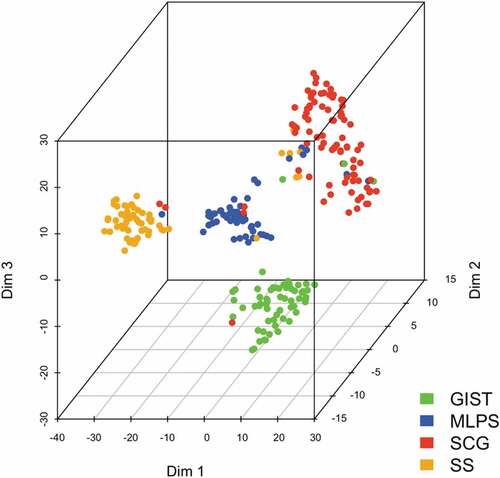
To confirm the specificity of gene expression signature according to sarcoma subgroup, the t-SNE technique was applied for dimensionality reduction (). Dimensions 1, 2 and 3 represented nonlinear gene groups for which the correlation value was the most powerful to discriminate the four sarcoma subgroups. Conversely, for the specific group of SCG, this unsupervised deconvolution method led to a correlation value of each gene for each four sarcoma subgroups. The t-SNE analysis failed to discriminate the different histological subtypes included in the group of SCG (DDLPS, LMS, UPS and others), possibly due to an underrepresentation of each subtype (Supplementary Figure S1).
Altogether, these results indicate that each of the four sarcoma subgroups (GIST, SS, MLPS, SCG) is associated with a specific immune signature defined by its ICP gene expression pattern.
Figure 1. Unsupervised clustering analysis of the 93 ICP/MM gene expression signature for all 253 sarcoma samples. Heat map of the full signature for all samples. Sarcoma (in columns) are labeled by their histological subgroup. Genes belonging to the signature (in rows) are labeled by their biological relevance. (TNF: tumor necrosis factor, DR: death receptor, Cytotox: cytotoxic T cell, ICP: immune checkpoint, Mono: monocyte, Macro: macrophage, NK: natural killer and Neutro: neutrophil.).
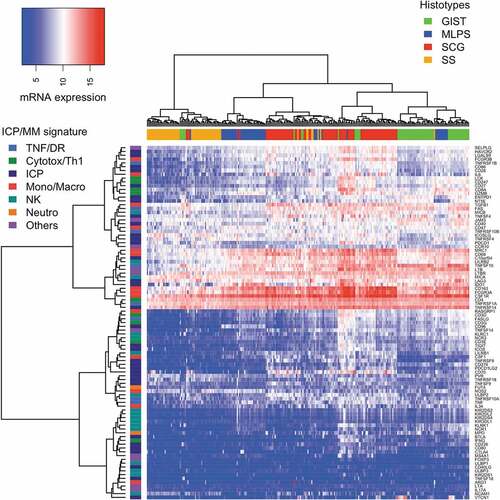
Figure 2. Correlation of ICP/MM genes expression with histological sarcoma subtype with t-SNE. t-SNE analysis processing a non-linear dimension reduction of the signature for all samples. Points are sarcomas highlighted in colors for each histological subtype (Dim: dimension).
Gene expression pattern of each sarcoma subtype
The differential expression of each gene across sarcoma subgroups is presented in . Number values of data represented in are reported in Supplementary Table S1.
Figure 3. Expression level of the 93 ICP/MM genes across each sarcoma subtype.
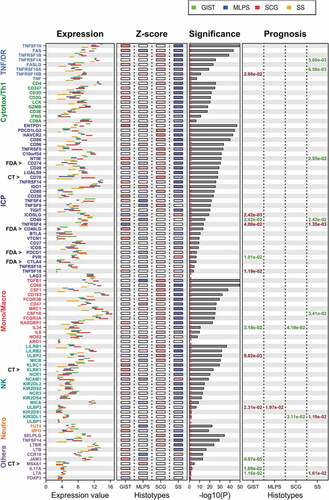
Expression level of each of the 93 ICP/MM genes was determined for the 253 sarcoma cases included in the study using either the 25 and 75 percentile of samples included in each sarcoma subtype and the Z-score that gives a numerical measurement of each value’s relationship to the mean in the group of values. The significance represents the heterogeneity of each gene expression level across the four subgroups.
We observed genes with 1) homogeneous expression patterns across the four groups, 2) heterogeneous patterns of expression across the four groups, and also 3) genes with different expression patterns within a given group.
As examples of the first group, LAG3 was highly expressed in all four subgroups (mean range between 10.91 and 11.73) whereas ULBP1 (N2DL1) was poorly expressed (mean range between 3.065 and 3.13). For the second group, with a high variability of gene expression of ICP/MM across the four sarcoma subgroups, the following examples can be presented: CD68 is highly expressed in SCG (mean 13.255) and moderately expressed in SS (mean 9.53); CSF1 is moderately expressed in SCG (mean 7.405) and poorly expressed in SS (mean 3.705). Across all sarcoma subtypes, the highest levels of expression were reported for monocytes/macrophages MM genes (CSF-1R, CD163, CD68, FCGR3A (CD16a)), the highest expression levels being observed in the SCG subgroup. The lowest levels of genes expression were reported for TNFSF18 (GITRL), KIR2DL2 (CD158b), KIR2DS1 (CD158H), ULBP1 (N2DL1), and FoxP3. In general, SS had a consistently low level of expression for all ICPs (mean 6.36 for all ICP/MM); conversely, the highest expression was in general reported for GIST (mean 7.96 for all ICP/MM) and SCG (8.20 for all ICP/MM). This was for instance the case for ENTPD1 (CD39) or FAS. As examples for the third group of genes, the expression level of IDO1 is homogeneous within the GIST group (high) and heterogeneous within the SCG or SS groups, and the expression level of CD70 (OX40L) is homogeneous within the GIST group and heterogeneous within the MLPS or SS groups.
Together, these results report an important heterogeneity of expression of each of the 93 ICP/MM genes across sarcoma subgroups, and across patients within the same tumor subgroup.
Prognostic value of individual genes
The prognostic impact of each ICP/MM (above vs under mean value) for metastasis-free survival (MFS) was then explored in the four sarcoma subgroups.
No ICP/MM demonstrated a significant prognostic impact in all four sarcoma subgroups. Some ICP/MM gene had a similar positive prognostic across two groups (e.g. positive impact of TNFRSF5 (CD40) in GIST and SS). Other may be associated with a higher risk of relapse in one sarcoma group, and the opposite in another (e.g. LTA (Lymphotoxin alpha) expression has a positive impact in GIST and a negative one in SS). Some of these ICP are targets for therapeutic antibodies in development: among these, the following ICP was associated with negative prognostic impact in GIST (ICOSL, TNFRSF4/OX40, TNFSF18/GITRL) or SS (TNFRSF4/OX40). CD40 is associated with good prognosis in GIST and SS and CD40 agonists are under development.
CIBERSORT signature and prognostic impact
CIBERSORT for Cell type Identification By Estimating Relative Subsets Of known RNA Transcripts is a signature providing an estimation of the distribution of immune cell populations based on their transcriptomic profile. It consists of an in silico approach for characterizing 22 immune cell populations of interest based on a bulk transcriptome deconvolution using a pre-defined signature of 547 genes.Citation11 It reports proportions of immune cell infiltrates within samples and not absolute values. Comparing CIBERSORT profile from a sample or histological subtype to another one reflects the impact of the higher or lower representation of an immune cell type rather than global immunologic potential. This signature was not found correlated to histotypes, tumor site, tumor grade, CINSARC signature or metastatic relapse. Results of CIBERSORT distribution in the whole cohort are reported as Supplementary Figure S2.
The representation of immune cell populations and their prognostic impact was then studied in the four sarcoma subgroups and presented in . Four specific immune cell populations were found associated with outcome in the four sarcoma subgroups.
Figure 4. Immune population defined by CIBERSORT signature and their relevance across sarcoma subtypes.
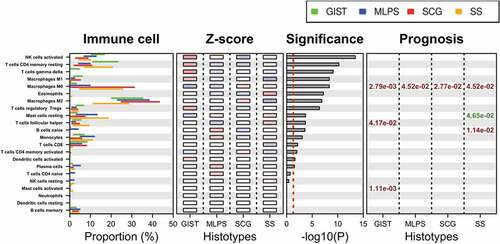
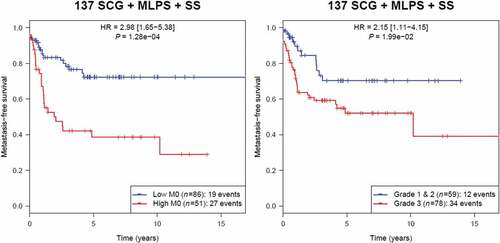
Figure 5. Kaplan-Meier analysis of metastasis-free survival according to M0-macrophage signature in the group of 137 sarcoma including SCG, MLPS and SS (unadjusted p).
Activated NK cell signature was differentially expressed across sarcoma subtypes (highest significance) with the highest gene expression observed in GIST.
M0-macrophages were associated with poor prognosis in the three other sarcoma subgroups. Of great interest in SS, MLPS and SCG, we compared the prognosis impact of the M0-macrophage signature with the gold standard histological FNCLCC grade,Citation11 GIST not being included in this analysis as in this STS entity AFIP grade is used in place of FNCLCC grade. As shown in , for the group of 137 cases including these three entities, the high M0-macrophage signature associated with a poorer MFS (HR = 2.98; p = 1.28 10–Citation4), outperforming the histopathological FNCLCC grade 3 (HR = 2.15; p = 1.99 10−2).
The presence of resting mast cells signature was associated with longer MFS in SS (p = 1.16 10−2) whereas activated mast cells signature was associated with poor prognosis in GIST (p = 2.78 10–4).
Finally, naïve B cells signature was associated with a poor prognosis in SS (p = 2.84 10−3).
Discussion
The results presented in this work show that the immune infiltrate profile of human sarcoma is different in the distinct sarcoma histotypes, that individual ICP expression profile may have different prognostic values for metastatic-free survival, and that cell infiltrates predicted by the Cibersort tool are different across the four groups and have different predictive values.
Sarcoma remains heterogeneous in terms of immune landscape, but this heterogeneity is matching the genomic alteration of sarcoma subtypes. These results also show the important of immune infiltrate for sarcoma prognosis, and strongly confirm that one-size-fits all approach for the manipulation of immune system for sarcoma treatment is unlikely to succeed for new ICP inhibitors development, while providing possible guidance for the selection of subtypes for new ICPs.
Even if beneficial to a small proportion of patients with advanced sarcoma, targeting PD1 pathway is most often inefficient and predictive factors of response to immunotherapy must be identified and tested prospectively in the clinic. From the clinical trials data reported so far, exploring the efficacy of immunotherapy in sarcoma, few responses in the most common subtypes (UPS, DDLPS, LMS, GIST) and frequent responses in very rare subtypes (angiosarcoma, ASPS, chordoma) were reported. No consistent biomarkers have been identified so far across sarcoma histotypes: it remains challenging to know if the selection of patients that could benefit from immunotherapy should be based on sarcoma histotypes or biomarkers.
Few studies identified biomarkers of response to immunotherapy in sarcoma. Correlation between somatic mutations load and sensitivity to immunotherapy is well documented for a variety of cancers,Citation12 but a high mutational burden is rarely observed in sarcoma.Citation13 PD-L1 expression in sarcoma as reported in the literature is, for instance, complex to interpret, owing to the wide range of technologies used for these studies (protein expression by immunohistochemistry (IHC), gene expression level) and a high heterogeneity and reduced size of many series based on histological subtypes.Citation10,Citation14-Citation17 It can however be concluded that sarcoma tumor cells generally express low levels of PD-L1, and PD-L1 expression is more frequently observed on lymphocytes or monocytes infiltrating the tumor.
Immune infiltrates are well documented to be correlated with response to immunotherapy in melanoma Citation18 and carcinoma.Citation19 Few series have assessed the presence of immune infiltrates in sarcoma, showing a wide variety of infiltrating immune cells, varying across and within histotypes. GIST is among the best described sarcoma in this perspective, with macrophages, T cell and NK cell infiltrates predicting response to TKIs.Citation20–Citation23 Recently, re-interpretation of the SARC028 results through immune-based classification suggests a higher response rate to Pembrolizumab in a subgroup SCG enriched in immune cells and tertiary lymphoid structures (TLS).Citation24 This biomarker is currently tested prospectively (Pembrosarc clinical trial; NCT02406781).
Still, a more accurate description of the immune landscape of sarcoma remains needed to guide further clinical trials with novel ICP blockers and to appropriately select patients more likely to benefit from different immune strategies. The present results provide a large overview of ICPs and immune cell MM gene expression in different subgroups of STS which may, therefore, contribute to guiding the development of immunotherapy in sarcoma. All four subgroups of sarcoma studied (GIST, SCG, MLPS and SS) display specific immune landscape, as demonstrated in the unsupervised hierarchical clustering analysis and t-SNE analysis. The translocation-related sarcoma, MLPS and SS, shares some similarities (low gene expression of CD39/ENTPD1, CD73/NT5E, PD-L1/PDCD1LG1 or PD-L2/PDCD1LG2, for example) but also show distinct expression patterns (e. g. CD28 or IDO1 expression exclusively in MLPS and not in SS). This outlines the variability of ICP and MM gene expression across sarcoma subgroups and also across patients belonging to the same sarcoma subgroup.
The analysis of 93 ICP/MM gene expression and CIBERSORT signature as prognostic factors for the different subgroups also emphasizes the specificity of each sarcoma subtype. Bonferroni correction was applied to this analysis to discriminate genes most likely to be relevant. The prognostic significance of few ICPs/MM and some immune cell populations is reported, and is found different across the different subgroups. Interestingly, the same immune population may have an opposite prognostic impact according to the subgroups.
Interaction between ICOS and its ligand B7H2 (ICOSL) has been described to stimulate the expansion of immunosuppressive Treg in breast Citation25 and ovarian Citation26 tumors. In GIST, our data highlighted high expression levels for ICOS gene and its ligand that is correlated with a poor prognosis. The poor prognosis of Treg has previously been reported in a cohort of various STS.Citation27 Thus, targeting Treg expansion through anti-ICOS antagonists as currently developed in clinics (MEDI-570 NCT025250791) may be an interesting strategy in GIST. Of note, in contrast to most ICP, B7H2 (ICOSL) was expressed at the highest level in SS. In this context, it is surprising to note a low expression of FoxP3 gene across all sarcoma subtypes. This low level of FoxP3 expression had never been reported.
Interestingly, Tnfrsf18 (GITR) is expressed in all four subtypes studied and the gene expression of its ligand is associated with a poor prognosis in GIST. Several anti-GITR antibodies are currently assessed alone or in combination with other immunotherapies in advanced malignancies (e.g. NCT01239134, NCT03277352) and thus, should be further explored in GIST.
A radically different immune profile from the three other subgroups is observed for SS. The high CD8 level detected in SS in our study is in contradiction with low T-cell infiltration in SS without prognosis impact, reported by Pollack et al.Citation27 LTA gene expression correlates with poor prognosis in SS and good prognosis in GIST. Sorbye et al. reported that IHC detection of CD20 + B cells positively impacts disease-specific survival in non-GIST STS Citation28 but when focusing specifically on SS, peritumoral B cell detection appears of poor prognosis value, a result consistent with our observations.
Co-detection of CD8, MS4A1 (CD20), and LTA could reflect the presence of TLS structures close to lymphoid organization promoting the differentiation of effector and memory B and T cells directly within the tumor environment.Citation29 This suggests that in SS, the detection of TLS will rather predict a poor survival as recently described for DDLPS Citation15 in contrast to the favorable prognosis reported in lung Citation30 and breast Citation31 carcinoma.
The role of mast cells present in tumor micro-environment as driving or inhibiting cancer progression is still controversial. Their positive prognostic impact has been established in tumors like colon, breast or biliary tract cancers and, interestingly, associated with a higher sensitivity to chemotherapy.Citation32 Our results show that the detection of resting mast cells signature is associated with a longer MFS in SS. This is in agreement with a study reporting that the amount of mast cells was a significant predictor of the disease-free interval and the overall survival of SS patients.Citation33 Mast cells may contribute to the immunosuppressive tumor microenvironment via mobilization of and interaction with MDSC and Treg.
Interestingly, M0-macrophage signature correlated with poor MFS prognosis in all four sarcoma subgroups, more significantly than the gold standard FNCLCC histological grade. This negative prognostic impact has been previously reported in other tumor types like lungCitation34 or breastCitation35 cancers. M2-macrophages characterized either using CD163 gene or the Cibersort M2-Macrophage signature did not correlate with prognosis in the different entities of sarcoma. This contrasts with results obtained in other solid tumorsCitation36 and a recent study reporting the poor prognosis of M2-macrophages on a small SS cohort (n = 39) based on CD163 detection by IHC.Citation37 This M0-macrophage signature may reflect either new monocytes recruited in tumor environment possibly via CCL2/CCR2 pathway to differentiate into M1- or M2-macrophages according to the tumor milieu or an uncommitted precursor of resident macrophages. Targeting CSF-1 receptor to restore the differentiation mechanism of M0-macrophages into dendritic cells could be an interesting therapeutic approach.Citation38
Analyzing the individual role of each cell types remains therefore challenging. The exact role of individual cell type requires further analysis. However, taking together the individual genes and CIBERSORT analyses, and consistently with the literature, we can propose that new strategy in the development of immunotherapy in sarcoma could be represented by Treg targeting through ICOS antagonist and GITR antibody in GIST, targeting M0 macrophages differentiation through CSF-1 receptor in all four sarcoma subtypes, OX40 inhibition in SS, CD40 agonists in GIST and SS.
This work has two main limitations:
A confirmation of these results on an independent data set would be of interest.
Moreover, it would have been interesting to explore further series both for RNA expression the protein level by IHC on tumor sections. Unfortunately, formalin-fixed tumor blocks are no longer available for such a study.
However, few markers are currently validated to decipher M0- from M2-macrophages. Based on Cibersort signature, proteins such as MARCO, CSF-1, MMP9, CCL7 or CXCL5 could be evaluated but no validated tools were available. CD163 and CD68 are classically used to discriminate M1 and M2 TAM. While CD68 is expressed on all three states, CD163 expression is supposed to be restricted to M2-macrophages.
Sarcomas are heterogeneous diseases in terms of histotypes, molecular subtypes, and now also, in terms of immune MM, ICP genes expression and infiltrating immune populations, as shown in this paper. As in the past with other systemic treatments, a one-size-fit all approach of immunotherapy in all sarcoma histotypes is less likely to succeed. The present results provide additional data for rationally develop new ICP inhibitors in specific sarcoma subtypes, in conjunction with mutational load, presence of TLS, and aneuploidy as potential predictive factors. Validation of prognostic and predictive indicators among identified protein and immune population of interest warrants further investigation alongside therapeutic assessment. To achieve such a complex and ambitious goal, cooperative strategies for each individual histotype, at a worldwide level are essential.
Materials & methods
Patient samples
All patients included in this study had STS and were managed in expert centers of the French Sarcoma Group (FSG) between July 1991 and November 2011. Approval of the patients to participate in the study was obtained according to the French national laws and European laws at the time of study initiation. The CNIL (“Commission Nationale Informatique et Liberté” or French Data Protection Authority) authorization for the study is referenced as CNIL No. 909510 obtained on 5 February 2010. Tumor samples were obtained from the frozen tissue of the primary tumor. Each case was reviewed by the group of pathologists associated with the FSG, members of the RRePPs network. The pathological diagnosis was confirmed according to the World Health Organization classifications based on histology, immunohistochemistry and molecular genetics when needed (molecular biology for GIST, FISH for MLPS and SS, for example).Citation1 Histological grading was established according to the Fédération Nationale des Centers de Lutte Contre le Cancer (FNCLCC) system,Citation39 whereas GIST grading was established according to the AFIP system.Citation40 The cellularity of the samples was not available, as well as the ratio between cancer and immune cells.
Clinical characteristics of patients, of tumors and disease outcome were extracted from the Conticabase and Conticagist databases (European databases for STS and GIST, respectively). With respect to regulatory procedures, these databases received authorizations from the Advisory Committee on Information Processing in Material Research in the Field of Health (CCTIRS) and the CNIL (CCTIRS obtained 9 Sept 2010 and CNIL No. 910390 15 Jul 2013). These databases include only patients for whom the entire management, from initial biopsy to follow-up was performed in one of the NETSARC centers.Citation41 Expression data are available as indicated in a previous study published by our groupCitation42 and can be accessible together with clinical annotations into the ATG-Sarc database (http://atg-sarc.sarcomabcb.org/).
Total RNA was extracted from frozen tumor samples by using the miRNeasy Mini Kit (Qiagen, Germantown, MD) and was purified by using the RNeasy Min Elute TM Cleanup Kit (Qiagen), according to the manufacturer’s instructions. RNA quality was checked on an Agilent 2100 bioanalyzer (Agilent Technologies). Gene expression analysis was carried out by using Agilent Whole Human 44 K Genome Oligo Array (Agilent Technologies), according to the manufacturer’s protocol.
Gene expression
A list of 93 genes of ICP and cell MM representative for immune landscape was established (the name of the protein is indicated in parenthesis if different from that of the gene):
- ICP: TIGIT, CD226 (DNAM1), PVR (CD155), CD28, CD80 (B7.1), CD86 (B7.2), CTLA4, ICOS, ICOSLG (B7H2), PDCD1 (PD-1), PDCD1LG1 (PD-L1), PDCD1LG2 (PD-L2), TNFRSF14 (HVEM), BTLA, C10orf54 (B7H5/VISTA), TNFRSF4 (OX40), TNFSF4 (OX40L), TNFRSF9 (CD137), TNFSF9 (CD137L), HAVCR2 (TIM3), LGALS9 (GAL9), LAG3, TNFRSF5 (CD40), TNFSF5 (CD40L), TNFSF7 (CD70/CD27LG), TNFRSF7 (CD27), VTCN1 (B7H4), Tnfrsf18 (GITR), TNFSF18 (GITRL), IDO (IDO1), NT5E (CD73), ENTPD1 (CD39) and CD96.
- Natural Killers (NK) cell markers: NCAM1 (CD56), NCR3 (NKp30), NCR1 (NKP46), MICA (MIC-A), MICB (MIC-B), ULBP1 (N2DL1), ULBP2 (N2DL2), ULBP3 (N2DL3), KLRC1 (NKG2A), LILRB1 (ILT2/CD85J), LILRB2 (ILT4/CD85D), KIR2DS1 (CD158H), KIR2DS2 (CD158J), KIR2DS4(CD158I), KIR3DL1 (CD158Z), KIR2DL2 (CD158b) and KLRK1 (NKG2D).
- Monocytes/macrophages markers: IL34, CSF1, CSF1R, CD163, CD68, FCGR3A (CD16a), FCGR3B (CD16b), IL6 and RASGRP1 (IL10), CD47, ARG1, TGFbéta, CD206 and INOS.
- Neutrophil markers: FUT4 (CD15) and MPO.
- Cytotoxic/Th1: CD3d, CD3e, CD3g, CD247 (=CD3zeta), LCK, CD4, CD8, IFNg and Granzyme.
- TNF-family Death receptors: TNFRSF1A (TNFR1), TNFRSF1B (TNFR2), TNFRSF10A (TRAILR1), TNFRSF10B (TRAILR2), FASL, FAS, TNF and TNFSF10 (TRAIL).
- Others: JAM3 (JAM-C), IL17A, CCR10, SELPLG (CLA), MS4A1 (CD20), FoxP3, LTB (Lymphotoxin beta), LTA (Lymphotoxin alpha), Lymphotoxine-beta R (LTbR) and TNFSF14 (LIGHT).
This list was generated on the basis of current scientific knowledge to explore i) key markers of immune populations, ii) positive and negative immune checkpoint molecules of CD28 and TNF family, iii) known druggable targets and iv) molecules involved in immunoregulation and immunosuppression.
CIBERSORT is a method designated to characterize the cell composition of complex tissues from their gene expression profile.Citation43 A leukocyte signature matrix, called LM22, was designed and validated to assess the feasibility of leukocyte deconvolution from bulk tumors. It contains 547 genes that distinguish 22 human hematopoietic cell phenotypes, including naïve and memory B cells, plasma cells, seven T cell types (CD8T cells, naïve CD4T cells, resting memory CD4T cells, activated memory CD4T cells, follicular helper T cells, regulatory T cells, γδ T cells), resting and activated natural killer (NK) cells, monocytes, macrophages (M0 macrophages, M1 macrophages, M2 macrophages), resting and activated dendritic cells (DC), resting and activated mast cells, eosinophils and neutrophils. This method has been successfully validated by flow cytometry and used to determine the infiltration of immune cells in various malignant tumors (e.g. breast cancer and colon cancer). CIBERSORT outperforms previous deconvolution methods with respect to noise, unknown mixture content, and closely related cell types, in statistically estimating relative proportions of cell subsets from expression profiles of complex tissues (for example, bulk tumors). The prognostic impact of LM22 was established across 39 malignancies.Citation11 The expression level of genes included in the signature of each immune cell population was studied as well as the prognosis impact of such a population on MFS.
Statistics
Gene expression of ICP and MM of immune cells were analyzed and their distribution correlated to pathological diagnosis. Their prognostic value on MFS was studied.
Gene expression analyses were performed using Agilent Whole Human Genome Microarrays (4x44K) according to manufacturer’s protocol. All microarray results were simultaneously normalized with the quantile method. For each gene, we selected the probe that maximizes the inter-quartile range value (higher expression dispersion) to reflect gene expression. Gene expression level was considered as low for values below 4, moderate between 4 and 10 and high above 10.
MFS was estimated using the Kaplan–Meier method from the date of the original diagnosis of the localized tumor to the date of the occurrence of first metastases or the latest follow-up. Significances are given by log-rank tests, where p below 0.05 was considered as a significant survival difference between risk-groups after Benjamin-Hochberg adjustment; hazard ratios (HR) were given by Cox regressions. Clustering and heat map analyses were performed using Euclidean distance and Ward’s method. The t-Distributed Stochastic Neighbor Embedding (t-SNE) technique was applied for dimensionality reduction as an unsupervised method to identify samples with similar transcriptomic patterns. It was performed with a complexity value set to 15 for all cohorts and 3 dimensions were kept to display 3D scatterplots. Z-scores represent numbers of standard deviations from the global mean. For each gene, we averaged z-scores belonging to the different histological subtypes. An ANOVA test was performed for each gene. Secondarily, all p-values were adjusted with the Bonferroni correction. These statistics were performed using R (v3.4.2) with survival (v2.41.3) and Rtsne (v0.13) packages (R Foundation for Statistical Computing, Vienna, Austria). We submitted expression data into CIBERSORT website interface (https://cibersort.stanford.edu/) using predefined LM22 immunological signature composed of 547 genes.
Disclosure of Potential Conflicts of Interest
No potential conflicts of interest were disclosed.
Supplemental Material
Download ()Supplementary material
Supplemental data for this article can be accessed on the publisher’s website.
Additional information
Funding
References
- Fletcher CDM, Bridge JA, Hogendoorn PC, Mertens F. WHO classification of tumours of soft tissue and bone. IARC Press; 2013.
- Toulmonde M, Penel N, Adam J, Chibon C, Blay JY, Le Cesne A, Bompas E, Piperno-Neumann S, Cousin S, Grellety T, et al. Use of PD-1 targeting, macrophage infiltration, and ido pathway activation in sarcomas: a phase 2 clinical trial. JAMA Oncology. 2018;4(1):93–10. doi:10.1001/jamaoncol.2017.1617.
- Ben-Ami E, Barysauskas CM, Solomon S, Tahlil K, Malley R, Hohos M, Polson K, Loucks M, Severgnini M, Patel T, et al. Immunotherapy with single agent nivolumab for advanced leiomyosarcoma of the uterus: results of a phase 2 study. Cancer. 2017;123(17):3285–3290. doi:10.1002/cncr.30738.
- Tawbi HA, Burgess M, Bolejack V, Van Tine BA, Schuetze SM, Hu J, D'Angelo S, Attia S, Riedel RF, Priebat DA, et al. Pembrolizumab in advanced soft-tissue sarcoma and bone sarcoma (SARC028): a multicentre, two-cohort, single-arm, open-label, phase 2 trial. Lancet Oncol. 2017;17: 30624–1.
- D’Angelo SP, Mahoney MR, Van Tine BA, Atkins J, Milhem MM, Jahagirdar BN, Antonescu CR, Horvath E, Tap WD, Schwartz GK, et al. Nivolumab with or without ipilimumab treatment for metastatic sarcoma (Alliance A091401): two open-label, non-comparative, randomised, phase 2 trials. Lancet Oncol. 2018;19(3):416–426. doi:10.1016/S1470-2045(18)30006-8.
- Groisberg R, Hong DS, Behrang A, Hess K, Janku F, Piha-Paul S, Naing A, Fu S, Benjamin R, Patel S, et al. Characteristics and outcomes of patients with advanced sarcoma enrolled in early phase immunotherapy trials. J Immunother Cancer. 2017;5(1):100–108. doi:10.1186/s40425-017-0301-y.
- Migliorini D, Mach N, Aguiar D, Vernet R, Landis BN, Becker M. First report of clinical responses to immunotherapy in 3 relapsing cases of chordoma after failure of standard therapies. Oncoimmunology. 2017;8(8):e1338235. doi:10.1080/2162402X.2017.1338235.
- Gounder MM, Ali SM, Robinson V, Bailey M, Ferraro R, Patel NM, Krishnan A, Millis SZ, Dickson MA, D’Angelo SP, et al. Impact of next-generation sequencing (NGS) on diagnostic and therapeutic options in soft-tissue and bone sarcoma. J Clin Oncol. 2017;35(15_suppl):11001. suppl;abstr 11001. doi:10.1200/JCO.2017.35.15_suppl.11001.
- Worley BS, van den Broeke LT, Goletz TJ, Pendleton CD, Daschbach EM, Thomas EK. Antigenicity of fusion proteins from sarcoma-associated chromosomal translocations. Cancer Res. 2001;61(18):6868–6875.
- D’Angelo SP, Shoushtari AN, Agaram NP, Kuk D, Qin LX, Carvajal RD. Prevalence of tumor-infiltrating lymphocytes and PD-L1 expression in the soft tissue sarcoma microenvironment. Hum Pathol. 2015;3(3):357–365. doi:10.1016/j.humpath.2014.11.001.
- Gentles AJ, Newman AM, Liu CL, Bratman SV, Feng W, Kim D. The prognostic landscape of genes and infiltrating immune cells across human cancers. Nat Med. 2015;21(8):938–945. doi:10.1038/nm.3909.
- Rizvi NA, Hellmann MD, Snyder A, Kvistborg P, Makarov V, Havel JJ. Mutational landscape determines sensitivity to PD-1 blockade in non-small cell lung cancer. Science. 2015;6230(6230):124–128. doi:10.1126/science.aaa1348.
- Cancer Genome Atlas Research Network. Comprehensive and integrated genomic characterization of adult soft tissue sarcomas. Cell. 2017;171(4):950–965.e28. doi:10.1016/j.cell.2017.10.014.
- Movva S, Wen W, Chen W, Millis SZ, Gatalica Z, Reddy S. Multi-platform profiling of over 2000 sarcomas: identification of biomarkers and novel therapeutic targets. Oncotarget. 2015;14(14):12234–12247. doi:10.18632/oncotarget.3498.
- Tseng WW, Malu S, Zhang M, Chen J, Sim GC, Wei W. Analysis of the intratumoral adaptive immune response in well differentiated and dedifferentiated retroperitoneal liposarcoma. Sarcoma. 2015;547460.
- Pollack SM, He Q, Yearley JH, Emerson R, Vignali M, Zhang Y. T-cell infiltration and clonality correlate with programmed cell death protein 1 and programmed death-ligand 1 expression in patients with soft tissue sarcomas. Cancer. 2017;17(17):3291–3304. doi:10.1002/cncr.30726.
- Bertucci F, Finetti P, Perrot D, Leroux A, Collin F, Le Cesne A. PDL1 expression is a poor-prognosis factor in soft-tissue sarcomas. Oncoimmunology. 2017;3(3):e1278100. doi:10.1080/2162402X.2016.1278100.
- Tumeh PC, Harview CL, Yearley JH, Shintaku IP, Taylor EJ, Robert L. PD-1 blockade induces responses by inhibiting adaptive immune resistance. Nature. 2014;7528(7528):568–571. doi:10.1038/nature13954.
- Herbst RS, Soria JC, Kowanetz M, Fine GD, Hamid O, Gordon MS. Predictive correlates of response to the anti-PD-L1 antibody MPDL3280A in cancer patients. Nature. 2014;515(7528):563–567. doi:10.1038/nature14011.
- Rusakiewicz S, Perier A, Semeraro M, Pitt JM, Pogge von Strandmann E. NKp30 isoforms and NKp30 ligands are predictive biomarkers of response to imatinib mesylate in metastatic GIST patients. Oncoimmunology. 2016;6(1):e1137418. doi:10.1080/2162402X.2015.1137418.
- Delahaye NF, Rusakiewicz S, Martins I, Ménard C, Roux S, Lyonnet L. Alternatively spliced NKp30 isoforms affect the prognosis of gastrointestinal stromal tumors. Nat Med. 2011;17(6):700–707. doi:10.1038/nm.2366.
- Zhang JQ, Zeng S, Vitiello GA, Seifert AM, Medina BD, Beckman MJ. Macrophages and CD8+T cells mediate the antitumor efficacy of combined CD40 ligation and imatinib therapy in gastrointestinal stromal tumors. Cancer Immunol Res. 2018;6(4):434–447. doi:10.1158/2326-6066.CIR-17-0345.
- Ménard C, Blay JY, Borg C, Michiels S, Ghiringhelli F, Robert C. Natural killer cell IFN-gamma levels predict long-term survival with imatinib mesylate therapy in gastrointestinal stromal tumor-bearing patients. Cancer Res. 2009;69(8):3563–3569. doi:10.1158/0008-5472.CAN-08-3807.
- Petitprez F, de Reyniès A, Keung EZ, Chen TW, Sun CM, Calderaro J. B cells are associated with survival and immunotherapy response in sarcoma. Nature. 2020;577(7791):556–560. doi:10.1038/s41586-019-1906-8.
- Faget J, Bendriss-Vermare N, Gobert M, Durand I, Olive D, Biota C. ICOS-ligand expression on plasmacytoid dendritic cells supports breast cancer progression by promoting the accumulation of immunosuppressive CD4+T cells. Cancer Res. 2012;72(23):6130–6141. doi:10.1158/0008-5472.CAN-12-2409.
- Conrad C, Gregorio J, Wang YH, Ito T, Meller S, Hanabuchi S. Plasmacytoid dendritic cells promote immunosuppression in ovarian cancer via ICOS costimulation of Foxp3(+) T-regulatory cells. Cancer Res. 2012;72(20):5240–5249. doi:10.1158/0008-5472.CAN-12-2271.
- Sorbye SW, Kilvaer T, Valkov A, Donnem T, Smeland E, Al-Shibli K. Prognostic impact of lymphocytes in soft tissue sarcomas. PLoS One. 2011;6(1):e14611. doi:10.1371/journal.pone.0014611.
- Pollack SM, He Q, Yearley JH, Emerson R, Vignali M, Zhang Y. T-cell infiltration and clonality correlate with programmed cell death protein 1 and programmed death-ligand 1 expression in patients with soft tissue sarcomas. Cancer. 2017;123(17):3291–3304. doi:10.1002/cncr.30726.
- Sautès-Fridman C, Lawand M, Giraldo NA, Kaplon H, Germain C, Fridman WH. Tertiary lymphoid structures in cancers: prognostic value, regulation, and manipulation for therapeutic intervention. Front Immunol. 2016;7:407. doi:10.3389/fimmu.2016.00407.
- Germain C, Gnjatic S, Tamzalit F, Knockaert S, Remark R, Goc J. Presence of B cells in tertiary lymphoid structures is associated with a protective immunity in patients with lung cancer. Am J Respir Crit Care Med. 2014;189(7):832–844. doi:10.1164/rccm.201309-1611OC.
- Buisseret L, Garaud S, de Wind A, Van den Eynden G, Boisson A, Solinas C. Tumor-infiltrating lymphocyte composition, organization and PD-1/PD-L1 expression are linked in breast cancer. Oncoimmunology. 2016;6(1):e1257452. doi:10.1080/2162402X.2016.1257452.
- Bo X, Wang J, Suo T, Ni X, Liu H, Shen S, Li M, Wang Y, Liu H, Xu J, et al. Tumor-infiltrating mast cells predict prognosis and gemcitabine-based adjuvant chemotherapeutic benefit in biliary tract cancer patients. BMC Cancer. 2018;18(1):313. doi:10.1186/s12885-018-4220-1.
- Lopes JM, Hannisdal E, Bjerkehagen B, Bruland OS, Danielsen HE, Pettersen EO, Sobrinho-Simões M, Nesland JM. Synovial sarcoma. evaluation of prognosis with emphasis on the study of DNA ploidy and proliferation (PCNA and Ki-67) markers. Anal Cell Pathol. 1998;16(1):45–62. doi:10.1155/1998/545906.
- Liu X, Wu S, Yang Y, Zhao M, Zhu G, Hou Z. The prognostic landscape of tumor-infiltrating immune cell and immunomodulators in lung cancer. Biomed Pharmacother. 2017;95:55–61. doi:10.1016/j.biopha.2017.08.003.
- Ali HR, Chlon L, Pharoah PD, Markowetz F, Caldas C. Patterns of immune infiltration in breast cancer and their clinical implications: a gene-expression-based retrospective study. PLoS Med. 2016;13(12):e1002194. doi:10.1371/journal.pmed.1002194.
- Zhang QW, Liu L, Gong CY, Shi HS, Zeng YH, Wang XZ, Zhao Y-W, Wei Y-Q. Prognostic significance of tumor-associated macrophages in solid tumor: a meta-analysis of the literature. PLoS One. 2012;7(12):e50946. doi:10.1371/journal.pone.0050946.
- Oike N, Kawashima H, Ogose A, Hotta T, Hatano H, Ariizumi T, Sasaki T, Yamagishi T, Umezu H, Endo N, et al. Prognostic impact of the tumor immune microenvironment in synovial sarcoma. Cancer Sci. 2018;09(10):3043–3054. doi:10.1111/cas.13769.
- Ménétrier-Caux C, Montmain G, Dieu MC, Bain C, Favrot MC, Caux C, Blay JY. Inhibition of the differentiation of dendritic cells from CD34+ progenitors by tumor cells: role of IL-6 and M-CSF. Blood. 1998;92(12):1–11. doi:10.1182/blood.V92.12.4778.
- Trojani M, Contesso G, Coindre JM, Rouesse J, Bui NB, de Mascarel A, Goussot JF, David M, Bonichon F, Lagarde C, et al. Soft-tissue sarcomas of adults; study of pathological prognostic variables and definition of a histopathological grading system. Int J Cancer. 1984;33(1):37–42. doi:10.1002/ijc.2910330108.
- Miettinen M, Lasota J. Gastrointestinal stromal tumors: review on morphology, molecular pathology, prognosis, and differential diagnosis. Arch Pathol Lab Med. 2006;130(10):1466–1478. doi:10.1043/1543-2165(2006)130[1466:GSTROM]2.0.CO;2.
- Blay JY, Soibinet P, Penel N, Bompas E, Duffaud F, Stoeckle E, Mir O, Adam J, Chevreau C, Bonvalot S, et al. NETSARC/RREPS and French Sarcoma Group–Groupe d’Etude des Tumeurs Osseuses (GSF-GETO) networks. Improved survival using specialized multidisciplinary board in sarcoma patients. Ann Oncol. 2017;11(11):2852–2859. doi:10.1093/annonc/mdx484.
- Dantas-Barbosa C, Lesluyes T, Loarer FL, Chibon F, Treilleux I, Coindre JM, Meeus P, Brahmi M, Bally O, Ray-Coquard I, et al. Expression and role of TYRO3 and AXL as potential therapeutical targets in leiomyosarcoma. Br J Cancer. 2017;117(12):1787–1797. doi:10.1038/bjc.2017.354.
- Newman AM, Liu CL, Green MR, Gentles AJ, Feng W, Xu Y. Robust enumeration of cell subsets from tissue expression profiles. Nat Methods. 2015;12(5):453–457. doi:10.1038/nmeth.3337.