
 ?Mathematical formulae have been encoded as MathML and are displayed in this HTML version using MathJax in order to improve their display. Uncheck the box to turn MathJax off. This feature requires Javascript. Click on a formula to zoom.
ABSTRACT
TGFβ is a pleiotropic cytokine that may have both tumor inhibiting and tumor promoting properties, depending on tissue and cellular context. Emerging data support a role for TGFβ in suppression of antitumor immunity. Here we show that SAR439459, a pan-TGFβ neutralizing antibody, inhibits all active isoforms of human and murine TGFβ, blocks TGFβ-mediated pSMAD signaling, and TGFβ-mediated suppression of T cells and NK cells. In vitro, SAR439459 synergized with anti-PD1 to enhance T cell responsiveness. In syngeneic tumor models, SAR439459 treatment impaired tumor growth, while the combination of SAR439459 with anti–PD-1 resulted in complete tumor regression and a prolonged antitumor immunity. Mechanistically, we found that TGFβ inhibition with PD-1 blockade augmented intratumoral CD8+ T cell proliferation, reduced exhaustion, evoked proinflammatory cytokines, and promoted tumor-specific CD8+ T cell responses. Together, these data support the hypothesis that TGFβ neutralization using SAR439459 synergizes with PD-1 blockade to promote antitumor immunity and formed the basis for the ongoing clinical investigation of SAR439459 in patients with cancer (NCT03192345).
Introduction
In recent years immunotherapy has emerged as a new standard of care in a number of human malignancies. Checkpoint inhibitors reinvigorate exhausted immune cells and have been shown to evoke antitumor T cell responses in cancer patients.1,Citation2 For instance, antibodies targeting programmed death receptor 1 (PD-1) or its ligand 1 (PD-L1) have demonstrated clinical efficacy in several types of cancer.Citation3,Citation4 Despite the unprecedented durable response rates observed with PD-1 blockade immunotherapies, the majority of patients either do not benefit from the treatment (primary resistance) or may relapse after a period of response (acquired resistance).Citation5–Citation7
TGFβ is a pleiotropic cytokine with multiple physiologic roles. The three TGFβ isoforms, TGFβ1, TGFβ2, and TGFβ3, are highly expressed in many tumor types and are associated with poor outcomes in cancer patients.Citation8,Citation9 TGFβ isoforms are synthesized as a precursor that includes a large N-terminal latency-associated peptide (LAP), and a short C-terminal segment, which corresponds to the mature active cytokine monomer.Citation10 All TGFβ family members signal through paired transmembrane serine/threonine protein kinases known as the type I and type II receptors.Citation11 In the tumor microenvironment, TGFβ has been shown to promote tumor growth by harnessing several key processes – e.g. tumor cell proliferation, matrix remodeling, angiogenesis, and epithelial-mesenchymal transition (EMT), all of which can promote tumor progression and facilitate immune evasion.Citation8,Citation11 TGFβ can be produced by several cell types and functions as an autocrine or paracrine signal within the tumor microenvironment to promote its suppressive effects. Of the three TGFβ isoforms, isoform 1 has been best explored in the context of immune suppression, though isoforms 2 and 3 also play roles in suppressing components of immune system and contributing to tumor progression.Citation12–Citation14 Specifically, TGFβ isoforms abrogate activity of both CD8+ T and natural killer (NK) cellsCitation15 and is involved in the development and maintenance of regulatory T cells.Citation16 TGFβ suppresses T cell proliferation by inhibiting T cell receptor signal transduction.Citation17,Citation18 In addition, suppressive role of tumor-derived TGFβ on IL-2 dependent growth and differentiation of lymphokine activated killer cells (LAK) was documented previously.Citation19,Citation20 More recently, it was shown that TGFβ activation in the tumor microenvironment leads to T cell exclusion from tumors, thus compromising antitumor immunity.Citation21,Citation22 In addition, high concentration of TGFβ in the tumor microenvironment promotes conversion of myeloid and lymphoid cells into immunosuppressive TGFβ-producing cells.Citation23 TGFβ also upregulates PD-1 and PD-L1 expression on T cells and tumor cells, respectively, contributing to immune suppression indirectly in the tumor microenvironment.Citation24,Citation25 Therefore, TGFβ is a highly attractive target for relieving immunosuppression and promoting anti-tumor immune responses.
Analysis of tumor transcriptomes and correlation with patient outcomes revealed that increased TGFβ activity correlated with a lack of responsiveness to PD-(L)1 blockade, and those patients with high TGFβ activity had the lowest overall survival. Moreover, in patients with high TGFβ activity, increased CD8+ T cell infiltration did not correlate with improved overall survival. Fresolimumab is a first-generation anti-TGFβ antibody that showed promising results in early clinical development without dose-limiting toxicity.Citation26–Citation29 We have recently developed SAR439459, an improved variant of fresolimumab with a single alteration in the Fc region that improves manufacturability, as well as other properties. The present study reports preclinical mechanism of action of SAR439459 in context to tumor immunotherapy. We show that SAR439459 can reverse the suppressive effects of TGFβ on both primary NK and T cells and also potentiates stimulatory effects of PD-1 blockade on T cells. In MC38 and EMT6 tumor models, monotherapy with SAR439459 or anti-PD-1 alone exhibited partial tumor regression, while the combination of the two led to long-lasting and protective antitumor T cell responses. Mechanistically, combination of SAR439459 with PD-1 blockade enhanced the frequency of tumor-specific CD8+ T cells and induction of proinflammatory cytokines. Additionally, scRNAseq analysis demonstrated that SAR439459 treatment improved CD8+ T cell proliferation and reduced exhaustion gene signatures within the tumor microenvironment.
Materials and methods
Antibodies, proteins, TGFβ binding, and mink cell proliferation assays
All antibodies were produced internally. TGFβ proteins were either produced internally or obtained from R&D Systems. The affinities of antibodies against human and mouse TGFβ were determined by surface plasmon resonance on a Biacore T200 Biosensor instrument (GE Healthcare) using a dextran coated carboxy-methylated (CM5) series S chip. Various concentrations of antibodies were injected onto immobilized recombinant TGFβ isoforms to measure the binding interaction in real time. The data from the kinetic experiments were processed using the Biacore T200 Biaevaluation v2.0 software. Resulting sensograms were zeroed, aligned, double referenced, and cropped for curve fitting analysis using a 1:1 binding model to determine association rate constant (Ka), dissociation rate constant (Kd), and equilibrium dissociation constant (KD). Inhibition of Mv 1 Lu mink lung cell proliferation by TGFβ isoforms was measured in presence of SAR439459 and fresolimumab. To quantify the potency of SAR439459 and fresolimumab in inhibiting TGFβ-mediated suppression of proliferation, 1 ng/mL of each TGFβ isoform was used. Each TGFβ isoform was incubated separately with SAR439459 and fresolimumab, which had been serially diluted to generate dose-response curves. Antibody-TGFβ mixtures were then added to Mv 1 Lu cells (ATCC). After 3 days, media was removed, and cells were lysed. DNA content per well was determined using CyQUANT™ dye (ThermoFisher Scientific), which fluoresces upon binding to DNA.
Patient database analysis and TGFβ activation gene signatures
TGFβ pathway activation gene signatures
A 159-gene expression signature of TGFβ pathway activation was derived by microarray profiling of TGFβ-stimulated and anti-TGFβ–treated MDA-MB-231 breast cancer cells (ATCC) as described previously.Citation30 In vivo validation was done by profiling the response of MDA-MB231 mouse xenograft model to anti-TGFβ treatment. In silico validation was done by checking for consistency with other TGFβ signature scores from large corpora of gene expression data such as TCGA. The TGFβ pathway activation signature (gene list and gene-by-gene sign of regulation) is provided in the Supplementary Table 2.
Geneset enrichment scores by ‘regulated KS’ analysis
A regulated Kolmogorov-Smirnov analysis was used to generate enrichment scores for the TGFβ pathway activation signature.Citation31 The RNA-sequencing profiles arising from each study were independently quantile-normalized, log2 transformed, and then Z transformed (standardized) on a gene-by-gene basis, before being used to generate the enrichment scores. The final enrichment scores were expressed in terms of “log2C” scores, with sign equal to the inferred relative activation state of the pathway (“on” = 1, “off” = – 1) and magnitude equal to log2 of the largest of the left or right leading-edge slopes of the regulated sample distribution relative to the global gene population rank distribution.
Estimation of relative immune cell abundance by MCP counter
The immune cell type abundance estimator microenvironment cell population (MCP) counterCitation32 was used to establish relative abundances of cytotoxic T lymphocytes (CTLs) in the data sets of interest.
Human immune cell assays
Mixed lymphocyte reaction (MLR) assay
T cell – B-lymphoblastoid cell line (B-LCL) MLR was established using enriched total T cells from human peripheral blood mononuclear cells incubated with irradiated Epstein-Barr virus-infected B-LCL (Astarte Biologics, 1038–2845MY15). T cells were labeled with CellTrace™ Violet (CTV; ThermoFisher, C34557) and mixed with B-LCL in 10:1 ratio, with test or control antibodies with or without TGFβ1 (R&D Systems, 240-B). At the end of day 4, protein transport inhibitor cocktail (eBioscience, 004980–93) was added 4 hours before harvesting cells and stained with viability dye (BioLegend, 423106) followed by anti-CD8 (SK1; BioLegend, 344710). Cells were then permeabilized by True-Nuclear™ Transcription Factor Buffer (Biolegend, 424401) and stained for intracellular IFNγ using anti-IFNγ (4S.B3; BioLegend, 502509). After staining, cells were washed with perm buffer and then resuspended in standard wash buffer (PBS + 0.5% FBS) and acquired on LSRFortessa™ (BD Biosciences). Cells were gated on viable CD8+ T cells and then IFNγ+ CTV-low cells using FlowJo (BD Biosciences). In another MLR setup, monocyte-derived dendritic cells (GM-CSF [R&D Systems, 215-GM] + IL-4 [R&D Systems, 204-IL] for 7 days) were used as antigen-presenting cells and total T cells enriched from another human PBMC donor (using EasySep™ Human T cell Enrichment kit, STEMCELL Technologies, 19051) in 10:1 ratio. SAR439459, fresolimumab, anti-PD-1 antibodies, or their isotype controls were added at the time of assay setup with or without 1 ng/mL recombinant TGFβ1 (R&D Systems, 240-B). Culture supernatants were collected at day 5 and cytokines, GZB, and perforin were quantified by MSD assay (Meso Scale Diagnostics).
NK cells proliferation, cytokine production and cytotoxicity
NK cell proliferation and inhibition in the presence of TGFβ1 was determined as previously described.Citation33 Enriched NK cells from human PBMC (Human NK Cell Enrichment Kit, STEMCELL Technologies, 19055) were used. NK cells were activated by recombinant human IL-2 (10 IU/mL; R&D Systems, 202-IL/CF) for 3 days in the presence or absence of various concentrations of TGFβ1 (R&D systems). NK cell proliferation was observed by staining with Ki-67-BUV395 antibody (BD Bioscience, 564071) using flow cytometry. TGFβ1 was added at the time of setup with or without SAR439459 or isotype control (IgG4) for 3 days. NK cytotoxicity assays were performed using K562 cells (ATCC® CCL-243™) as targets. NK and K562 cells were cocultured (effector-to-target ratio 5:1) in RPMI-1640 media (GIBCO, 11835–030) supplemented with 10% FBS (GIBCO, 10082–147), and delivery of granzyme B was quantitated by intracellular FACS analysis using GranToxiLux™ assay kit as described (OncoImmunin, Inc, GTL702-8), for 2 hours. In some experiments, culture supernatants were collected for cytokine, GZB, perforin analysis by MSD (Meso Scale Diagnostics) or Luminex (ThermoFisher Scientific).
Phospho-Smad2/3 ELISA and luciferase reporter assays
MC38, EMT6 or HCT116 cells overexpressing human TGFβRII were cultured at 4 × 10⁴ cells/well in a 96-well flat culture plate at 37°C, 5% CO2 overnight. TGFβ1 (1 ng/mL) was used to induce signaling and antibodies were added for 30 minutes at 37°C, followed by Phospho- and Total-Smad2/3 ELISA (Cell Signaling Technology, 12001 and 12000). Cells were lysed in the presence of protease inhibitors for 5 minutes on ice and the lysates were added to the plate and incubated overnight at 4°C. The plate was washed, and the detection antibody was added for 60 minutes, followed by a second wash and addition of horseradish peroxidase-conjugated secondary antibody for 30 minutes. The plate was then developed with 3,3′,5,5′-tetramethylbenzidine substrate and absorbance measured at 450 nm. A Smad binding element (SBE) reporter assay (BPS Bioscience, 60653) was used to monitor inhibition of TGFβ signaling. SBE reporter HEK293 cells were cultured in a 96-well plate for 24 hours at 37°C and 5% CO2. The test antibodies were diluted to various concentrations and added to the plates, incubated for 60 minutes before addition of 1 ng/mL TGFβ1, and incubated overnight at 37°C. The ONE-step™ luciferase reagent (BPS, 60690–1) was used to measure luminescence. The inhibitory effect of TGFβ1 on Jurkat T cells following anti–PD-1 treatment was evaluated using Jurkat PD-1/PD-L1 reporter system (Promega Biosystems, CS187102 and CS187108). Jurkat cells were pretreated with TGFβ1 in the presence of SAR439459, isotype control (human IgG4), or left untreated for 12 days. Jurkat cells were then dispensed into a 384-well plate with CHO-K1 cells following supplier’s protocol. PD-1 antibody (10 μg/mL, pembrolizumab) or control (human IgG4) was added to cultures and the plates were incubated at 37°C, 5% CO2. After 24 hours, 40 μL of Bright-Glo™ (Promega, G7940) reagent was added to each well. In both reporter assays luminescence was determined on EnVision2103™ (PerkinElmer). Data were plotted and analyzed by Prism (GraphPad).
Tumor regression studies
Female C57BL/6 mice (6–8 weeks old) were obtained from the Jackson Labs (Stock no. 000664). Animal studies were approved by the Sanofi Institutional Animal Care and Use Committee. Mouse colon carcinoma MC38 cell line was a generous gift from Dr. S.A. Rosenberg (National Institutes of Health). The cells were cultured in RPMI 1640 with L-glutamine (Gibco, 11875–085) supplemented with 10% heat-inactivated FBS (Gibco, 10082–147) at 37°C in 5% CO2. The cells were harvested, resuspended in Dulbecco’s phosphate-buffered saline (Gibco, 10010–023), and 1 × 10⁶ cells were subcutaneously implanted into the right flank of each female C57BL/6 J mouse. Ovalbumin (OVA)-expressing MC38 (MC38OVA-GFP) cell line was generated in-house and OVA expression determined using anti–H2Kb-SIINFEKL-PE antibody (BioLegend, 141603); 0.5 × 10⁶ of MC38OVA cells were injected subcutaneously in the right flank of each C57BL/6 J mouse. Experiments with mouse breast carcinoma, EMT-6 model, were outsourced from Crown Bioscience, Inc., and 0.5 × 10⁶ EMT-6 cells were injected subcutaneously into the right flank of female BALB/c mice. For all models, mice were pooled and randomized (8–10 mice/group) when tumor size reached approximately 50–90 mm3. The efficacy of SAR439459 alone and in the combination with anti-mouse PD-1 (clone RMP1-14; BioXCell, BP0146) was assessed during 3 weeks of intraperitoneal administration in both models. SAR439459 was administered at a dose of 10 or 25 mg/kg (mpk) twice/week for 3 weeks. PD-1 antibody was administered at a dose of 5 mpk twice/week for 3 weeks. Human IgG4 (Crown Bioscience, AB160025) and MOPC21 (BioXCell, BE0083) were used as isotype controls for SAR439459 and anti–PD-1, respectively. Antitumor efficacy was evaluated by tumor volume measurement, and animal body weights assessed. Tumors were measured with a caliper 2–3 times weekly. When a tumor reached approximately 2000 mm3 or there was 10% body weight loss or 20% tumor ulceration, animals were euthanized. Tumor volumes were estimated from 2-dimensional tumor measurements using the formula: Length × (W2)/2, where W was the smaller of the 2 numbers for 2 dimensions. Complete regression was considered when tumors were <14 mm3. For Lovo mouse model, Female athymic nude-NU (NCr)-Foxn1n HOM mice were obtained from Charles River Labs (Wilmington MA, USA). Lovo cells were obtained from the ATCC (Cat No. CCL-229). The cells were grown in Kaighn’s modification of Ham’s F-12 medium (ATCC 302004) supplemented with 10% FBS at 37°C in 5% CO2. Female athymic nude-NU (NCr)-Foxn1n homozygous (HOM) mice (Charles River Labs, Wilmington, MA) received 5 × 10⁶ cells/200 ul (SC) in the right flank. SAR439459, fresolimumab or HuIgG4 isotype were injected intraperitoneally (IP) and tumor growth was measured as described above.
Intratumoral cytokine quantification
Once tumor size reached approximately 150–250 mm3, mice were injected intraperitoneally with SAR439459 or human IgG4 at 25 mpk, PD-1 antibody, or MOPC-21 at 5 mpk, or their combination. EMT6 tumor bearing mice were treated with similar doses of anti-TGFβ (1D11, Sanofi Genzyme). Lovo model received various doses of either fresolimumab or SAR439459 as mentioned above. A total of three treatment doses were administered one every 3 day and tumors were harvested within 24 hours of the last dose. In IFNγ time course study conducted in EMT6 tumor model, samples were collected at various time points after dosing. Collected tumors were snap frozen in Precellys tubes (Precellys lysing kit Cat# KT03961-1-007.2) and stored at –80°C. To prepare lysates, tumors were thawed and placed in ice-cold Tris lysis buffer (Meso Scale Diagnostics, R60TX) supplemented with 1× Halt™ Protease and Phosphatase Inhibitor Cocktail (ThermoFisher Scientific, 78442), then homogenized using Precellys® 24 dual homogenizer (Bertin Instruments) in two cycles at 6000 rpm, 30 seconds each, at 4°C. Upon centrifugation, lysate supernatants were transferred into clean, chilled 1.5-mL Eppendorf tubes and protein concentration was measured using BCA Protein Assay Kit (ThermoFisher Scientific, 23227). Lysates were normalized to 5 mg/mL protein concentration, snap frozen in liquid nitrogen, and stored at –80°C. TGFβ1 was measured using human TGFβ1 kit (Meso Scale Diagnostics, K1511IUC-2) without the acid treatment, to quantitate only its active form; samples were diluted 4-fold in diluent 9 before loading onto plates. Cytokines were measured using the V-PLEX Proinflammatory Panel 1 (Meso Scale Diagnostics, K15048D), 10-plex (IFNγ, IL-10, IL-12p70, IL-1β, IL-2, IL-4, IL-5, IL-6, keratinocyte chemoattractant/human growth-regulated oncogene, TNFα).
Flow cytometry for tumor-infiltrating lymphocytes
Mice were implanted with MC38OVA-GFP cells and injected intraperitoneally with SAR439459 or isotype control at 25 mpk, mouse PD-1 antibody, or isotype (MOPC-21) at 5 mpk or their combination; mice were given a total of 6 treatment doses in 3 weeks (2/week). Tumors, spleen, and tumor-draining lymph nodes were harvested, and used for preparing single-cell suspensions. Tumors were digested by tumor digestion kit as instructed (Miltenyi Biotec, 130–096-730), whereas lymph nodes and splenocytes were passed through cell strainers (Falcon, 352350). Cells were stained with the H2Kb-SIINFEKL dextramer (Immudex, JD2163-PE and JD2163-APC) as instructed by the manufacturer, followed by Fc blocking (BioLegend, 101320). An antibody cocktail was prepared by mixing anti- CD45-BUV395 (BD Bioscience, 564279), CD8-BV510 (Biolegend, 100752), CD4-BV421, (Biolegend, 100438), CD44-PerCP/Cy5.5 (Biolegend, 103032), CD62L-AF700 (Biolegend, 104426), and CD69-BV711 (Biolegend, 104537) in Brilliant Stain Buffer (BD Bioscience, 563794), and cell suspensions were stained for 30 minutes at 4°C followed by staining with dead cell exclusion dye (Zombie NIR; BioLegend, 423106) and fixed with 1% formaldehyde (Electron Microscopy Systems, 15710) diluted in PBS (GIBCO, 10010–023). Samples were acquired on LSRFortessa (BD Biosciences) and analyzed using FlowJo software.
Single-cell RNA-sequencing profiling
MC38 tumor-implanted mice were divided into various treatment groups as described above. Mice were given 3 doses of treatments intraperitoneally and tumors were harvested within 24 hours of last dose. Tumor tissues were dissociated by utilizing gentleMACS™ protocol (Miltenyi Biotec #130-095-937), the extracted single cells were purified and enriched for viable lymphocytes by density centrifugation (Lympholyte®-M, Cedarlane CL5031). Tissue and cells were kept on ice when possible. Encapsulation of single cells was performed using 10× Genomics Chromium System (120223), Single Cell A Chip and Chromium Single Cell 3ʹ reagent kits (1000075) according to manufacturer recommendations, with 4 channels used per animal. Sequencing of finished NGS libraries was performed using Illumina NovaSeq 6000 system to the depth of about 50 million reads per cell.
Processing pipeline and data QC
Raw sequencing data in the form of FASTQ files were processed using a pipeline incorporating the 10x Genomics software Cell Ranger, as well as additional components for doublet detection and conversion of read counts to transcripts per 100 thousand (TP100K). Reads were mapped to the mouse genome GRCm38. The following quality control steps were applied to the data corpus: eliminating all barcodes from 10x chip channels averaging less than 65% transcripts mapped to transcriptome per cell; eliminating putative cells expressing less than 500 genes; and eliminating cells called doublets by the pipeline or cells tightly co-clustering with the same. The resulting data set contained expression profiles for 102,089 cells.
Assignment of cell types, clustering, and analysis of treatment effects
The 102,089 post-quality control cell types were determined using a version of MCP counter,Citation32 which was adapted to single-cell sequencing data resulting in classification into 12 possible cell types, leading to assignment of 56,924 cells to the tumor/stromal compartment, and the remaining 45,165 cells to the immune compartment. Principled clustering of the data, using a version of k-means partitioning complemented by iterative agglomeration of pairs of clusters distinguished by too few differentially regulated genes, and optimized by extensive resampling, led to robust expression clusters largely consistent with the microenvironment cell population-based cell categorization. Of particular interest were the 3,476 CD8+ T cells (8% of the immune compartment) thus identified, which were further analyzed using the graphical clustering algorithm DDRTree incorporated in the Monocle 2 analysis package.Citation34 Monocle 2 analysis resulted in assignment of the CD8+ T cells to 5 possible transcriptional states.
In addition, the CD8+ T cells were individually scored for engagement in the cell-cycle, using regulated Kolmogorov-Smirnov (KS) analysis on a signature of 133 genes involved in G2/M transition.Citation35 The cells were also scored on the basis of signatures for exhaustion (5 genes) and cytotoxicity (8 genes) of CD8+ T cells.Citation36
Fisher specificity metric
To generate heat maps exhibiting expression of genes which are most specific to each Monocle-defined state, for each gene i (i = 1,2, …, p) and each state S (S = 1,2, …, L), with p = 23177 and L = 5, we first computed the Fisher separation score fS (i)
where mS (i) and mnotS (i) are the means, and σS 2(i) and σnotS 2(i) the sample variances of gene expression over cells in state S and cells not in state S, respectively for each type of statistic. Thus Eq.Citation1 embodies a “one-versus-all” score. In general, a large Fisher score indicates that the distributions of expression over the two cell populations are well-separated. For a given state S, we then used fS (i) to rank all p genes in decreasing order of fS (i), keeping only the top mtop genes in the resulting list, where mtop is a parameter. In generating we used mtop = 50.
Statistical analyses
Statistical analyses were performed by GraphPad Prism 7 software. Groups were compared using unpaired t-test. Two-way ANOVA was used in some experiments as mentioned in the respective figure legends. Grubbs’ test (alpha = 0.05) was performed to identify outliers. Mice survival data were compared using log-rank (Mantel-Cox) test.
Results
Higher TGFβ pathway activation is associated with poor objective response to immunotherapy
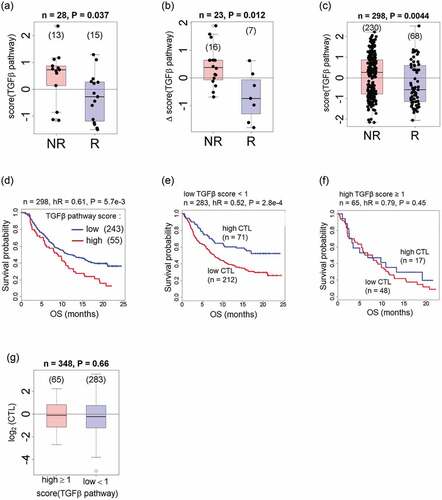
To examine TGFβ pathway status in patients undergoing anti–PD-(L)1 checkpoint inhibitor therapy, we analyzed TGFβ gene signature in a number of publicly available data sets. Under anti–PD-1 or anti–PD-L1 therapy, high TGFβ pathway activation correlated with resistance to therapy and shorter overall survival in nonresponders ().Citation15,Citation18 The distribution of gene set enrichment scores for TGFβ pathway activation versus objective response (responders = [complete and partial responder], nonresponders = [stable disease, progressive disease]) are shown for three clinical studies: melanoma data from Hugo et al. () ;Citation37 melanoma data from Sanofi-Massachusetts General Hospital collaboration (Massachusetts General Hospital database) (); and urothelial cancer data from Mariathasan et al. ().Citation21 In our analysis, median TGFβ scores for each data set were significantly lower for the PD-1/PD-L1 therapy responders than for the nonresponders. Further analysis showed that patients in the TGFβ-low group had improved survival compared with patients in the TGFβ-high group, with a hazard ratio (HR) of 0.61 (). Patients with TGFβ-low signatures from the urothelial cancer data set were subdivided according to CTL scores. Patients from the high-CTL subgroup displayed longer survival compared with the low-CTL group (HR = 0.52; ). Interestingly, no dependence of survival on CTL infiltration was observed for patients in the TGFβ-high group (). CTL abundance did not correlate with TGFβ pathway activation, leading us to conclude that the shorter survival, which was observed in patients with high TGFβ pathway activation, is not due to immune exclusion from the tumor (). Cumulatively, our analysis of patient data indicates that TGFβ signaling is associated with poor clinical outcomes in cancer patients undergoing therapy with immune checkpoint inhibitors PD-1 and PD-L1.
Figure 1. Higher TGFβ pathway activation is associated with worse objective response and lower overall survival under anti–PD-1/PD-L1 therapies. a–c. High TGFβ pathway activation correlates with resistance to PD-1/PD-L1 therapies and with reduced overall survival. Box plots show TGFβ activation signatures in nonresponders (NR) and responders (R) in (a), melanoma data from Hugo et al.;Citation37 (b), melanoma data from Sade-Feldman;Citation38 and (c), urothelial cancer data.Citation21 Enrichment scores are obtained via a regulated Kolmogorov-Smirnov analysis using the RNA sequencing whole-transcriptome profiles available in each study. P values are from Wilcoxon tests. (d), Overall survival for the groups of patients with urothelial cancer who had TGFβ-low pathway activation (n = 243; enrichment score ≥1) and TGFβ-high pathway activation (n = 55; enrichment score <1). TGFβ-low and TGFβ-high data from urothelial cancer was further subdivided on the basis of the respective cytotoxic T lymphocyte (CTL) scores, and patient survival was compared in each case. (e), Survival curves are shown for the TGFβ-low patients, and (f), for the TGFβ-high patients. Box plots show CTL scores in TGFβ-high and TGFβ-low groups (high versus low TGFβ pathway activation), which were not different (g).
SAR439459 is a new-generation TGFβ antibody that can neutralize all known TGFβ isoforms
SAR439459 is a human IgG4 monoclonal antibodyCitation39 generated on the basis of the amino acid sequence of previous-generation TGFβ antibody fresolimumab. Therefore, SAR439459 is a “second generation” human anti-TGFβ monoclonal antibody that neutralizes all isoforms of TGFβ and have cross-reactivity to mouse TGFβ isoforms. SAR439459 bears sequence similarity to fresolimumab, only differing by a single amino acid in the heavy chain (S228P).Citation27,Citation28,Citation40 SAR439459 exhibits significant manufacturability and scalability improvements over fresolimumab. SAR439459 and fresolimumab affinity were compared against TGFβ 1, 2, and 3 in SPR studies. The KD measurements of SAR439459 and fresolimumab were comparable for tested TGFβ isoforms, as would be expected given the similarity of the molecules. ( and Supplementary Figure 1). SAR439459 has an affinity (KD) to human TGFβ 1, 2, and 3 of 0.83, 1.21, and 1.05 nM, respectively, while its KD to mouse and rat TGFβ 1 and 2 was determined to be 2.80 and 1.88 nM, respectively (Supplementary Table 1). Since human and murine TGFβ3 have an identical amino acid sequence, separate affinity experiments were not performed for these 2 proteins. SAR439459 and fresolimumab were also evaluated for their ability to overcome the TGFβ-induced inhibition of mink lung epithelial cell proliferation ( and ). All human and murine TGFβ isoforms inhibited mink lung epithelial cell proliferation in a dose-dependent manner. The half-maximal effective concentration (EC50) values of fresolimumab and SAR439459 for various human TGFβ isoforms in this assay were generally comparable (for TGFβ1: 0.5 and 1.1 µg/mL; for human TGFβ2: 5.5 and 4.8 µg/mL; for human TGFβ3: 1.8 and 2.0 µg/mL, respectively). Both antibodies also exhibited similar EC50 values for the inhibition of murine TGFβ1 isoforms; the TGFβ2 isoform values were 10.5 and 8.5 µg/mL for fresolimumab and SAR439459, respectively ().
Figure 2. SAR439459 binds to various TGFβ isoforms and inhibits TGFβ-mediated signaling similar to fresolimumab. SPR Biacore data shows similar binding properties of SAR439459 and fresolimumab against human TGFβ1, 2, and 3 proteins, (a). Murine colon carcinoma, MC38; mouse breast cancer cells, EMT6 and human colorectal carcinoma cells HCT116-overexpressing TGFβRII were cultured with human TGFβ1 (1 ng/mL) in presence of SAR439459, fresolimumab or isotype control. Total and phosphorylated SMAD2/3 protein levels were assessed by ELISA. Graph shows ratio of phospho-/total SMAD2/3 for SAR439459 and fresolimumab and isotype control, (b). P value <.0001 using two-way ANOVA test. SBE reporter cells were cultured in the presence of human TGFβ isoforms −1, −2, and −3 with various concentrations of SAR439459, fresolimumab or isotype control and luminescence activity was measured. Graphs show ability of SAR439459 and fresolimumab to prevent TGFβ1, 2 and 3-mediated SMAD activation in the reporter cell line, (c). IC50 values for SAR439459 were 0.008, 1.22, 0.45, and for fresolimumab were 0.02, 1.86, 0.61 nM for TGFβ1, TGFβ2, and TGFβ3 respectively. Each graph shows mean ± SEM and represents one of three independent experiments.
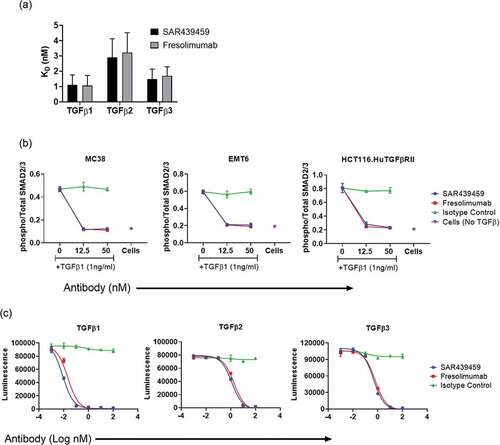
Table 1. Mink cell proliferation assay
SAR439459 inhibits TGFβ-mediated canonical signaling
SMAD protein phosphorylation by TGFβ binding to its receptor is central in determining response of the cell to TGFβ.Citation11 This canonical signaling is also involved in cancer exacerbation.Citation8 To assess the activity of SAR439459 in human cells in vitro, inhibition of TGFβ-mediated SMAD phosphorylation by SAR439459 and fresolimumab was measured in murine cell lines MC38, EMT6 and human HCT116 cells expressing human TGFβRII. Addition of TGFβ1 induced upregulation of phospho-SMAD 2/3 in all three cell lines, whereas total SMAD 2/3 remained unchanged. SAR439459 inhibited phosphorylation of SMAD 2/3, whereas isotype antibody did not (). Fresolimumab, similar to SAR439459, blocked TGFβ1 induced phosphorylation of SMAD2/3. In another experiment, all 3 TGFβ isoforms were used to induce luciferase signals in SBE reporter cells and two different concentrations of SAR439459 and fresolimumab or isotype control were tested. Both SAR439459 and fresolimumab inhibited TGFβ 1, 2, and 3–induced luciferase signals at tested doses. IC50 values of SAR439459 were 0.008, 1.22, 0.45, and for fresolimumab were 0.02, 1.86, 0.61 for TGFβ1, 2 and 3 respectively (). Isotype control antibody at similar concentrations did not block this signal. Taken together, these results demonstrate neutralizing activity of SAR439459 on TGFβ signaling in both human and mouse cells.
SAR439459 prevents TGFβ-mediated suppression of T and NK cell responses in vitro
Next, we evaluated the ability of SAR439459 to reverse TGFβ-mediated immune suppression of human immune cells (T and NK cells). First, we established a human CD8+ T cell and B-LCL–based allogenic system and measured T cell proliferation concurrently with IFNγ production. In the presence of TGFβ1, there was a reduction in the proliferation of human CD8+ T cells that expressed IFNγ. SAR439459 increased percentage of proliferating CD8+ T cells that expressed IFNγ (,b). SAR439459 demonstrated a similar effect in rescuing anti-CD3/CD28 proliferation of CD4 T cells from TGFβ-mediated suppression (Supplementary Figure 3).
Figure 3. SAR439459 restores TGFβ-mediated suppression of primary immune cell function. Enriched CTV-labeled human CD8+ T cells were co-cultured with B-LCL cells in the presence of TGFβ1 (1 ng/mL) and, to analyze effect on CD8+ T cell proliferation and IFNγ, measured by FACS. Cells were gated on live CD8+ T cell population followed by CTV-low and IFNγ-positive cells. FACS plots show proliferation (CTV-low) of CD8+ T cells producing IFNγ under various treatment conditions, (a). Bar graphs show mean ± SEM percentage of CD8+ T cells that were functional CTV-low–IFNγ+, (b). Data are representative of 3 independent experiments with CD8+ T cells from 2 human donors. P values: ***<0.005, **<0.05, ***<0.001, ****<0.0001 for SAR439459 versus isotype at doses (µg/mL) 12.5, 25, 50, and 100, respectively. Enriched NK cells from human donors were cultured in the presence of IL-2 for 2–3 days and with various concentrations of human TGFβ1 (0.1, 1.0, and 10 ng/mL) as shown in the FACS plots. NK proliferation was examined by Ki-67 staining. FACS plots show percentages of live Ki-67-positive NK cells in the presence of varying TGFβ1 doses, (c). FACS plots show NK cell proliferation in presence of TGFβ1 (1 ng/mL) and its blockade by SAR439459, (d). Bar graph shows IL-2–induced NK cell proliferation in presence of various doses of TGFβ (0.1, 1.0, and 10 ng/mL) and treated with SAR439459 (50 nM), human IgG4, or untreated control, (e). P values: ***<0.01, ****<0.0001, and ***<0.05 at 0.1, 1.0, and 10 ng/mL TGFβ1, respectively. FACS plots show percentages of K562 cells positive for cleaved granzyme B (GZB) peptides delivered by NK activity under various conditions, (f). Bar graph shows calculated percentage of cleaved granzyme B peptides in K562 cells (co-cultured with NK cells) in the presence of 1 ng/mL TGFβ1 under various treatment conditions, with or without SAR439459 (50 nM) or human IgG4, (g). P values: **<0.005, ****<0.0001 at 0.1 and 1.0 ng/mL TGFβ1, respectively. One of three experiments is shown. APC, antigen-presenting cell; FITC, fluorescein isothiocyanate. NS, not significant. Graphs show dose dependent induction of GZB, perforin, TNFa and MIP1a in the culture supernatants of K562: NK cell co-culture experiments, (h). Data represents one of two experiments. Bar graphs show IFNγ produced in a human T cell: DC co-culture MLR assay with SAR439459 or fresolimumab treatments or isotype control, (i). P values: SAR439459 vs. untreated = 0.02; fresolimumab vs. untreated = 0.007. SAR439459 vs fresolimumab, NS.
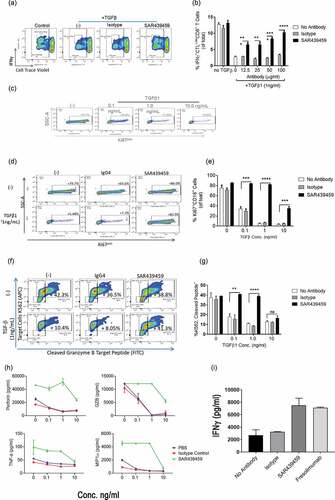
Similar to effects observed in T cells, addition of exogenous TGFβ inhibited IL-2–mediated human NK cell proliferation () in dose dependent pattern (0.1, 1, and 10 ng/ml TGFβ). SAR439459 restored proliferation of NK cells at various doses (,e). In another experiment, NK cell-mediated cytotoxic assay was established with K562 cells as targets. In the presence of TGFβ1, cytotoxicity of K562 cells was compromised due to the suppressive effect of TGFβ signaling on NK cells. Neutralizing TGFβ1 with SAR439459 restored cytotoxicity of K562 cells (,g). In each of these assays, isotype antibody had no effect in reversing TGFβ-mediated suppression. Furthermore, in a similar NK: K562 coculture settings, we observed that TGFβ inhibition by SAR439459 also enhanced levels of TNFα, granzyme, perforins and MIP1α (). Collectively, our data show that SAR439459 can effectively neutralize TGFβ-mediated immune suppression of human T and NK cells. To further compare the activity of SAR439459 and fresolimumab in a functional assay, we setup a T cell/DC based MLR assay. Here, SAR439459 and fresolimumab similarly promoted T cell mediated IFNγ response by neutralizing endogenous TGFβ ()
SAR439459 enhances anti–PD-1–mediated T cell response
Patient data analysis revealed that TGFβ signaling is upregulated in patients who are refractory to PD-(L)1 immune checkpoint blockade and TGFβ is suppressive to the effector functions of T cells. We therefore hypothesized that simultaneous inhibition of TGFβ signaling may be beneficial to anti–PD-(L)1–mediated immune activation. To examine this, human primary T cells and monocyte-differentiated dendritic cells were used to set up an MLR assay. In this MLR, PD-1 antibody induced higher T cell activation; however, SAR439459 increased the anti–PD-1 treatment-mediated IFNγ production further (). This suggested that endogenous TGFβ produced in this system was enough to suppress IFNγ production in such a way that this effect can be rescued by the addition of SAR439459. Addition of exogenous TGFβ1 (1 ng/mL) further decreased the level of IFNγ and this effect was reversed upon SAR439459 treatment. In addition, we observed that SAR439459 improved IFNγ production in the absence of anti–PD-1 treatment, although the effect size was smaller (). Human IgG4 exhibited no change in IFNγ compared with the no-treatment control. In the MLR assay we also analyzed the ability of anti-PD1 and SAR439459 treatments to enhance additional T cell cytokine expression and observed that this combination significantly enhanced IL-2, granzyme B, perforin, IL-6, and TNFα expression when compared to single agent treatments. We also found that IL-10 was upregulated by the combination; however its levels were lower compared to the other cytokines analyzed ().
Figure 4. PD-1 blockade-mediated T cell response is further enhanced by SAR439459. Total T cells and monocyte-derived dendritic cells from healthy human donors were co-cultured in a ratio of 10:1 with anti–PD-1 (10 nM) alone, SAR439459 (50 nM) alone, their combination, or isotype controls. Bar graph shows mean ± SEM level of IFNγ under various treatments, (a). Assay was set up with or without addition of exogenous TGFβ1 to the cultures. P values are shown between isotype control vs SAR439459 for all treatment conditions: *<0.01, **<0.008, a = 0.08, b = 0.03. Experiment was performed in 2 different donors and repeated at least four times. Graph shows mean ± SEM luciferase activity from NFAT reporter Jurkat assay under similar treatment conditions as detailed in Materials and Methods section, (b). Data represent at least 3 independent experiments. P value: ****<0.0001. RLU, relative light units. In MLR assay data demonstrates production of IL-2, GZB, Perforin, IL-6, IL-10 and TNF by TGFβ and PD1 co-inhibition, (c). P values: Combination vs. anti-PD1 or SAR439459 alone, IL2 < 0.0004 and <0.0001, GZB 0.0003 and 0.0001, Perforin, 0.01 and 0.08, IL-6 0.001 and 0.01, IL-10 < 0.0001 both and TNFα 0.03 both.
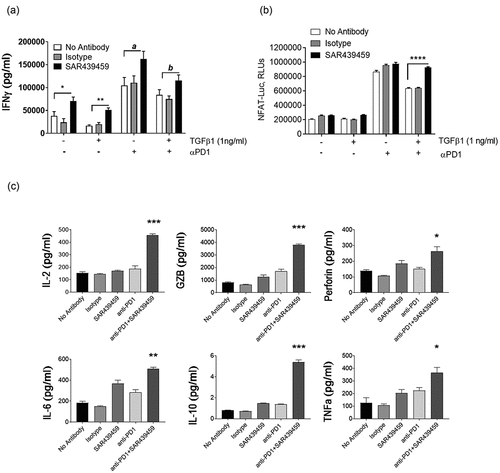
In another experiment, we used Jurkat cells stably transduced with nuclear factor of activated T cells (NFAT) luciferase reporter that were cocultured with CHO cells expressing human PD-L1 (Promega assay) to demonstrate a similar effect. PD-1 inhibition was evaluated in Jurkat cells via a luciferase reporter driven by NFAT response element. Addition of the PD-1 antibody to Jurkat T cells cocultured with CHO-K1 cells induced NFAT luciferase activity. Pretreatment of Jurkat cells with TGFβ1 inhibited this activity despite anti–PD-1 treatment, establishing the ability of TGFβ1 to inhibit NFAT cytoplasmic 1 activity in these cells (). To evaluate the activity of SAR439459, Jurkat T cells were pretreated with TGFβ1 in the presence of SAR439459 or isotype control antibody, then cocultured with CHO-K1 cells in the presence of anti–PD-1. SAR439459 relieved the TGFβ-dependent suppression of PD-1 inhibition in Jurkat cells. TGFβ1 treatment did not affect proliferation or viability of Jurkat T cells. Taken together, our in vitro data support the notion of concurrent TGFβ blockade to elicit maximal immunostimulatory effects by anti–PD-(L)1.
SAR439459 mediates tumor regression as a single agent and improves antitumor efficacy of anti–PD-1 antibody
On the basis of our in vitro results and given the well-established role of TGFβ in mediating immune suppression in the tumor microenvironment, Citation11 we sought to examine if blocking TGFβ using SAR439459 may have single-agent antitumor efficacy or the ability to potentiate activity of anti–PD-1 in MC38 and EMT-6 tumor models. In MC38 tumor model, SAR439459 was tested at 25 mpk alone or at two different doses of 10 mpk or 25 mpk in combination with 5 mpk of anti–PD-1 antibody. Treatment with 25 mpk of SAR439459 as a monotherapy resulted in similar tumor growth inhibition as with anti–PD-1 therapy. When combined with anti–PD-1 therapy, both dose levels of SAR439459 demonstrated better efficacy than each agent alone, with 25 mpk of SAR439459 producing more-pronounced tumor growth inhibition in concert with anti–PD-1 (). In addition, combination treatment improved the survival of mice in this study in a dose-dependent manner, with 80% of mice surviving on 25-mpk dose of SAR439459 in combination with anti–PD-1, while treatment with 10 mpk of SAR439459 resulted in 70% of mice reaching the predefined survival threshold ().
Figure 5. SAR439459 improves antitumor efficacy of PD-1 blockade in mouse tumor models and combination establishes long-lasting immunity. Antitumor efficacy of SAR439459 in combination with PD-1 antibody was examined in mouse colon and breast carcinomas, MC38 and EMT-6, respectively. Graph shows time dependent MC38 tumor volumes over time after receiving various treatments as detailed in Materials and Methods (a). Survival curves of mice from MC38 study over several days. P values: *<0.05, **<0.005 (b). Graph depicts EMT-6 breast cancer tumor volumes over time in mice after receiving various treatments (c). Survival data from EMT-6 tumor model at various days (d). Mice surviving EMT-6 experiment in combination and SAR439459 monotherapy group were re-challenged with EMT-6 tumors, (e). Curves show that tumors were immediately rejected in these mice. Tumor growth inhibition in Lovo model by SAR439459 and fresolimumab as a monotherapy at day 31 and 35 post tumor implantation, (f). Data was compared with two-way ANOVA and no difference was observed between SAR439459 vs. fresolimumab.
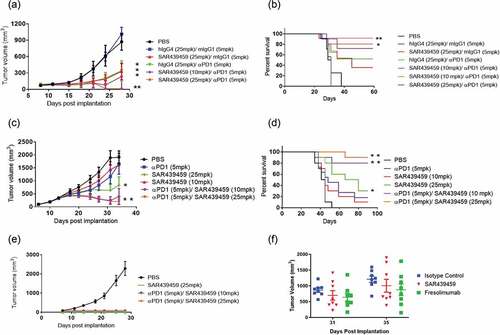
In EMT-6 model, where treatment with 5 mpk of PD-1 antibody did not inhibit tumor growth, SAR439459 was effective at 25 mpk as monotherapy. Furthermore, combination of anti–PD-1 antibody with SAR439459 at either of the doses tested produced better tumor-growth control (). In addition, the combination of SAR439459 (25 mpk) and anti–PD-1 antibody resulted in 90% of mice achieving complete response (). SAR439459 monotherapy resulted in 10% and 30% survival at 10- and 25-mpk doses, respectively (), while anti–PD-1 treatment at 5-mpk dose resulted in 20% of the mice surviving at end of study.
To further evaluate whether complete responders from monotherapy and combination treatment groups were able to experience long-lasting immune response, cured mice were re-challenged with EMT-6 tumors. We observed that all the mice from SAR439459 monotherapy or its combination with PD-1 antibody at both doses rejected tumors (). Collectively, these results establish beneficial effects of concurrent TGFβ and PD-1 blockade in several different tumor models in fully immune-competent mice. The efficacy of SAR439459 against a subcutaneous LoVo human mesenchymal colorectal cancer in xenograft athymic nude-NU (NCr)-Foxn1n HOM mice was investigated and compared with the efficacy of fresolimumab. Administration of SAR439459 and fresolimumab as a monotherapy at 25 mpk demonstrated inhibition in tumor growth at day 35 as compared to their isotype control. No significant difference between SAR439459 and fresolimumab groups was found ().
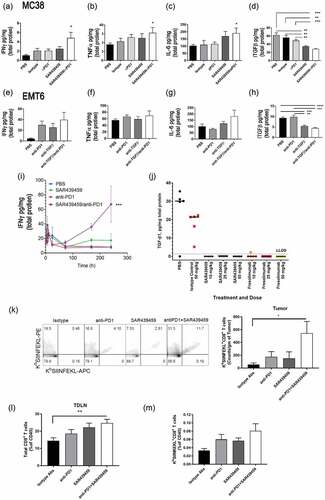
Combination of SAR439459 with PD-1 blockade augments intratumoral inflammatory cytokines by inhibiting tumor TGFβ levels
Given the antitumor activity of the combination of SAR439459 and anti–PD-1 in preclinical tumor models, we next performed mechanistic studies to better understand the basis of this effect. Both MC38 and EMT-6 tumor models were used to examine intratumoral cytokine levels in various antibody treatment groups. Coincident with the observed increase in antitumor efficacy, the combination of SAR439459 and anti–PD-1 led to increase in intratumoral levels of IFNγ, TNFα, and IL-6 in the MC38 model. We observed increased levels of IL-6 in the group treated with SAR439459 alone; however, this was not statistically significant compared with isotype control group (). In the EMT-6 model treated with mouse surrogate antibody (1D11), a similar trend in intratumoral cytokines was observed (). Next, we also determined a time course of intratumoral IFNγ induction by SAR439459 in combination with anti-PD1 in EMT-6 model. As demonstrated in , we found that combination of SAR439459 and anti-PD1 enhanced IFNγ level with increased doses and time. Treatment with SAR439459 (25 mpk) alone or in combination with anti–PD-1 resulted in decreased levels of active TGFβ1 in MC38 tumors (), thus indicating engagement of the target. Similarly, in EMT-6 tumors, anti-TGFβ treatment alone or in combination with anti-PD1 showed significantly reduced levels of active TGFβ1 (). In Lovo model, we compared the ability of SAR439459 and fresolimumab as a monotherapy to inhibit active TGFβ1 at various doses and observed that treatment with either of these antibodies reduced intratumoral TGFβ levels at all the doses. No difference in the level of TGFβ inhibition was observed between SAR439459 and fresolimumab at similar doses (Figure 6J).
Figure 6. SAR439459 in combination with PD-1 blockade elicits proinflammatory cytokine response, tumor-specific CD8+ T cell response. Mice were implanted with various types of tumors and treated with three doses of SAR439459 alone, PD-1 antibody alone, or their combination. Control groups received either vehicle (PBS) or similar doses of isotype antibodies in combination. Intratumoral cytokines were evaluated. Bar graphs show mean ± SEM intratumoral levels of A, IFNγ, combo versus PBS, *P = .01; combo versus isotype, P = .07; B, TNFα, combo versus PBS, *P = .06; C, IL-6, combo versus PBS, *P = .04; and D, TGFβ, combo versus PBS, ***P = .0004; combo versus isotype, **P = .001; combo vs anti–PD-1, ***P = .0003; SAR439459 versus PBS, **P = .001; SAR439459 versus isotype, **P = .005; SAR439459 versus anti–PD-1, **P = .003. n = 5 mice/each group, and data are representative of two or more experiments. Mice implanted with EMT6 tumors were treated with three doses of anti-TGFβ (1D11), anti-PD1, their combination or vehicle (n = 5 each group) and intratumoral levels of various cytokines IFNγ, TNFα, IL-6 and TGFβ are shown, (e-h). P values; PBS vs. combination, 0.06 for IFNγ, 0.3 for TNFα, 0.1 IL-6. For TGFβ, PBS vs. combination = 0.0001 and anti-TGFβ = 0.0004, and anti-PD1 vs. combination = 0.0004 and anti-TGFβ = 0.002. In addition, time course evaluation of IFNγ was performed after various treatments in EMT6 tumor model, (i). Two-way ANOVA analysis show interaction P value 0.0009 and column factor 0.0013. Intratumoral levels of TGFβ were analyzed in Lovo model after treatment with different doses of SAR439459 or fresolimumab, (j). Mice were implanted with MC38OVA tumors and divided into various treatment groups. Tumors and draining lymph nodes were examined for presence of total and OVA-specific CD8+ T cells using FACS. Dot plots show dextramer staining on tumor samples among various groups. Graph shows counts of OVA-specific CD8+ T cells normalized to tumor weight, (k). P value combination versus isotype: *<0.03. Graph shows mean percentages of total and OVA-specific CD8+ T cells in tumor-draining lymph nodes among various treatment and control groups (l) & (m) respectively. P value, **0.009 combination versus isotype control. TDLN, tumor-draining lymph node.
Combined TGFβ and PD-1 blockade improves intratumoral T cell response and decreases T cell exhaustion
To determine if TGFβ inhibition by SAR439459 in combination with anti–PD-1 therapy can induce tumor antigen specific CD8+ T cells, we used OVA-expressing MC38 tumor model. Mice were divided in various groups and treated with different antibody preparations as described in Materials and Methods. OVA-specific CD8+ T cells were enumerated using SIINFEKL dextramer in the tumors and draining lymph nodes. SAR439459 in combination with PD-1 antibody increased OVA-specific CD8+ T cells in tumors and draining lymph nodes (,m). Moreover, in the combination treated group we observed increase in overall CD8+ T cells in the tumor draining lymph nodes ().
To further probe changes occurring at single-cell level in the combination treated tumors, we used single-cell RNA sequencing analysis focusing on intratumoral CD8+ T cells. This analysis using the graphical clustering algorithms incorporated in Monocle 2Citation34 identified 5 distinct gene types of intratumoral CD8+ T cells on the basis of their proliferative states, shown as 1–5 (). As illustrated, most of the CD8+ T cells belonged to either state 1 (proliferative state) or 5 (exhaustion state). Additionally, CD8+ T cells were individually scored for engagement in the cell cycle using regulated Kolmogorov-Smirnov (KS) analysis on a signature of 133 genes involved in G2/M transitionCitation35 (). The cells were scored on the basis of gene signatures for exhaustion and cytotoxicity of CD8+ T cells as described earlierCitation36 . The frequency of cells in state 1 increases under the sequence of treatments (isotype-control < anti-PD1 < SAR439459 < SAR439459+ anti-PD), from about 35% to 45%, while the frequency of cells in state 5 markedly decreases in the same order, from about 45% to 15%. No statistically significant trends are seen for states 2, 3, and 4. Overall, states 1 and 5 account for 75% of the CD8+ T cells, while state 4 accounts for approximately 15% and states 2 and 3 for about 10% of the total (). Heat map of genes selected for specificity to each of the 5 CD8+ T cell states is shown in . The top 50 genes ranked by specificity were selected for each state (some overlap occurs between gene sets, resulting in only 227 genes selected overall) are shown in . State 1 depicted higher score in G2/M phase compared with state 5 (). Next, we compared the fraction of CD8+ T cells in state 1 and state 5 for each treatment group and found that combination treatment of SAR439459 and anti-PD1 had a higher fraction of cells that were in the proliferative state (state 1), while exhibiting the lowest fraction in the exhausted state (state 5) ().
Figure 7. Single-cell RNA sequencing profiling in MC38 tumor model indicates that SAR439459 induces proliferative phenotype in intratumoral CD8+ T cells. Dimensional reduction and tree inference by a graphical clustering method on a set of 3,476 CD8+ T cells generated from MC38 tumor models in 12 mice assigned to 4 treatment groups (all 4 treatment groups shown together) clusters the T cells into 5 distinct “states” (see Methods). Cells are displayed in accordance to their DDRTree coordinates; numeric membership per state is indicated next to each label, (a). Bar plots showing fractional membership in states 1 and 5 for CD8+ T cells as a function of treatment. ANOVA P values (n = 12) are indicated in the plot headers. The frequency of cells in state 1 increases under the sequence of treatments (isotype-control < anti-PD-1 < SAR439459 < SAR439459+ anti-PD-1), from about 35% to 45%, while the frequency of cells in state 5 markedly decreases in the same order, from about 45% to 15%. No such trends are seen for the states 2, 3 and 4. States 1 and 5 accounted for 75% of the CD8+ T cells, while state 4 accounted for about 15% and state 2 and 3 for approximately 10% of the total. P values are shown (b). Heat map of genes selected for specificity to each of the 5 CD8+ T cell states. The top 50 genes ranked by specificity were selected for each state (some overlap occurs between gene sets, resulting in only 227 genes selected overall). Colors represent Z-transformed log2 (transcripts per 100,000 + 1) values. While state 1 shows marked expression of genes for cell cycle and cellular proliferation (inset shows representative genes in this group), state 5 shows marked expression of genes for cytotoxic or checkpoint proteins (see inset). State 4 is enriched in genes induced by type I interferons, but its membership did not significantly change with treatment (c). Gene set enrichment analysis confirms engagement of cellular proliferation pathways in many of the state 1 CD8+ T cells, and in none of the state 5 CD8+ T cells; thus, a signature consisting of G2/M transition genes scores positively for many cells in state 1, and for none in state 5, (d). Comparison of 2 signature based CD8+ T cell categories, “primed/activated” versus “exhausted,” shows that state 1 has about twice as many primed/activated cells than state 5, with respective proportions 40% and 20%, (e).
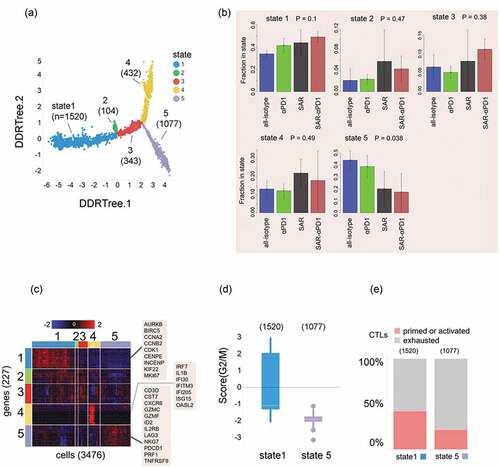
Table 2. List of genes expressed in each state
Discussion
Targeting the PD-1/PD-L1 axis, a checkpoint pathway found in key immune cells, has emerged as a promising strategy in cancer immunotherapy. However, despite the beneficial outcomes observed in some patients following PD-1/PD-L1 pathway inhibition, a significant number of cancer patients are either innately resistant or eventually become refractory to anti–PD-1/PD-L1 therapies.Citation5,Citation6,Citation41 Thus, there remains an urgent need to identify the underlying mechanisms of such resistance. Thorsson V. et al. studied 10,000 patient tumors and identified TGFβ upregulation as a mechanism of immune evasion as one of the key mechanisms that encompass multiple cancer types.Citation42 Moreover, immune cell exclusion pathways present within the tumor microenvironment have been postulated to contribute to patient resistance to anti-PD-1/PDL-1 therapy, and TGFβ has recently been suggested to suppress antitumor immune response in this context by blocking T cells infiltration to the tumor. This was hypothesized to be dependent on TGFβ induced tumor stroma in metastatic urothelial cancer and in a genetically reconstituted mouse colon cancer model.Citation21,Citation22 While this could be a case in some patients/or cancer type, our data suggest that TGFβ promotes tumor progression by directly suppressing the antitumor T cell response in the tumor microenvironment (TME) and tumor draining lymph nodes. Our analysis from various cohorts of cancer patients demonstrates that TGFβ pathway activation is significantly higher in the patient population that is nonresponsive to anti–PD-1 or anti–PD-L1 therapies, compared with those who respond well. Interestingly, the level of cytotoxic T lymphocytes in both groups was not different suggesting no difference in their ability to infiltrate tumors. The presence of T cells armed with key effector functions (e.g. IFNγ, IL2) correlates very well with increased survival and positive outcomes in cancer patients.Citation43 This was also found to be true in our analysis of patient cohort with lower TGFβ activation level. However, in the presence of upregulated TGFβ pathway activation, higher cytotoxic T cell infiltrate does not correlate with improved patient survival. Taken together with the ability of TGFβ to directly impact effector functions of T cells, these patient data demonstrate that high TGFβ levels suppress the protective activity of T cells under anti–PD-1/PD-L1 therapies and not their infiltration. Similarly in an earlier report, it was shown that immune evasion in TGFβ high tumors was not associated with the lack of T cell infiltration or absence of Th1 cells as such immune subtype was shown to exhibit immune infiltration.Citation42 Our in vitro data demonstrated direct impact of TGFβ on T cell’s ability to express effector function molecules (e.g. IFNγ, GZB, Perforin). In addition, our in vivo data indicated increase in tumor specific and total CD8+ T cells in tumor draining lymph nodes in association with increased percentage of proliferating CD8+ T cells, while decreasing their exhaustion signature. Tumor draining lymph nodes are crucial sites for generating anti-tumor T cell responses in response to PD-1/PD-L1 blockade in cancer.Citation44 Therefore, given the fact that TGFβ is highly pleiotropic and based on our current data, we speculate that TGFβ not only inhibits proliferation of anti-tumor CD8+ T cells in the TME, but also interferes with their priming in tumor draining lymph nodes. We hypothesize therefore that anti-TGFβ therapies, such as SAR439459, may act not only in the tumor, but also in secondary lymphoid organs, including tumor draining lymph nodes, to revert this effect. Furthermore, TGFβ signaling in certain cancer cells can promote PD-L1 expression thereby inhibiting T cells further and that anti-TGFβ therapies can counteract this phenomenon.Citation45 PD-1 blockade therapy has also shown to elevate Treg, in squamous cell carcinoma (SCC).Citation46 However, we did not find this correlation in MC38 and EMT6 models (data not shown).
Our MLR assay data and earlier published reports suggest that PD-1 blockade while enhancing T cell proliferation and effector response (IFNγ, GZB, etc.), Citation37,Citation44 may also lead to production of TGFβ in the TME by immune cells including T cells, Citation11,Citation41 thus potentially limiting T cell function. SAR439459 neutralizes active TGFβ to reverse this suppression and restores full capability of PD1-inhibition. Our data generated in MLR assay using exogenously added TGFβ to mimic the TME, where various cell types can serve as sources of active TGFβ, Citation23 yielded similar results and confirmed the ability of SAR439459 to enhance T cell responses . These results were reproduced in Jurkat cell reporter assay system, where TGFβ presence inhibited the ability of PD-1 blockade in transducing downstream NFkB signaling, which was rescued by SAR439459. TGFβ has the ability to directly act on broad range of immune cells and inhibit expression of perforin, GZA, GZB, FasL, and IFNγ in a SMAD-dependent fashion.Citation47 SAR439459 was able to restore effector cytokine production by T cells and NK cells in vitro and enhance their cytotoxicity against target cells.
IP administration of SAR439459 was able to inhibit intratumoral TGFβ in MC38, EMT-6, and LoVo tumor models suggesting its ability to inhibit TGFβ in the TME regardless of the tumor type. In efficacy studies, SAR439459 as a monotherapy was able to generate modest anti-tumor efficacy in both the MC38 and EMT6 models by merely inhibiting TGFβ levels. This is in agreement with the previous study, which suggested that inhibiting both TGFβ 1 and 2 can augment antitumor T cell response.Citation48 In our studies, the combination of SAR439459 and PD-1 blockade increased the percentage of mice reaching complete regression as well as overall percentage survival in this group. The increased efficacy of the combinatorial therapy correlated with intratumoral production of the proinflammatory cytokines IFNγ, TNFα, and IL-6 suggesting that the antitumor T cell response was specifically generated by coinhibition of TGFβ and PD-1. These cytokines are known to be produced as a result of elicitation of T cell response and can shape a long-lasting T cell memory response. Our data from the time course study of intratumoral IFNγ in EMT6 suggests that combination treatment is effective from the early time points in generating such a response. In addition, both TNFα and IFNγ can have direct tumoricidal activity.Citation49–Citation52 In addition to augmented cytokine induction, rechallenge data from EMT6 model suggested that the antitumor response generated by combinatorial anti-PD1/anti-TGFβ treatment was indeed a prolonged T cell response. Recent report in prostate cancer demonstrated that lack of Th1 cells (CD4 T cells producing IFNγ) was associated with high TGFβ levels, which led to checkpoint therapy failure, and that inhibition of TGFβ reversed this effect.Citation53 This suggests that TGFβ mediated suppression of T cell effector functions (e.g. IFNγ response) is a key mode of action in mediating resistance to checkpoint blockade therapies. Our data supports the notion that SAR439459 can also restore CD4 T cell proliferation in the presence of TGFβ.
Data generated in MC38OVA model was critical in determining that TGFβ can inhibit antitumor CD8+ T cell response as a result of PD1 inhibition not only within the TME, but also in the draining lymph nodes, which in turn can be rescued by the treatment with SAR439459. Based on the increase in total number of CD8+ T cells in the tumor draining lymph nodes, we hypothesize that TGFβ may inhibit priming of CD8+ T cells in the draining lymph nodes. Whether TGFβ mediates a direct resistance mechanism for T cell recruitment to the tumors remains an open question to be explored. Our single-cell RNA sequencing analysis suggested that TGFβ impedes CD8+ T cell proliferation and promotes exhaustion as combination of SAR439459 with anti–PD-1 antibody enhanced intratumoral CD8+ T cell proliferation and relieved exhaustion of CD8+ T cells. Therefore, SAR439459 alleviates the suppressive TME and allows checkpoint inhibitors, such as anti–PD-1 antibodies, to induce more profound and long-lasting CD8+ T cell responses. This strategy may be deployed in a clinical setting, especially for patients who are resistant to checkpoint blockade therapy. SAR439459 could also be beneficial as a monotherapy in certain tumor contexts or in combination with immune therapies other than anti-PD(L)1 agents.Citation41 Apart from the immunological effects of TGFβ, its direct impact on tumor cells in increasing their proliferation, promoting metastasis by epithelial to mesenchymal transition, and promoting tumor stromal cells, which takes place in canonical or noncanonical signaling pathways, cannot be underestimated.Citation8,Citation11 Besides preventing immune suppression, SAR439459 has been shown to potentially block signaling in tumor cells.
With increasing interest in targeting TGFβ for cancer immunotherapy various therapeutic modalities have recently emerged. Galunisertib, a small molecule inhibitor, targeting ALK5 was shown to promote anti-tumor immunity.Citation54 However, small molecule-based targeting of TGFβ remains associated with toxic manifestations.Citation55 SAR439459 is capable of binding to and blocking TGFβ isoforms without safety concerns in preclinical models. Its predecessor, fresolimumab, has been evaluated in several indications in the clinic.Citation28,Citation56 Additionally, antitumor effects of murine surrogate of fresolimumab have been well documented by Yang et al. in 12 breast cancer models leading to suppression of metastasis in 75% of the models suggesting benefit of pan-isoform inhibition.Citation57 Our rat and monkey pharmacokinetics studies showed an increased half-life of SAR439459 compared with fresolimumab, suggesting that besides its improved CMC properties, potentially higher exposure at the same dose level may be obtained by SAR439459 in the clinic (data not shown). In contrast to strategies to target TGFβ receptors or other cell surface-expressed family members, Citation11,Citation58,Citation59 neutralization of active TGFβ in the tumor microenvironment may have safety advantages. In line of that, a bispecific combination of PDL-1 with TGFβRII ectodomain targeting active TGFβ has shown antitumor efficacy in mouse models and is under clinical investigation.Citation58 On the basis of these favorable characteristics and strong preclinical rationale, clinical development of SAR439459 is currently underway in a number of human solid tumors, as monotherapy and in combination with anti–PD-1 (NCT03192345).
Disclosure of potential conflicts of interest
Authors are current or former employees of Sanofi US. This work was funded by Sanofi.
Supplemental Material
Download ()Acknowledgments
We thank Jeff Lee, IP, Sanofi for his review and suggestions. Writing assistance was provided by Joanne Franklin, PhD, CMPP, Aptitude Health, The Hague, the Netherlands.
Supplementary material
Supplemental data for this article can be accessed on the publisher’s website.
References
- Wei SC, Duffy CR, Allison JP. Fundamental mechanisms of immune checkpoint blockade therapy. Cancer Discov. 2018;8:1069–18. doi:10.1158/2159-8290.CD-18-0367.
- Sharma P, Allison JP. The future of immune checkpoint therapy. Science. 2015;348:56–61. doi:10.1126/science.aaa8172.
- Borghaei H, Paz-Ares L, Horn L, Spigel DR, Steins M, Ready NE, et al. Nivolumab versus docetaxel in advanced nonsquamous non-small-cell lung cancer. N Engl J Med. 1627-39;2015:373.
- Herbst RS, Baas P, Kim D-W, Felip E, Perez-Gracia JL, Han J-Y, Molina J, Kim J-H, Arvis CD, Ahn M-J, et al. Pembrolizumab versus docetaxel for previously treated, PD-L1-positive, advanced non-small-cell lung cancer (KEYNOTE-010): a randomised controlled trial. Lancet. 2016;387(10027):1540–1550. doi:10.1016/S0140-6736(15)01281-7.
- Kim JM, Chen DS. Immune escape to PD-L1/PD-1 blockade: seven steps to success (or failure). Ann Oncol. 2016;27:1492–1504. doi:10.1093/annonc/mdw217.
- Miao Y, Yang H, Levorse J, Yuan S, Polak L, Sribour M, Singh B, Rosenblum MD, Fuchs E. Adaptive Immune Resistance Emerges from Tumor-Initiating Stem Cells. Cell. 2019;177(5):1172–86 e14. doi:10.1016/j.cell.2019.03.025.
- Pitt JM, Vetizou M, Daillere R, Roberti MP, Yamazaki T, Routy B, Lepage P, Boneca I, Chamaillard M, Kroemer G. Resistance mechanisms to immune-checkpoint blockade in cancer: tumor-intrinsic and -extrinsic factors. Immunity. 2016;44(6):1255–1269. doi:10.1016/j.immuni.2016.06.001.
- Principe DR, Doll JA, Bauer J, Jung B, Munshi HG, Bartholin L, Pasche B, Lee C, Grippo PJ. TGF- : duality of function between tumor prevention and carcinogenesis. J Natl Cancer Inst. 2014;106(2):djt369. doi:10.1093/jnci/djt369.
- Wrzesinski SH, Wan YY, Flavell RA. Transforming growth Factor- and the immune response: implications for anticancer therapy. Clin Cancer Res. 2007;13(18):5262–5270. doi:10.1158/1078-0432.CCR-07-1157.
- Travis MA, Sheppard D. TGF-beta activation and function in immunity. Annu Rev Immunol. 2014;32:51–82. doi:10.1146/annurev-immunol-032713-120257.
- Batlle E, Massague J. Transforming growth factor-beta signaling in immunity and cancer. Immunity. 2019;50:924–940. doi:10.1016/j.immuni.2019.03.024.
- Seystahl K, Papachristodoulou A, Burghardt I, Schneider H, Hasenbach K, Janicot M, Roth P, Weller M. Biological Role and Therapeutic Targeting of TGF-β3 in Glioblastoma. Mol Cancer Ther. 2017;16:1177–1186. doi:10.1158/1535-7163.MCT-16-0465.
- Shah S, Qiao L. Resting B cells expand a CD4+CD25+Foxp3+ Treg population via TGF-beta3. Eur J Immunol. 2008;38:2488–2498. doi:10.1002/eji.200838201.
- Ma GF, Miao Q, Zeng XQ, Luo TC, Ma LL, Liu YM, Lian -J-J, Gao H, Chen S-Y. Transforming growth factor-beta1 and -beta2 in gastric precancer and cancer and roles in tumor-cell interactions with peripheral blood mononuclear cells in vitro. PLoS One. 2013;8:e54249. doi:10.1371/journal.pone.0054249.
- Teicher BA. Transforming growth factor-beta and the immune response to malignant disease. Clin Cancer Res. 2007;13:6247–6251. doi:10.1158/1078-0432.CCR-07-1654.
- Marie JC, Letterio JJ, Gavin M, Rudensky AY. TGF-beta1 maintains suppressor function and Foxp3 expression in CD4+CD25+ regulatory T cells. J Exp Med. 2005;201:1061–1067. doi:10.1084/jem.20042276.
- Chen CH, Seguin-Devaux C, Burke NA, Oriss TB, Watkins SC, Clipstone N, et al. Transforming growth factor beta blocks Tec kinase phosphorylation, Ca2+ influx, and NFATc translocation causing inhibition of T cell differentiation. J Exp Med. 1689-99;2003:197.
- McKarns SC, Schwartz RH, Kaminski NE. Smad3 is essential for TGF-beta 1 to suppress IL-2 production and TCR-induced proliferation, but not IL-2-induced proliferation. J Immunol. 2004;172:4275–4284. doi:10.4049/jimmunol.172.7.4275.
- Kasid A, Bell GI, Director EP. Effects of transforming growth factor-beta on human lymphokine-activated killer cell precursors. Autocrine inhibition of cellular proliferation and differentiation to immune killer cells. J Immunol. 1988;141:690–698.
- Kuppner MC, Hamou MF, Bodmer S, Fontana A, de Tribolet N. The glioblastoma-derived T-cell suppressor factor/transforming growth factor beta 2 inhibits the generation of lymphokine-activated killer (LAK) cells. Int J Cancer. 1988;42:562–567. doi:10.1002/ijc.2910420416.
- Mariathasan S, Turley SJ, Nickles D, Castiglioni A, Yuen K, Wang Y, et al. TGFbeta attenuates tumour response to PD-L1 blockade by contributing to exclusion of T cells. Nature. 2018;554:544–548. doi:10.1038/nature25501.
- Tauriello DVF, Palomo-Ponce S, Stork D, Berenguer-Llergo A, Badia-Ramentol J, Iglesias M, Sevillano M, Ibiza S, Cañellas A, Hernando-Momblona X, et al. TGFbeta drives immune evasion in genetically reconstituted colon cancer metastasis. Nature. 2018;554:538–543. doi:10.1038/nature25492.
- Colak S, Ten Dijke P, Targeting TG. F-beta Signaling in Cancer. Trends Cancer. 2017;3:56–71. doi:10.1016/j.trecan.2016.11.008.
- Park BV, Freeman ZT, Ghasemzadeh A, Chattergoon MA, Rutebemberwa A, Steigner J, Winter ME, Huynh TV, Sebald SM, Lee S-J, et al. TGFbeta1-mediated SMAD3 Enhances PD-1 expression on antigen-specific t cells in cancer. Cancer Discov. 2016;6:1366–1381. doi:10.1158/2159-8290.CD-15-1347.
- Sun C, Mezzadra R, Schumacher TN. Regulation and Function of the PD-L1 Checkpoint. Immunity. 2018;48:434–452. doi:10.1016/j.immuni.2018.03.014.
- Formenti SC, Hawtin RE, Dixit N, Evensen E, Lee P, Goldberg JD, Li X, Vanpouille-Box C, Schaue D, McBride WH, et al. Baseline T cell dysfunction by single cell network profiling in metastatic breast cancer patients. J Immunother Cancer. 2019;7(1):177. doi:10.1186/s40425-019-0633-x.
- Formenti SC, Lee P, Adams S, Goldberg JD, Li X, Xie MW, Ratikan JA, Felix C, Hwang L, Faull KF, et al. Focal Irradiation and systemic TGFβ blockade in metastatic breast cancer. Clin Cancer Res. 2018;24(11):2493–2504. doi:10.1158/1078-0432.CCR-17-3322.
- Morris JC, Tan AR, Olencki TE, Shapiro GI, Dezube BJ, Reiss M, Hsu FJ, Berzofsky JA, Lawrence DP, et al. Phase I study of GC1008 (Fresolimumab): a human anti-transforming growth factor-beta (TGFβ) monoclonal antibody in patients with advanced malignant melanoma or renal cell carcinoma. PLoS One. 2014;9(3):e90353. doi:10.1371/journal.pone.0090353.
- Stevenson JP, Kindler HL, Papasavvas E, Sun J, Jacobs-Small M, Hull J, Schwed D, Ranganathan A, Newick K, Heitjan DF, et al. Immunological effects of the TGFβ-blocking antibody GC1008 in malignant pleural mesothelioma patients. Oncoimmunology. 2013;2(8):e26218. doi:10.4161/onci.26218.
- Theilhaber JCJ, Madden SL, Manning C, Cao S, Mankoo P, Pomponio R, Qu H, Malkova N, Shapiro G, Winter C, et al. . Abstract 5550: translational biomarkers for SAR439459, an anti-TGFβ antibody for cancer immunotherapy. . Proceedings: AACR Annual Meeting 2018. Chicago, IL 2018.
- Theilhaber J, Rakhade SN, Sudhalter J, Kothari N, Klein P, Pollard J, Jensen FE. Gene expression profiling of a hypoxic seizure model of epilepsy suggests a role for mTOR and Wnt signaling in epileptogenesis. PLoS One. 2013;8(9):e74428. doi:10.1371/journal.pone.0074428.
- Becht E, Giraldo NA, Lacroix L, Buttard B, Elarouci N, Petitprez F, Selves J, Laurent-Puig P, Sautès-Fridman C, Fridman WH. Estimating the population abundance of tissue-infiltrating immune and stromal cell populations using gene expression. Genome Biol. 2016;17(1):218. doi:10.1186/s13059-016-1070-5.
- Bellone G, Aste-Amezaga M, Trinchieri G, Rodeck U. Regulation of NK cell functions by TGF-beta 1. J Immunol. 1995;155:1066–1073.
- Trapnell C, Cacchiarelli D, Grimsby J, Pokharel P, Li S, Morse M, Lennon NJ, Livak KJ, Mikkelsen TS, Rinn JL. The dynamics and regulators of cell fate decisions are revealed by pseudotemporal ordering of single cells. Nat Biotechnol. 2014;32:381–386. doi:10.1038/nbt.2859.
- Macosko EZ, Basu A, Satija R, Nemesh J, Shekhar K, Goldman M, Tirosh I, Bialas A, Kamitaki N, Martersteck E. Highly Parallel Genome-wide Expression Profiling of Individual Cells Using Nanoliter Droplets. Cell. 2015;161:1202–1214. doi:10.1016/j.cell.2015.05.002.
- Tirosh I, Izar B, Prakadan SM, Wadsworth MH 2nd, Treacy D, Trombetta JJ, Rotem A, Rodman C, Lian C, Murphy G. Dissecting the multicellular ecosystem of metastatic melanoma by single-cell RNA-seq. Science. 2016;352(6282):189–196. doi:10.1126/science.aad0501.
- Hugo W, Zaretsky JM, Sun L, Song C, Moreno BH, Hu-Lieskovan S, Berent-Maoz B, Pang J, Chmielowski B, Cherry G. Genomic and transcriptomic features of response to anti-PD-1 therapy in metastatic melanoma. Cell. 2016;165(1):35–44. doi:10.1016/j.cell.2016.02.065.
- Sade-Feldman M, Yizhak K, Bjorgaard SL, Ray JP, de Boer CG, Jenkins RW, Lieb DJ, Chen JH, Frederick DT, Barzily-Rokni M. Defining T cell states associated with response to checkpoint immunotherapy in melanoma. Cell. 2018;175(4):998–1013 e20. doi:10.1016/j.cell.2018.10.038.
- Anti-TGF-Beta antibodies and their uses. WO 2018/134681 A1 2018
- Moulin A, Mathieu M, Lawrence C, Bigelow R, Levine M, Hamel C, Marquette J-P, Le Parc J, Loux C, Ferrari P. Structures of a pan-specific antagonist antibody complexed to different isoforms of TGFβ reveal structural plasticity of antibody-antigen interactions. Protein Sci. 2014;23(12):1698–1707. doi:10.1002/pro.2548.
- Bai X, Yi M, Jiao Y, Chu Q, Wu WK. Blocking TGF-β signaling to enhance the efficacy of immune checkpoint inhibitor. Onco Targets Ther. 2019;12:9527–9538. doi:10.2147/OTT.S224013.
- Thorsson V, Gibbs DL, Brown SD, Wolf D, Bortone DS, Ou Yang TH, et al. The immune landscape of cancer. Immunity. 2018;48:812–30 e14.
- Zhang L, Conejo-Garcia JR, Katsaros D, Gimotty PA, Massobrio M, Regnani G, Makrigiannakis A, Gray H, Schlienger K, Liebman MN. Intratumoral T cells, recurrence, and survival in epithelial ovarian cancer. N Engl J Med. 2003;348(3):203–213. doi:10.1056/NEJMoa020177.
- Fransen MF, Schoonderwoerd M, Knopf P, Camps MG, Hawinkels LJ, Kneilling M, van Hall T, Ossendorp F. Tumor-draining lymph nodes are pivotal in PD-1/PD-L1 checkpoint therapy. JCI Insight. 2018;3(23). doi:10.1172/jci.insight.124507.
- Lan Y, Zhang D, Xu C, Hance KW, Marelli B, Qi J, Yu H, Qin G, Sircar A, Hernández VM. Enhanced preclinical antitumor activity of M7824, a bifunctional fusion protein simultaneously targeting PD-L1 and TGF-β. Sci Transl Med. 2018;10(424):eaan5488. doi:10.1126/scitranslmed.aan5488.
- Dodagatta-Marri E, Meyer DS, Reeves MQ, Paniagua R, To MD, Binnewies M, Broz ML, Mori H, Wu D, Adoumie M. α-PD-1 therapy elevates Treg/Th balance and increases tumor cell pSmad3 that are both targeted by α-TGFβ antibody to promote durable rejection and immunity in squamous cell carcinomas. J Immunother Cancer. 2019;7(1):62. doi:10.1186/s40425-018-0493-9.
- Thomas DA, Massague J. TGF-β directly targets cytotoxic T cell functions during tumor evasion of immune surveillance. Cancer Cell. 2005;8(5):369–380. doi:10.1016/j.ccr.2005.10.012.
- Terabe M, Robertson FC, Clark K, De Ravin E, Bloom A, Venzon DJ, Kato S, Mirza A, Berzofsky JA. Blockade of only TGF-β 1 and 2 is sufficient to enhance the efficacy of vaccine and PD-1 checkpoint blockade immunotherapy. Oncoimmunology. 2017;6(5):e1308616. doi:10.1080/2162402X.2017.1308616.
- Aqbi HF, Wallace M, Sappal S, Payne KK, Manjili MH. IFN-gamma orchestrates tumor elimination, tumor dormancy, tumor escape, and progression. J Leukoc Biol. 2018. doi:10.1002/JLB.5MIR0917-351R.
- Ni L, Lu J. Interferon gamma in cancer immunotherapy. Cancer Med. 2018;7:4509–4516. doi:10.1002/cam4.1700.
- Calzascia T, Pellegrini M, Hall H, Sabbagh L, Ono N, Elford AR, Mak TW, Ohashi PS. TNF-alpha is critical for antitumor but not antiviral T cell immunity in mice. J Clin Invest. 2007;117:3833–3845. doi:10.1172/JCI32567.
- Fisher DT, Appenheimer MM, Evans SS. The two faces of IL-6 in the tumor microenvironment. Semin Immunol. 2014;26(1):38–47. doi:10.1016/j.smim.2014.01.008.
- Jiao S, Subudhi SK, Aparicio A, Ge Z, Guan B, Miura Y, Sharma P. Differences in tumor microenvironment dictate T helper lineage polarization and response to immune checkpoint therapy. Cell. 2019;179(5):1177–90 e13. doi:10.1016/j.cell.2019.10.029.
- Holmgaard RB, Schaer DA, Li Y, Castaneda SP, Murphy MY, Xu X, Inigo I, Dobkin J, Manro JR, Iversen PW. Targeting the TGFbeta pathway with galunisertib, a TGFbetaRI small molecule inhibitor, promotes anti-tumor immunity leading to durable, complete responses, as monotherapy and in combination with checkpoint blockade. J Immunother Cancer. 2018;6:47. doi:10.1186/s40425-018-0356-4.
- Anderton MJ, Mellor HR, Bell A, Sadler C, Pass M, Powell S, Steele SJ, Roberts RRA, Heier A. Induction of heart valve lesions by small-molecule ALK5 inhibitors. Toxicol Pathol. 2011;39(6):916–924. doi:10.1177/0192623311416259.
- Lacouture ME, Morris JC, Lawrence DP, Tan AR, Olencki TE, Shapiro GI, Dezube BJ, Berzofsky JA, Hsu FJ, Guitart J. Cutaneous keratoacanthomas/squamous cell carcinomas associated with neutralization of transforming growth factor β by the monoclonal antibody fresolimumab (GC1008). Cancer Immunol Immunother. 2015;64(4):437–446. doi:10.1007/s00262-015-1653-0.
- Yang Y, Yang HH, Tang B, Wu AML, Flanders KC, Moshkovich N, Weinberg DS, Welsh MA, Weng J, Ochoa HJ. The outcome of TGFβ antagonism in metastatic breast cancer models in vivo reflects a complex balance between tumor-suppressive and proprogression activities of TGFβ. Clin Cancer Res. 2020;26(3):643–656. doi:10.1158/1078-0432.CCR-19-2370.
- Strauss J, Heery CR, Schlom J, Madan RA, Cao L, Kang Z, Lamping E, Marté JL, Donahue RN, Grenga I. Phase I trial of M7824 (MSB0011359C), a bifunctional fusion protein targeting PD-L1 and TGFβ, in advanced solid tumors. Clin Cancer Res. 2018;24(6):1287–1295. doi:10.1158/1078-0432.CCR-17-2653.
- Tolcher AW, Berlin JD, Cosaert J, Kauh J, Chan E, Piha-Paul SA, Amaya A, Tang S, Driscoll K, Kimbung R. A phase 1 study of anti-TGFβ receptor type-II monoclonal antibody LY3022859 in patients with advanced solid tumors. Cancer Chemother Pharmacol. 2017;79(4):673–680. doi:10.1007/s00280-017-3245-5.