
ABSTRACT
Background
Factor (F) V is an essential cofactor in blood coagulation, however, F5 expression in breast tumors has also been linked to tumor aggressiveness and overall survival. The specific role of FV in breast cancer is yet unknown. We therefore aimed at dissecting the biological relevance of FV in breast cancer.
Methods
Gene expression data from a Scandinavian breast cancer cohort (n = 363) and the cancer genome atlas (TCGA) (n = 981) and 12 replication cohorts were used to search for F5 co-expressed genes, followed by gene ontology analysis. Pathological and bioinformatic tools were used to evaluate immune cell infiltration and tumor purity. T cell activation, proliferation and migration were studied in FV treated Jurkat T cells.
Results
F5 co-expressed genes were mainly associated with immune system processes and cell activation. Tumors with high expression of F5 were more infiltrated with both lymphoid (T cells, NK cells, and B cells) and myeloid cells (macrophages and dendritic cells), and F5 expression was negatively correlated with tumor purity (ρ = −0.32). Confirming a prognostic role, data from the Kaplan-Meier plotter showed that high F5 expression was associated with improved relapse-free survival. The strongest association was observed in basal-like breast cancer (HR = 0.55; 95% CI, 0.42–0.71). Exogenous FV did not substantially affect activation, proliferation or migration of human T cells.
Conclusions
F5 was identified as a novel marker of immune cell infiltration in breast cancer, and the prognostic role of F5 was verified. FV emerge as an interesting immunological biomarker with potential therapeutic relevance for the cancer-inflammation-thrombosis circuit.
Background
The presence of cancer is commonly associated with coagulation abnormalities, resulting in a several-fold increased risk of thrombosis in cancer patients compared to the general population.Citation1,Citation2 Moreover, growing experimental evidences support an association between coagulation and tumor progression. A deeper understanding of the biological aspects connecting coagulation and cancer opens for the development of novel treatment strategies that may reduce both the tumor burden and the risk of thrombosis. Components of the tissue factor (TF) pathway (TF, FVIIa, FXa) have increasingly been shown to promote tumor progression and metastasis, mainly through activation of protease activated receptor 2 (PAR2) Citation3 The functional role of factor (F) V in cancer, however, has not yet been characterized.
FV is a critical player in blood coagulation that exerts both procoagulant and anticoagulant properties. In its procoagulant state, activated FV (FVa) serves as a cofactor to FXa in the generation of thrombin, while in its anticoagulant state FV contributes to the inactivation of FVIIIa and FVa by activated protein C (APC).Citation4 The complexity of the 330 kDa large FV molecule is reflected by the fact that mutations in the gene encoding FV (F5) can lead to both thrombosis and bleeding.Citation4 Besides the important role in regulating blood coagulation, alternative roles of FV are emerging. FV was recently demonstrated to be an essential anti-inflammatory cofactor for APC in the inhibition of TF-mediated PAR2 signaling in sepsis.Citation5 Moreover, we have shown that genetic variants in the F5 gene are associated with breast cancer susceptibility,Citation6 and we recently demonstrated that the expression of F5 is increased in breast tumors compared to normal tissue.Citation7 F5 expression was also linked to breast cancer aggressiveness and overall survival.Citation7 Because FV is a circulating protein principally synthesized by the liver, its expression in breast tumors suggests a yet undiscovered role for FV in cancer pathogenesis.
Here, we aimed at exploring the possible biological relevance of FV in breast cancer using a genome-wide co-expression approach followed by gene annotation. Genes co-expressed with F5 in breast tumors were associated with immune system processes and activation of immune cells. Accordingly, tumors with high F5 expression were more infiltrated with lymphocytes, including multiple T cell lineages. We also found that F5 was associated with improved relapse-free survival. FV emerge as an interesting candidate with potential therapeutic relevance for the cancer-inflammation – thrombosis circuit.
Materials and methods
The breast cancer cohorts
Discovery cohorts
The primary study cohort comprised 363 primary operable (cT1-cT2) female breast cancer patients of Scandinavian descent (hereafter referred to as the Scandinavian breast cancer cohort) enrolled between June 2008 and August 2010 at the Oslo University Hospital Ullevål, Oslo, and the Akershus University Hospital, Nordbyhagen, Norway.Citation7 All patients have given their written informed consent to participate in the study. Log2-transformed mRNA expression data from tumors were obtained using the SurePrint G3 Human GE 8x60K one-color microarray (Agilent Technologies) as previously described.Citation8
The second discovery cohort was the breast cancer cohort (n = 981 excluding normal controls) from the cancer genome atlas (TCGA).Citation9 The cBioPortal online toolCitation10,Citation11 was used to access the RNA-seq data from breast tumors. Gene expression levels were measured as Transcripts per million reads.
Replication cohorts
The following breast cancer data sets with tumor transcriptomic data, downloaded from the Gene Expression Omnibus (GEO) database, were used as replication cohorts; GSE11121 (MAINZ), EGAD00010000210 (METABRIC), GSE19536 (MicMa), E-MTAB-4439 (NeoAva), GSE1456 (STK), GSE20685 (TAI), GSE3494 (UPP), GSE2034/GSE5327 (VDX), GSE4922 (UPSA), GSE20711 (PNC), E-TABM-158 (CAL), and NCT02306096 (SCAN-B) (Additional file 1: Table S1).
Genome-wide co-expression analysis and gene annotation
Pairwise gene correlations between F5 and other genes were performed using the Spearman correlation method. Spearman ρ, nominal P-values and false discovery rates (FDR) were reported.
Gene lists were annotated according to biological relevance (gene ontology; GOTERM_BP_DIRECT) using the Functional Annotation Clustering function in DAVID (https://david.ncifcrf.gov/).Citation12,Citation13 The enriched gene ontology (GO) terms with P < .00001 and a minimum of 4 genes within each term were reported. Overlapping and redundant GO terms were clustered using REVIGO.Citation14 A semantic similarity (SimRel) cutoff of 0.4 was used to define representative terms.
Web-based bioinformatic analyses
The Gene expression based Outcome for Breast cancer Online (GOBO) database is a web-based tool for gene expression analyses of a merged 1881-sample breast tumor data set of 11 independent datasets,Citation15 all generated on Affymetrix U133A microarrays. The two F5 specific probe sets (204713_s_at and 204714_s_at) yielded similar results and the expression data of the two probe sets were therefore averaged. F5 tumor expression was correlated to the module activity score of the following predefined cancer-specific transcriptional programs (gene modules); stroma, lipid metabolism, immune response, mitotic checkpoint, mitotic progression (M-phase), basal, early response, and steroid response.Citation16
To study the effect of F5 tumor expression on relapse-free survival in breast cancer we used the Kaplan-Meier plotter database (https://kmplot.com/analysis/).Citation17 Only the Affymetrix HG-U133A and HG-U133 Plus 2.0 microarrays are included, which are nearly identical platforms. Data are MAS5 normalized in R and a second scaling normalization to set the average expression on each chip to 1,000 is performed to avoid batch effects. The average expression of the 204713_s_at and 204714_s_at probe sets was used and the breast cancer cohort was dichotomized into two groups according to the median F5 expression for Kaplan–Meier analysis of 10‐year relapse-free survival. The log‐rank test was performed to assess the significance in relapse-free survival between the two groups. The number of months at which 75% of the patients in each group survived (upper quartile survival) was also reported. The individual breast cancer datasets included in the analysis are listed in Additional file 2: Table S2.
To study if F5 was an independent predictor of relapse-free survival we used GOBO database.Citation15 The availability of clinical data is described in Ringner et alCitation15 The Gene Set Analysis application in GOBO allowed for multivariate Cox proportional hazards regression analyses to account for covariates with potential effects on survival. The individual breast cancer datasets included in the analysis are listed in Additional file 2: Table S2.
We used the TCGA cohort to study the effect of F5 mutation status on survival of breast cancer patients. Mutation data from whole exome sequencing was derived from the cBioPortal.Citation10,Citation11 Kaplan–Meier analysis of 10‐year survival was performed and the log‐rank test was applied to assess any significance in relapse-free survival between patients with mutated F5 (≥1 missense mutations) and non-mutated F5 (wild type).
We used the Tumor Immune Estimation Resource (TIMER) web tool (https://cistrome.shinyapps.io/timer/)Citation18 to investigate the correlation (Spearman) between F5 gene expression and tumor purity (the percentage of tumor cells in the tumor tissue) and selected gene markers of tumor-infiltrating immune cells.Citation19 TIMER is based on TCGA data and the Breast Invasive Carcinoma population was selected.
Tumor infiltrating lymphocyte assessment
Tumors from the Scandinavian breast cancer cohort were used (n = 44) and two frozen sections per patient were H-E stained. Using a light microscope, slides were examined and scored for tumor cells (%), lymphocytes (%), stroma (%), adipose tissue (%) and normal epithelium (%) by two experienced pathologists. The average scores for the two slides per patient were used. A cutoff value of 20% was used to differentiate between high (≥ 20%) and low (< 20%) lymphocyte infiltration.Citation20,Citation21
Gene expression-based analysis of immune cell composition
We applied CIBERSORT (https://cibersort.stanford.edu/)Citation22 to estimate the relative proportions of 22 subsets of leukocytes in the tumors of the discovery cohorts. The analysis was performed with 100 permutations. CIBERSORT derived a P-value for the accuracy of the deconvolution and only patients with a P-value <0.05 were included in the analysis. The patient data were split into two groups according to high (>3rd quartile) or low (<3rd quartile) F5 expression and the relative fractions of leukocyte subsets were compared between the two groups using the Mann-Whitney U test. (Similar results were obtained when the median F5 expression was used as cutoff for low and high F5 expression.)
T cell activation, proliferation, and migration
Jurkat E6-1 T-cells (ATCC® TIB-152™), which express CD3 and a number of T-cell receptors typical of peripheral CD4+ blood cells (Dong et al., 1999), were grown in ATCC modified RPMI 1640 (Cat. no A1049101, Gibco) supplemented with 10% FBS, in a humidified atmosphere at 37°C with 5% O2 level. Cells were seeded in serum-free media in non-treated 48 well plates (3*10^5 cells per well) and stimulated with 7 µg/mL human recombinant FV (HCV-0100, Hematologic Technologies, Essex, USA) or control (50% (vol/vol) glycerol/H2O) for 24 hours at 37°C. The T cell mitogen Phytohemagglutinin (PHA) (Cat. no HA15/30852701, ThermoFisherSci) was used as a positive control for T cell activation. Cells were pelleted for 10 min at 1200 rpm and 4°C and washed 1X with cold PBS before blocked with 10 µL FcR blocking Reagent (human, Cat. No 130–059-901, Milenyi Biotec) in flow buffer (PBS with 0.5% BSA and 2 mM EDTA) for 10 min at room temperature. Cells were incubated with FITC-conjugated antibodies; mouse anti-human CD69 specific antibody (Cat.no 11–0699-41, ThermoFisherSci) and mouse IgG1 kappa isotype control antibody (Cat.no 11–4714-41, ThermoFisherSci) in flow buffer at a final concentration of 0.6 ng/µL for 10–30 min at 4°C. Cells were pelleted and resuspended in flow buffer before flow cytometry analysis was performed on MACS flow cytometer (Miltenyi Biotec). Flow data were analyzed using Flow Jo (Tree Star, Inc., Ashland, OR).
To measure T cell proliferation (cell viability) Jurkat E6-1 cells (2*10^4) were seeded in 96-well plates and incubated at 37°C in the presence of 7 µg/mL human FV or 50% (vol/vol) glycerol/H2O as control. After 24, 48, and 72 hours the tetrazolium salt WST-1 (Roche) was added and cells were incubated for 1 hour at 37°C. WST-1 was reduced by viable cells to a formazan dye which was read at 450 nm and 745 nm as the reference wavelength using a VersaMax™ microplate reader (Molecular Devices). WST-1 determines cell viability and is an indirect measure of cell proliferation.
To evaluate migration, Jurkat E6-1 cells were starved overnight in RPMI medium with 0.5% FBS. 1.25*10^5 cells in 50 µl of medium were seeded into the upper chambers of transwell inserts with 5.0 μm pore size membranes (96 well plate, Costar, Corning Incorporated, NY, USA). Starvation medium containing 7 µg/mL human FV was added to the lower chambers. CXCL12 (350-NS-010, R&D, Minneapolis, USA) was used as a positive control. Cells were allowed to migrate for 24 hours at 37°C. The number of cells that migrated into the lower chambers was counted using the NC-100 Nucleocounter (Chemometec, Allerod, Denmark).
Protein detection of FV in normal breast tissue and breast tumors
Immunohistochemistry (IHC) staining was used to detect FV antigen in formalin‐fixed paraffin‐embedded (FFPE) sections of breast cancer tissue (with adjacent normal tissue). The staining procedure has been described previously.Citation7 FV positivity was defined as moderate to strong coarse/granular cytoplasmic staining.
Results
Identification and annotation of genes co-expressed with F5 in breast tumors
We used a gene co-expression approach followed by gene annotation to identify possible roles of FV in breast cancer biology. In the two discovery cohorts, we determined the pairwise gene correlations between F5 expression and the expression of all other genes. Summary statistics are shown in Additional file 3: Table S3.
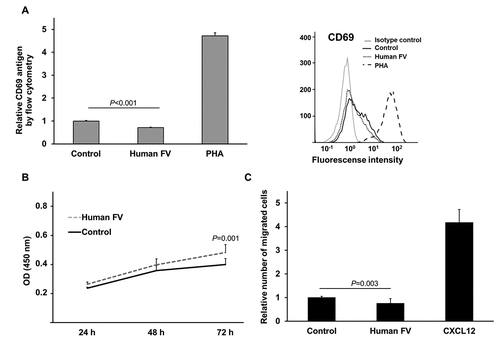
We further focused on the top 100 genes that were co-expressed with F5 (), all of which were positively correlated with Spearman ρ values 0.5 to 0.7 and P < 6.9*10−19. 58 genes were shared between the two discovery cohorts. Gene set enrichment analysis using gene ontology (GO) terms revealed that the F5 co-expressed genes were mainly associated with immune system processes in both cohorts (Additional file 4: Table S4). Clustering of redundant GO terms resulted in eight and seven representative GO terms in the Scandinavian cohort and the TCGA cohort, respectively (blue bars in ). Five of these terms were common to both cohorts; positive regulation of immune system process (GO:0002684), cell activation (GO:0001775), defense response (GO:0006952), cell surface receptor signaling pathway (GO:0007166), and cellular defense response (GO:0006968). Positive regulation of immune system process (GO:0002684) and cell activation (GO:0001775) were the most significant biological terms in both cohorts. Cell activation (GO:0001775) was the representative term for a cluster of redundant, but more specific terms related to differentiation, activation, and proliferation of immune cells, including T lymphocytes (gray bars ). We experimentally tested if FV could be directly involved in T cell activation and/or proliferation. Using Jurkat T cells as a model we found that exogenous FV did not induce, but rather slightly reduced the surface expression of the T cell activation marker CD69 (). Furthermore, FV had no major effect on T cell proliferation (). Pairwise gene correlations between F5 expression and the tumor transcriptome followed by gene set enrichment analysis of the top 100 correlated genes was replicated in 12 independent breast cancer cohorts. Many of the top 100 genes in the replication cohorts were the same as in the discovery cohorts and gene set enrichment analysis verified the association with immune response processes in each cohort. Significant GO terms and corresponding genes are shown in Additional file 5: Table S5.
Table 1. Top 100 genes co-expressed with F5 in tumors of the Scandinavian breast cancer cohort and the TCGA breast cancer cohort.
Figure 1. GO analysis of the F5 co-expressed genes in breast tumors.
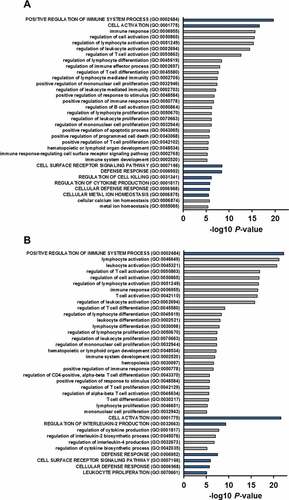
Figure 2. T cell activation marker CD69 levels, WST-1 proliferation analysis and cell migration of FV treated Jurkat T cells.
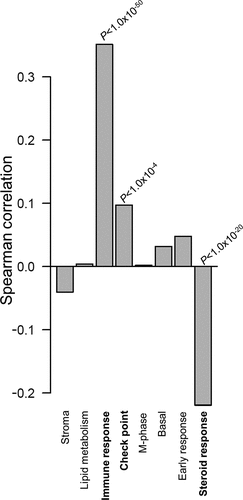
Complementing the co-expression analysis above, we used the GOBO online tool to investigate if F5 tumor expression was associated with any of the previously identified (breast) cancer-specific transcriptional programs.Citation24 Correlation analysis revealed that F5 tumor expression was associated with three (out of eight) co-expressed gene modules (). F5 expression was weakly, but positively correlated to the check point module (ρ ~ 0.1, P < 1.0x10⁻⁴) and negatively correlated to the steroid response module (ρ~-0.2, P < 1.0x10⁻²⁰). However, the strongest association was the positive correlation between F5 expression and the immune response module (ρ > 0.3, P < 1.0x10−50) (). Spearman ρ values for the correlation between F5 and the individual genes in this immune response module are provided in Additional file 6: Table S6.
Figure 3. Correlations between F5 tumor expression and breast cancer specific gene modules.
F5 expression and tumor-infiltrating immune cells and tumor purity
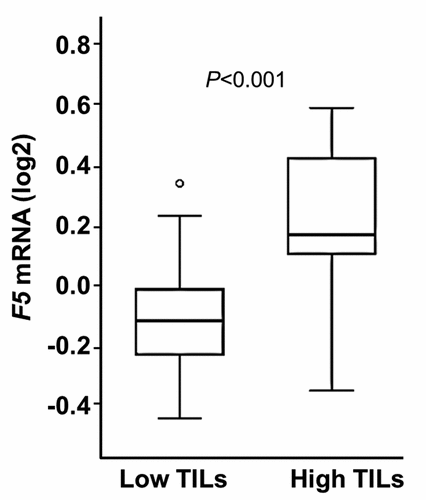
Since gene co-expression does not necessarily imply causation we assessed if the association between F5 expression and immune response could be linked to the number of tumor infiltrating immune cells. Pathological evaluation of a selection of tumors (n = 44) from the Scandinavian breast cancer cohort clearly demonstrated that F5 expression levels were higher in tumors with a high degree of tumor infiltrating lymphocytes (TILs) compared to tumors with low TIL levels (). Accordingly, F5 expression and TIL levels correlated with ρ = 0.38 and P = .012. We also examined if F5 expression was associated with TILs in each molecular subgroup. We found that F5 expression was higher in tumors with higher TIL levels in basal-like tumors (P = .037) (Additional file 7: Figure S1).
Figure 4. F5 tumor expression according to the degree of TILs.
Furthermore, we used CIBERSORT to estimate the relative levels of subsets of tumor-associated leukocytes according to high and low F5 tumor expression. In the Scandinavian breast cancer cohort, high expression of F5 was associated with increased abundance of M1 macrophages, M0 macrophages, gamma delta T cells, and activated CD4 memory T cells, while the abundance of resting CD4 memory T cells was higher in the tumors with low F5 expression (). Selecting these five cell types, we conducted additional analysis in each molecular subtype. We found that high F5 expression was associated with increased abundance of gamma delta T cells in basal-like tumors, and with activated CD4 memory T cells, M1 macrophages, and M0 macrophages in luminal A tumors (Additional file 8: Figure S2). No significant associations were found in HER2 or luminal B tumors.
Figure 5. Tumor abundance of subsets of leukocytes according to F5 expression.
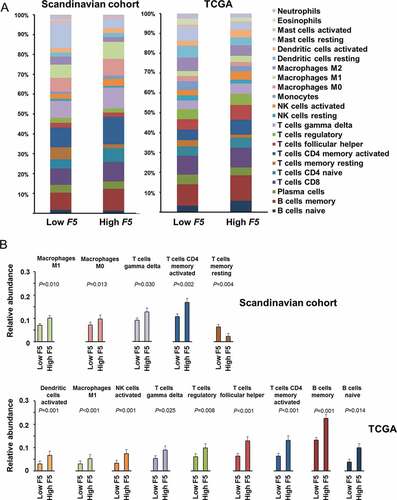
In the TCGA cohort, high expression of F5 was associated with increased abundance of activated dendritic cells, M1 macrophages, natural killer (NK) cells, gamma delta T cells, regulatory T (Treg) cells, follicular helper T cells, activated CD4 memory T cells, memory B cells, and naïve B cells. Selecting these nine cell types, we conducted additional analysis in each molecular subtype. We found that high F5 expression was associated with increased abundance of activated dendritic cells and naïve B cells in basal-like tumors, and with follicular helper T cells and memory B cells in luminal A tumors, and with macrophages M1, activated NK cells, gamma delta T cells, regulatory T cells, and follicular helper T cells in luminal B tumors (Additional file 9: Figure S3).
To further confirm the association between F5 and the tumor infiltrating immune cells identified above, we determined the correlation between F5 expression and gene markers of immune cells via the TIMER algorithm. Results revealed that F5 correlated with most immune cell markers (). Equivalent analysis in the molecular subgroups revealed a similar correlation pattern across the subgroups of basal-like, HER2, and luminal tumors (Additional file 10: Figure S4).
Table 2. Correlations between F5 and gene markers of immune cells in the TCGA Breast cancer population in TIMER18.
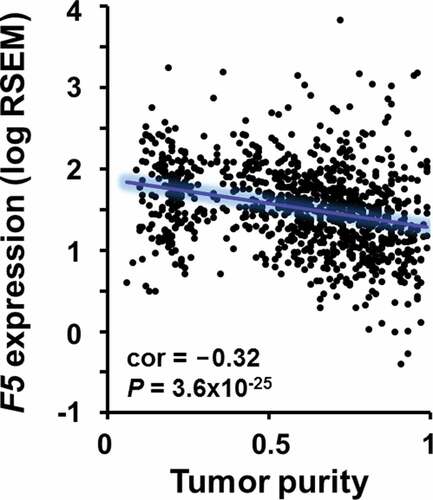
Because of the association between tumor-infiltrating immune cells and F5 expression ( and ), we tested whether FV could affect tumor lymphocyte recruitment in a transwell migration assay. Physiological levels (i.e., plasma concentration) of FV did not induce migration of Jurkat T cells (). Rather, a small reduction in migration was observed in the presence of FV. Next, we used TIMER to determine the correlation between F5 expression and tumor purity in TCGA breast tumors. We found a significant negative correlation between F5 expression and the overall proportion of cancer cells (tumor purity) (ρ = −0.32, P = 3.6x10⁻²⁵) (). Since genes highly expressed by tumor cells are expected to positively correlate with tumor purity, while the opposite is expected for genes expressed in the tumor microenvironment, this result suggests that immune and/or stromal cells might contribute to the expression of F5 in the bulk tumor.
Figure 6. Correlation between F5 tumor expression and tumor purity in breast cancer.
Prognostic value of F5 expression in breast cancer
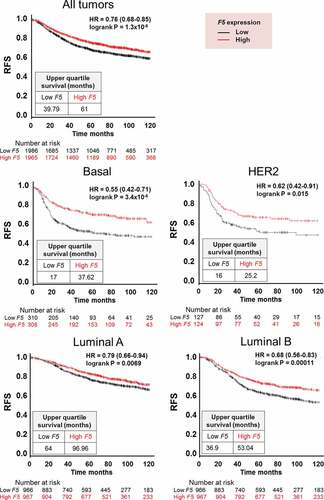
To determine the prognostic value of tumor‐expressed F5, we investigated if F5 expression was associated with relapse-free survival in breast cancer patients using the Kaplan-Meier plotter database. Irrespective of tumor subtype, high F5 expression was associated with increased relapse-free survival (HR = 0.76; 95% CI, 0.68–0.85; P = 1.3*10−6) (). Patients with high F5 expression survived longer with an upper quartile survival time of 61 months compared to 40 months for patients with low F5 expression. Stratified by molecular tumor subtypes, the strongest association between F5 expression and relapse-free survival was found in patients with basal-like tumors (HR = 0.55; 95% CI, 0.42–0.71; P = 3.4*10−6), followed by HER2 enriched tumors (HR = 0.62; 95% CI, 0.42–0.91; P = .015), luminal B tumors (HR = 0.68; 95% CI, 0.56–0.83; P = .00011), and luminal A tumors (HR = 0.79; 95% CI, 0.66–0.94; P = .0069) ().
Figure 7. Relapse-free survival in breast cancer patients stratified by F5 expression in tumors.
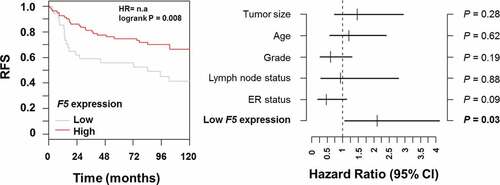
Using data from GOBO,Citation15 we found that F5 tumor expression was an independent prognostic indicator of relapse-free survival only in patients with basal-like tumors when adjusted for the effects of tumor size, age, histological tumor grade, lymph node status and estrogen receptor (ER) status (P = .03) (). The hazard ratio for low F5 expression was 2.1 (95% CI, 1.1–4.1) compared with high F5 expression.
Figure 8. Multivariate analysis of relapse-free survival in breast cancer patients stratified by F5 expression in tumors.
We also examined the effect of F5 mutations on survival of the breast cancer patients in the TCGA cohort. Only 1.8% of the patients had F5 (missense) mutations, and there was no association with relapse free survival (Additional File 11: Figure S5).
IHC staining of FV in normal breast tissue and breast tumors
We have previously confirmed the presence of FV antigen in breast tumors of the Scandinavian breast cancer cohort.Citation7 Here, we evaluated the FV staining of adjacent normal breast tissue, using the same specimens. Positive FV staining was only observed in the normal myoepithelial cell layer (10%-90% positive cells). The normal luminal cells, however, exhibited a weak diffuse staining and were considered FV negative in all normal tissue specimens (Additional File 12: Figure S6). These results support the previous mRNA data that showed higher F5 expression in breast tumors compared to normal breast tissue.Citation7
Discussion
The hemostatic system is involved in multiple aspects of cancer pathogenesis, and therapeutic intervention targeting hemostatic factors have the potential to impede cancer progression. While certain factors of the tissue factor pathway have increasingly been shown to be involved in cancer progression, the role of FV in cancer has not been extensively studied. However, supporting a cancer relevant role of FV, we previously showed that F5 genetic variants were associated with breast cancer and that F5 expression was enriched in breast tumors and was associated with overall survival.Citation6,Citation7
To further investigate the possible underlying cause of the association between F5 tumor expression and breast cancer survival, we identified genes with a similar expression pattern as F5 (co-expressed genes) in tumors of breast cancer patients. Gene ontology analysis of these genes showed a striking association with immune response processes. This finding is very interesting since regulation of innate immune function has been emphasized as one important means by which the hemostatic system is coupled to cancer biology.Citation25 Moreover, immune-related gene signatures have been associated with a more favorable prognosis within aggressive breast cancer subtypes, such as basal-like tumors.Citation24,Citation26,Citation27 We therefore speculate if the association between F5 tumor expression and increased survival in breast cancer could be related to an immunogenic effect.
The gene ontology analysis indicated that FV could be involved in T cell activation and proliferation. However, since cell experiments indicated otherwise, we investigated if FV could be linked to the immune cell composition in breast tumors. Accumulating evidences show that tumor-infiltrating immune cells can promote or suppress cancer progression, and the prognostic and predictive value depends on the composition and density of the tumor-infiltrating cells.Citation28,Citation29 In this study, pathological evaluation of tumor tissue revealed that F5 expression was increased in tumors with high immune cell content. Furthermore, in silico deconvolution of immune cell type signatures showed that F5 was associated with higher abundance of both tumor promoting cells (e.g., CD4 T-helper 1 cells, NK cells, and mature dendritic cells) and tumor suppressive cells (e.g., M1 macrophages and Treg cells).Citation30 The role of B cells and gamma delta T cells in the tumor microenvironment is less understood.Citation31,Citation32 We also investigated the association between immune cell types and F5 expression in the molecular subtypes. According to the in silico deconvolution of immune cell type signatures there was no consensus between the Scandinavian and the TCGA cohort. However, these findings could be arbitrary due to small sample sizes within each subgroup. Results should therefore be interpreted with some caution. On the other hand, a similar correlation pattern was found in the different molecular subgroups when F5 expression was correlated to the expression of immune cell gene markers. This suggests that the association between F5 expression and immune cells is subtype independent.
The above findings could suggest that FV may be involved in recruiting immune cells to the tumor site, although our cell studies did not directly support this. Moreover, the negative correlation between F5 and tumor purity indicated that also non-cancerous cells might contribute to the expression of F5 in the bulk tumor. It is therefore likely that the association between F5 expression and tumor infiltrating immune cells may in part reflect F5 expression by the immune cells themselves. In support of this, data collected from healthy hematopoietic cellsCitation33 showed that F5 is expressed by a selection of immune cells, with the highest expression levels observed in monocytes, T cells, and NK cells. On the other hand, we have previously shown that FV is expressed in breast tumors.Citation7 Which cell compartment, the tumor cells or the immune cells, contributing the most to the F5 expression in the bulk tumor is difficult to resolve and would require comparison at a single cell or population level. Regardless of its origin, F5 expression in breast tumors appears as a promising marker of immune cell infiltration. We acknowledge that among the many genes expressed in breast cancer tissue, FV might not be the most prevailing gene marker of tumor-infiltrating immune cells. A number of cell-specific marker genes indicative of the presence of immune cell populations have been reported.Citation34 Nevertheless, the finding that FV is related to immune-infiltrate levels in breast cancer provides a direction for further research to tighten the triangular link between cancer-coagulation-inflammation. This work therefore adds useful knowledge to the hemostasis/immunity interface in cancer, which may ultimately lead to the development of improved treatment strategies.
We note with interest that several types of (normal) immune cells express F5.Citation33 This opens the opportunity for targeting coagulation complications in cancer via immune cells. Coagulation proteases such as thrombin, the TF-FVIIa complex, and FXa can activate PARs and modulate innate immune response via toll like receptors.Citation35,Citation36 Recently, one study of sepsis in mice demonstrated that FV was essential for the APC-mediated suppression of inflammatory tissue factor signaling through PAR2.Citation5 The anti-inflammatory function of FV was coagulation-independent and was not supported by the thrombin-activated FV (FVa).Citation5 How the coagulation-inflammation axis influences tumor processes is generally not well-characterized, but studies addressing the issue are emerging. Tumor-expressed protein S was shown to impede M1 macrophage polarization in a murine melanoma model,Citation37 and FX was recently shown to be expressed by macrophages in mouse and human tumors.Citation38 Interestingly, a direct FXa inhibitor was found to attenuate tumor growth in mice, possibly through modulating the infiltration of CD8 T cells and Treg cells.Citation38 Together, these studies highlight that modification of coagulation pathways have the potential to modify antitumor immunity (tumor immune evasion). A new principle for targeting coagulation via immune cells in cancer may be developed. In an ongoing project, the role of cancer cell and immune cell expressed FV will be functionally and mechanistically studied with particular focus on PAR2 mediated signaling.
Confirming our previous report showing that F5 was predictive of improved overall survival in basal-like breast cancer,Citation7 we also revealed that breast cancer patients with higher tumor expression of F5 displayed longer relapse-free survival. The association with relapse-free survival was independent of breast cancer subtype, demonstrating that the prognostic effect of F5 appears more general than previously thought. This may, however, be owing to the higher number of patients in the relapse-free survival analysis. Supporting the previous overall survival analysis, the difference in relapse-free survival between high and low F5 expression was noticeably larger (lower HR) in the basal-like breast cancer compared to the other molecular subgroups. Moreover, multivariate survival analysis showed that F5 was an independent prognostic marker in basal-like tumors only. Together, these findings underline that F5 is a prognostic biomarker with a possible tumor suppressor role in breast cancer, especially in basal-like breast cancer. Interestingly, a single study recently reported that F5 expression predicted poor survival in gastric cancer.Citation39 This contradictory result may suggest that FV exerts pleiotropic effects depending on cancer type. However, it should also be taken into account that different gene expression arrays were used in the gastric cancer study and our study.
A few shortcomings should be pointed out. Firstly, the findings in this study are based on transcriptional data and future studies addressing proteomic data would therefore complement the results. Secondly, Jurkat is an immortalized leukemia cell line with constitutive activation of the PI3K/Akt pathway.Citation40 Normal primary T cells could potentially respond differently. On the other hand, our objective is not necessarily to evaluate normal/vascular T cells. The primary goal is to study how FV affects T cells from breast cancer in a tumor context, but this is yet unavailable. Thirdly, since cell culture studies cannot recreate the tumor complexity, the behavior of FV could be different in the presence of known or yet unknown FV interaction partners possibly present in the tumor microenvironment.
Conclusions
In summary, our data show that FV is a novel marker of tumor-infiltrating immune cells in breast cancer. We also verified that FV is a marker of breast cancer prognosis. FV emerge as an interesting immunological biomarker with potential therapeutic relevance for the cancer-inflammation-thrombosis circuit. Experimental studies of FV in breast cancer cells were beyond the scope of this study, but the functional and mechanistic involvement of FV in breast cancer will be determined in a follow-up study.
Abbreviations
F: factor; TCGA: the cancer genome atlas; ELISA; enzyme-linked immunosorbent assay; WST-1: Water Soluble Tetrazolium Salt-1; H-E staining: hematoxylin and eosin staining; HR: hazard ratio; APC: activated protein C; TF: tissue factor; PAR: protease activated receptor; GEO: Gene Expression Omnibus; FDR: false discovery rate; GO: gene ontology; PHA: phytohaemagglutinin; IL-2: interleukin-2; NK cells: natural killer cells; Treg cells: regulatory T cells
Addendum
M Tinholt designed the study, analyzed and interpreted the data, performed in vitro experiments, and wrote the paper. B Stavik substantially contributed to the in vitro experiments. X Tekpli conducted statistical analyses and interpreted the data. E Borgen and Ø Garred performed the pathological evaluation of tumors. V Kristensen, K.K. Sahlberg, and N Iversen participated in the acquisition of the data. P.M. Sandset and N Iversen conceived the project. N Iversen designed and supervised the project. B Stavik, X Tekpli, E Borgen, Ø Garred, V Kristensen, K.K. Sahlberg, P.M. Sandset, and N Iversen critically revised the intellectual content of the paper. All authors read and approved the final manuscript.
Disclosure of interest
The authors declare that they have no competing interests.
Supplemental Material
Download ()Acknowledgments
We would like to thank Oslo Breast Cancer Consortium (OSBREAC) for providing patient samples (http://breastcancerresearch.no/osbreac/), Eldri Undlien Due for tumor preparation, and Elsa Beraki for IHC staining.
Supplementary material
Supplemental data for this article can be accessed on the publisher’s website.
Additional information
Funding
References
- Lee AY, Levine MN. Venous thromboembolism and cancer: risks and outcomes. Circulation. 2003;107:117–12. doi:10.1161/01.CIR.0000078466.72504.AC.
- Gran OV, Smith EN, Braekkan SK, Jensvoll H, Solomon T, Hindberg K, Wilsgaard T, Rosendaal FR, Frazer KA, Hansen JB. Joint effects of cancer and variants in the factor 5 gene on the risk of venous thromboembolism. Haematologica. 2016;101:1046–1053. doi:10.3324/haematol.2016.147405.
- Falanga A, Marchetti M, Vignoli A. Coagulation and cancer: biological and clinical aspects. J Thromb Haemost. 2013;11:223–233. doi:10.1111/jth.12075.
- Dahlback B. Pro- and anticoagulant properties of factor V in pathogenesis of thrombosis and bleeding disorders. Int J Lab Hematol. 2016;38(Suppl 1):4–11. doi:10.1111/ijlh.12508.
- Liang HP, Kerschen EJ, Basu S, Hernandez I, Zogg M, Jia S. Coagulation factor V mediates inhibition of tissue factor signaling by activated protein C in mice. Blood. 2015;126:2415–2423. doi:10.1182/blood-2015-05-644401.
- Tinholt M, Viken MK, Dahm AE, Vollan HK, Sahlberg KK, Garred O, et al. Increased coagulation activity and genetic polymorphisms in the F5, F10 and EPCR genes are associated with breast cancer: a case-control study. BMC Cancer. 2014;14:845. doi:10.1186/1471-2407-14-845.
- Tinholt M, Garred O, Borgen E, Beraki E, Schlichting E, Kristensen V. Subtype-specific clinical and prognostic relevance of tumor-expressed F5 and regulatory F5 variants in breast cancer: the CoCaV study. J Thromb Haemost. 2018;16:1347–1356. doi:10.1111/jth.14151.
- Aure MR, Vitelli V, Jernstrom S, Kumar S, Krohn M, Due EU. Integrative clustering reveals a novel split in the luminal A subtype of breast cancer with impact on outcome. Breast Cancer Res. 2017;19:44. doi:10.1186/s13058-017-0812-y.
- The Cancer Genome Atlas Research Network. [accessed 2017 Aug 15]. https://cancergenome.nih.gov/.
- Cerami E, Gao J, Dogrusoz U, Gross BE, Sumer SO, Aksoy BA, et al.. The cBio cancer genomics portal: an open platform for exploring multidimensional cancer genomics data. Cancer Discov. 2012;2:401–404. doi:10.1158/2159-8290.CD-12-0095.
- Gao J, Aksoy BA, Dogrusoz U, Dresdner G, Gross B, Sumer SO, et al. Integrative analysis of complex cancer genomics and clinical profiles using the cBioPortal. Sci Signal. 2013;6:pl1. doi:10.1126/scisignal.2004088.
- Huang da W, Sherman BT, Lempicki RA. Bioinformatics enrichment tools: paths toward the comprehensive functional analysis of large gene lists. Nucleic Acids Res. 2009;37:1–13. doi:10.1093/nar/gkn923.
- Huang da W, Sherman BT, Lempicki RA. Systematic and integrative analysis of large gene lists using DAVID bioinformatics resources. Nat Protoc. 2009;4:44–57. doi:10.1038/nprot.2008.211.
- Supek F, Bosnjak M, Skunca N, Smuc T. REVIGO summarizes and visualizes long lists of gene ontology terms. PLoS One. 2011;6:e21800. doi:10.1371/journal.pone.0021800.
- Ringner M, Fredlund E, Hakkinen J, Borg A, Staaf J. GOBO: gene expression-based outcome for breast cancer online. PLoS One. 2011;6:e17911. doi:10.1371/journal.pone.0017911.
- Fredlund E, Ringner M, Maris JM, Pahlman S. High Myc pathway activity and low stage of neuronal differentiation associate with poor outcome in neuroblastoma. Proc Natl Acad Sci U S A. 2008;105:14094–14099. doi:10.1073/pnas.0804455105.
- Gyorffy B, Lanczky A, Eklund AC, Denkert C, Budczies J, Li Q, et al. An online survival analysis tool to rapidly assess the effect of 22,277 genes on breast cancer prognosis using microarray data of 1,809 patients. Breast Cancer Res Treat. 2010;123:725–731.
- Li T, Fan J, Wang B, Traugh N, Chen Q, Liu JS, et al. TIMER: a web server for comprehensive analysis of tumor-infiltrating immune cells. Cancer Res. 2017;77:e108–e10. doi:10.1158/0008-5472.CAN-17-0307.
- Gil M, Kim KE. Interleukin-18 is a prognostic biomarker correlated with CD8(+) T cell and natural killer cell infiltration in skin cutaneous melanoma. J Clin Med. 2019;8:1993.
- Ruan M, Tian T, Rao J, Xu X, Yu B, Yang W, et al.. Predictive value of tumor-infiltrating lymphocytes to pathological complete response in neoadjuvant treated triple-negative breast cancers. Diagn Pathol. 2018;13:66. doi:10.1186/s13000-018-0743-7.
- Tian T, Ruan M, Yang W, Shui R. Evaluation of the prognostic value of tumor-infiltrating lymphocytes in triple-negative breast cancers. Oncotarget. 2016;7:44395–44405. doi:10.18632/oncotarget.10054.
- Newman AM, Liu CL, Green MR, Gentles AJ, Feng W, Xu Y, et al. Robust enumeration of cell subsets from tissue expression profiles. Nat Methods. 2015;12:453–457. doi:10.1038/nmeth.3337.
- The database for annotation, visualization and integrated discovery (DAVID). [accessed 2017 Sep 20. https://david.ncifcrf.gov/.
- Fredlund E, Staaf J, Rantala JK, Kallioniemi O, Borg A, Ringner M. The gene expression landscape of breast cancer is shaped by tumor protein p53 status and epithelial-mesenchymal transition. Breast Cancer Res. 2012;14:R113. doi:10.1186/bcr3236.
- Degen JL, Palumbo JS. Hemostatic factors, innate immunity and malignancy. Thromb Res. 2012;129(Suppl 1):S1–5. doi:10.1016/S0049-3848(12)70143-3.
- Teschendorff AE, Miremadi A, Pinder SE, Ellis IO, Caldas C. An immune response gene expression module identifies a good prognosis subtype in estrogen receptor negative breast cancer. Genome Biol. 2007;8:R157. doi:10.1186/gb-2007-8-8-r157.
- Staaf J, Ringner M, Vallon-Christersson J, Jonsson G, Bendahl PO, Holm K, et al. Identification of subtypes in human epidermal growth factor receptor 2–positive breast cancer reveals a gene signature prognostic of outcome. J Clin Oncol. 2010;28(11):1813–1820. doi:10.1200/JCO.2009.22.8775.
- Zhang SC, Hu ZQ, Long JH, Zhu GM, Wang Y, Jia Y, et al. Clinical implications of tumor-infiltrating immune cells in breast cancer. J Cancer. 2019;10:6175–6184. doi:10.7150/jca.35901.
- Tekpli X, Lien T, Rossevold AH, Nebdal D, Borgen E, Ohnstad HO, et al. An independent poor-prognosis subtype of breast cancer defined by a distinct tumor immune microenvironment. Nat Commun. 2019;10:5499. doi:10.1038/s41467-019-13329-5.
- Gonzalez H, Hagerling C, Werb Z. Roles of the immune system in cancer: from tumor initiation to metastatic progression. Genes Dev. 2018;32:1267–1284. doi:10.1101/gad.314617.118.
- Morrow ES, Roseweir A, Edwards J. The role of gamma delta T lymphocytes in breast cancer: a review. Transl Res. 2019; 203:88–96. doi:10.1016/j.trsl.2018.08.005.
- Gun SY, Lee SWL, Sieow JL, Wong SC. Targeting immune cells for cancer therapy. Redox Biol. 2019;25:101174. doi:10.1016/j.redox.2019.101174.
- Bagger FO, Sasivarevic D, Sohi SH, Laursen LG, Pundhir S, Sonderby CK, et al. BloodSpot: a database of gene expression profiles and transcriptional programs for healthy and malignant haematopoiesis. Nucleic Acids Res. 2016;44:D917–24. doi:10.1093/nar/gkv1101.
- Nirmal AJ, Regan T, Shih BB, Hume DA, Sims AH, Freeman TC. Immune cell gene signatures for profiling the microenvironment of solid tumors. Cancer Immunol Res. 2018;6:1388–1400. doi:10.1158/2326-6066.CIR-18-0342.
- Antoniak S. The coagulation system in host defense. Res Pract Thromb Haemost. 2018;2:549–557. doi:10.1002/rth2.12109.
- Rallabhandi P, Nhu QM, Toshchakov VY, Piao W, Medvedev AE, Hollenberg MD, et al. Analysis of proteinase-activated receptor 2 and TLR4 signal transduction: a novel paradigm for receptor cooperativity. J Biol Chem. 2008;283:24314–24325. doi:10.1074/jbc.M804800200.
- Ubil E, Caskey L, Holtzhausen A, Hunter D, Story C, Earp HS. Tumor-secreted Pros1 inhibits macrophage M1 polarization to reduce antitumor immune response. J Clin Invest. 2018;128:2356–2369. doi:10.1172/JCI97354.
- Graf C, Wilgenbus P, Pagel S, Pott J, Marini F, Reyda S, et al. Myeloid cell-synthesized coagulation factor X dampens antitumor immunity. Sci Immunol. 2019;4:eaaw8405.
- Liu Y, Liao XW, Qin YZ, Mo XW, Luo SS. Identification of F5 as a prognostic biomarker in patients with gastric cancer. Biomed Res Int. 2020. doi:10.1155/2020/9280841.
- Astoul E, Edmunds C, Cantrell DA, Ward SG. PI 3-K and T-cell activation: limitations of T-leukemic cell lines as signaling models. Trends Immunol. 2001;22:490–496. doi:10.1016/S1471-4906(01)01973-1.