
ABSTRACT
Tumor-infiltrating lymphocytes (TILs) play indispensable roles in the progression and response to treatment of solid tumors. However, the prognostic significance of CD4+ TILs is not fully disclosed in cancers generally and in CRC in particular, mainly due to the existence of different functional subsets of CD4+ T cells. We performed transcriptomic profiling of CD4+ TILs isolated from CRC patients in order to identify differentially expressed genes and their functional pathways in early versus advanced disease stages. We found that in advanced stages, genes related to immune and inflammatory responses, in particular Th1-mediated immune response and cytotoxicity-mediated genes, were downregulated; while epigenetic-mediated silencing genes were upregulated. Interestingly, we identified genes, which were steadily upregulated or downregulated in CD4+ TILs with CRC progression from stage I to IV. Additionally, of the top 200 deregulated genes, 43 upregulated and 64 downregulated genes showed similar deregulation trends in the cancer genome atlas CRC dataset. From these 97 deregulated genes, we identified a “poor prognosis CD4 gene signature (ppCD4sig)”. Patients with high ppCD4sig score showed shorter disease-specific survival (DSS) and progression-free interval (PFI). The ppCD4sig was an independent prognostic indicator for DSS (HR = 1.73, 95% CI 1.32–2.27, P = 0.0001) and PFI (HR = 1.75, 95% CI 1.3–2.35, P = 0.0016). Additionally, patients at advanced stages and at a younger age (<55 years) were more likely to have a high ppCD4sig score. Altogether, our data provide novel insights and a unique prognostic gene signature of CD4+ TILs in the CRC microenvironment.
Introduction
The nature of the tumor microenvironment (TME) is closely linked with the onset, progression, metastasis, relapse, and therapy resistance of colorectal cancer (CRC).Citation1 The TME consists of heterogeneous immune cellular components, including lymphocytes, natural killer cells (NK), macrophages, myeloid cells, and dendritic cells, which are indispensable for potent and durable anti-tumor immune responses.Citation2,Citation3 However, most of the tumor-infiltrating immune cells (TIICs) have impaired functions and favor malignant progression by creating an immune-subversive environment.Citation4 Unlike other cancers, it has been reported that CD4+ T-cell infiltration in CRC correlates with a better prognosis of the disease.Citation5,Citation6 The immunoscore calculated based on tumor-infiltrating T cells, cytotoxic, and memory T cells was shown to have a better prediction of prognosis than TNM staging (Tumor size, lymph Node involvement and Metastatic spread), emphasizing the importance of TIICs as a predictive biomarker.Citation7 Moreover, the development of biomarkers, which can efficiently predict disease prognosis, is warranted to improve disease management.
Accumulating evidences suggest that tumor-specific T cells are potent tumor-reactive effector T cells, which can secrete effector cytokines upon tumor antigen recognition.Citation8,Citation9 CD8+ T cells and Th1 cells are the most potent tumor-suppressing immune cells, amongs other immune cells with anti-tumor activities, which produce IFNγ and effectively prevent the onset and progression of CRC.Citation10 CD3+CD8+ TILs have been shown as potential predictive indicators of tumor relapse and overall survival of CRC.Citation7,Citation11 In contrast, CD4+ TILs are less explored as a predictive biomarker in CRC, and their clinical significance in disease outcome is still not fully disclosed. We have recently reported the accumulation of CD3+, CD4+, and FoxP3+ TILs in CRC tissues, compared with adjacent normal tissues.Citation12 Generally, the accumulation of T regulatory cells (Tregs) within tumor tissues is considered as a poor prognostic factor in many cancers,Citation13 while in CRC, Tregs are considered as a favorable prognostic biomarker associated with better relapse-free survival.Citation5,Citation14 However in CRC, it has been reported that there are two distinct FoxP3+ TILs: FoxP3hi suppressive-competent TILs and Foxp3lo non-suppressive TILs.Citation15 CRC with predominant infiltration of FoxP3lo TILs showed significantly better prognosis than those with FoxP3hi TILs.Citation15
Considering the pivotal role of TIICs in anticancer immune responses, we rationalized that better understanding of CD4+ TILs in the CRC microenvironment requires a stage-wise comprehensive analysis. Here, we performed transcriptomic analyses of CD4+ TILs from different stages of CRC patients to identify the differentially expressed genes (DEGs) in advanced stages (III and IV), compared with early stages (I and II), and determine their involvements with the onset and progression of the disease. We found that immune/inflammatory response and cytokine-mediated cell signaling pathways were significantly downregulated, while the chromatin silencing-related pathway was upregulated in advanced stages. Furthermore, we have aligned some of the genes from upregulated and downregulated panel using TCGA dataset from CRC patients. Based on this, we identified poor prognosis CD4 signature (ppCD4sig) comprising 107 genes, and classified patients as per the ppCD4sig score (high, intermediate, and low). Interestingly, we found that high ppCD4sig score patients had the shortest disease-specific survival (DSS) and progression-free interval (PFI), compared to those with an intermediate or low score. Altogether, our data provide significant insights into the CD4+ TILs from different stages of CRC and identify a gene signature, which could predict the progression of CRC.
Materials and methods
Sample collection and storage
Tumor tissues (TT) were obtained from 18 CRC patients who underwent surgery at Hamad Medical Corporation, Doha, Qatar. All patients included in the study were treatment-naïve prior to surgery and provided written informed consent prior to sample collection. shows the clinical and pathological characteristics of all participating patients. All experiments were performed in accordance with relevant guidelines and regulations. The clinicopathological parameters including TNM staging were confirmed by pathologists. We collected five samples from each stage (I–IV) over a year. The samples were selected by excluding tumor samples from patients with other medical conditions including polyps and other peritoneal diseases. Two patient samples from stage III were excluded post-RNA-Seq as they did not pass quality controls. This study was executed under ethical approvals from Hamad Medical Corporation, Doha, Qatar (protocol no. MRC-02-18-012) and Qatar Biomedical Research Institute, Doha, Qatar (protocol no. 2017–006). All experiments were performed in accordance with the ethical principles of the Declaration of Helsinki. Tissue specimens were processed and stored as previously described.Citation16 Cells were dissociated from bulk tumor tissues using mechanical disaggregation. The single-cell suspensions for further downstream experiments were obtained as previously described.Citation16
Table 1. Characteristic features of study populations.
Fluorescence-activated cell sorting
Cells were stained with cell-surface antibodies against CD3-allophycocyanin-Cy7 (clone SK7, BD Pharmingen, San Jose, USA), CD4-phycoerythrin (clone RPA-T4, BD Pharmingen), CD8-fluorescein isothiocyanate (clone RPA-T8; BD Pharmingen) and CD33-allophycocyanin (clone WM53, BD Pharmingen). Cells were washed twice with flow cytometry staining buffer and re-suspended in Pre-Sort buffer (BD Biosciences). 7-AAD viability dye (eBioscience, San Diego, USA) was used to gate live cells. BD FACSAria III SORP cell sorter on BD FACSDiva software (BD Biosciences) was used for sorting pure CD4+ (7AAD–CD3+CD4+CD8–CD33–), CD8+ (7AAD–CD3+CD4–CD8+CD33–) and CD33+(7AAD–CD3–CD4–CD8–CD33+) populations. Applicable measures were taken to ensure minimal sorter-induced cell stress (SICS). Data analyses were performed on FlowJo V10 software (FlowJo, Ashland, USA).
RNA isolation and amplification
Total RNA was extracted from sorted, pure CD4+ T cells, from 18 CRC patients’ tissues using RNA/DNA/protein purification Plus Micro Kit (Norgen Biotek Corporation, Ontario, Canada) according to the manufacture’s protocol. RNA was then amplified using 5X MessageAmp™ II aRNA Amplification Kit (Invitrogen) as previously described.Citation17 The concentrations of RNA were determined by Qubit RNA HS or Broad Range Assay Kits (Invitrogen, California, USA).
Quantitative Reverse Transcriptase PCR (RT-qPCR)
cDNA was prepared from 1 µg of RNA using QuantiTect Reverse Transcription Kit (Qiagen, Hilden, Germany). All cDNA samples were diluted 1:3 in nuclease-free water and stored in aliquots at −80°C and used in batches for subsequent analyses. PCR reactions were performed on QuantStudio 7/6 Flex qPCR (Applied Biosystems, California, USA) using PowerUP SYBR Green Master Mix (Applied Biosystems). All data were normalized to β-actin. The ΔCt values obtained from lessening target gene Ct with β-actin Ct (target gene Ct – β-actin Ct). The fold change (FC) for target gene in advanced stages was calculated by dividing the average Ct value of advanced stage samples with average Ct value of early-stage samples. log2 FC was subsequently calculated and plotted for the corresponding gene from RNA-Seq data.
Library preparation
cDNA libraries were generated from CD4+ T cells using Exome TruSeq Stranded mRNA Library Prep Kit (illumina, San Diego, USA) according to the manufacturer’s protocol, and as previously described.Citation18 Quality-passed libraries were subjected to clustering using TruSeq PE Cluster Kit v3-cBot-HS (illumina). The clustered samples were sequenced on an illumina HiSeq 4000 instrument using HiSeq 3000/4000 SBS kit (illumina).
RNA-sequencing data processing and analyses
Pair end reads were quality-trimmed and were aligned to the hg19 human reference genome in CLC Genomics Workbench 12 (Qiagen) using default settings.Citation18 The abundance of the expression of transcripts was measured as the score of TPM (Transcripts Per Million) mapped reads in CLC Genomics Workbench 12. Abundance data were subsequently subjected to differential gene expression. For heat maps, the Z-scores were calculated from the TPM values as previously described.Citation19 Principal component analysis (PCA) and volcano plots were performed using OrignPro 2020 software (OriginLab Corporation, Massachusetts, USA) with log2 FC and P value cutoff <0.05 to identify differentially expressed genes (DEGs). Furthermore, the functional relationship among the upregulated and downregulated genes were identified by uploading them separately to STRING V11.0 tool (http://string-db.org). The Gene Ontology (GO) analysis and Kyoto Encyclopedia of Genes and Genomes (KEGG) pathway enrichment analyses of DEGs were performed by the Database for Annotation, Visualization and Integrated Discovery (DAVID) tool, as previously describedCitation16 and iDEP.91 (integrated Differential Expression and Pathway analysis, http://bioinformatics.sdstate.edu/idep/), a web-based online analyses tool using default settings.
TCGA analysis
The top 100 upregulated genes and top 100 downregulated genes from advanced stage compared to early-stage CRC were selected for analysis in the TCGA CRC dataset accessed using the UCSC Xena platform (http://xena.ucsc.edu/). Of these 100 upregulated genes, 96 genes were annotated in the TCGA CRC RNA-Seq dataset, of which 43 genes (45%) had higher expression in patients with poorer disease-specific survival (DSS). For the 100 downregulated genes, 98 genes were annotated in TCGA dataset, of which 64 genes (65%) had lower expression in patients with poorer DSS. The selected 43 upregulated and 64 downregulated genes were used as the ‘poor prognosis CD4+ T-cell gene signature’ (ppCD4sig). The ppCD4sig score was calculated as the ratio of the average expression of the 43 upregulated genes to the average of the 64 downregulated genes (Supplementary Table 1).
Statistical analyses
Statistical analyses were performed using GraphPad Prism 8 software (GraphPad Software, California, USA). Mantel–Cox test was used to determine log-rank P value when comparing DSS and PFI amongst the patient groups with high, intermediate, and low ppCD4sig score. Multivariate analyses for DSS and PFI were performed using Cox proportional-hazard model (MedCalculator v12.7, https://www.medcalc.org/) in comparison to the ppCD4sig (high, intermediate, low), disease stage (IV, III, II, I), residual disease (yes, no), age (< 55, 55–64, 65–74, > 74 years of age), anatomic locations (seven different locations), and gender (male, female). Chi-squared (χ2) test was used to determine the association between the different ppCD4sig scores and disease stage, the presence of residual disease, age, gender, or different CRC anatomical locations.
Results
Differential analysis of CD4+ T cell transcriptome in advanced stages of CRC
Following sorting pure CD4+ TILs (), we performed RNA-sequencing (RNA-Seq) from 18 CRC patients’ tissues with different pathological stages, classified into two groups, early (stage I and II) and advanced (III and IV), containing five patients per stage (except stage III, which has only three patients). There were 1,517 differentially expressed genes in CD4+ TILs in advanced stages, compared with the early stages of CRC (FC >2 and P value cutoff < 0.05, Supplementary Figure 1a and Supplementary Table 2). Among these 1517 genes, 831 were upregulated and 686 were downregulated in advanced stages (). PCAs of the total data sets confirmed the close relativeness of biological replicates (Supplementary Figure 1b). Selected number of downregulated genes (TIM-3, TOX, DNMT3B and TET3) and upregulated gene (TOX3) from RNA-Seq data were subsequently validated using quantitative reverse transcriptase-PCR and confirmed their concordant expression to those observed in RNA-Seq data (Supplementary Figure 1c). Next, we analyzed set of genes related to regulatory T cell (Treg) signatures, immune checkpoints, Th1/2/17, T-cell exhaustion (Tex) markers and interleukins (Supplementary Table 3). We found that Th1/Th17-related genes including IFNγ, TBX21, IRF8, IL22, IL17A and IL17F were significantly downregulated, while IL2 was significantly upregulated in advanced stages, compared with early stages (). Furthermore, we found that Tex markers including TOX2, MKI67, CERS6, PDCD1 and CD160 were significantly downregulated and TOX3 and EOMES were significantly upregulated in advanced stages, compared with early stages (). These data suggest that CD4+ TILs could be more exhausted in advanced stages, compared with early stages of CRC, given that TOX2 and PDCD1 may act as early T cell activation markers.
Figure 1. Transcriptomic characterization of CD4+ TILs of CRC patients. RNA-Seq was performed on CD4+ TILs isolated from 18 CRC tissues at different disease stages. Flow cytometric plots illustrate the gating strategy to isolate CD4+ TILs with high purity (a). Volcano plot showing significantly (P < 0.05) upregulated (red) and downregulated transcripts (green) from advanced (stage III & IV) vs. early (I & II) stages of CRC (b). Comparisons of selected differentially expressed gene panels including immune checkpoints, Th-, Treg- and Tex-related genes from advanced (A) vs. early (e) comparison. Volcano plot and heat map (Z-scores) showing the differential expression of significantly (P < 0.05) upregulated or downregulated genes in advanced vs. early stages of CRC (c). Bar plots illustrating the functional characterization of significantly upregulated and downregulated genes from advanced vs. early stages of CRC (d). Heat maps of the differential expression of genes from selected upregulated or downregulated pathways (e).
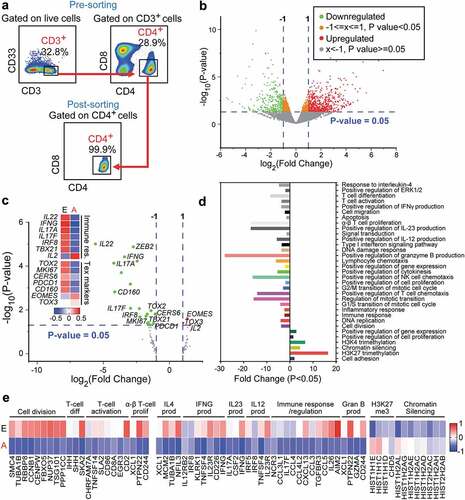
To elucidate the functional pathways, we performed gene ontology (biological process) and KEGG pathway analyses using the DAVID platform. We found that H3K27me3 (trimethylation at lysine 27 of histone H3)- and chromatin silencing-related genes were significantly upregulated in advanced stages (P < 0.05, and e). At the same time, immune/inflammatory response-related genes, including IFNγ, IL23 and IL4, and granzyme B, and T-cell proliferation/differentiation-related genes were significantly downregulated in advanced stages compared with early stages (P < 0.05, and e). These data suggest that in CD4+ TILs, epigenetic silencing might play important roles in the downregulation of immune response-related genes in advanced stages, compared with early stages of CRC.
Analyses of functional pathways enriched in CD4+ TILs from different stages of CRC
To identify potential functional annotation and pathway enrichment of DEGs in particular stage, we performed differential expression analyses from all different comparisons (Supplementary Figure 2). The significantly enriched functional pathways (KEGG) of upregulated and downregulated genes from each pathological stage comparison were analyzed subsequently. We found that majority of pathways related to antitumor immune responses were enriched within the downregulated genes. Stage II vs. I and III vs. IV were excluded from our analyses due to the similarity in differentially expressed genes, compared with other comparisons (III vs. I, IV vs. I, II vs. II and IV vs. II; data not shown). Downregulated genes were significantly enriched within pathways related to cell adhesion and NK cell-mediated cytotoxicity in stage III, cytokine/receptor interaction in stage III and IV, cell cycle, chemokine signaling, inflammatory response, and p53-mediated signaling in stage IV, compared with stage I (). Additionally, downregulated genes in stage III and IV, compared with stage II, were commonly enriched within pathways related to NK cell-mediated cytotoxicity, cytokine/receptor, antigen processing and presentation, and chemokine signaling. However, downregulated genes in stage IV, compared to stage II, were distinctively enriched within inflammatory response-, JAK-STAT-, PPAR- and cell cycle-mediated pathways (). Moreover, the hierarchy of pathway enrichment of downregulated genes in advanced stages was cytokine-cytokine receptor interaction (27% genes), chemokine signaling pathway (18% genes), NK cell-mediated cytotoxicity (17% genes), cell cycle (17% genes), inflammatory response (8% genes), antigen processing and presentation (7% genes) and p53-signaling pathway (6%) ().
Figure 2. KEGG/Gene ontology pathway enrichment analyses of deregulated genes from stage-wise comparison. Differentially expressed genes from stage-wise comparisons were analyzed using the DAVID platform to identify functional pathways enrichment in stage III or IV compared to stage I or II, and in advanced stage (A: III and IV) vs. early stage (E: I and II). Charts showing significantly downregulated KEGG pathways enriched in each comparison with percentage of the number of enriched genes for each pathway to the total number of genes (a). Venn diagrams showing the shared pathway and the pathway lists which were enriched in the downregulated genes (b) and upregulated genes (c). The alphabets in the Venn diagrams represent the shared gene ontology clusters listed in the tables.
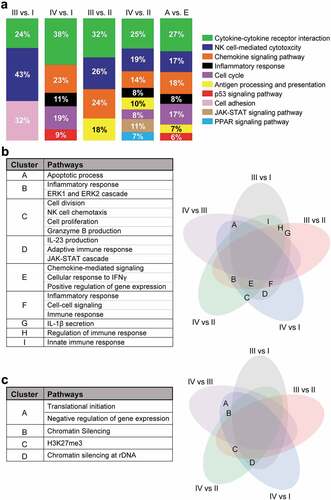
Next, we investigated the shared pathways from both upregulated and downregulated genes among the different comparisons. We found that immune response-, positive regulation of gene expression- and inflammatory response-mediated pathways were significantly downregulated in advanced stage comparisons (). Interestingly, we found that chromatin silencing and H3K27me3 pathways were significantly upregulated in advanced stages (). These data confirm our previous findings that epigenetic-mediated silencing pathways were upregulated and immune response-related pathways were downregulated in advanced stages of CRC, compared with early stages.
Functional analyses of steadily deregulated genes with CRC progression
We analyzed the coding genes that were steadily upregulated or downregulated in CD4+ TILs with the progression of CRC. The DEGs were selected from the advanced vs. early-stage analyses (P < 0.05). We found that the expression of 51 genes steadily increased and 134 genes steadily decreased, as the disease progressed from stage I to IV (P < 0.05, and b). Functional pathways enrichment analysis found that cellular response to IFNγ, IL1β, IL23, and IL6, immune/inflammatory response, ERK and TCR signaling pathways were significantly enriched in the downregulated genes ( and d). On the other hand, chromatin silencing and negative regulation of gene expression pathways were significantly enriched in the upregulated genes ( and d). Moreover, protein–protein interaction analysis (PPI, String-db) using stringent criteria showed that the vast majority of upregulated genes in advanced stages were related to nucleosome organization and gene/chromatin silencing including HIST1, HIST2 and HIST4 (). STRING database identified 38 nodes and 17 edges with PPI enrichment P value 0.000181, an average clustering coefficient of 0.347 and an average node degree of 0.895 (). PPI analysis of downregulated genes found connectivity in the inflammatory, immune response, chemokine signaling, NK cell-mediated cytotoxicity and cell cycle with 119 nodes and 251 edges (). The PPI enrichment P value was < 1.0E–16 with an average clustering coefficient of 0.418 and an average node degree of 4.22 (). These data confirm our previous findings that the immune and inflammatory responses were downregulated in CD4+ TILs during the progression of CRC.
Figure 3. Transcriptomic characterization of steadily deregulated genes across stages of CRC. Significantly upregulated (a) and downregulated genes (b) which were deregulated in an order with staging were used for further analyses on DAVID platform. Heat maps show the expression (Z-scores) of 51 upregulated and 134 downregulated genes. Bar plots show the fold change of each functional pathways, which were significantly upregulated and downregulated from gene ontology enrichment analyses (c). Heat map showing the expression of genes (Z-scores) discovered in the selected functional network from panel C (d).
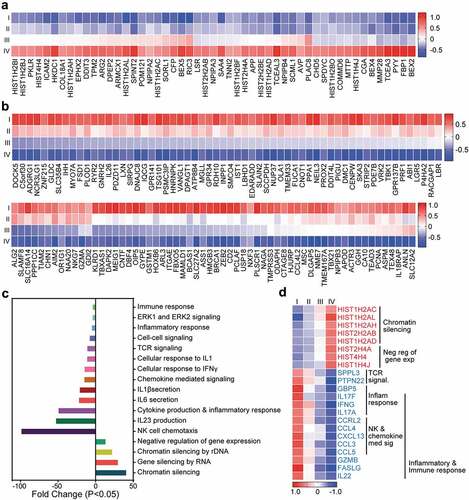
Figure 4. PPI network analyses of deregulated genes in advanced stage of CRC. PPI network analyses using the STRING database of significantly upregulated (a) and downregulated (b) genes obtained from analyses of advanced stages vs. early stages. The unconnected nodes were removed from the networks. GO ontologies, description and false discovery rate (FDR) using the whole transcriptome as reference are stated for each subnetwork. The overall network statistics are shown in the gray boxes.
TCGA analyses of RNA-Seq data and deriving a poor prognosis CD4 gene signature
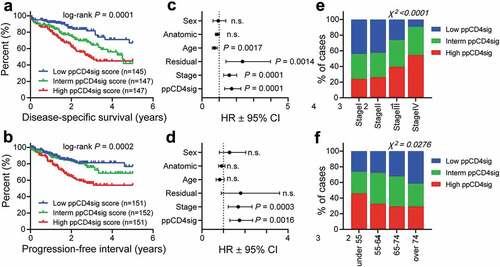
The downregulated genes in CD4+ T cells in late-stage disease were used to calculate the poor prognosis CD4+ T cell gene signature (ppCD4sig) score as described in the Methods section. The CRC TCGA cases were labeled as high, intermediate, and low groups according to the ppCD4sig. Patients with high ppCD4sig score had poorer DSS and shorter PFI compared to patients with intermediate or low ppCD4sig score ( and b). The ppCD4sig was an independent prognostic indicator for DSS (HR = 1.73, 95% CI 1.32–2.27, P = 0.0001, ) and PFI (HR = 1.75, 95% CI 1.3–2.35, P = 0.0016, ), as indicated by multivariate analyses using Cox proportional-hazard model even in the presence of disease stage as another indicator. Patients at advanced stages (III and IV, (χ2 P < 0.0001)) and patients at younger age (< 55 years, χ2 P = 0.0276) were more likely to have high ppCD4sig score ( and f). Intestinally, the splenic flexure, descending and sigmoid colon anatomical locations (left-sided colon cancer) were more likely to have a high ppCD4sig score, whereas the transverse colon and the right-sided colon cancer (hepatic flexure, ascending colon and the cecum) were more likely to have a low ppCD4sig score (Supplementary Figure 3a). There was a trend for the presence of residual disease after primary therapy in patients with high ppCD4sig score (Supplementary Figure 3b). Additionally, the ppCD4sig score did not differ between male and female (Supplementary Figure 3c). Altogether, the TCGA analysis supports that the signature we developed can predict the poorer survival and more aggressive clinicopathological features.
Figure 5. Evaluating of the prognostic relevance of “poor prognosis CD4+ TIL gene signature” in TCGA CRC dataset. The selected genes as described in Methods were used to calculate the ‘poor prognosis CD4+ TIL gene signature’ (ppCD4sig) score; calculated as the ratio of the average expression of the 43 upregulated genes to the average of the 64 downregulated genes. The ppCD4sig was evaluated in TCGA CRC RNA-Seq dataset. Disease-specific survival (a) and progression-free interval (b) were compared between patients with high (top 33%), intermediate (middle 33%) or low (bottom 33%) ppCD4sig scores. The number (n) of patients in each of ppCD4sig groups and the log-rank P value from Mantel-Cox test are indicated. Multivariate analyses, using Cox proportional-hazard model, comparing the ppCD4sig (high, interm, low), disease stage (stages IV, III, II, I), residual disease (yes, no), age (<55, 55–64, 65–74, >74 years of age), anatomic locations (7 different locations), and sex (male, female). Multivariate analysis was done for disease-specific survival (c) and progression-free interval (d). Data shown are the hazard ratio (HR) ± 95% confidence interval (CI), and the multivariate P values are indicated (n.s.: not significant). Distribution of patients with high, intermediate, or low sCD4sig scores across diseases stage (e) or age at diagnosis (f). Stated P-values are from Chi-square (χ2) test (GraphPad Prism).
Differential expression analyses between high scored and low scored ppCD4sig
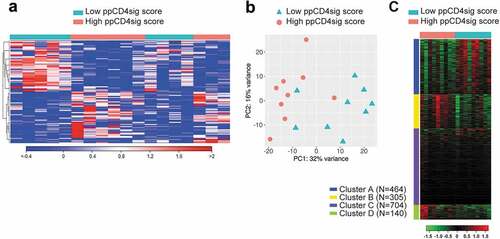
To understand the differences of biological characteristics between CD4+ T cells with high ppCD4sig score and low score, we grouped patients into two groups as described in Methods (nine patients with high score and nine patients with low score, Supplementary Table 4). The differential analyses showed 1613 deregulated genes of them 952 genes were upregulated and 661 genes were downregulated in high ppCD4sig score, compared with low-scored patients (). PCAs of the total data sets confirmed the close relativeness of the biological replicates. PC1 shows 32% variance, while PC2 shows 16% (). Gene ontology (biological process) enrichment analyses showed that four clusters (A–D) were mainly enriched in the deregulated genes ( and Supplementary Table 5). Out of which, clusters belong to chromatin silencing and gene regulation-related genes were upregulated (clusters D), and clusters belong to cell cycle/division and immune response- and cytokine signaling-related genes were downregulated (clusters A) in high score patients, compared with low score patients ( and Supplementary Table 5). The ability to find the same pathways as described earlier confirmed that the ppCD4sig score based on the 107 selected genes retained the difference between the transcriptomes of CD4+ TILs in advanced stage versus early-stage CRC.
Figure 6. Transcriptomic analyses of high ppCD4sig score vs. low score for CRC patients. The ppCD4sig score for the 18 patients was calculated based on the ratio between the average expression (TPM) of upregulated genes to the average expression of downregulated genes. Patients were dichotomized as high score (above median score) and low score (below median score) groups. Differential expression analyses were performed on data comparing high score vs. low score patients to identify deregulated and functional networks using iDEP platform. Hierarchical heat map shows the distinct cluster of high score and low score patient groups (FC >2 and P value < 0.05) (a). PCA plot showing the variability in gene expression between high score and low score CRC patients. First two principal components are shown (b). Heat map shows the four functional clusters from gene ontology enrichment analyses (c). Expression of clustered transcripts is depicted as color code, displayed below the heat map. The number of genes annotated in each cluster is represented (left side) of the heat map.
Discussion
Infiltration of lymphocyte is considered as one of the major host defense mechanisms in the majority of solid tumors, and could be used as a diagnostic/prognostic marker of colorectal cancer.Citation20 Numerous studies showed the favorable prognostic impact of T cell infiltration in various tumors.Citation21 We have previously reported that CD4+ T cell infiltration was significantly higher in the CRC microenvironment, compared with normal tissue with no significant differences between early and advanced stages.Citation12 In this study, we investigated the transcriptomes and potential functional networks of CD4+ TILs from various stages of CRC. Our analyses led to developing a gene signature based on the transcriptome of CD4+ TILs with a prognostic potential for CRC.
Reports show that 20–30% of CRC patients have tumor-specific T cells, which play an indispensable role in the elimination of tumor cells as a primary defense mechanism.Citation10,Citation22 CRC patients with higher T-cell infiltration have better disease outcome.Citation23 In particular, Th1, Th17, and cytotoxic T cells are critical to inhibit the proliferation of cancer cells and induce apoptosis.Citation24,Citation25 Our data demonstrate that CD4+ TILs upregulate Th1- and Th17-related genes including IFNγ, TBX21, IRF8, IL22, IL17A, and IL17F in the early stages of CRC, compared with advanced stages. Furthermore, some studies reported that increased infiltration of Th1 cells were positively correlated with improved prognosis and outcome, while the infiltration of Th17 cells in early stages negatively influences the prognosis of CRC patients.Citation26,Citation27 In contrast to these reports, it has been reported that Th17 cells are multifaceted, favor the recruitment of cytotoxic CD8+ T cells to the tumor microenvironment and are associated with better survival of CRC patients.Citation24 Moreover, in prostate tumor, it has been reported that the differentiation of Th17 cells was reduced by the overexpression of IL-2 within the tumor microenvironment and creates an immune-subversive environment to favor malignant progression.Citation28 In agreement with these data, we also found that IL2 expression was upregulated, and the expression of Th17-related genes were downregulated in advanced stages of CRC, compared with early stages. Taken together, our data suggest that patients with advanced stages have less immune/inflammatory response, which could lead to tumor progression.
Apart from traditional Th1, Th2, Th17, and Treg CD4 T helper lineages, Th22 is a unique T-helper subset, which is significantly associated with the development of CRC.Citation29 This Th lineage is evident by releasing IL22, which was previously considered as Th1/17 cytokine.Citation30 Moreover, it has been reported that transcriptomic expression of IL22 is significantly higher in tumor tissues, compared with that in normal tissues.Citation29 Another report showed that Th17 and Th22 cells were higher in CRC tissues and were negatively correlated with tumor progression.Citation31 The levels of IL22 and IL17 transcripts were also significantly higher in early stages of CRC, compared with advanced stages.Citation31 Interestingly, after tumor resection, their levels were significantly increased in patients with advanced stages.Citation31 Furthermore, in breast cancer it has been reported that IL22 inhibits ERK1/2 pathways leading to the reduction in tumor growth.Citation32 In concordance with these reports, we found that both IL22 and IL17 were significantly downregulated in advanced stages of CRC, compared with early stages. Moreover, ERK1/2 pathway was found to be significantly reduced in advanced stages. These data suggest that reduced expression of IL22 and IL17 might be associated with the progression of CRC.
The tumor microenvironment is highly heterogenous with the TILs constituting the vast majority of immune infiltrates.Citation33 The chronic exposure of cancer antigen to the memory T cells could alter their differentiation and activation, leading to exhaustion.Citation34 It has been reported that T-cell exhaustion is initiated in early stages after the onset of tumor in preclinical tumor models.Citation35 Additionally, upregulation of immune checkpoints including PD-1, CTLA-4, and TIM-3 and alterations in transcriptional/metabolic pathways are considered as the hallmark of T cell exhaustion.Citation36 In concordance with these reports, we found that the majority of T-cell exhaustion markers, including the expression of PDCD1 (gene for PD-1), TOX2 and MKI67, were upregulated in the early stages of CRC, compared with advanced stages. These data evidently discriminate phenotypical and functional characteristics of CD4+ TILs in early and advanced stages of CRC. On the other hand, we found that TOX3 and EOMES were significantly upregulated in advanced stages of CRC. It has been reported that PD-1 and Ki67 were expressed on proliferating T cells and could be considered as recent activation markers upon infection.Citation37 Furthermore, EOMES+ TILs were considered as partially exhausted T cells, which could efficiently produce IFN-γ and TNF-α, despite of the expression of PD-1.Citation38 Notably, a report showed that TOX3 is significantly upregulated in advanced stages leading to invasive breast malignancy.Citation39 Moreover, EOMES and TOX3 expressions are strongly associated with poor prognosis of breast cancer patients.Citation40,Citation41 These data suggest that, similar to breast cancer, high expression of TOX3 and EOMES in advanced stages might be associated with poor progression of CRC.
Increasing evidence suggests that epigenetics play an indispensable role in the progression of CRC.Citation16,Citation42,Citation43 It has been reported that epigenetics contribute to cancer progression in three ways: (i) restricting the expression of proliferation-related genes, (ii) chromosomal degradation, and (iii) chromatin dysfunction.Citation44 Moreover, changes in global DNA methylation patterns of TILs influence CRC progression from onset to metastasis.Citation45 Herein, we found that T cell proliferation and differentiation- and cell cycle-related genes were significantly downregulated and chromatin-mediated epigenetic silencing pathways were upregulated in advanced stages of CRC, compared with early stages. These data suggest that chromatin-silencing plays an indispensable role in the progression of CRC. Reports showed that global changes in histone 3 (H3) could be exploited as a promising biomarker in tumor transformation.Citation46,Citation47 Similarly, histone modifiers including polycomb-group proteins (PcGs) are engaged in silencing of key regulatory enzymes during the onset and differentiation of tumor cells,Citation48,Citation49 and play an indispensable role in chromatin remodeling and nuclear reprogramming.Citation50 Additionally, the average number of H3K27me3-enriched genes was reported to be higher in prostate cancer tissues and positively correlates with disease progression.Citation51 Similar to these cancer cell studies, we found that H3K27me3-mediated pathways were significantly upregulated in CD4+ TILs in the advanced stages of CRC. These data rationalize that H3K27me3 could be a key player behind the upregulation of chromatin-silencing pathways in advanced stages of CRC.
The higher levels of CD4+ TILs are considered as an unfavorable prognostic aspect in different cancer types including non-small-cell lung,Citation52 breastCitation53 and prostateCitation54 cancers. In contrast, the tumor infiltration of CD4+ and FOXP3+ TILs were reported as a favorable prognostic factor in CRC.Citation5 The rationale behind this prognostic divergence remains unclear, but it could be due to the functional discrepancy in CD4+ TILs within various tumors. These data justify the significant role of CD4+ TILs in controlling immune system to fight against malignancy. In the CRC microenvironment, naïve CD4+ T cells can differentiate to all Th phenotypes (Th1/Th2/Th17/Th22/Treg) depending on the expression of transcription factors and cytokine release.Citation25,Citation55 Additionally, in CRC patients the higher expression of Th17 transcripts are associated with poor prognosis, whereas higher expression of Th1 and cytotoxicity transcripts are associated with favorable prognosis.Citation25 However, Th2 transcripts have no prognostic importance in CRC.Citation25 In our data, we also found that Th1, Th17, Th22, and cytotoxicity-mediated transcripts were highly expressed in the early stages of CRC, compared with advanced group.
Based on our TCGA analyses of the upregulated and downregulated genes in CD4+ TILs in advanced stages, we identified a gene signature that predicts the survival of CRC patients. The ppCD4sig score showed that patients with higher scores have poorer disease/progression-free survival, compared to patients with low or intermediate scores. Back-analyses of the CD4+ TILs transcriptomes based on dichotomization of CRC cases to high score and low score showed that high score patients have less expression of Th1 and cytotoxicity-related genes. These data are in concordance with previous reports suggesting that Th1 and cytotoxicity-related transcripts are correlated with positive prognosis in CRC.Citation25,Citation27,Citation56 Interestingly, we found that younger CRC patients have high ppCD4sig score. A retrospective report showed that younger patients have more aggressive behavior and worst prognosis.Citation57 Moreover, in the majority of young CRC patients, tumors are poorly differentiated with advanced disease stages.Citation58 Taken together, our data suggest that the identified ppCD4sig could have prognostic potentials in young CRC patients.
Our data show that genes responsible for Th1 responses and cytotoxicity were downregulated, while epigenetic-mediated silencing genes were upregulated in advanced stages of CRC, compared with early stages. Sets of genes, which were steadily upregulated or downregulated in CD4+ TILs with CRC progression from stage I to stage IV, were identified. Additionally, we have identified a poor prognosis gene signature, in which patients with higher scores have poorer disease-free survival and progression-free interval. Taken together, this study provides critical insights into the functional characteristics of CD4+ TILs and their prognostic significance in early and advanced stages of CRC patients.
Abbreviations
Authors contributions
VN: Data curation, Methodology, Formal analysis, Investigation, Writing the original draft. RS: Data curation, Methodology, Formal analysis, Investigation, Writing-review and editing. RT and ST: Data curation, Methodology, Formal analysis, Investigation. KM, AA, MK and MN: Sample acquisition, Investigation. FA: Formal analysis, Visualization, Methodology, Writing-review and editing. EE: Conceptualization, Resources, Data curation, Software, Formal analysis, Supervision, Funding acquisition, Validation, Investigation, Visualization, Methodology, Project administration, Writing-review and editing.
Disclosure of potential conflicts of interest
No potential conflicts of interest were disclosed.
Supplemental Material
Download ()Acknowledgments
Open Access funding was provided by the Qatar National Library.
We are grateful to patients for donating their samples. We also would like to thank the genomics core facility at Qatar Biomedical Research Institute for performing RNA-Sequencing.
Supplementary material
Supplemental data for this article can be accessed on the publisher’s website.
Additional information
Funding
References
- Tauriello DVF, Batlle E. Targeting the microenvironment in advanced colorectal cancer. Trends Cancer. 2016;2:495–12. doi:10.1016/j.trecan.2016.08.001.
- Balkwill FR, Capasso M, Hagemann T. The tumor microenvironment at a glance. J Cell Sci. 2012;125:5591–5596. doi:10.1242/jcs.116392.
- Nielsen JS, Nelson BH. Tumor-infiltrating B cells and T cells: working together to promote patient survival. Oncoimmunology. 2012;1:1623–1625. doi:10.4161/onci.21650.
- Quail DF, Joyce JA. Microenvironmental regulation of tumor progression and metastasis. Nat Med. 2013;19:1423–1437. doi:10.1038/nm.3394.
- Kuwahara T, Hazama S, Suzuki N, Yoshida S, Tomochika S, Nakagami Y, Matsui H, Shindo Y, Kanekiyo S, Tokumitsu Y, et al. Intratumoural-infiltrating CD4 + and FOXP3 + T cells as strong positive predictive markers for the prognosis of resectable colorectal cancer. Br J Cancer. 2019;121:659–665. doi:10.1038/s41416-019-0559-6.
- Ye L, Zhang T, Kang Z, Guo G, Sun Y, Lin K, Huang Q, Shi X, Ni Z, Ding N, et al. Tumor-infiltrating immune cells act as a marker for prognosis in colorectal cancer. Front Immunol. 2019;10:2368. doi:10.3389/fimmu.2019.02368.
- Galon J, Costes A, Sanchez-Cabo F, Kirilovsky A, Mlecnik B, Lagorce-Pages C, Tosolini M, Camus M, Berger A, Wind P, et al. Type, density, and location of immune cells within human colorectal tumors predict clinical outcome. Science. 2006;313:1960–1964. doi:10.1126/science.1129139.
- Reissfelder C, Stamova S, Gossmann C, Braun M, Bonertz A, Walliczek U, Grimm M, Rahbari NN, Koch M, Saadati M, et al. Tumor-specific cytotoxic T lymphocyte activity determines colorectal cancer patient prognosis. J Clin Invest. 2015;125:739–751. doi:10.1172/JCI74894.
- Sommerfeldt N, Beckhove P, Ge Y, Schutz F, Choi C, Bucur M, Domschke C, Sohn C, Schneeweis A, Rom J, et al. Heparanase: a new metastasis-associated antigen recognized in breast cancer patients by spontaneously induced memory T lymphocytes. Cancer Res. 2006;66:7716–7723. doi:10.1158/0008-5472.CAN-05-2363.
- Koch M, Beckhove P, Op den Winkel J, Autenrieth D, Wagner P, Nummer D, Specht S, Antolovic D, Galindo L, Schmitz-Winnenthal FH, et al. Tumor infiltrating T lymphocytes in colorectal cancer: tumor-selective activation and cytotoxic activity in situ. Ann Surg. 2006;244:986–92; discussion 92–3. doi:10.1097/01.sla.0000247058.43243.7b.
- Mlecnik B, Tosolini M, Kirilovsky A, Berger A, Bindea G, Meatchi T, Bruneval P, Trajanoski Z, Fridman WH, Pages F, et al. Histopathologic-based prognostic factors of colorectal cancers are associated with the state of the local immune reaction. J Clin Oncol. 2011;29:610–618. doi:10.1200/JCO.2010.30.5425.
- Toor SM, Murshed K, Al-Dhaheri M, Khawar M, Abu Nada M, Elkord E. Immune checkpoints in circulating and tumor-infiltrating CD4(+) T cell subsets in colorectal cancer patients. Front Immunol. 2019;10:2936. doi:10.3389/fimmu.2019.02936.
- Huang Y, Liao H, Zhang Y, Yuan R, Wang F, Gao Y, Wang P, Du Z. Prognostic value of tumor-infiltrating FoxP3+ T cells in gastrointestinal cancers: a meta analysis. PLoS One. 2014;9:e94376.
- Salama P, Phillips M, Grieu F, Morris M, Zeps N, Joseph D, Platell C, Iacopetta B Tumor-infiltrating FOXP3+ T regulatory cells show strong prognostic significance in colorectal cancer. J Clin Oncol. 2009;27:186–192. doi:10.1200/JCO.2008.18.7229.
- Saito T, Nishikawa H, Wada H, Nagano Y, Sugiyama D, Atarashi K, Maeda Y, Hamaguchi M, Ohkura N, Sato E, et al. Two FOXP3(+)CD4(+) T cell subpopulations distinctly control the prognosis of colorectal cancers. Nat Med. 2016;22:679–684. doi:10.1038/nm.4086.
- Sasidharan Nair V, Saleh R, Toor SM, Taha RZ, Ahmed AA, Kurer MA, Murshed K, Alajez NM, Abu Nada M, Elkord E. Transcriptomic profiling disclosed the role of DNA methylation and histone modifications in tumor-infiltrating myeloid-derived suppressor cell subsets in colorectal cancer. Clin Epigenetics. 2020;12:13. doi:10.1186/s13148-020-0808-9.
- Saleh R, Toor SM, Taha RZ, Al-Ali D, Sasidharan Nair V, Elkord E. DNA methylation in the promoters of PD-L1, MMP9, ARG1, galectin-9, TIM-3, VISTA and TGF-beta genes in HLA-DR(-) myeloid cells, compared with HLA-DR(+) antigen-presenting cells. Epigenetics. 2020;1–14. doi:10.1080/15592294.2020.1767373.
- Vishnubalaji R, Sasidharan Nair V, Ouararhni K, Elkord E, Alajez NM. Integrated transcriptome and pathway analyses revealed multiple activated pathways in breast cancer. Front Oncol. 2019;9:910.
- Malone BM, Tan F, Bridges SM, Peng Z. Comparison of four ChIP-Seq analytical algorithms using rice endosperm H3K27 trimethylation profiling data. PLoS One. 2011;6:e25260. doi:10.1371/journal.pone.0025260.
- Perez RO, Habr-Gama A, Dos Santos RM, Proscurshim I, Campos FG, Rawet V, Kiss D, Cecconello I. Peritumoral inflammatory infiltrate is not a prognostic factor in distal rectal cancer following neoadjuvant chemoradiation therapy. J Gastrointest Surg. 2007;11:1534–1540. doi:10.1007/s11605-007-0287-8.
- Gooden MJ, de Bock GH, Leffers N, Daemen T, Nijman HW. The prognostic influence of tumour-infiltrating lymphocytes in cancer: a systematic review with meta-analysis. Br J Cancer. 2011;105:93–103. doi:10.1038/bjc.2011.189.
- Bonertz A, Weitz J, Pietsch DH, Rahbari NN, Schlude C, Ge Y, Juenger S, Vlodavsky I, Khazaie K, Jaeger D, et al. Antigen-specific Tregs control T cell responses against a limited repertoire of tumor antigens in patients with colorectal carcinoma. J Clin Invest. 2009;119:3311–3321.
- Pages F, Berger A, Camus M, Sanchez-Cabo F, Costes A, Molidor R, Mlecnik B, Kirilovsky A, Nilsson M, Damotte D, et al. Effector memory T cells, early metastasis, and survival in colorectal cancer. N Engl J Med. 2005;353:2654–2666. doi:10.1056/NEJMoa051424.
- Amicarella F, Muraro MG, Hirt C, Cremonesi E, Padovan E, Mele V, Governa V, Han J, Huber X, Droeser RA, et al. Dual role of tumour-infiltrating T helper 17 cells in human colorectal cancer. Gut. 2017;66:692–704. doi:10.1136/gutjnl-2015-310016.
- Tosolini M, Kirilovsky A, Mlecnik B, Fredriksen T, Mauger S, Bindea G, Berger A, Bruneval P, Fridman WH, Pages F, et al. Clinical impact of different classes of infiltrating T cytotoxic and helper cells (Th1, th2, treg, th17) in patients with colorectal cancer. Cancer Res. 2011;71:1263–1271. doi:10.1158/0008-5472.CAN-10-2907.
- De Simone V, Pallone F, Monteleone G, Stolfi C. Role of TH17 cytokines in the control of colorectal cancer. Oncoimmunology. 2013;2:e26617. doi:10.4161/onci.26617.
- Ling A, Lundberg IV, Eklof V, Wikberg ML, Oberg A, Edin S, Palmqvist R. The infiltration, and prognostic importance, of Th1 lymphocytes vary in molecular subgroups of colorectal cancer. J Pathol Clin Res. 2016;2:21–31. doi:10.1002/cjp2.31.
- Kryczek I, Wei S, Zou L, Altuwaijri S, Szeliga W, Kolls J, Chang A, Zou W Cutting edge: th17 and regulatory T cell dynamics and the regulation by IL-2 in the tumor microenvironment. J Immunol. 2007;178:6730–6733. doi:10.4049/jimmunol.178.11.6730.
- Huang YH, Cao YF, Jiang ZY, Zhang S, Gao F. Th22 cell accumulation is associated with colorectal cancer development. World J Gastroenterol. 2015;21:4216–4224. doi:10.3748/wjg.v21.i14.4216.
- Trifari S, Kaplan CD, Tran EH, Crellin NK, Spits H. Identification of a human helper T cell population that has abundant production of interleukin 22 and is distinct from T(H)-17, T(H)1 and T(H)2 cells. Nat Immunol. 2009;10:864–871. doi:10.1038/ni.1770.
- Ling L, Zhao P, Yan G, Chen M, Zhang T, Wang L, Jiang Y. The frequency of Th17 and Th22 cells in patients with colorectal cancer at pre-operation and post-operation. Immunol Invest. 2015;44:56–69. doi:10.3109/08820139.2014.936445.
- Weber GF, Gaertner FC, Erl W, Janssen KP, Blechert B, Holzmann B, Weighardt H, Essler M. IL-22-mediated tumor growth reduction correlates with inhibition of ERK1/2 and AKT phosphorylation and induction of cell cycle arrest in the G2-M phase. J Immunol. 2006;177:8266–8272. doi:10.4049/jimmunol.177.11.8266.
- Zhang Z, Liu S, Zhang B, Qiao L, Zhang Y, Zhang Y. T Cell Dysfunction and Exhaustion in Cancer. Front Cell Dev Biol. 2020;8:17.
- Wherry EJ. T cell exhaustion. Nat Immunol. 2011;12:492–499. doi:10.1038/ni.2035.
- Schietinger A, Philip M, Krisnawan VE, Chiu EY, Delrow JJ, Basom RS, Lauer P, Brockstedt DG, Knoblaugh SE, Hammerling GJ, et al. Tumor-specific T cell dysfunction is a dynamic antigen-driven differentiation program initiated early during tumorigenesis. Immunity. 2016;45:389–401. doi:10.1016/j.immuni.2016.07.011.
- Saleh R, Taha RZ, Toor SM, Sasidharan Nair V, Murshed K, Khawar M, Al-Dhaheri M, Petkar MA, Abu Nada M, Elkord E. Expression of immune checkpoints and T cell exhaustion markers in early and advanced stages of colorectal cancer. Cancer Immunol Immunother. 2020. doi:10.1007/s00262-020-02593-w.
- Hong JJ, Amancha PK, Rogers K, Ansari AA, Villinger F. Re-evaluation of PD-1 expression by T cells as a marker for immune exhaustion during SIV infection. PLoS One. 2013;8:e60186. doi:10.1371/journal.pone.0060186.
- Schinzari V, Timperi E, Pecora G, Palmucci F, Gallerano D, Grimaldi A, Covino DA, Guglielmo N, Melandro F, Manzi E, et al. Wnt3a/beta-catenin signaling conditions differentiation of partially exhausted T-effector cells in human cancers. Cancer Immunol Res. 2018;6:941–952. doi:10.1158/2326-6066.CIR-17-0712.
- Han CC, Yue LL, Yang Y, Jian BY, Ma LW, Liu JC. TOX3 protein expression is correlated with pathological characteristics in breast cancer. Oncol Lett. 2016;11:1762–1768. doi:10.3892/ol.2016.4117.
- Seksenyan A, Kadavallore A, Walts AE, de la Torre B, Berel D, Strom SP, Aliahmad P, Funari VA, Kaye J. TOX3 is expressed in mammary ER(+) epithelial cells and regulates ER target genes in luminal breast cancer. BMC Cancer. 2015;15:22.
- Wang S, Beeghly-Fadiel A, Cai Q, Cai H, Guo X, Shi L, Wu F, Ye Q, Qiu, Y, et al. Gene expression in triple-negative breast cancer in relation to survival. Breast Cancer Res Treat. 2018;171:199–207. doi:10.1007/s10549-018-4816-9.
- Bardhan K, Liu K. Epigenetics and colorectal cancer pathogenesis. Cancers (Basel). 2013;5:676–713. doi:10.3390/cancers5020676.
- Goel A, Boland CR. Epigenetics of colorectal cancer. Gastroenterology. 2012;143:1442–60 e1. doi:10.1053/j.gastro.2012.09.032.
- Sarthy JF, Henikoff S, Ahmad K. Chromatin Bottlenecks in Cancer. Trends Cancer. 2019;5:183–194. doi:10.1016/j.trecan.2019.01.003.
- Yang R, Cheng S, Luo N, Gao R, Yu K, Kang B, Wang L, Zhang Q, Fang Q, Zhang L, et al. Distinct epigenetic features of tumor-reactive CD8+ T cells in colorectal cancer patients revealed by genome-wide DNA methylation analysis. Genome Biol. 2019;21:2. doi:10.1186/s13059-019-1921-y.
- Dagdemir A, Durif J, Ngollo M, Bignon YJ, Bernard-Gallon D. Histone lysine trimethylation or acetylation can be modulated by phytoestrogen, estrogen or anti-HDAC in breast cancer cell lines. Epigenomics. 2013;5:51–63. doi:10.2217/epi.12.74.
- Ngollo M, Dagdemir A, Judes G, Kemeny JL, Penault-Llorca F, Boiteux JP, Lebert A, Bignon YJ, Guy L, Bernard-Gallon D. Epigenetics of prostate cancer: distribution of histone H3K27me3 biomarkers in peri-tumoral tissue. OMICS. 2014;18:207–209. doi:10.1089/omi.2013.0117.
- Khan AA, Lee AJ, Roh TY. Polycomb group protein-mediated histone modifications during cell differentiation. Epigenomics. 2015;7:75–84. doi:10.2217/epi.14.61.
- Sauvageau M, Sauvageau G. Polycomb group proteins: multi-faceted regulators of somatic stem cells and cancer. Cell Stem Cell. 2010;7:299–313. doi:10.1016/j.stem.2010.08.002.
- Kerppola TK. Polycomb group complexes–many combinations, many functions. Trends Cell Biol. 2009;19:692–704. doi:10.1016/j.tcb.2009.10.001.
- Ngollo M, Lebert A, Daures M, Judes G, Rifai K, Dubois L, Kemeny JL, Penault-Llorca F, Bignon YJ, Guy L, et al. Global analysis of H3K27me3 as an epigenetic marker in prostate cancer progression. BMC Cancer. 2017;17:261. doi:10.1186/s12885-017-3256-y.
- Kinoshita T, Muramatsu R, Fujita T, Nagumo H, Sakurai T, Noji S, Takahata E, Yaguchi T, Tsukamoto N, Kudo-Saito C, et al. Prognostic value of tumor-infiltrating lymphocytes differs depending on histological type and smoking habit in completely resected non-small-cell lung cancer. Ann Oncol. 2016;27:2117–2123. doi:10.1093/annonc/mdw319.
- Droeser R, Zlobec I, Kilic E, Guth U, Heberer M, Spagnoli G, Oertli D, Tapia C. Differential pattern and prognostic significance of CD4+, FOXP3+ and IL-17+ tumor infiltrating lymphocytes in ductal and lobular breast cancers. BMC Cancer. 2012;12:134. doi:10.1186/1471-2407-12-134.
- McArdle PA, Canna K, McMillan DC, McNicol AM, Campbell R, Underwood MA. The relationship between T-lymphocyte subset infiltration and survival in patients with prostate cancer. Br J Cancer. 2004;91:541–543. doi:10.1038/sj.bjc.6601943.
- Cui G. TH9, TH17, and TH22 cell subsets and their main cytokine products in the pathogenesis of colorectal cancer. Front Oncol. 2019;9:1002.
- Deschoolmeester V, Baay M, Lardon F, Pauwels P, Peeters M. Immune cells in colorectal cancer: prognostic relevance and role of MSI. Cancer Microenviron. 2011;4:377–392. doi:10.1007/s12307-011-0068-5.
- Al-Barrak J, Gill S. Presentation and outcomes of patients aged 30 years and younger with colorectal cancer: a 20-year retrospective review. Med Oncol. 2011;28:1058–1061. doi:10.1007/s12032-010-9639-4.
- Chou CL, Chang SC, Lin TC, Chen WS, Jiang JK, Wang HS, Yang SH, Liang WY, Lin JK. Differences in clinicopathological characteristics of colorectal cancer between younger and elderly patients: an analysis of 322 patients from a single institution. Am J Surg. 2011;202:574–582. doi:10.1016/j.amjsurg.2010.10.014.