
ABSTRACT
Lymph-node metastasis is a prognosis factor for poor clinical outcome of breast cancer patients. Currently, how breast cancer cells establish pre-metastatic niche in the tumor-draining lymph nodes (TDLNs) is still unclear. To address this question, we isolated heterogeneous cells including immune and stromal cells from naive lymph nodes (LNs) of the FVB/NJ mice and TDLNs of the MMTV-PyMT mice. Single-cell RNA sequencing was performed to investigate the transcriptome of the cells and various bioinformatics analyses were used to identify the altered pathways. Our results revealed several significant changes between naïve LNs and TDLNs. First, according to immunologic signature and pathway analysis, CD4+ and CD8 + T cells showed upregulated angiogenesis pathway genes and higher regulatory T (Treg)-associated genes while they demonstrated downregulation of interferon response and inflammatory response gene signatures, concurrently suggesting an immunosuppressive microenvironment in the TDLNs. Second, profiling of B cells showed down-regulation of marginal zone B lymphocytes in the TDLNs, which was validated by flow cytometric analysis. Third, we found the enhancement of oxidative phosphorylation pathway in the fibroblastic reticular cells (FRCs) of the MMTV-PyMT mice and the elevation of related genes including Prdx3, Ndufa4 and Uqcrb, suggesting massive ATP consumption and TCA cycle metabolism in the FRCs. Collectively, our results reveal the reprogramming of TDLNs during breast cancer progression at single-cell level in a spontaneous breast cancer model and suggest the changes in immune modulation and metabolic switch are key alterations in the preparation of pre-metastatic niche by breast cancer cells.
Introduction
Tumor metastasis is the major cause of the death of cancer patients. Human cancers metastasize to distant organs through blood and lymphatic circulating systems.Citation1,Citation2 Spreading of cancer cells via poorly-organized blood vessels induced by tumor-derived angiogenic factors like vascular endothelial growth factors (VEGFs) has been shown to be a main route for metastasis in many cancers.Citation3,Citation4 However, some tumors including breast cancer and melanoma are prone to disseminate via lymphatic system.Citation5,Citation6 Although lymph node invasion is strongly associated with increased metastasis and poor clinical outcome, the underlying mechanism of lymphatic metastasis has not been well-characterized till now.
The first step in lymphatic metastasis is the induction of lymphangiogenesis. Cancer cells produce pro-lymphangiogenic proteins like VEGF-C to stimulate the proliferation of lymphatic endothelial cells (LECs) and the formation of new lymphatic capillaries.Citation7,Citation8 The newly organized vessels connect to the nearby lymph nodes and these tumor-draining lymph nodes (TDLNs) are the first organs of metastasis. The infrastructure of lymph nodes composes several major components including immune cells, fibroblastic reticular cells (FRCs) and LECs. T cells at paracortex zone and B cells at cortex area play important roles in the surveillance of pathogenic materials and the elicitation of immune response.Citation9,Citation10 FRCs and LECs constitute the reticular meshwork for trafficking, priming and activation of immune cells.Citation11–14 In addition to being able to create a three-dimensional stromal network, FRCs also produce abundant extracellular matrix proteins and form the conduit structure for quickly transporting antigens and signaling molecules into the parenchyma of LNs.Citation13 Another critical issue receiving much attention is the crosstalk between different cell types within complex tissue microenvironment. By establishing a novel method to study enzymatic activities in single cells, Miller et al explored the intracellular metabolic alterations in different immune cell populations in normal and cancerous colon tissues and demonstrated a reduced oxygen consumption rate/extracellular acidification rate in the tumor part.Citation15 Similarly, a significant change in metabolic configurations was also found in breast cancer. The term immunometabolism has been used to explain the intimate relationship between metabolic regulation and immune functionality.Citation16 Metabolic reprogramming in cancer cells, endothelial cells, or fibroblasts may promote the release of metabolites, lipids, and amino acids to alter immune cell function that leads to dysregulation of immunity in human diseases including cancer.Citation17 This also opens a new avenue for drug development to treat diseases.Citation18
Emerging evidence demonstrate that cancer cells can induce the remodeling of TDLNs to form the pre-metastatic niche before invading into LNs.Citation19,Citation20 However, our understanding on the structural alteration and genetic change in the TDLNs is still at premature stage. By using cell enrichment and RNA sequencing, a recent study showed the mechanisms of lymphovascular niche formation in the TDLNs of 4T1 breast cancer and B16F10 melanoma orthotopic animal models and identified integrin αIIb as a differentially upregulated gene in LECs, which may facilitate LEC adhesion to fibrinogen in vitro and in vivo.Citation21 Although this study provides interesting findings for the study of TDLN remodeling, only the transcriptional profile of LECs was addressed. In addition, whether the syngeneic animal models by directly inoculating a huge number of cancer cells into mice can precisely recapitulate cancer progression in vivo should be considered.
Tissue-specific expression of the polyomavirus middle T antigen under the control of the mouse mammary tumor virus promoter/enhancer (known as the MMTV-PyMT model) induces luminal-type mammary tumors with high level of lymph node and pulmonary metastasis in transgenic mice.Citation22,Citation23 This model has been widely used for the study of breast cancer initiation, promotion, and progression. Our study was carried out to reveal how breast cancer cells prepare a favored lymph-node microenvironment for metastasis. To mimic naturally occurring breast tumorigenesis, we used the MMTV-PyMT mice as a study model. Moreover, we investigated the transcriptomes of immune cells and FRCs in the TDLNs by using single-cell RNA sequencing (scRNA-seq) to address the changes of expression profiles in these cells. Finally, bioinformatics analyses were performed to identify the altered pathways. Our results provide new insights into how breast cancer cells affect the population of immune cells and reprogram the metabolism of FRCs in the TDLN at early metastatic stage of breast cancer.
Materials and methods
Mice
The FVB/NJ and MMTV-PyMT mice were kindly provided by Dr. Susan Waltz (University of Cincinnati, USA) and FVB/NJ mice were purchased from National Laboratory Animal Center (Taipei, Taiwan). Mice were housed in SPF environment with a 12:12-h light/dark cycle photoperiod. All studies were approved by the Animal Care Committee of National Health Research Institutes.
Preparation of single cell suspension
To isolate cells from LNs, FVB/NJ, and MMTV-PyMT mice (at the age of 11 weeks) were euthanized by inspiration of 5% CO2. For scRNA-seq experiments, two axillary and two inguinal LNs were dissected from one each of normal and tumor-bearing mouse and were stored in ice-cold RPMI1640 medium with 10% fetal bovine serum (FBS). LNs were ground with syringe rubber in 70 μm cell strainer (Meltenyi Biotec). Flow through containing immune cells and tissue debris was collected. Tissue debris which contained FRCs were further incubated with digest mixture: 1 mg/ml collagenase type IV (V900893, Sigma Aldrich), 0.2 mg/ml collagenase P (11213857001, Sigma Aldrich), 0.1 mg/ml DNaseI (10104159001, Sigma Aldrich), 5 U/ml Dispase (#07913, Stem Cell Tech) for 40 min at 37°C. Single cell suspension was subjected to isolation of vimentin-positive FRCs by using MoFlo-XDP cell sorter (Beckman Coulter). Finally, cells were stained with Acridine Orange/PI and the viability of immune cells and FRCs was determined using an automated cell counter (LUNA-FLTM). All procedures were carried out on ice, and were completed less than 1.5 h.
Sequencing library construction using the 10x chromium single cell 3ʹ platform
Pooled cell suspension containing FRCs and immune cells, reagents, and a single gel bead containing barcoded oligonucleotides were encapsulated into nano-liter size gel bead in emulsion (GEMs) using the GemCode Technology per the manufacturer’s instructions (Single Cell 3ʹ Reagent Kits v2, PN-120237). Lysis and barcoded reverse transcription of polyadenylated mRNA from single cells were performed inside each GEM. Libraries were sequenced on an Illumina HiSeq4000 set to yield 150 M reads and mapped to the mice genome (mm10) using Cell Ranger version 2.1.1 (10x Genomics). Sample demultiplexing, cellular barcode and unique molecular identifier (UMI) filtering, and generation of the gene-cell matrix were also performed with the Cell Ranger programs.
Preprocessing of scRNA-seq data
Low-quality cells were excluded using the following criteria: i) cells with low library size, defined as the total sum of UMI counts over all genes, being considered to be of low quality as the RNA has not been efficiently captured; ii) cells with low complexity, defined as the number of genes with non-zero counts, indicative of poor quality as the diverse transcript population has not been successfully captured; and iii) dead or dying cells, i.e., cells with high proportion of library size in the list of mitochondrial-related genes. For the FVB/NJ samples, we removed 56 cells and 70 cells based on low library size and low complexity, respectively, using a threshold of 2 median absolute deviations (MADs) below the median (log2 scale) and removed 17 dead or dying cells with more than 10% proportion of library size in mitochondrial genome (Supplementary Figure S1A-S1C). From the remaining 1741 cells, we used the computational approach developed by Scialdone and colleagues to estimate the cell cycle phase.Citation24 To reduce the confounding effects of cell cycle, the 1682 cells in G1 phase were selected for subsequent analysis. We further filtered out 18439 (65.9%) low-abundance genes using a threshold of average UMI counts <0.01 (Supplementary Figure S1D). The remaining 9559 genes were used to remove any cell-specific biases in capture efficiency of transcript. For each cell in FVB/NJ sample, normalized UMI count was defined as the division of the UMI count by the library size (of these 9559 genes) over 10,000. Each normalized UMI count was transformed to log2 scale, after adding 1 for avoiding undefined values at 0. For the MMTV-PyMT sample; data filtering and normalization were conducted in the same manner as described in the FVB/NJ sample. After this preprocessing, a total of 1570 cells across 9634 genes were performed to combine with the data from FVB/NJ sample (Supplementary Figure S2A-S2D). As a result, 3252 cells across common 9182 genes were used for subsequent analysis.
Highly variable genes (HVGs)
To identify the highly variable genes (HVGs) that are driving heterogeneity across the distinct population of cells and represent their functional characteristic, a LOWESS (locally weighted scatterplot smoothing) curve was used to fit the mean vs. variance of normalized UMI counts and then used to decompose the variance of each gene into a biological component and a technical component, as implemented in two functions, trendVar and decomposeVar in the scran R package. HVGs are those genes with the significance levels of biological components. At false discovery rate (FDR) of 5%, a total of 721 genes were identified. For dimension reduction, these HVGs were further reduced to the top nine principal components based on a knee-point in the scree plot. These principal components of the cells were summarized into 2-dimensional points in the scatter plot using t-distributed stochastic neighbor embedding (t-SNE), as implemented in the Rtsne R package.Citation25
Annotation of cell types
Based on these HVGs, an unsupervised consensus clustering tool Single-Cell Consensus Clustering (SC3) was used to identify the cell clusters of 3,252 cells in FVB/NJ and MMTV-PyMT samples, as implemented in the SC3 R package.Citation26 It constructed several distance metrics and transformed them using either principal component analysis (PCA) or by calculating the eigenvectors of the associated graph Laplacian distance matrices into k-means clustering. A total of 7 clusters were identified and are referred to as Cluster1–Cluster7. There are 702, 546, 1720, 167, 44, 4 and 69 cells in Cluster1- Cluster7 respectively.
To annotate these clusters, we selected 6, 3, 4, 2, 4, 8, and 5 genes as markers of T cells, cytotoxic T cells, exhausted T cells, regulatory T cells (Tregs), naïve T cells, B cells and fibroblasts (FRCs) respectively. We identified Cluster1- Cluster4 as CD8 + T cells, B cells, CD4 + T cells and Tregs, respectively, because typical markers including Cd8a (CD8 + T cells), Cd4 (CD4 + T cells), Foxp3 (Tregs), and Cd79a (B cells) showed strong association with these clusters. We also identified Cluster5 and Cluster7 as FRCs based on the over-expression of gene vimentin (VIM) and these clusters being close in the t-SNE plot. Because only 4 cells were in Cluster6 and some isolated cells were far away from their primary cluster in the t-SNE plot, we manually annotated these cells to their closest cluster. As a result, a total of 716, 1735, 151, 552, and 98 cells were annotated as CD8 + T cells, CD4 + T cells, Tregs, B cells and FRCs, respectively.
Subclusters of cell types
The subcluster in B cells and FRCs were identified in the same manner as described above. In more details, 155 genes and 34 genes were identified as HVGs in FRCs and B cells, respectively. For FRCs, 4 subclusters were identified using SC3 and are referred to as FRCs-cluster1-FRCs-cluster4. However, no subcluster was identified in B cells based on the estimation of group number using SC3.
Gene set variation analysis (GSVA)
To explore whether any gene set/biological pathway is enriched differentially between FVB/NJ and MMTV-PyMT samples, we used GSVA (Gene Set Variation Analysis), a Gene Set Enrichment Analysis (GSEA)-based method that estimates variation of pathway activity over a sample population in an unsupervised way.Citation27,Citation28 It applies the Kolmogorov–Smirnov-like random walk statistic to compare the distribution of rank-based gene expression within an a priori defined gene set with one without that gene, to assess the enrichment score (ES) of a target gene set in each cell. Each ES represents the degree to which the genes in a target gene set are coordinately up- or down-regulated within a cell. For each target gene set, we compared the mean of ESs from the cells in the FVB/NJ sample with that in the MMTV-PyMT sample using t-test. In this study, the target gene sets include 50 hallmark gene sets, 186 KEGG gene sets, and 4872 immunologic signatures in the molecular signatures database (version 6.2) from GSEA software website.Citation29,Citation30 For GSVA, the function gsva in the GSVA R package was implemented.
Statistical analysis
To identify differentially enriched gene sets/genes between the FVB/NJ and MMTV-PyMT samples, a t-test was used in immune cells (CD8 + T cells, CD4 + T cells, Tregs and B cells) and a linear regression with adjustment for 4 subclusters was used in FRCs.
To address the multiple comparison issue, we report the q-value using the qvalue package in R. A gene set was claimed to be differentially expressed if the q-value was < 0.1. Heatmap representations with dendrograms were plotted using the pheatmap R package. The pathway graph and genes marked in the graph were plotted using the pathview R package. All data were analyzed using R statistical software (version 3.5.2).
Antibodies and flow cytometry
Anti-CD3 (17A2, cat. 561388), anti-CD4 (RM4-5, cat. 553047), anti-CD44 (IM7, cat. 561859), anti-CD62L (MEL-14, cat. 560516), anti-B220 (RA3-6B2, cat. 553091), anti-Foxp3 (MF23, cat. 562996) and anti-CD23 (B3B4, cat. 561772) were purchased from BD company (Franklin Lakes, NJ, USA). Anti-CD8a (53–6.7, cat. 100734), anti-IgM (RMM-1, cat. 406531) and anti-CD21 (7E9, cat. 123411) were obtained from BioLegend (San Diego, CA, USA). For flow cytometry experiments, total eight axillary LNs were dissected from four each of normal and tumor-bearing mice and pooled separately. Cells were harvested and washed with 1X PBS. Cells were stained with antibodies within 1:100 dilution for 40 min at 4°C with gentle mix, then washed with 1X PBS prior to Attune NxT cytometer (Thermo Fisher Scientific) analysis. For Foxp3 staining, cells were mixed with 1 ml of Fix/Perm solution and incubated at room temperature for 15 min. Cells were washed with 1X PBS and stained with anti-Foxp3 antibody for flow cytometry analysis.
Oxygen consumption assay
We used the MitoXpressXtra assay (Agilent Technologies, Luxcel Biosciences) to determine extracellular oxygen consumption rates (OCR). Mouse FRCs were treated with control media or the conditioned media of 4T1 mouse breast cancer cells or MMTV-PyMT cancer cells isolated from mice for 48 h. After incubation, cells were washed with 1X PBS and the MitoXpress-Xtra-HS probe was added to cells in accordance with manufacturer’s instructions. Oxygen consumption was measured using time-resolved fluorescence (TR-F) with a dual delay of 30 μs and 70 μs using a CLARIOstar fluorescence plate reader (BMG Labtech).
Results
Quantitative alteration of the major cell types in the TDLNs of the MMTV-PyMT mice
Luminal and HER2-enriched subtypes of breast cancer are highly correlated with lymph-node metastases and poor outcome.Citation31 The MMTV-PyMT mice develop spontaneous mammary tumors that closely resemble the progression and morphology of human breast cancers and form palpable tumors around 8–9 weeks after birth. Previous study and our preliminary results showed that tumor cells in the MMTV-PyMT mice invade into the TDLNs at around 3.5 months.Citation32 To investigate early remodeling in TDLNs, we collected the TDLNs from the female MMTV-PyMT mice and the naive LNs from the FVB/NJ mice at the age of 11 weeks for comparison. Viable cells were collected and subjected to scRNA-seq experiments. After data preprocessing including quality control to remove cells of low quality, 3252 cells were subject to further analyses. Of these, 1570 cells were originated from the TDLNs of the MMTV-PyMT mice and 1682 cells were from the naive LNs of the FVB/NJ mice. We identified 721 highly variable genes (HVGs) that account for heterogeneity across the distinct population of cells and represent their functional characteristics. Based on these HVGs, all of those 3522 cells were grouped into 7 clusters using SC326, a tool for unsupervised clustering of cells for scRNA-seq data, and then visually summarized in the scatter plot using t-SNE. The color-coded distribution of cells by sample origin (MMTV-PyMT and FVB/NJ) or by cluster ID from SC3 clustering were as represented in and , respectively. Using classical immunophenotyping markers, we initially identified T cells, cytotoxic T cells, exhausted T cells, regulatory T cells (Tregs), naïve T cells, B cells, and fibroblasts (FRCs) (Supplementary Figure S3). Finally, 5 types of cells, including 4 types of immune cells (CD8 + T cells, CD4 + T cells, Tregs and B cells), and FRCs, were considered informative and of interest to this study; as a result, a total of 716, 1735, 151, 552, and 98 cells were identified as CD8 + T cells, CD4 + T cells, Tregs, B cells and FRCs .
Figure 1. Overview of the 3,252 high quality cells collected from the TDLNs of MMTV-PyMT and the naive lymph nodes of FVB/NJ mice
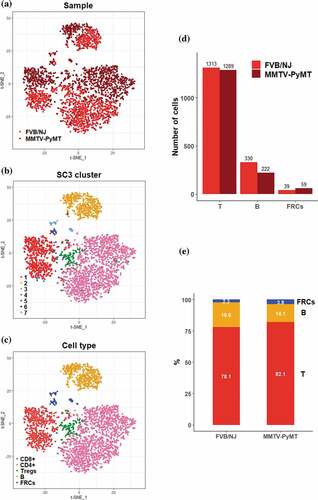
We further analyzed the fraction of those T cells, B cells, and FRCs in FVB/NJ and MMTV-PyMT samples. Among those three major cell fractions, T cells exhibited a 50:50 proportion (1313 vs. 1289) between the FVB/NJ and MMTV-PyMT samples while B cells exhibited a 60:40 proportion (330 vs. 222, ). Interestingly, FRCs expressing vimentin (Vim) exhibited a 40:60 proportion (39 vs. 59). The fraction proportions of these major cells in each sample were shown in , which demonstrated proportions for T cells, B cells, and FRCs in the FVB/NJ and MMTV-PyMT samples were 78% vs 82%, 20% vs 14%, and 2% vs 4%, respectively.
Change of gene expression patterns in the T cells sub-populations in TDLNs
Within the aforementioned 3252 cells, T cells represented the most prevalent cell type and can be further categorized into 3 subtypes, which were CD8 + T cells, CD4 + T cells, and Treg cells, represented by expression of Cd8a, Cd4, and Foxp3, respectively, and . To explore molecular pathways changed between T cells in tumor-bearing TDLNs and those in naïve LNs, we performed GSVA27 utilizing hallmark gene sets26 and immunological signature (C7) gene sets in the molecular signatures databases (MSigDB)25. The significantly altered pathways in the 50 hallmark pathways at a false discovery rate of 0.1 (q-value < 0.1) were as shown in . Among them, angiogenesis gene set was most significantly upregulated, with q values = 5.73E-17, 8.51E-8 and 0.25 in CD4 + T cells, CD8 + T cells and Treg cells, respectively. These data suggest that T cells, especially those of CD4+ and CD8+ may contribute to the increased angiogenesis in TDLNs. In support of these notions, it was reported that CD4 + T cells, particularly Th2 and Th17 may enhance angiogenesis and myogenesis in ischemic injuries.Citation33 In addition to angiogenesis gene set, the estrogen response (ER) gene set/pathway, an important signaling pathway for the progression of breast cancer, was also significantly upregulated in CD4 + T cells of TDLNs. Since previous studies have shown that ERα may directly bind to the promoter region of RORγt to suppress Th17 differentiation and functionCitation34 and that ERα in T cells may inhibit follicular helper T cell responses to prevent autoimmunity,Citation35 our finding that ER signaling is upregulated may represent suppressed immunity in CD4 + T cells of TDLNs. Contrarily, GSVA/hallmark pathway analysis revealed significant downregulation of interferon alpha response, interferon gamma response, allograft rejection pathway, and inflammatory response in CD4 + T cells , all implicating attenuated anti-tumor immunity of the cells in TDLNs. From the perspective of immunological signature analysis, the most significant alteration was in gene set related to Eos/Foxp3-mediated Treg cell transcriptional controlCitation36 . Interestingly, several gene sets representing signature of elevated Treg activity were upregulated significantly in almost all T cells in TDLNs, suggesting the activation of Tregs and immune suppressive environment in TDLNs.
Figure 2. Differential transcriptomic analysis of T cells between the FVB/NJ and MMTV-PyMT samples
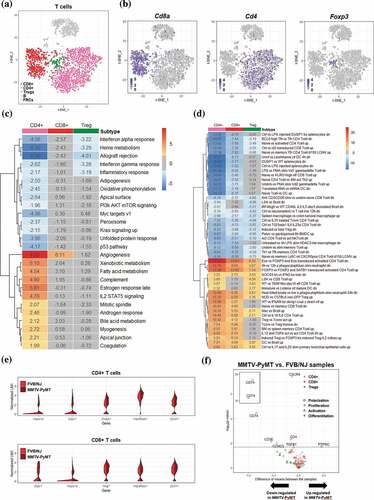
In addition to the above pathway-level analysis, we also performed analysis at single gene level to identify differentially expressed genes (DEGs, Supplementary Table S1) whose expression levels were significantly altered between cells from TDLNs and those from naïve LNs. Among the top upregulated DEGs identified in the CD4 + T cells were genes encoding heat shock proteins, including Dnaja1, Dapl, Hspa1a, Dapl and Hsp90ab1, whose expression patterns were represented by violin plot in . Interestingly, these chaperone proteins are known to be involved in immune modulation. For examples, Hspa1a encodes a heat shock protein which is a member of Hsp70 family; HSP70 in combination with IL-2 may enhance secretion of the immunosuppressive cytokines IL-10 and TGF-β from Tregs cells, while attenuating the activity of CD4+ CD25− naive T cells.Citation37 Dapl1 expressed on Nrp-1-negative cells may represent a subgroup of peripherally induced Tregs cells with immunosuppressive activity.Citation38 Moreover, Hsp90ab1, a member of the Hsp90 family, has been shown to play a role in the regulation of autoimmunity and transplant rejection.Citation39
We next examined the relation between those DEGs and markers of the status characteristics of cells including polarization, proliferation, activation and differentiation. A total of 28 genes were selected as markers for those characteristics (Supplementary Table S1). At q < 0.1, significant DEGs among those markers were shown in the volcano plot . For CD4 + T cells, all markers of proliferation (Cxcr4), polarization (Cxcr4, Tgfb1 and Cd4), and differentiation (Cd74 and Cd4) were significantly downregulated in TDLNs samples. For CD8 + T cells, only differentiation marker Cd74 was found and downregulated significantly. For Treg cells, Ptprc, also known as Cd45, a marker for both proliferation and differentiation, was found significantly upregulated. Since Cd45 has been known for its role in Treg activation,Citation40 the upregulation of Cd45 expression could implicate increase in the activity of Treg cells in TDLNs.
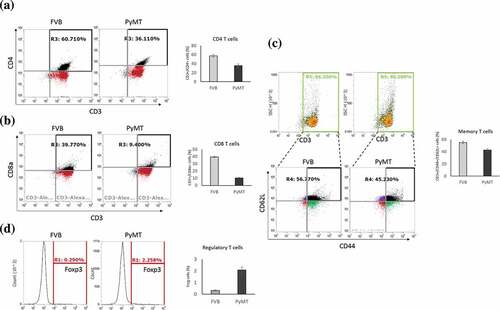
To relate the results of our bioinformatics analysis to the gold-standard cell quantification assays, we analyzed T cell subpopulations in independent FVB/NJ and MMTV-PyMT samples using flow cytometry and found that the percentages of CD4+ and CD8 + T cells were decreased in the MMTV-PyMT samples and . On the contrary, the population of Treg cells was dramatically increased . Memory T cells were also reduced in the MMTV-PyMT samples . Combined together, these data suggested that T cells in the TDLNs undergo remodeling during early metastasis and that alteration of gene expression in the Treg cells may create an immunosuppressive environment to facilitate colonization of cancer cells.
Figure 3. Alterations of T cell subpopulationss in the TDLNs
Decrease of marginal zone B cells in TDLNs
Using B cells markers (Cd79a, Cd79b, Cd19, Cd22, Cd24a, Cd72, Blnk, and Ms4a1) to identify 552 B cells, we found no subcluster among these cells using SC3 . Interestingly, upon GSVA/hallmark gene set analysis of B cells, a significant upregulation of angiogenesis pathway in TDLNs compared to naïve LNs samples, similar to what was found in T cells, was again observed. Our finding that angiogenesis pathway is upregulated in B cells is consistent to previous study that tumor-associated B cells contribute to tumor progression by promoting tumor angiogenesis.Citation41 On the other hand, significant downregulation of interferon gamma pathway, PI3K-AKT-mTOR signaling, glycolysis, and TNFα signaling via NFκB were found. Similar to what was observed in T cells, B cells in TDLNs also undergo reprogramming in their transcriptional profiles that reflect phenotypes of suppressed immunity and decreased proliferation. In support of these notions, it was reported that tumors of MMTV-PyMT mice may secrete molecules to inhibit B-cell proliferation and maturation directly,Citation42 and the noncanonical NF-κB pathway is well known for its role in B cell maturation.Citation43
Figure 4. Differential transcriptomic analysis of B cells between the FVB/NJ and MMTV-PyMT samples
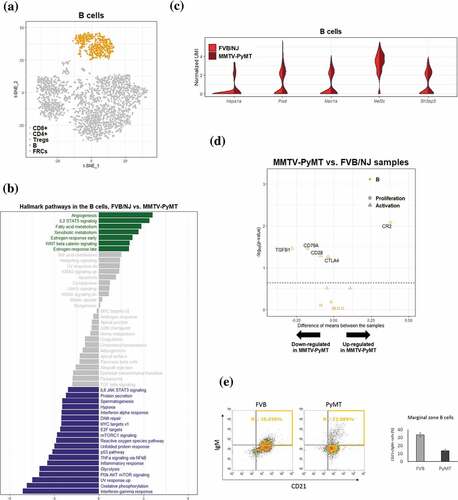
The expression profiles of a number of identified DEGs for B cells were shown as in and . Among these DEGs, the transcription factor Mef2c has been shown to be required by B-cell proliferation and survival.Citation44,Citation45 In addition, Mef2c may protect lymphopoiesis of B cells during stress by controlling proper expression of B-cell specific genes.Citation46 Sh3bp5 participates in the inhibition of the enzymatic activity of Bruton’s tyrosine kinase, a key regulator in B-cell development.Citation47 Expression of Sh3bp5 was moderately increased in the MMTV-PyMT samples, suggesting that Sh3bp5 may repress the development or maturation of B cells in TDLNs. Genes involved in B cell proliferation and activation were further investigated. It is interesting to note that Cr2, a well-known complement receptor which form a co-receptor on B cells during antigen-induced activation,Citation48 was significantly upregulated; Tgfb1, a potent regulator of B cells development from pre-B cells to immunoglobin secreting plasma cells,Citation49 was significantly down-regulated . Accumulating evidences indicate that secreted tumor products can also influence on distant immunological compartments, including lymphopoiesis. For example, decreased B cell numbers had been reported in tumor-bearing mice.Citation50 Conversely, another study showed that primary tumors induced pro-tumor B cell accumulation in the TDLNs, and B cells promoted lymph-node invasion by producing pathogenic IgG that targeted glycosylated membrane protein HSPA4 to activate downstream pathway in tumor cells to enhance metastasis.Citation51 Although the roles of B cells and their derived antibodies in the formation of pre-metastatic niche are poorly understood, the reprogramming of B cells in TDLNs can be a critical step for lymph-node metastasis.
To gain confidence on the bioinformatics analyses, flow cytometric analysis was also applied to confirm the reduction of marginal zone B cells in the MMTV-PyMT samples . These results suggested that populations of B cells in TDLNs undergo reprogramming as reflected by alterations of their transcriptional profiles.
Metabolic switch in FRCs of TDLNs
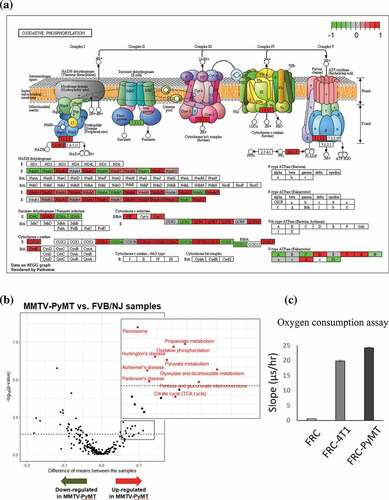
Based on relatively stringent criteria to remove low-quality cells, a total of 98 FRCs were identified using the expression of marker gene Vim and these cells were classified into 4 subclusers using SC3 . Based on GSVA, 18 hallmark pathways were significantly associated with transcriptional alterations between FRCs in TDLNs and those in naive LNs (q-value < 0.1; ). Intriguingly, oxidative phosphorylation (OXPHOS) pathway and peroxisome pathway were among the top 3 significantly upregulated pathways in TDLNs. Several genes involved in OXPHOS were selected and their differential expression (p-value < 0.05) represented by violin plot were shown in . Among them, cytochrome c oxidase subunit 7 C (Cox7c), which catalyzes the electron transfer from reduced cytochrome c to oxygen, is a subunit of complex IV of mitochondrion; NADH dehydrogenase flavoprotein 2 (Ndufv2) is a subunit of complex I that catalyzes the transfer of electrons from NADH to ubiquinone; Ndufa4 functioning as a NADH dehydrogenase with oxidoreductase activity on complex I;Citation52 Ubiquinol-cytochrome c reductase, complex III sub-unit XI (Uqcr11) may function as a binding factor for the iron-sulfur protein in complex III, which is ubiquitous expressed in human cells; Peroxiredoxin-5 (Prdx5) is a peroxidase that can use cytosolic or mitochondrial thioredoxins to reduce alkyl hydroperoxides or peroxynitrite. PRDX5 has been shown to be a cytoprotective antioxidant enzyme that inhibits endogenous or exogenous peroxide accumulation.Citation53 Our data are consistent to previous finding that FRCs in TDLNs immediately downstream of tumors undergo an altered function of FRCs’ mitochondria;Citation54 our analysis further suggested a significantly upregulated OXPHOS pathway activity in FRCs of TDLNs. We also summarized the genes differentially expressed in OXPHOS pathways annotated by KEGG database. Interestingly, among 47 upregulated mitochondrial genes encoding proteins of respiratory chain, 27 genes are from complex I, 1 complex II, 6 complex III, 9 complex IV, and 4 complex V . These observations suggested a massive ATP consumption and consequently possible DNA damage followed by OXPHOS may occur during tumor progression in the TDLNs. To validate the change of OXPHOS pathway, we investigated extracellular oxygen consumption rates (OCR) in FRCs treated with or without the conditioned media of 4T1 mouse breast cancer cells or MMTV-PyMT cancer cells. Significant increase of OCR was found in the FRCs treated with the conditioned media of breast cancer cells .
Figure 5. Differential transcriptomic analysis of FRCs between the FVB/NJ and MMTV-PyMT samples
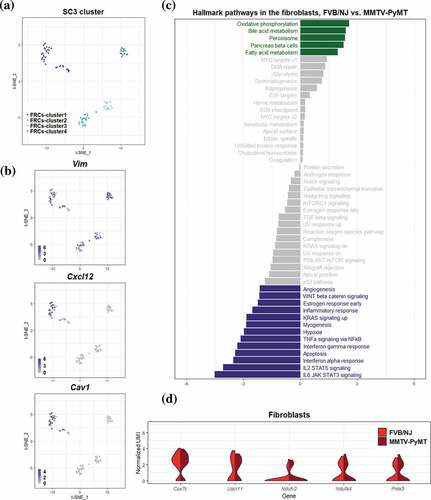
Figure 6. Metabolic switch and upregulation of oxidative phosphorylation pathway in the FRCs in TDLNs
Among the top-ranked and upregulated pathways in FRCs of TDLNs relative to those of naïve LNs were the bile acid metabolism (ranked second) and fatty acid metabolism (ranked fifth). Intriguingly, also based on MMTV-PyMT mice model of LN metastasis, Lee et al reported that LN metastasis requires tumor cells to undergo a metabolic shift toward fatty acid oxidation (FAO), mediated by a selectively activated transcriptional coactivator YAP, while bile acids accumulated to high levels in the metastatic LNs can activate YAP.Citation55 Our study indicated that, in addition to tumor cells, FRCs in the TDLNs may also undergo similar metabolic shift.
To confirm the metabolic change in FRCs found in our study, we downloaded two public datasets to evaluate the genes which were differentially expressed in FRCs. The first dataset used single-cell RNA-seq to examine the stromal compartment in murine TDLNs harvested at different time points after injection of B16 melanoma cells.54 We found that the expression of genes related to OXPHOS and mitochondria dysfunction was elevated in the TDLNs at day 11 when compared to that of normal lymph nodes and day 4 TDLNs and three of the genes (Cox6b1, Cox7b and Cox10) identified in our MMTV-PyMT mice were significantly increased (Supplementary Figure 4A). The second dataset (E-MTAB-7427) published recently consisted raw sequencing data for the melanoma model.Citation56 We analyzed the 5 genes altered in FRCs in our study and found that four of them were statistically elevated during tumor progression (Supplementary Figure 4B). Thus, results of these two studies support out findings that metabolic reprogramming occurred in the FRCs of TDLNs.
Discussion
Luminal and HER2-enriched subtypes of breast cancer are highly correlated with lymph-node metastases and poor outcome.Citation31 We study the remodeling in the TDLNs of the MMTV-PyMT mice at single-cell level during spontaneous tumor progression, which mimics early stage metastasis of human breast cancer. Several crucial findings of this study are discussed below. First, we highlight the alteration of FRCs and immune cells in the TDLNs including increase of FRCs and concomitant decrease of marginal zone B cells. Although the population of T cells seems constant, the expression profiles of all its major subpopulations are changed significantly. Our analyses reveal dynamic change of stromal and immune cells in TDLNs, as can be seen by alteration in transcriptomic profiles for all types of cells analyzed in this study. Second, for the first time, we demonstrate that genes in the angiogenesis-related pathway are upregulated in CD4 + T cells, CD8 + T cells, and B cells in the TDLNs. This is important since increased angiogenesis in TDLNs has been known for its association with poor outcome of breast cancer,Citation57 yet the underlying mechanism is still unresolved. Our findings suggest the possibility of immune cell-mediated angiogenesis could be involved in lymph-node metastasis. We also demonstrated that the gene set of fatty acid metabolism was significantly upregulated in CD4 + T cells, B cells, and FRCs in TDLNs. Together with previous study showing that metabolic adaption is required for tumor metastasis to lymph node,Citation55 our results further indicate that, in addition to tumor cells per se, immune cells (CD4 + T cells and B cells) and stromal cells (FRCs) could be all involved in adapting the lymph node microenvironment by switching their metabolism to fatty acid oxidation, to fuel lymph node metastasis.
Third, we demonstrate the metabolic reprogramming of FRCs in TDLN. Comparative transcriptional analysis revealed that FRCs from inflamed lymph nodes showed upregulation of genes encoding chemokines, acute-phase response mediators, and antigen processing/presentation machinery.Citation12 Similarly, transcriptional profiling of FRCs from non-draining LNs and TDLNs also demonstrated the alterations of chemokine/cytokine signaling and immunological function in TDLNs.Citation54 However, whether intracellular metabolism of FRCs can be modulated during cancer metastasis has not been addressed. Taking advantage of single-cell analysis, we provide evidence that FRCs in TDLNs exhibit higher OXPHOS activity. This energetic adaption in FRCs may help to generate suitable microenvironment for cancer cell survival and expansion. While this study was undergoing, Majumder et al demonstrated that helper T cell-produced interleukin-17 increased glucose uptake and expression of genes participating in fatty acid oxidation and OXPHOS in the FRCs of LNs.Citation58 Ours and their data support the notion that cytokines secreted by cancer cells and immune cells may orchestrate the metabolic reprogramming in FRCs under different physiological or pathological circumstances. In addition to immunological factors, other mediators also affect the activation, remodeling and function of FRCs. For example, growth factors like yes-associated protein (YAP) have been shown to modulate the commitment and maturation of FRCs.Citation59 Cell surface molecules like C-type lectin CLEC-2 expressed by platelets or dendritic cells may control the contractility and matrix deposition of FRCs.Citation60,Citation61 In addition, pathogens may alter FRC function and proliferation by direct cell–cell interaction or release of toxic mediators.Citation62,Citation63 Because a relatively high proportion (53 out of 113) of genes encoding proteins belonging to mitochondria respiratory chain complexes was upregulated in FRCs of TDLNs in our study, we suggest that inhibition of FRC mitochondrial metabolism may be an effective approach to reduce LN metastasis of breast cancer. In fact, the microenvironment of TDLNs has been considered to be a rational target for liposome-based cancer therapy.Citation64
Collectively, our study characterizes gene reprogramming in TDLNs during breast cancer metastasis at single-cell level and reveals immune modulation and metabolic switch as key alterations in TDLNs. Our findings warrant further mechanistic investigations to know the roles of each of component cells during LN metastasis, as well as the possibility of controlling tumor metastasis via inhibiting rational targets in the tumor microenvironment.
Author contributions
Conceptualization, W.C.H.; Investigation and Analysis, Y.L.L., C.H.C., J.Y.C., Y.S.L., S.S.J.; Writing, Y.L.L., C.H.C., S.C.W., S.S.J., W.C.H.,; Funding Acquisition, W.C.H.,; and Resources, S.C.W., W.C.H.
Consent for publication
All authors have approved the manuscript.
Declaration of conflict of interests
The authors declare no competing interests.
Ethic approval
Animal experiments were done in compliance with the Helsinki Declaration and this study was approved by the Animal Care Committee of National Health Research Institutes.
Acknowledgments
We thank Dr. Susan Waltz (University of Cincinnati, USA) to provide the MMTV-PyMT mice.
Supplementary material
Supplemental data for this article can be accessed on the publisher’s website.
Additional information
Funding
References
- Dieterich LC, Detmar M. Tumor lymphangiogenesis and new drug development. Adv Drug Deliv Rev. 2016;99:148–13. doi:10.1016/j.addr.2015.12.011.
- Steeg PS. Targeting metastasis. Nat Rev Cancer. 2016;16:201–218. doi:10.1038/nrc.2016.25.
- Goel HL, Mercurio AM. VEGF targets the tumour cell. Nat Rev Cancer. 2013;13:871–882. doi:10.1038/nrc3627.
- Simons M, Gordon E, Claesson-Welsh L. Mechanisms and regulation of endothelial VEGF receptor signalling. Nat Rev Mol Cell Biol. 2016;17(10):611–625. doi:10.1038/nrm.2016.87.
- Nathanson SD, Shah R, Rosso K. Sentinel lymph node metastases in cancer: causes, detection and their role in disease progression. Semin Cell Dev Biol. 2015;38:106–116. doi:10.1016/j.semcdb.2014.10.002.
- Thompson N, Storr S, Zhang S, Martin S. Lymphovascular invasion: assessment and prognostic impact in melanoma and breast cancer. Histol Histopathol. 2015;30:1001–1009. doi:10.14670/HH-11-615.
- Tammela T, Alitalo K. Lymphangiogenesis: molecular mechanisms and future promise. Cell. 2010;140(4):460–476. doi:10.1016/j.cell.2010.01.045.
- Vaahtomeri K, Karaman S, Makinen T, Alitalo K. Lymphangiogenesis guidance by paracrine and pericellular factors. Genes Dev. 2017;31(16):1615–1634. doi:10.1101/gad.303776.117.
- Gasteiger G, Ataide M, Kastenmuller W. Lymph node - an organ for T-cell activation and pathogen defense. Immunol Rev. 2016;271:200–220. doi:10.1111/imr.12399.
- Thierry GR, Gentek R, Bajenoff M. Remodeling of reactive lymph nodes: dynamics of stromal cells and underlying chemokine signaling. Immunol Rev. 2019;289:42–61. doi:10.1111/imr.12750.
- O’Neill NA, Eppler HB, Jewell CM, Bromberg JS. Harnessing the lymph node microenvironment. Curr Opin Organ Transplant. 2018;23(1):73–82. doi:10.1097/MOT.0000000000000488.
- Malhotra D, Fletcher AL, Astarita J, Lukacs-Kornek V, Tayalia P, Gonzalez SF, Elpek KG, Chang SK, Knoblich K, Hemler ME, et al. Transcriptional profiling of stroma from inflamed and resting lymph nodes defines immunological hallmarks. Nat. Immunol. 2012;13(5):499–510. doi:10.1038/ni.2262.
- Roozendaal R, Mempel TR, Pitcher LA, Gonzalez SF, Verschoor A, Mebius RE, von Andrian UH, Carroll MC. Conduits mediate transport of low-molecular-weight antigen to lymph node follicles. Immunity. 2009;30(2):264–276. doi:10.1016/j.immuni.2008.12.014.
- Gil-Ortega M, Garidou L, Barreau C, Maumus M, Breasson L, Tavernier G, García-Prieto CF, Bouloumié A, Casteilla L, Sengenès C, et al. Native adipose stromal cells egress from adipose tissue in vivo: evidence during lymph node activation. Stem Cells. 2013;31(7):1309–1320. doi:10.1002/stem.1375.
- Miller A, Nagy C, Knapp B, Laengle J, Ponweiser E, Groeger M, Starkl P, Bergmann M, Wagner O, Haschemi A, et al. Exploring Metabolic Configurations of Single Cells within Complex Tissue Microenvironments. Cell Metab. 2017;26(5):788–800. doi:10.1016/j.cmet.2017.08.014.
- Saravia J, Raynor JL, Chapman NM, Lim SA, Chi H. Signaling networks in immunometabolism. Cell Res. 2020;30:328–342. doi:10.1038/s41422-020-0301-1.
- Wang X, Ping FF, Bakht S, Ling J, Hassan W. Immunometabolism features of metabolic deregulation and cancer. J Cell Mol Med. 2018;23:694–701. doi:10.1111/jcmm.13977.
- Mazumdar C, Driggers EM, Turka LA. The untapped opportunity and challenge of immunometabolism: A new paradigm for drug discovery. Cell Metab. 2020;31(1):26–34. doi:10.1016/j.cmet.2019.11.014.
- Ogawa F, Amano H, Eshima K, Ito Y, Matsui Y, Hosono K, Kitasato H, Iyoda A, Iwabuchi K, Kumagai Y, et al. Prostanoid induces premetastatic niche in regional lymph nodes. J Clin Invest. 2014;124(11):4882–4894. doi:10.1172/JCI73530.
- Olmeda D, Cerezo-Wallis D, Riveiro-Falkenbach E, Pennacchi PC, Contreras-Alcalde M, Ibarz N, Cifdaloz M, Catena X, Calvo TG, Cañón E, et al. Whole-body imaging of lymphovascular niches identifies pre-metastatic roles of midkine. Nature. 2017;546(7660):676–680. doi:10.1038/nature22977.
- Commerford CD, Dieterich LC, He Y, Hell T, Montoya-Zegarra JA, Noerrelykke SF, Russo E, Rocken M, Detmar M. Mechanisms of tumor-induced lymphovascular niche formation in draining lymph nodes. Cell Rep. 2018;25(13):3554–3563 e3554. doi:10.1016/j.celrep.2018.12.002.
- Kabeer F, Beverly LJ, Darrasse-Jeze G, Podsypanina K. Methods to study metastasis in genetically modified mice. Cold Spring Harb Protoc. 2016;2016(2):pdb top069948. doi:10.1101/pdb.top069948.
- Guy CT, Webster MA, Schaller M, Parsons TJ, Cardiff RD, Muller WJ. Expression of the neu protooncogene in the mammary epithelium of transgenic mice induces metastatic disease. Proc Natl Acad Sci U S A. 1992;89(22):10578–10582. doi:10.1073/pnas.89.22.10578.
- Scialdone A, Natarajan KN, Saraiva LR, Proserpio V, Teichmann SA, Stegle O, Marioni JC, Buettner F. Computational assignment of cell-cycle stage from single-cell transcriptome data. Methods. 2015;85:54–61. doi:10.1016/j.ymeth.2015.06.021.
- van der Maaten L, Hinton G. Visualizing Data using t-SNE. J Mach Learn Res. 2008;9:2579–2605.
- Kiselev VY, Kirschner K, Schaub MT, Andrews T, Yiu A, Chandra T, Natarajan KN, Reik W, Barahona M, Green AR, et al. SC3: consensus clustering of single-cell RNA-seq data. Nat Methods. 2017;14(5):483–486. doi:10.1038/nmeth.4236.
- Hanzelmann S, Castelo R, Guinney J. GSVA: gene set variation analysis for microarray and RNA-seq data. BMC Bioinform. 2013;14(1):7. doi:10.1186/1471-2105-14-7.
- Subramanian A, Tamayo P, Mootha VK, Mukherjee S, Ebert BL, Gillette MA, Paulovich A, Pomeroy SL, Golub TR, Lander ES, et al. Gene set enrichment analysis: a knowledge-based approach for interpreting genome-wide expression profiles. Proc. Natl. Acad. Sci. U. S. A. 2005;102(43):15545–15550. doi:10.1073/pnas.0506580102.
- Liberzon A, Subramanian A, Pinchback R, Thorvaldsdottir H, Tamayo P, Mesirov JP. Molecular signatures database (MSigDB) 3.0. Bioinformatics. 2011;27:1739–1740. doi:10.1093/bioinformatics/btr260.
- Liberzon A, Birger C, Thorvaldsdóttir H, Ghandi M, Mesirov J, Tamayo P. The molecular signatures database (MSigDB) hallmark gene set collection. Cell Syst. 2015;1(6):417–425. doi:10.1016/j.cels.2015.12.004.
- He Z-Y, Wu S-G, Yang Q, Sun J-Y, Li F-Y, Lin Q, Lin H-X. Breast cancer subtype is associated with axillary lymph node metastasis a retrospective cohort study. Medicine. 2015;94(48):e2213. doi:10.1097/MD.0000000000002213.
- Fantozzi A, Christofori G. Mouse models of breast cancer metastasis. Breast Cancer Res. 2006;8(4):212. doi:10.1186/bcr1530.
- Kwee BJ, Budina E, Najibi AJ, Mooney DJ. CD4 T-cells regulate angiogenesis and myogenesis. Biomaterials. 2018;178:109–121. doi:10.1016/j.biomaterials.2018.06.003.
- Chen RY, Fan YM, Zhang Q, Liu S, Li Q, Ke GL, Li C, You Z. Estradiol inhibits Th17 cell differentiation through inhibition of RORγ transcription by recruiting the ERα/REA complex to estrogen response elements of the RORγ T promoter. J Immunol. 2015;194(8):4019–4028. doi:10.4049/jimmunol.1400806.
- Kim DH, Park HJ, Park HS, Lee JU, Ko C, Gye MC, Choi JM. Estrogen receptor alpha in T cells suppresses follicular helper T cell responses and prevents autoimmunity. Exp Mol Med. 2019;51:1–9. doi:10.1038/s12276-019-0237-z.
- Fu W, Ergun A, Lu T, Hill JA, Haxhinasto S, Fassett MS, Gazit R, Adoro S, Glimcher L, Chan S, et al. A multiply redundant genetic switch ‘locks in’ the transcriptional signature of regulatory T cells. Nat Immunol. 2012;13(10):972–980. doi:10.1038/ni.2420.
- Wachstein J, Tischer S, Figueiredo C, Limbourg A, Falk C, Immenschuh S, Blasczyk R, Eiz-Vesper B. HSP70 enhances immunosuppressive function of CD4(+)CD25(+)FoxP3(+) T regulatory cells and cytotoxicity in CD4(+)CD25(-) T cells. PLoS One. 2012;7:e51747. doi:10.1371/journal.pone.0051747.
- Burocchi A, Colombo MP, Piconese S. Convergences and divergences of thymus- and peripherally derived regulatory T cells in cancer. Front Immunol. 2013;4:247. doi:10.3389/fimmu.2013.00247.
- de Zoeten EF, Wang L, Butler K, Beier UH, Akimova T, Sai H, Bradner JE, Mazitschek R, Kozikowski AP, Matthias P, et al. Histone deacetylase 6 and heat shock protein 90 control the functions of Foxp3+ T-regulatory cells. Mol Cell Biol. 2011;31(10):2066–2078. doi:10.1128/MCB.05155-11.
- Camirand G, Wang Y, Lu Y, Wan YY, Lin Y, Deng S, Guz G, Perkins DL, Finn PW, Farber DL, et al. CD45 ligation expands Tregs by promoting interactions with DCs. J Clin Invest. 2014;124(10):4603–4613. doi:10.1172/JCI74087.
- Yang C, Lee H, Pal S, Jove V, Deng J, Zhang W, Hoon DSB, Wakabayashi M, Forman S, Yu H, et al. B cells promote tumor progression via STAT3 regulated-angiogenesis. PLoS One. 2013;8(5):e64159. doi:10.1371/journal.pone.0064159.
- Moreau JM, Mielnik M, Berger A, Furlonger C, Paige CJ. Tumor-secreted products repress B-cell lymphopoiesis in a murine model of breast cancer. Eur J Immunol. 2016;46(12):2835–2841. doi:10.1002/eji.201646552.
- Sun SC. The non-canonical NF-kappaB pathway in immunity and inflammation. Nat Rev Immunol. 2017;17(9):545–558. doi:10.1038/nri.2017.52.
- Wilker PR, Kohyama M, Sandau MM, Albring JC, Nakagawa O, Schwarz JJ, Murphy KM. Transcription factor Mef2c is required for B cell proliferation and survival after antigen receptor stimulation. Nat Immunol. 2008;9(6):603–612. doi:10.1038/ni.1609.
- Gekas C, Rhodes KE, Gereige LM, Helgadottir H, Ferrari R, Kurdistani SK, Montecino-Rodriguez E, Bassel-Duby R, Olson E, Krivtsov AV, et al. Mef2C is a lineage-restricted target of Scl/Tal1 and regulates megakaryopoiesis and B-cell homeostasis. Blood. 2009;113(15):3461–3471. doi:10.1182/blood-2008-07-167577.
- Wang W, Org T, Montel-Hagen A, Pioli PD, Duan D, Israely E, Malkin D, Su T, Flach J, Kurdistani SK, et al. MEF2C protects bone marrow B-lymphoid progenitors during stress haematopoiesis. Nat Commun. 2016;7(1):12376. doi:10.1038/ncomms12376.
- Yamadori T, Baba Y, Matsushita M, Hashimoto S, Kurosaki M, Kurosaki T, Kishimoto T, Tsukada S. Bruton’s tyrosine kinase activity is negatively regulated by Sab, the Btk-SH3 domain-binding protein. P Natl Acad Sci USA. 1999;96(11):6341–6346. doi:10.1073/pnas.96.11.6341.
- Carroll MC, Isenman DE. Regulation of humoral immunity by complement. Immunity. 2012;37(2):199–207. doi:10.1016/j.immuni.2012.08.002.
- Tamayo E, Alvarez P, Merino R. TGFbeta superfamily members as regulators of B cell development and function-implications for autoimmunity. Int J Mol Sci. 2018;19(12):3928. doi:10.3390/ijms19123928.
- Richards J, McNally B, Fang X, Caligiuri MA, Zheng P, Liu Y. Tumor growth decreases NK and B cells as well as common lymphoid progenitor. PLoS One. 2008;3(9):e3180. doi:10.1371/journal.pone.0003180.
- Gu Y, Liu Y, Fu L, Zhai L, Zhu J, Han Y, Jiang Y, Zhang Y, Zhang P, Jiang Z, et al. Tumor-educated B cells selectively promote breast cancer lymph node metastasis by HSPA4-targeting IgG. Nat Med. 2019;25(2):312–322. doi:10.1038/s41591-018-0309-y.
- Li L, Li Y, Huang Y, Ouyang Y, Zhu Y, Wang Y, Guo X, Yuan Y, Gong K. Long non-coding RNA MIF-AS 1 promotes gastric cancer cell proliferation and reduces apoptosis to upregulate NDUFA4. Cancer Sci. 2018;109(12):3714–3725. doi:10.1111/cas.13801.
- Knoops B, Goemaere J, Van der Eecken V, Declercq JP. Peroxiredoxin 5: structure, mechanism, and function of the mammalian atypical 2-Cys peroxiredoxin. Antioxid Redox Signal. 2011;15(3):817–829. doi:10.1089/ars.2010.3584.
- Riedel A, Shorthouse D, Haas L, Hall BA, Shields J. Tumor-induced stromal reprogramming drives lymph node transformation. Nat Immunol. 2016;17(9):1118–1127. doi:10.1038/ni.3492.
- Lee C-K, Jeong S-H, Jang C, Bae H, Kim YH, Park I, Kim SK, Koh GY. Tumor metastasis to lymph nodes requires YAP-dependent metabolic adaptation. Science. 2019;363(6427):644–649. doi:10.1126/science.aav0173.
- Davidson S, Efremova M, Riedel A, Mahata B, Pramanik J, Huuhtanen J, Kar G, Vento-Tormo R, Hagai T, et al. Single-Cell RNA sequencing reveals a dynamic stromal niche that supports tumor growth. Cell Rep. 2020;31(7):107628. doi:10.1016/j.celrep.2020.107628.
- Guidi AJ, Berry DA, Broadwater G, Perloff M, Norton L, Barcos MP, Hayes DF. Association of angiogenesis in lymph node metastases with outcome of breast cancer. J Natl Cancer Inst. 2000;92(6):486–492. doi:10.1093/jnci/92.6.486.
- Majumder S, Amatya N, Revu S, Jawale CV, Wu D, Rittenhouse N, Menk A, Kupul S, Du F, Raphael I, Bhattacharjee A, et al. IL-17 metabolically reprograms activated fibroblastic reticular cells for proliferation and survival. Nat Immunol. 2019;20(5):534–545. doi:10.1038/s41590-019-0367-4.
- Choi SY, Bae H, Jeong SH, Park I, Cho H, Hong SP, Lee DH, Lee CK, Park JS, Suh SH, Choi J,et al. YAP/TAZ direct commitment and maturation of lymph node fibroblastic reticular cells. Nat Commun. 2020;11(1):519. doi:10.1038/s41467-020-14293-1.
- Astarita JL, Cremasco V, Fu J, Darnell MC, Peck JR, Nieves-Bonilla JM, Song K, Kondo Y, Woodruff MC, Gogineni A, et al. The CLEC-2-podoplanin axis controls the contractility of fibroblastic reticular cells and lymph node microarchitecture. Nat Immunol. 2015;16(1):75–84. doi:10.1038/ni.3035.
- Martinez VG, Pankova V, Krasny L, Singh T, Makris S, White IJ, Benjamin AC, Dertschnig S, Horsnell HL, Kriston-Vizi J, Burden JJ, et al. Fibroblastic reticular cells control conduit matrix infectious diseases and the deposition during lymph node expansion. Cell Rep. 2019;29(9):2810–2822. doi:10.1016/j.celrep.2019.10.103.
- Morgado FN, da Silva AVA, Porrozzi R. Infectious diseases and the lymphoid extracellular matrix remodeling: a focus on conduit system. Cells. 2020;9(3):725. doi:10.3390/cells9030725.
- Fletcher AL, Acton SE, Knoblich K. Lymph node fibroblastic reticular cells in health and disease. Nat Rev Immuno. 2015;15(6):350–361. doi:10.1038/nri3846.
- Chandrasekaran S, King MR. Microenvironment of tumor-draining lymph nodes: opportunities for liposome-based targeted therapy. Int J Mol Sci. 2014;15(11):20209–20239. doi:10.3390/ijms151120209.