
ABSTRACT
Fluoropyrimidine-based chemotherapy is an essential component of systemic chemotherapy for colorectal cancer (CRC). The immune response is implicated in chemotherapy-induced cytotoxicity. Here, we reported an immune risk (Imm-R) model for prognostic prediction in patients receiving fluoropyrimidine-based chemotherapy. Gene expression profiles and corresponding clinical information were collected from four data sets and divided into training set (n = 183) and validation set (validation set1: n = 34; validation set2: n = 99). The composition of 22 tumor-infiltrating immune cells (TIICs) populations was characterized with the CIBERSORT deconvolution algorithm. A prognostic Imm-R model for predicting overall survival was established by performing least absolute shrinkage and selection operator (LASSO) penalized COX regression analysis. T follicular helper cells and M0 macrophages were associated with better survival, while eosinophils were associated with worse survival. TIICs signature was constructed based on the above three immune cell types. Furthermore, a Imm-R model was created by integrating TIICs signature with immune-related genes (IRGs), which effectively in distinguishing CRC patients with poorer prognosis. The Imm-R model was associated with activation of the TGF-beta signaling and suppression of DNA damage. Results of this research provide new insights into the role of immunity for in fluoropyrimidine-based chemotherapy as well as a useful tools to predict the outcome of CRC patients receiving fluoropyrimidine-based chemotherapy.
Introduction
Colorectal cancer (CRC) is the third most common cancer and a leading contributor to cancer-related mortality worldwide.Citation1 Although significant advances have been made in screening, diagnosis, and treatment of CRC, clinical outcome of CRC patients remains unsatisfactory. Radical resection is currently the only curative strategy for CRC. However, approximately 50% of CRC patients who underwent curative resection developed recurrence within two years after surgery and half of these recurrences proved to be fatal.Citation2 To prevent recurrence in and prolong survival, fluoropyrimidine-based chemotherapy, is recommended for all suitable patients with stage III disease or stage II disease with high-risk featuresCitation3 after curative resection. Fluoropyrimidine-based combination chemotherapy, such as FOLFOX, CapeOX, or FOLFIRI, with/without biologics, is also recommended as the first-line treatment.Citation4 However, the therapeutic benefit to patients is frequently compromised by the development of chemoresistance.Citation5 Adjuvant chemotherapy improves survival in only 3% of patients with stage II CRC, and up to 15%–20% among those with stage III CRC.Citation6 Therefore, identifying high-risk CRC patients, those who received fluoropyrimidine-based therapy but with poor responses, may contribute to developing individualized treatment.Citation7
Tumor-infiltrating immune cells (TIICs) are of various consist of the tumor immune microenvironmentCitation8 TIICs were composed of various types of immune cells, like T cell, macrophages, neutrophils etc. Different subtype of TIICs may exhibit either immune-promoting or immune-suppressing ability under various situation.Citation9 The composition of the TIICs is tightly regulated by the immune interactions between host and tumor,Citation10 and reflects the intrinsic characteristics of tumor.Citation11 Increasing evidence indicates that composition and abundance of TIICs are potential predictors of patient survival.Citation12-14 For example, high levels of infiltrating CD8 + T cell is associated with better prognosis, while regulatory T (Treg) cells predict poor clinical outcomes in CRC patients.Citation15 A CRC classification based on TIICs has been developed, and five subgroups of CRC with distinct survival patterns have been identified.Citation16 Therefore, the comprehensive identification of prognostic TIICs may complement current strategies used for the prediction of CRC prognosis.
Most previous studies have used immunohistochemical approaches to assess the landscape of TIICs. Recently, CIBERSORT algorithm was developed to enumerate immune cell subtypes. It generates the proportion of TIICs based on changes of immune-related and other genes in expression profiles.Citation17 Due to the excellent performance of CIBERSORT, its application in studying cell heterogeneity has aroused increasing attention.Citation18-20 For example, Xiong et al analyzed the clinical significant of TIICs in CRC by using CIBERSORTCitation16 and Narayanan et al performed CIBERSORT algorithm to identify TIICs associated with OS of microsatellite unstable CRC patients.Citation21 However, The impact of TIICs on the prognosis of patients treated with fluoropyrimidine is not yet conclusive.
The immune response is regulated by a complex immune molecular network that includes chemokines, cytokines, major histocompatibility complex (MHC) molecules, as well as co-stimulatory, immunomodulatory, and cytotoxicity-mediating molecules.Citation22 The genes encode those molecules are referred as immune-related genes (IRGs).Citation23 Besides the composition and abundance of TIICs, the expression of IRGs is associated with prognosis in CRC patients as well.Citation24 For example, higher expression of PD-1 and PD-L1 is correlated with better prognosis.Citation25 Furthermore, expression of genes encoded MHC class II complex could predict metastasis in CRC patients.Citation26 An increasing number of studies also implicate the immune response in chemotherapy-induced cytotoxicity.Citation27,Citation28
In the current study, we aimed at illustrating the landscape of TIICs and screen TIICs associated with prognosis in CRC patients receiving fluoropyrimidine-based chemotherapy. We also construct an immune risk (Imm-R) model by integrating TIICs- and IRGs to identify potential high-risk CRC patients for fluoropyrimidine-based chemotherapy.
Results
Cohort characteristics
Firstly, 865 patients from GSE39582 (585 cases), GSE103479 (156 cases), GSE72968 (68 cases), and GSE72969 (56 cases) were selected. The follow-up information and chemotherapy regimens of each case was collected. After filtering out patients who received preoperative treatment and whose microarry data did not pass the CIBERSORT quality control step (p value ≥ 0.05),Citation29 316 CRC patients receiving fluoropyrimidine-based chemotherapy, included 182 male patients and 134 female patients, were finally included in the study ( and ). Among them, 199 cases were in stage II–III (62.97%) and 117 cases in stage IV (37.03%). The median follow-up time was 46 months. 172 patients (54.43%) experienced disease recurrence or progression during follow-up. The training set consisted of 183 cases from GSE39583. Validation set1 included 34 cases from GSE103479, who were with stage II–III disease and received 5-fluorocrail (5-FU) based chemotherapy. Validation set2 was the combination of 61 cases from GSE72968 and 38 cases from GSE72969, who were stage IV and received fluoropyrimidine-based combination treatments ().
Table 1. Clinical features of patients included in the study.
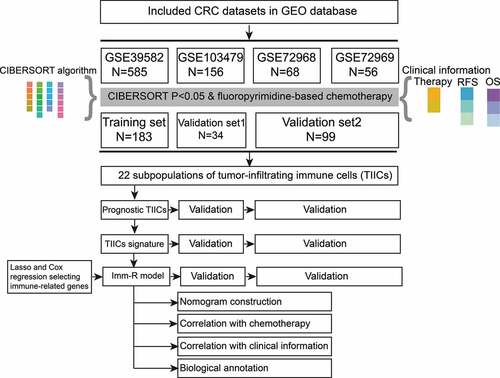
Figure 1. The flow diagram of this study. In brief, four colorectal cancer (CRC) microarray datasets in the GEO database were included in the study at first. After filtering out patients who received preoperative treatment and whose microarray data did not pass the CIBERSORT quality control step, 183 cases in GSE39582 (Training set), 34 cases in GSE103479 (Validatiaon set1), 61 cases from GSE72968, and 38 cases from GSE72969 (combined as Validation set2) were selected. The prognostic effects of the 22 subpopulations of tumor-infiltrating immune cells (TIICs) were analyzed and three TIICs were selected to create the TIICs signature. Further, TIICs and immune-related genes were integrated to create the immune risk (Imm-R) model.
Correlation between the immune infiltration landscape and clinical features in CRC
TIICs in the tumor microenvironment modulate the antitumor response and represent attractive therapeutic targets.Citation30 Using the CIBERSORT algorithm, we systematically evaluated the abundance of 22 subpopulations of TIICs in the included patients of training set. Significant variation in the proportion of TIICs was observed among individuals, reflecting the varied intrinsic individual immune characteristics (Figure S1A). Correlation analysis showed that subpopulations of TIICs showed a weak to moderate correlation with each other (Figure S1B). Next, we analyzed the the corelation of each TIICs subgroup and clinical features, likes TNM stages, TP53 status, KRAF/BRAF status, RFS and OS, of all patients in the training set (Figure S1C–E). As a result, four TIICs were identified to be associated with TNM stages (). CD8 + T cell was down-regulated with increasing TNM stage (p = .036), while Monocytes (p = .045), Eosinophils (p = .0061), and activated Mast cells (p = .032) were upregulated with increasing TNM stage (). Correlation analysis also showed that proportion of CD8 + T cell was negatively correlated to the three other cells ()
Figure 2. Correlation between immune infiltration landscape and clinical features in CRC. (a) The abundance of four tumor-infiltrating immune cell subpopulations (TIICs) which were significantly associated with TNM stage in the training set. CD8 + T cells (T cell CD8) was downregulated while Monocytes, Eosinophils and Mast cells activated were upregulated with increasing TNM stages (p < .05). (b) Correlation matrix of the CD8 + T cells, Monocytes, Eosinophils, and Mast cells activated. (c) Six TIICs (T cells CD4 memory resting, T cells follicular helper, T cells gamma delta, NK cells activated, Monocytes, and Macrophages M1) were associated with MMR status significantly (p < .05). dMMR, mismatch repair deficient; pMMR mismatch repair proficient. (d and e) T cells CD4 memory activated (d) and Macrophages M0 (e) were associated with KRAS mutation status (p < .05). WT-KRAS, wild-type KRAS; MT-KRAS, mutant KRAS.
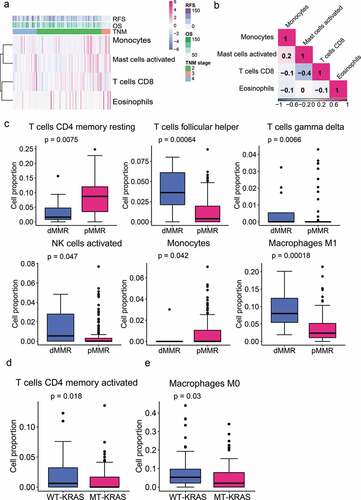
We comprehensively explored the relationship between TIICs and clinical features in CRC. Mismatch-repair-deficient (dMMR) CRC represents a strong indication for immunotherapy.Citation31 We compared the abundance of the 22 TIICs between dMMR and mismatch-repair-proficient (pMMR) CRC (Figure S1D). We found that the abundance of T follicular helper cells (Tfh), gamma delta T cells, NK cell activated and M1 macrophages were significantly increased in the dMMR CRC group compared with pMMR (p< .05), while that of resting memory CD4 + T cells and Monocytes were increased in the pMMR CRC group (). Recent evidence indicates that the KRAS mutation might also shape tumor immunity.Citation32,Citation33 In this study, we found that the abundance of activated memory CD4 + T cells and M0 macrophages were lower in KRAS-mutated CRC than in wild-type CRC (Figure S1E, and e). These results suggested that TIICs represented some of the intrinsic characteristics of CRC patients with different clinical features.
Development and validation of the tumor-infiltrating immune cell (TIICs) signature
To further explore the potential of using TIICs as an indicator of the therapeutic response to cytotoxic regimens, we firstly performed Cox regression analysis in the training set to screen TIICs associated with overall survival (OS). 13 of 22 TIICs were associated with OS (Figure S2 and ). Next, we performed multivariate Cox regression analysis to identify independent prognostic TIICs and the results showed that Tfh, plasma cells, activated mast cells, M0 macrophages, eosinophils, and memory B cells were potential independent prognostic TIICs for chemotherapy (Figure S3A and B). The association between the above six TIICs and OS were validated in both validation set1 and validation set2 and confirmed that Tfh and M0 macrophages were associated with better OS while eosinophil was associated with worse OS in the three datasets ( and c)). Therefore, collection of Tfh, M0 macrophages and eosinophil were defined as the TIICs signature to predict CRC patients response to fluoropyrimidine-based chemotherapy. We also performed a subgroup analysis to assess the application of TIICs signatures in stage II–III patients in the training set (Figure S4). Tfh and M0 macrophages were associated with better survival, while eosinophils were associated with worse survival in the stage II–III patients of training set (Figure S4A).
Figure 3. Development and validation of the tumor-infiltrating immune cell signature. (a)–(c) High abundance of T cells follicular helper (Tfh)and M0 macrophages (macrophages M0) were associated with better OS, while eosinophils was associated with worse OS in the training set (a), validation set1 (b) and validation set2 (c). (d)–(f) Kaplan–Meier curves for RFS/PFS of patients with high- and low TIICs risk scores in the training set (d), validation set1 (e), and validation set2 (f). (g)–(i) Kaplan–Meier curves for OS of patients with high- and low TIICs risk scores in the training set (g), validation set1 (h), and validation set2 (i). (j)–(l) ROC curve for measuring the predictive value of the TIICs signature for OS and RFS/PFS in the training set (j), validation set1 (k), and validation set2 (l).
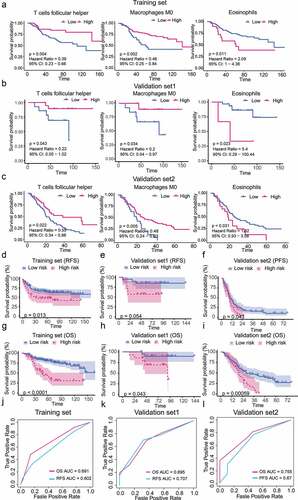
Based on the TIICs signature, we constructed a method to calculate scores of TIICs signature (TIICs score) to predict the prognosis of patients receiving fluoropyrimidine-based chemotherapy. The TIICs score was calculated as follows: (−0.990 × abundance of Tfh)+(−0.731 × abundance of Macrophages M0) + (0.655 × abundance of Eosinophils). Using the median of TIICs scores as cutoff value, the TIICs scores successfully distinguished CRC patients into high-risk or low-risk groups. Patients with high risk had significantly poorer relapse-free survival (RFS) and OS compared with those with low risk in the training set (RFS, p=.013 ; OS, p< .001; ). With threshold set as in training set, TIICs scores in validation set1 and validation set2 yielded similar results. Compared with those with low risk, high-risk patients had poorer RFS and OS in the validation set1 (RFS, p=.054 ; OS, p = .043, ), or poorer progression-free survival (PFS) and OS in the validation set2 (PFS, p=.043, ; OS, p= 5.9 × 10⁻⁴, ). The AUC under ROC curve of TIICs scores for predicting OS in the training set, validation set1 and 2 were 0.691, 0.695, and 0.755 respectively (j–l). The AUC of the TIICs scores for predicting RFS in training set and the validation set1 was 0.602 and 0.707; for PFS in validation set2 was 0.670 (–l). Application of the TIICs score successfully generated similar results in stage II–III subgroup of training set (Figure S4B-D).
Development and validation of the immune risk (Imm-R) model by intergrating TIICs and IRGs
Although the TIICs scores seemed to distinguish patients with high-risk well, the AUC of ROC curve did not reach 0.8, which indicated limited precision. Immune-related genes (IRGs) were reported to orchestrate tumor-associated immune responses.Citation34 The integration of the TIICs signature and IRGs signature may enable more comprehensive assessment of immune status and more precise prognostic prediction. By integrating two immune gene lists from ImmPortCitation35 and TISIDB,Citation36 we obtained a list of 2404 IRGs. Univariate Cox regression analysis was performed for preliminary screening of survival-associated IRGs in the training set. Based on the threshold value of p value < 0.05, we identified 61 IRGs significantly related with overall survival. Then, these 61 IRGs and the TIICs scores were input into the LASSO-Cox regression model for feature selection. Under penalizing conditions, 13 IRGs and TIICs scores which with nonzero coefficients were selected (,b)). Next, we performed stepwise multivariate Cox regression analysis based on the features selected by the LASSO-Cox regression model in order to construct the Imm-R model (Table S1 and ). Ultimately, a Imm-R model consisting of seven IRGs (PSMD3, CCL22, FGF19, LGR5, SKAP1, TACSTD2, S100A4) and TIICs scores, was constructed. Hazard ratios (HR), 95% confidence intervals of HR, and p-values in univariate and multivariate Cox regression of the seven IRGs and TIIC scores for Imm-R model were summarized in Table S1 and . In the Imm-R model, an immune risk score (Imm-R score) was generated using the formula:
Figure 4. Development and validation of the immune risk (Imm-R) model. (a) Tuning parameter (λ) selection in the LASSO-Cox regression model was performed using 10-fold cross-validation via the 1 standard error for the minimum criteria. The black vertical lines were plotted at the optimal λ based on the minimum criteria and 1 standard error for the minimum criteria. (b) The LASSO coefficient profiles of the 61 immune-related genes and TIICs signature. A coefficient profile plot was produced versus the log (λ). (c) Parameters of Imm-R model. p values of features were indicated by the color scale presented on the side. Horizontal bars represent 95% confidence intervals. (d) and (e) Kaplan–Meier curves for RFS (d) and OS (e) of patients with high- and low Imm-R scores in the training set. (f) and (g) Kaplan–Meier curves for RFS (f) and OS (g) of patients with high- and low Imm-R scores in the validation set1. (h) and (i) Kaplan–Meier curves for PFS (h) and OS (i) of patients with high- and low Imm-R scores in the validation set2. (j)–(l) ROC curves for measuring the predictive value of the Imm-R model in the training set (j), validation set1 (k), and validation set2 (l). (m) and (n) Construction and analysis of risk scores in the training set and validation set2. Top panels: the risk scores of individual patients. Middle panels: the survival status and survival times of the patients distributed by risk score. Bottom panel: heatmap of the levels for the eight predictive factors distributed by risk score.
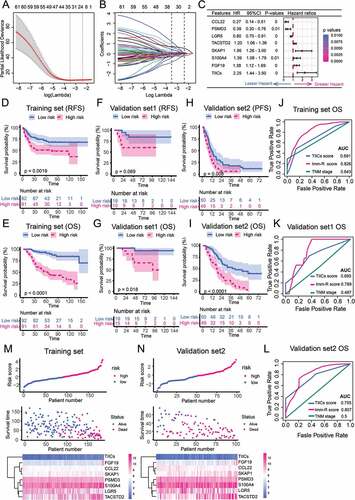
Imm-R score = (−0.939× PSMD3)+(−1.304× CCL22)+(0.319× FGF19)+(−0.228× LGR5)+(0.665× SKAP1)+(0.182× TACSTD2)+(0.329× S100A4)+(0.809× TIICs scores).
In the training set, CRC patients could be divided into high-risk and low-risk groups by the median value of Imm-R scores. Survival analysis demonstrated that the Imm-R model was powerful to distinguish CRC patients with good or bad prognosis (,e)). Patients with high-risk had significantly shorter RFS and OS compared with those with low risk in the training set (RFS, p = .0019; OS, p< .0001). Patients with high risk had shorter RFS in the validation set1 with a marginally significant p-value of 0.069 and shorter OS (p = .018, ). In validation sets2, the PFS and OS were significantly shorter in the patients with high risk (PFS: p = .008, ; OS: p< .0001 ).
Time-dependent ROC analysis indicated that the AUC of Imm-R scores for predicting OS in the training set was 0.826, better than that of TNM stage (0.643) (). In the validation set1 and validation 2, the AUC of the Imm-R scores for predicting OS was 0.789 and 0.807, all significantly greater than TNM stage ( and l). The Imm-R scores (upper panel) and corresponded OS (middle panel) of individuals in training set () and validation set2 () showed a trend that the OS roughly decreased along with the increasing of Imm-R scores. The expression levels of the seven IRGs and the TIICs scores were shown in the bottom panels ( and n).
The efficiency of using Imm-R scores for predicting OS and RFS in stage II–III patients subgroup of training set was conincident with validation set2 (Figure S5A and B). The RFS and OS were significantly shortened in high-risk patients compared with low-risk patients (RFS p= .0062; OS, p< .0001). The ROC curve also indicated that Imm-R model had good discrimination in prognosis estimation, with AUC of 0.804 for OS (Figure S5C). These results indicated that the Imm-R model showed good discrimination ability in both training and validation sets.
We compared the prognostic effects of Imm-R model with common clinical parameters such as age, gender, BRAF status, KRAS status, MMR (Mismatch Repair) status, tumor location and TNM stage in the training set. Univariate Cox regression analysis indicated that KRAS status, TNM stage and Imm-R model were associated with OS (KRAS: p = .04; TNM stage: p = .018; Imm-R model p = 6.00 × 10⁻²⁰; Table S2). Multivariate analysis confirmed that the Imm-R model was an independent prognostic factor (p = 4.61 × 10⁻¹¹) for OS as shown in Table S2.
Nomogram construction and evaluation of calibration
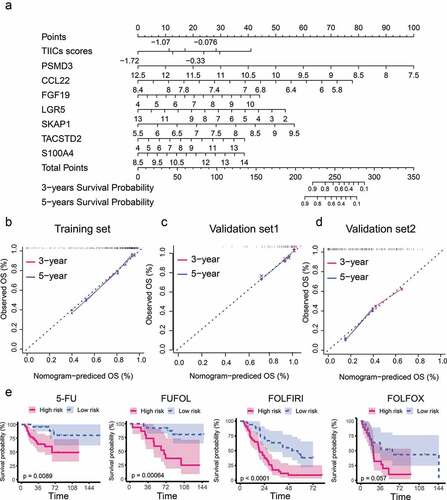
The nomogram is a user‑friendly graphical regression model with excellent applicability in clinical settings. Recently, nomograms have been widely used in the diagnosis and prognostic prediction of a variety of cancers. To improve the usability of the Imm-R model, we constructed a nomogram to depict the Imm-R model better (). The nomogram included above eight features, and a point for each feature was assigned based on the scale on the top. The total score was defined as the sum of the points of the eight variables. By drawing a perpendicular line from the total point axis to the two-outcome axis, estimated three- and five-year OS probabilities could be obtained (). To assess the goodness-of-fit of the nomogram, we compared the predicted three- and five-year survival probabilities to the actual three- and five-year survival probabilities using calibration plots (–d). The calibration curve revealed good concordance between the predicted and observed probabilities in both of the training set, validation set1 and validation set2. These results proved that the Imm-R model nomogram had very appropriate calibration.
Figure 5. Nomogram for predicting OS probabilities of CRC patients receiving fluoropyrimidine-based chemotherapy. (a) The nomogram for predicting the three- and five-year OS probabilities of CRC patients receiving fluoropyrimidine-based chemotherapy. Points are assigned for eight features. The score for each feature was calculated by drawing a line upward to the 'Points' line, and the sum of the eight scores was 'Total Points'. The total points on the bottom scales correspond to the predicted three- and five-year survival. (b–d) Calibration curves for predicting three- and five-year survival OS in training set (b), validation set1 (c), and validation set2 (d). X-axis: predicted survival produced by the nomogram; Y-axis: actual survival. Dashed lines represented an identical calibration model in which predicted OS approximates to actual OS. (e) Kaplan–Meier curves for OS of patients receiving 5-fluorouracil (5-FU); 5-FU and folinic acid (FUFOL); 5-FU, leucovorin, and irinotecan (FOLFIRI); and 5-FU, leucovorin, and oxaliplatin (FOLFOX), respectively.
The effect of Imm-R model in patients receiving different fluoropyrimidine-based chemotherapy
It was not uncommon that clinical outcomes in patients who of the same stage and received the same therapeutic regimens varied, suggesting the limitation of the current prognostic model. We explored whether the Imm-R model could distinguish between high- and low-risk patients receiving different fluoropyrimidine-based chemotherapy. We observed that this model could well stratify CRC patients who treated with 5-FU, FUFOL and FOLFIRI (p<.01). The Imm-R model could also distinguish high-risk patients who received FOLFOX treatment but only with marginal significance (p= .057, ).
Biological annotation of Imm-R model
To explore the underlying biological mechanisms of the Imm-R model, we performed Gene Set Enrichment Analysis (GSEA) based on the microarray datasets from the training set. Patients were divided into two groups according to the median value of their Imm-R scores. The results observed that several pathways related to tumor growth and proliferation were significantly activated in those high-risk patients, included the TGF-beta signaling pathway, PI3K-Akt signaling pathway, Ras signaling pathway, and Wnt signaling pathway (), reflecting the active tumor proliferation in high-risk patients. Inversely, several pathways related to DNA damage and repair, such as the mismatch repair, base excision repair, and DNA replication pathways were significantly upregulated in low-risk patients ().
Figure 6. Gene set enrichment analysis indicated significant pathways associated with the immune risk (Imm-R) model. (a) Upregulated KEGG pathways in high-risk patients. (b) Downregulated KEGG pathways in high-risk patients. (c) Volcano plots showed the differential expressed genes (DEGs) between HCT8/5-FU (5-FU resistant) and HCT8/WT (Wild type). Red dots represented the significantly upregulated DEGs (UP) in HCT8/5-FU group. Blue dots represented the significantly downregulated DEGs (DOWN) in HCT8/5-FU group. Black dots represented non DEGs (NS). (d) Enrichment diagram of TGF-beta signaling pathway. (e) Heatmap showed the expression of hub genes in the TGF-beta signaling pathway in HCT8/5-FU and HCT8/WT group. (f) The expression of eight hub genes in the TGF-beta signaling pathway in high-risk and low-risk patients in training set.
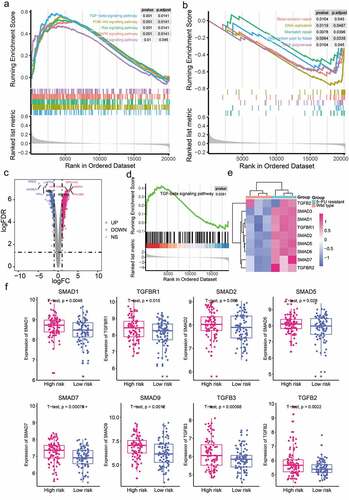
In order to further clarify the connection of Imm-R and the mechanism of 5-FU resistance, we performed differential expression analysis based on the GSE81005 datasets derived from wild type and 5-FU-induced resistant HCT8 human CRC cell lines.Citation37 In total, 801 genes were significantly upregulated and 399 genes were significantly down-regulated in the 5-FU resistant HCT8 cells (HCT8/5-FU) compared with wild type HCT8 cells (HCT8/WT) (). Pathway enrichment analysis indicated that TGF-beta signaling pathway was significantly upregulated in the HCT8/5-FU cells and the expression of hub genes in the TGF-beta signaling pathway were significantly increased in the HCT8/5-FU cells ( and e)).
We investigated the expression of hub genes in the TGF-beta signaling pathway between the high risk and low risk patients in the training set. As predicted, seven out of eight hub genes (TGFB2/3, SMAD1/2/5/7/9, and TGFBR1) were significantly increased in the high risk group (). These results indicated that activation of TGF-beta signaling pathway might play a pivotal role in 5-FU resistance.
Immune checkpoints represent an immunosuppressive mechanism that allows cancer cells to escape anti-tumor immunity. Some immune checkpoint molecules have been identified as potential immunotherapeutic targets,Citation38 such as PD-1, PD-L1, CTLA-4, LAG-3, and TIM3.Citation21 We analyzed the association between Imm-R scores and the expression of immune checkpoint molecules. In patients with low risk, the expression of CTLA-4 was increased compared with patients with high risk (p = .043, Figure S6). However, there was no evidence of significant association between Imm-R scores and expression of PD-1, PD-L1, LAG-3, and TIM3 (Figure S6).
Correlations between the Imm-R scores and the clinical prognostic factors
We analyzed the correlations between the Imm-R scores and clinical prognostic factors, including gender, T stage, N stage, M stage, tumor location, KRAS mutation status, microsatellite state, BRAF mutation status, p53 mutation status, CpG island methylator phenotype, and chromosomal instability. Patients were stratified into different groups by each clinical factor and the Imm-R scores of different subgroups were compared. As shown in Figure S7, the Imm-R scores were significantly lower in patients with wild-type KRAS genotype and dMMR, suggesting that Imm-R score was intrinsically related to KRAS status and dMMR. However, no significant correlations were found between Imm-R scores and gender, T stage, N stage, M stage, tumor location, BRAF mutation status, p53 mutation status, CpG island methylator phenotype, or chromosomal instability.
Discussion
Fluoropyrimidine is an important component of systemic chemotherapeutic regimens for CRC patients in palliative and adjuvant settings.Citation5 However, patient response rates to fluoropyrimidine-based chemotherapy remain low, and a significant proportion of patients experience substantial side effects, without benefiting from chemotherapy. The prediction of response to chemotherapy is critical for effective treatment of CRC. An increasing number of studies indicate that the immune response is implicated in chemotherapy-induced cytotoxicity.Citation27 Here, we developed and validated a TIICs- and IRGs-based Imm-R model for prognostic prediction of CRC patients receiving fluoropyrimidine-based chemotherapy. The Imm-R model achieved favorable discrimination and calibration in both the training and the validation sets for identification of high-risk patients. Biological pathways involved in the risk model include activation of cell growth, proliferation and immune-related pathways, as well as defects in DNA damage and repair pathways. Our findings provide new insights into the role of immune responses in modulating patient response to fluoropyrimidine-based chemotherapy, with potential implications for personalized follow-up and decision-making regarding individualized chemotherapy in CRC patients.
The balance between the TIICs and the cancer cell population in the tumor microenvironment plays an important role in tumor progression.Citation39 The presence of TIICs within the tumor microenvironment is considered to reflect the immune interaction between the host and tumor.Citation40 Complex biological interactions occur between immune cells and cancer cells in the tumor microenvironment, which have substantial prognostic relevance because the immune system plays both tumor-promoting and -suppressing roles.Citation41 In the present study, we developed TIICs-based immune infiltration risk scores comprising Tfh, M0 macrophage, and eosinophil populations. Tfh and M0 macrophages were associated with favorable prognosis while eosinophils was an indicator of poor prognosis. Tfh is a specialized subset of CD4+ helper T cells present in the lymphoid organs and in peripheral blood.Citation42 Inducible costimulator (ICOS), C-X-C chemokine receptor type 5 (CXC-R5), and PD-1 are classic cell surface markers of Tfh cells,Citation43 which play a key role in the development of antigen-specific B cells.Citation44 Numerous studies suggest that Tfh cells exhibit antitumoral immunityCitation45 by promoting the effector functions of CD8 + T cells via the secretion of IL-21, which is downregulated due to PD-1/PD-L1-mediated suppression.Citation46 We found that Tfh cells were associated with favorable prognosis in patients receiving fluoropyrimidine-based chemotherapy, which indicated that Tfh cells might be a potential prognostic marker in the context of fluoropyrimidine treatment. Among various TIICs, macrophages of the M0 and M1 subtypes show the highest infiltration in TME compared with that in normal tissues.Citation47 Indeed, recent studies support the view that fully polarized macrophages (M1 and M2) are the extremes of a continuum of macrophage polarization.Citation48 M0 is the unactivated subtype, while M1 activates the inflammatory response and participates in the antitumoral response. M2 inhibits T cell proliferation and promotes tumor proliferation. A recent study found that the abundance of M0 and M1 subtypes was increased in TME of CRC tissues compared with that in normal tissues, indicating that these subtypes were implicated in CRC development and progression.Citation49 There was evidence to show that high densities of tumor-associated macrophages strongly predict the benefitting from 5-fluorouracil adjuvant therapy in stage III CRC patients.Citation50 Besides, in-vitro study indicated that exposure of M0 macrophages to 5-FU increased the expression of the M1-marker, which significantly enhanced the cytotoxicity. Eosinophils are evolutionarily conserved cells and are mainly studied in the context of allergies. Recent data indicate that eosinophils function as immune effectors and immunomodulators in the tumor microenvironment.Citation51 Tumor-infiltrating eosinophils is associated with improved survival of CRC patients.Citation52,Citation53 However, in the present study we found that infiltration of eosinophil was associated with a poor prognosis in CRC patients receiving 5-FU chemotherapy. Whether there is an interaction between eosinophils and 5-FU needs to be further investigated. In addition to the tumor immune microenvironment, which can affect the response to chemotherapy, chemotherapeutic agents can also affect the tumor immune microenvironment.Citation54 For example, oxaliplatin-induced tumor cell death invoked tumor-targeting immune responses, as shed tumor antigens captured and presented by dendritic cells causing activation of cytotoxic T lymphocytes.Citation55,Citation56 Interestingly, we found that no significant difference in OS between the Imm-R model-defined high- and low-risk patients when receiving FOLFOX (5-FU, leucovorin, and oxaliplatin). A possible explanation is that oxaliplatin promotes immunogenic death in high-risk patients.
Significant breakthroughs have been made in cancer immunotherapy; in particular, IRGs offer potential for the identification of new molecular targets for cancer immunotherapy.Citation57 In the present study, we identified seven IRGs with potential prognostic significance in patients receiving fluoropyrimidine-based chemotherapy. CCL22 plays an important role in the regulation of the tumor microenvironment.Citation58 A recent study indicated that CCL22 could be used as a biological factor to evaluate tumor chemotherapy response and progression in CRC.Citation59 These previous findings along with the current results highlight the potential application of CCL22 for enabling improved management of adjuvant chemotherapeutic regimens in patients with CRC during preoperative and postoperative evaluation. FGF19 belongs to the fibroblast growth factor (FGF) family, which exhibits broad mitogenic and cell survival activities. FGF19 expression is increased in CRC samples, and FGF19 blockade has been shown to inhibit the growth of colon tumors.Citation60 LGR5 is a promising marker of cancer stem-like cells in colorectal cancer.Citation61 Overexpression of LGR5 is associated with poor survival and recurrence in CRC.Citation62 Furthermore, LGR5 is a predictive marker for fluoropyrimidine-based adjuvant chemotherapeutic response in CRC, which was in line with our results.Citation63 TACSTD2 is up-regulated in CRC and associated with response to short-term 5-fluoropyrimidine treatment in P53-depleted HCT116 colon cancer.Citation64 IRGs in our established Imm-R scores can be regarded as individual biomarkers, and their immune features and prognostic significance may enable better management of patients receiving fluoropyrimidine-based chemotherapy.
Although the present findings provide new insights into the impact of immune responses on outcomes of fluoropyrimidine-based chemotherapy, there are limitations to our work. First, the data on which the prediction model was built were obtained from public databases, and it was not possible to obtain all information needed for each patient which may affect the accuracy of results. Second, there was significant heterogeneity in the patients in the study. For example, GSE39582 contained patients with stages II–IV, and GSE103479 derived from CRC patients with stage II–III, while GSE72968 and GSE72969 included patients with metastatic CRC. Although the risk model was validated in different populations, this study might overlooked factors that had a potential impact on the risk model. Third, although the expression profiling data included in this study were all derived from gene microarray, different sources of gene microarrays, different analysis procedures may affect the accuracy of this study. Fourth, the statistical tests widely used in this study and the resulting false positives required attention.
In summary, we systematically identified prognostic TIICs and IRGs and developed and validated a TIICs- and IRGs-based Imm-R model for identifying CRC patients receiving fluoropyrimidine-based chemotherapy with poor prognosis. These results have potential implications for personalized follow-up and decision-making regarding individualized chemotherapy in CRC patients.
Materials and Methods
CRC datasets and preprocessing
We systematically searched publicly available CRC gene expression data sets on Gene Expression Omnibus (GEO) database fulfilled the following criteria: (1) tumor samples derived from CRC patients receiving fluoropyrimidine-based chemotherapy, (2) gene expression was detected by microarray or high-throughput sequencing, (3) chemotherapy and prognosis was available. Exclusion criteria included: (1) samples derived from in vitro or in vivo experiments or human xenografts, (2) data set cannot be processed. In total, we collected four datasets (GSE39582,Citation65 GSE103479,Citation66 GSE72968,Citation67 and GSE72969Citation67). Dataset GSE39582 contained patients with stage II–IV, and GSE103479 derived from CRC patients with stage II–III, while GSE72968 and GSE72969 included patients with metastatic CRC. GSE39582 served as the training set and GSE103479 served as the validation set1. GSE72968 and GSE72969 were generated using the same microarray platform by the same research group in France, so we combined them into validation set2. GSE39582, GSE72968 and GSE72969 were generated using the Affymetrix Human Genome U133 Plus 2.0 Array and GSE103479 was generated by Almac Diagnostics Custom Xcel array. The raw data of all microarray datasets were downloaded from GEO and subjected to background adjustment using the RMA algorithm.Citation68 The microarray probe set was then mapped to the gene symbol according to the platform annotation file. Corresponding clinical characteristics of CRC samples were also obtained. Overall survival is defined as the length of time from the date of diagnosis to death. Recurrence-free survival is defined as the length of time after primary treatment ends that the patient survives without any signs or symptoms of CRC.
In order to investigate the potential mechanisms of 5-FU resistance, we downloaded a microarray dataset (GSE81005) derived from wild type and 5-FU-induced resistant HCT-8 human colorectal cancer cells. GSE81005 was detected by Affymetrix Human Gene Expression Array. The raw data of the microarray datasets were downloaded from GEO. Datasets were normalized and annotated as described above.
Inference of infiltrating cells in the tumor microenvironment
To evaluate the abundance of TIICs in the CRC samples, we employed the LM22 gene signature and the CIBERSORT algorithm, which could sensitively and specifically discriminate 22 human immune cell phenotypes (B cells, T cells, NK cells, macrophages, DCs, and myeloid subsets).Citation69 CIBERSORT is a deconvolution algorithm based on support vector regression, which uses a set of reference gene-expression values corresponding to a minimal representation for each cell type to infer cell type proportions in data from bulk tumor samples with mixed cell types. The CIBERSORT algorithm can, in particular, be used to derive the proportion of cells in complex microarray data.Citation17 Using Monte Carlo sampling, CIBERSORT calculates the empirical p value of the deconvolution to indicate the accuracy of the results, while a p value of <0.05 indicates that the inferred cell composition is highly reliable.Citation29 Therefore, we only retained CRC samples with CIBERSORT p values <0.05 for subsequent analysis.
Construction and validation of tumor-infiltrating immune cell signature
In the training set, we first applied the univariable Cox proportional hazards regression model to define the prognostic value of the TIICs for overall survival (OS). The optimal cutoff values of the proportions of different TIICs in the training cohort were calculated on the basis of the prognostic significance using X-Tile software.Citation70 TIICs with significant prognostic value were first validated in the validation set. TIICs with significant prognostic value in both training set and validation set were analyzed using the multivariate Cox proportional hazards regression model, and those with a p value < 0.05 were used to construct the TIICs signature. The individual TIICs scores were calculated based on the immune cell signature. A formula for the TIICs scores was established to predict patient survival: TIICs scores = (−0.990 × abundance of Tfh)+(−0.731 × abundance of Macrophages M0) + (0.655 × abundance of Eosinophils). The prognostic performance of the TIICs signature was evaluated using the receiver operating characteristic (ROC) curve and area under the curve (AUC).
Construction and validation of the immune risk (Imm-R) model
We integrated the IRGs and TIICs signature to develop the Imm-R model. A functionally annotated list of IRGs (n = 1811), using Gene Ontology, was downloaded from ImmPort, and a list of genes related to antitumor immunity as reported in literatures was obtained from TISIDB (n = 988). Merging the two lists and removing duplicate genes resulted in 2404 unique IRGs. We first performed univariate Cox regression analysis for preliminary screening of survival-associated IRGs in the training set. Genes entered the model as continuous variables. Based on a significance threshold of p value < 0.05, the significative IRGs determined by univariate Cox regression analysis and TIICs risk scores were subjected to LASSO-penalized Cox regression analysis. In this regression analysis, the penalty parameter lambda.1se for prevention of overfitting was selected using 10-fold cross validation.Citation71 The features selected by LASSO-penalized Cox regression were subsequently entered into the multivariate Cox proportional hazards regression model. Finally, features with p values < 0.05 in the multivariate Cox proportional hazards regression model were used for construction of the Imm-R model. A formula for the Imm-R score was established to predict patient survival:
Imm-R score = (−0.939× PSMD3)+(−1.304× CCL22)+(0.319× FGF19)+(−0.228× LGR5)+(0.665× SKAP1)+(0.182× TACSTD2)+(0.329× S100A4)+(0.809× TIICs scores)
The individual Imm-R score in both training set and validation set was calculated according to the formula accordingly.
A nomogram was used to visualize the Imm-R model and predict the three-year and five-year survival rate. The ROC curve and AUC were used to evaluate the discrimination, and the calibration curve was used to evaluate the goodness of fit of the Imm-R model.
Biological significance of the Imm-R model
To explore the biological implication of the Imm-R model, we performed a gene set enrichment analysis (GSEA) using the clusterProfiler R package.Citation72,Citation73 The Kyoto Encyclopedia of Genes and Genomes (KEGG) pathways and Gene ontology (GO) biological process were evaluated. Differential expression analysis was performed using the “limma” package with False Discovery Rates (FDR) <0.05 and |logFC| >1 as the threshold.
Statistical analysis
In this study, all statistical analyses were performed using R software (version 3.5.1; https://www.Rproject.org/). Continuous variables were compared using Student’s t-tests or Wilcoxon rank-sum tests. Survival analyses were conducted using the Kaplan–Meier method with log-rank test by ‘survival’ package. Feature selection and model construction were conducted with Univariate and Multivariate Cox regression. Time-dependent ROC curve and LASSO Cox regression analysis with 10-fold cross-validation and nomogram were estimated using R packagesCitation74 (survivalROC, glmnet, rms). Unless otherwise stated, statistical significance was defined at p values < 0.05. The planned sample size was calculated with α of 0.05, β of 0.2 and HR of the risk score in the training set.
Disclosure of interest
The authors report no conflict of interest.
Authors’ Contributions
XM, XH, JL, and WT conceived the study; XH, HL1, and YL contribute to the cohort selection; XM, XH, JL, WT, YF, CW, HL1, HR, HQ, HL2, GW, WX, and FJ contributed to data acquisition and analysis. XH, YF, and HL1 interpreted data and XM, XH and YF drafted the manuscript. YL, JL, and WT revised the the manuscript and proved the final version. All authors revised and approved the manuscript.
Supplemental Material
Download ()Acknowledgments
The authors would like to thank Lingxu Huang, Chao Tian, Jianhong Chen, Yongsheng Meng and Zigao Huang for the contribution in data collection and collation.
Supplementary material
Supplemental data for this article can be accessed on the publisher’s website.
Additional information
Funding
References
- Bray F, Ferlay J, Soerjomataram I, Siegel RL, Torre LA, Jemal A. Global cancer statistics 2018: GLOBOCAN estimates of incidence and mortality worldwide for 36 cancers in 185 countries. CA Cancer J Clin. 2018 [2018/September/13];68(6):394–15. doi:10.3322/caac.21492.
- Van Cutsem E, Cervantes A, Adam R, Sobrero A, Van Krieken JH, Aderka D, Aranda Aguilar E, Bardelli A, Benson A, Bodoky G, et al. ESMO consensus guidelines for the management of patients with metastatic colorectal cancer. Ann Oncolo: Official Journal of the European Society for Medical Oncology. 2016;27(8):1386–1422. doi:10.1093/annonc/mdw235.
- Gray R, Barnwell J, McConkey C, Hills RK, Williams NS, Kerr DJ. Adjuvant chemotherapy versus observation in patients with colorectal cancer: a randomised study. Lancet (London, England). 2007;370(9604):2020–2029. doi:10.1016/s0140-6736(07)61866-2.
- Van Cutsem E, Nordlinger B, Cervantes A. Advanced colorectal cancer: ESMO clinical practice guidelines for treatment. Ann Oncolo: Official Journal of the European Society for Medical Oncology. 2010 [2010/June/29];21(Suppl 5):v93–97. doi:10.1093/annonc/mdq222.
- Vodenkova S, Buchler T, Cervena K, Veskrnova V, Vodicka P, Vymetalkova V. 5-fluorouracil and other fluoropyrimidines in colorectal cancer: past, present and future. Pharmacol Ther. 2019:107447. 2019/November/23 doi:10.1016/j.pharmthera.2019.107447.
- Benson AB 3rd, Schrag D, Somerfield MR, Cohen AM, Figueredo AT, FlynnMonika K. Krzyzanowska PJ, Maroun J, McAllister P, Cutsem EV, Brouwers M, et al. American society of clinical oncology recommendations on adjuvant chemotherapy for stage II colon cancer. J Clinl Oncol: Official Journal of the American Society of Clinical Oncology. 2004 2004/June/17;22:3408–3419. doi:10.1200/jco.2004.05.063.
- Kumar A, Kennecke HF, Renouf DJ, Lim HJ, Gill S, Woods R, Speers C, Cheung WY. Adjuvant chemotherapy use and outcomes of patients with high-risk versus low-risk stage II colon cancer. Cancer. 2015 [2014/October/22];121(4):527–534. doi:10.1002/cncr.29072.
- Chew V, Toh HC, Abastado JP. Immune microenvironment in tumor progression: characteristics and challenges for therapy. J Oncol. 2012 2012/August/29;2012:608406. doi:10.1155/2012/608406.
- Pitt JM, Marabelle A, Eggermont A, Soria J-C, Kroemer G, Zitvogel L. Targeting the tumor microenvironment: removing obstruction to anticancer immune responses and immunotherapy. Ann Oncolo: Official Journal of the European Society for Medical Oncology. 2016 2016/April/14;27:1482–1492. doi:10.1093/annonc/mdw168.
- Brockhoff G, Seitz S, Weber F, Zeman F, Klinkhammer-Schalke M, Olaf Ortmann O, Wege AK. The presence of PD-1 positive tumor infiltrating lymphocytes in triple negative breast cancers is associated with a favorable outcome of disease. Oncotarget. 2018 2018/February/22;9:6201–6212. doi:10.18632/oncotarget.23717.
- Hung K, Hayashi R, Lafond-Walker A, Lowenstein C, Pardoll D, Levitsky H. The central role of CD4+ T cells in the antitumor immune response. J Exp Med. 1998 [1998/December/22];188(12):2357–2368. doi:10.1084/jem.188.12.2357.
- Chiba T, Ohtani H, Mizoi T, Naito Y, Sato E, Nagura H, Ohuchi A, Ohuchi K, Shiiba K, Kurokawa Y, et al. Intraepithelial CD8+ T-cell-count becomes a prognostic factor after a longer follow-up period in human colorectal carcinoma: possible association with suppression of micrometastasis. Br J Cancer. 2004;91(9):1711–1717. doi:10.1038/sj.bjc.6602201.
- Mao Y, Feng Q, Zheng P, Yang L, Zhu D, Chang W, Ji M, He G, Xu J. Low tumor infiltrating mast cell density confers prognostic benefit and reflects immunoactivation in colorectal cancer. Intl J Cancer. 2018 [2018/June/07];143(9):2271–2280. doi:10.1002/ijc.31613.
- Kocián P, Šedivcová M, Drgáč J, Černá K, Hoch J, Kodet R, Bartůňková J, Špíšek R, Fialová A. Tumor-infiltrating lymphocytes and dendritic cells in human colorectal cancer: their relationship to KRAS mutational status and disease recurrence. Hum Immunol. 2011 [2011/September/03];72(11):1022–1028. doi:10.1016/j.humimm.2011.07.312.
- Saito T, Nishikawa H, Wada H, Nagano Y, Sugiyama D, Atarashi K, Maeda Y, Hamaguchi M, Ohkura N, Sato E, et al. Two FOXP3(+)CD4(+) T cell subpopulations distinctly control the prognosis of colorectal cancers. Nat Med. 2016 2016/April/26;22:679–684. doi:10.1038/nm.4086.
- Xiong Y, Wang K Profiles of immune infiltration in colorectal cancer and their clinical significant: a gene expression-based study. 2018. DOI:10.1002/cam4.1745.
- Chen B, Khodadoust MS, Liu CL, Newman AM, Alizadeh AA. Profiling tumor infiltrating immune cells with CIBERSORT. Methods Mol Biol (Clifton, NJ). 2018 2018/January/19;1711:243–259. doi:10.1007/978-1-4939-7493-1_12.
- Yao Y, Yan Z, Lian S, Wei L, Zhou C, Feng D, Zhang Y, Yang J, Li M, Chen Y, et al. Prognostic value of novel immune-related genomic biomarkers identified in head and neck squamous cell carcinoma. J Immunother Cancer. 2020;8(2):e000444. doi:10.1136/jitc-2019-000444.
- Cao Y, He H, Li R, Liu X, Chen Y, Qi Y, Yu K, Wang J, Lin C, Liu H, et al. Latency-associated peptide identifies immunoevasive subtype gastric cancer with poor prognosis and inferior chemotherapeutic responsiveness. Ann Surg. 2020. Publish Ahead of Print. 2020/June/09 doi:10.1097/sla.0000000000003833.
- Gentles AJ, Newman AM, Liu CL, Bratman SV, Feng W, Kim D, Nair VS, Xu Y, Khuong A, Hoang CD, et al. The prognostic landscape of genes and infiltrating immune cells across human cancers. Nat Med. 2015;21(8):938–945. doi:10.1038/nm.3909.
- Narayanan S, Kawaguchi T, Peng X, Qi Q, Liu S, Yan L, Takabe K. Tumor infiltrating lymphocytes and macrophages improve survival in microsatellite unstable colorectal cancer. Sci Rep. 2019 [2019/September/19];9(1):13455. doi:10.1038/s41598-019-49878-4.
- Roelands J, Kuppen PJK, Vermeulen L, Maccalli C, Decock J, Wang E, Marincola F, Bedognetti D, Hendrickx W. Immunogenomic classification of colorectal cancer and therapeutic implications. Int J Mol Sci. 2017 [2017/October/25];18(10):2229. doi:10.3390/ijms18102229.
- Ke J, Liu X-H, Jiang X-F, He Z, Xiao J, Zheng B, Chen Y-F, Cai Z-R, Zheng X-B, Zou Y-F, et al. Immune-related gene signature in predicting prognosis of early-stage colorectal cancer patients. Eur Jf Surgl Oncol: The Journal of the European Society of Surgical Oncology and the British Association of Surgical Oncology. 2020;46(10):e62–e70. doi:10.1016/j.ejso.2020.08.008.
- Wu J, Zhao Y, Zhang J, Wu Q, Wang W. Development and validation of an immune-related gene pairs signature in colorectal cancer. Oncoimmunology. 2019 [2019/May/31];8(7):1596715. doi:10.1080/2162402x.2019.1596715.
- Li Y, Liang L, Dai W, Cai G, Xu Y, Li X, Li Q, Cai S. Prognostic impact of programed cell death-1 (PD-1) and PD-ligand 1 (PD-L1) expression in cancer cells and tumor infiltrating lymphocytes in colorectal cancer. Mol Cancer. 2016 [2016/August/25];15(1):55. doi:10.1186/s12943-016-0539-x.
- Fehlker M, Huska MR, Jons T, Andrade-Navarro MA, Kemmner W. Concerted down-regulation of immune-system related genes predicts metastasis in colorectal carcinoma. BMC Cancer. 2014 [2014/February/06];14(1):64. doi:10.1186/1471-2407-14-64.
- Medler TR, Cotechini T, Coussens LM. Immune response to cancer therapy: mounting an effective antitumor response and mechanisms of resistance. Trends in Cancer. 2015 [2015/October/13];1(1):66–75. doi:10.1016/j.trecan.2015.07.008.
- Opzoomer JW, Sosnowska D, Anstee JE, Spicer JF, Arnold JN. Cytotoxic chemotherapy as an immune stimulus: a molecular perspective on turning up the immunological heat on cancer. Front Immunol. 2019 2019/August/06;10:1654. doi:10.3389/fimmu.2019.01654.
- Ali HR, Chlon L, Pharoah PD, Markowetz F, Caldas C. Patterns of immune infiltration in breast cancer and their clinical implications: a gene-expression-based retrospective study. PLoS Med. 2016 [2016/December/14];13(12):e1002194. doi:10.1371/journal.pmed.1002194.
- Schulz M, Salamero-Boix A, Niesel K, Alekseeva T, Sevenich L. Microenvironmental regulation of tumor progression and therapeutic response in brain metastasis. Front Immunol. 2019 2019/August/10;10:1713. doi:10.3389/fimmu.2019.01713.
- Zhao P, Li L, Jiang X, Li Q. Mismatch repair deficiency/microsatellite instability-high as a predictor for anti-PD-1/PD-L1 immunotherapy efficacy. J Hematol Oncol. 2019 [2019/June/04];12(1):54. doi:10.1186/s13045-019-0738-1.
- Lal N, White BS, Goussous G, Pickles O, Mason MJ, Beggs AD, Taniere P, Willcox BE, Guinney J, Middleton GW, et al. KRAS mutation and consensus molecular subtypes 2 and 3 are independently associated with reduced immune infiltration and reactivity in colorectal cancer. Clin Cancer Res: An Official Journal of the American Association for Cancer Research. 2018;24(1):224–233. doi:10.1158/1078-0432.ccr-17-1090.
- Turley SJ, Cremasco V, Astarita JL. Immunological hallmarks of stromal cells in the tumour microenvironment. Nat Rev Immunol. 2015 [2015/October/17];15(11):669–682. doi:10.1038/nri3902.
- Bedognetti D, Ceccarelli M, Galluzzi L, Lu R, Palucka K, Samayoa J, Spranger S, Warren S, Wong -K-K, Ziv E, et al. Toward a comprehensive view of cancer immune responsiveness: a synopsis from the SITC workshop. J Immunother Cancer. 2019;7(1):131. doi:10.1186/s40425-019-0602-4.
- Bhattacharya S, Dunn P, Thomas CG, Smith B, Schaefer H, Chen J, Hu Z, Zalocusky KA, Shankar RD, Shen-Orr SS, et al. ImmPort, toward repurposing of open access immunological assay data for translational and clinical research. Sci Data. 2018;5(1):180015. doi:10.1038/sdata.2018.15.
- Ru B, Wong CN, Tong Y, Zhong JY, Zhong SSW, Wu WC, Chu KC, Wong CY, Lau CY, Chen I, et al. TISIDB: an integrated repository portal for tumor-immune system interactions. Bioinformatics. 2019. 2019/March/25 doi:10.1093/bioinformatics/btz210.
- Fang Y, Yang C, Zhang L, Wei L, Lin J, Zhao J, Peng J. Spica prunellae extract enhances fluorouracil sensitivity of 5-fluorouracil-resistant human colon carcinoma HCT-8/5-FU cells via TOP2 α and miR-494. Biomed Res Int. 2019 2019/October/31;2019:5953619. doi:10.1155/2019/5953619.
- Lee LH, Cavalcanti MS, Segal NH, Hechtman JF, Weiser MR, Smith JJ, Garcia-Aguilar J, Sadot E, Ntiamoah P, Markowitz AJ, et al. Patterns and prognostic relevance of PD-1 and PD-L1 expression in colorectal carcinoma. Mod Pathol: An Official Journal of the United States and Canadian Academy of Pathology, Inc. 2016;29(11):1433–1442. doi:10.1038/modpathol.2016.139.
- Senovilla L, Vitale I, Martins I, Tailler M, Pailleret C, Michaud M, Galluzzi L, Adjemian S, Kepp O, Niso-Santano M, et al. An immunosurveillance mechanism controls cancer cell ploidy. Science (New York, NY). 2012;337(6102):1678–1684. doi:10.1126/science.1224922.
- Schreiber RD, Old LJ, Smyth MJ. Cancer immunoediting: integrating immunity’s roles in cancer suppression and promotion. Science (New York, NY). 2011 2011/March/26;331:1565–1570. doi:10.1126/science.1203486.
- Nagalla S, Chou JW, Willingham MC, Ruiz J, Vaughn JP, Dubey P, Lash TL, Hamilton-Dutoit SJ, Bergh J, Sotiriou C, et al. Interactions between immunity, proliferation and molecular subtype in breast cancer prognosis. Genome Biol. 2013;14(4):R34. doi:10.1186/gb-2013-14-4-r34.
- Varricchi G, Bencivenga L, Poto R, Pecoraro A, Shamji MH, Rengo G. The emerging role of T follicular helper (TFH) cells in aging: influence on the immune frailty. Ageing Res Rev. 2020 2020/April/29;61:101071. doi:10.1016/j.arr.2020.101071..
- Breitfeld D, Ohl L, Kremmer E, Ellwart J, Sallusto F, Lipp M, Förster R. Follicular B helper T cells express CXC chemokine receptor 5, localize to B cell follicles, and support immunoglobulin production. J Exp Med. 2000 [2000/December/06];192(11):1545–1552. doi:10.1084/jem.192.11.1545.
- Crotty S. A brief history of T cell help to B cells. Nat Rev Immunol. 2015 [2015/February/14];15(3):185–189. doi:10.1038/nri3803.
- Ma CS, Deenick EK. Human T follicular helper (Tfh) cells and disease. Immunol Cell Biol. 2014 [2013/October/23];92(1):64–71. doi:10.1038/icb.2013.55.
- Shi W, Dong L, Sun Q, Ding H, Meng J, Dai G. Follicular helper T cells promote the effector functions of CD8+ T cells via the provision of IL-21, which is downregulated due to PD-1/PD-L1-mediated suppression in colorectal cancer. Exp Cell Res. 2018 [2018/September/12];372(1):35–42. doi:10.1016/j.yexcr.2018.09.006.
- Mantovani A, Sozzani S, Locati M, ALLAVENA P, SICA A. Macrophage polarization: tumor-associated macrophages as a paradigm for polarized M2 mononuclear phagocytes. Trends Immunol. 2002/October/29 2002;23(11):549–555. doi:10.1016/S1471-4906(02)02302-5.
- Murray PJ, Allen JE, Biswas SK, Fisher E, Gilroy D, Goerdt S, Gordon S, Hamilton J, Ivashkiv L, Lawrence T, et al. Macrophage activation and polarization: nomenclature and experimental guidelines. Immunity. 2014;41(1):14–20. doi:10.1016/j.immuni.2014.06.008.
- Ge P, Wang W, Li L, Zhang G, Gao Z, Tang Z, Dang X, Wu Y. Profiles of immune cell infiltration and immune-related genes in the tumor microenvironment of colorectal cancer. Biomed Pharmacother = Biomedecine & Pharmacotherapie. 2019 2019/July/28;118:109228. doi:10.1016/j.biopha.2019.109228.
- Malesci A, Bianchi P, Celesti G, Basso G, Marchesi F, Grizzi F, Di Caro G, Cavalleri T, Rimassa L, Palmqvist R, et al. Tumor-associated macrophages and response to 5-fluorouracil adjuvant therapy in stage III colorectal cancer. Oncoimmunology. 2017;6(12):e1342918. doi:10.1080/2162402x.2017.1342918.
- Reichman H, Karo-Atar D, Munitz A. Emerging roles for eosinophils in the tumor microenvironment. Trends in Cancer. 2016 [2017/July/26];2(11):664–675. doi:10.1016/j.trecan.2016.10.002.
- Prizment AE, Vierkant RA, Smyrk TC, Tillmans LS, Lee JJ, Sriramarao P, Nelson HH, Lynch CF, Thibodeau SN, Church TR, et al. Tumor eosinophil infiltration and improved survival of colorectal cancer patients: iowa women’s health study. Mod Pathol: An Official Journal of the United States and Canadian Academy of Pathology, Inc. 2016;29(5):516–527. doi:10.1038/modpathol.2016.42.
- Sakkal S, Miller S, Apostolopoulos V, Nurgali K. Eosinophils in Cancer: favourable or Unfavourable? Curr Med Chem. 2016 2016/January/21;23:650–666. doi:10.2174/0929867323666160119094313.
- Tesniere A, Schlemmer F, Boige V, Kepp O, Martins I, Ghiringhelli F, Aymeric L, Michaud M, Apetoh L, Barault L, et al. Immunogenic death of colon cancer cells treated with oxaliplatin. Oncogene. 2010;29(4):482–491. doi:10.1038/onc.2009.356.
- Kalanxhi E, Meltzer S, Schou JV, Larsen FO, Dueland S, Flatmark K, Jensen BV, Hole KH, Seierstad T, Redalen KR, et al. Systemic immune response induced by oxaliplatin-based neoadjuvant therapy favours survival without metastatic progression in high-risk rectal cancer. Br J Cancer. 2018 2018/April/27;118:1322–1328. doi:10.1038/s41416-018-0085-y.
- Zhu H, Shan Y, Ge K, Lu J, Kong W, Jia C. Oxaliplatin induces immunogenic cell death in hepatocellular carcinoma cells and synergizes with immune checkpoint blockade therapy. Cell Oncol (Dordrecht). 2020; 2020/August/17. doi:10.1007/s13402-020-00552-2.
- Christopher MJ, Petti AA, Rettig MP, Miller CA, Chendamarai E, Duncavage EJ, Klco JM, Helton NM, O’Laughlin M, Fronick CC,et al. Immune escape of relapsed AML cells after allogeneic transplantation. N Engl J Med. 2018 2018/November/01;379:2330–2341. doi:10.1056/NEJMoa1808777.
- Wu S, He H, Liu H, Cao Y, Li R, Zhang H, Li H, Shen Z, Qin J, Xu J. C-C motif chemokine 22 predicts postoperative prognosis and adjuvant chemotherapeutic benefits in patients with stage II/III gastric cancer. Oncoimmunology. 2018;7(6):e1433517. doi:10.1080/2162402x.2018.1433517.
- Wei C, Yang C, Wang S, Shi D, Zhang C, Lin X, Xiong B. M2 macrophages confer resistance to 5-fluorouracil in colorectal cancer through the activation of CCL22/PI3K/AKT signaling. Onco Targets Ther. 2019 2019/May/23;12:3051–3063. doi:10.2147/ott.S198126.
- Desnoyers LR, Pai R, Ferrando RE, Hötzel K, Le T, Ross J, Carano R, D’Souza A, Qing J, Mohtashemi I, et al. Targeting FGF19 inhibits tumor growth in colon cancer xenograft and FGF19 transgenic hepatocellular carcinoma models. Oncogene. 2008;27(1):85–97. doi:10.1038/sj.onc.1210623.
- Wu W, Cao J, Ji Z, Wang J, Jiang T, Ding H. Co-expression of Lgr5 and CXCR4 characterizes cancer stem-like cells of colorectal cancer. Oncotarget. 2016 2016/November/12;7:81144–81155. doi:10.18632/oncotarget.13214.
- Liu Z, Dai W, Jiang L, Cheng Y. Over-expression of LGR5 correlates with poor survival of colon cancer in mice as well as in patients. Neoplasma. 2014 [2013/September/26];61(2):177–185. doi:10.4149/neo_2014_016.
- Stanisavljevic L, Myklebust MP, Leh S, Dahl O. LGR5 and CD133 as prognostic and predictive markers for fluoropyrimidine-based adjuvant chemotherapy in colorectal cancer. Acta Oncologica (Stockholm, Sweden). 2016 2016/July/21;55:1425–1433. doi:10.1080/0284186x.2016.1201215.
- Adamsen BL, Kravik KL, Clausen OP, De AngelisPM. Apoptosis, cell cycle progression and gene expression in TP53-depleted HCT116 colon cancer cells in response to short-term 5-fluorouracil treatment. Int J Oncol. 2007. 31:1491–1500. 2007/November/06
- Marisa L, de Reynies A, Duval A, Selves J, Pierre Gaub M, Vescovo L, Etienne-Grimaldi MC, Schiappa R, Guenot D, Guenot M, et al. Gene expression classification of colon cancer into molecular subtypes: characterization, validation, and prognostic value. PLoS Med. 2013 2013/May/24;10:e1001453. doi:10.1371/journal.pmed.1001453.
- Allen WL, Dunne PD, McDade S, Scanlon E, Loughrey M, Coleman H, McCann C, McLaughlin K, Nemeth Z, Syed N, et al. Transcriptional subtyping and CD8 immunohistochemistry identifies poor prognosis stage II/III colorectal cancer patients who benefit from adjuvant chemotherapy. JCO Precisi Oncol. 2018. 2018. 2018/August/09 doi:10.1200/po.17.00241.
- Del Rio M, Mollevi C, Bibeau F, Vie N, Selves J, Emile J-F, Roger P, Gongora C, Robert J, Tubiana-Mathieu N, et al. Molecular subtypes of metastatic colorectal cancer are associated with patient response to irinotecan-based therapies. Eur J Cancer (Oxford, England: 1990). 2017 2017/March/12;76:68–75. doi:10.1016/j.ejca.2017.02.003.
- Gautier L, Cope L, Bolstad BM, Irizarry RA. Affy–analysis of Affymetrix GeneChip data at the probe level. Bioinformatics. 2004 2004/February/13;20:307–315. doi:10.1093/bioinformatics/btg405.
- Newman AM, Liu CL, Green MR, Gentles AJ, Feng W, Xu Y, Hoang CD, Diehn M, Alizadeh AA. Robust enumeration of cell subsets from tissue expression profiles. Nat Methods. 2015 [2015/March/31];12(5):453–457. doi:10.1038/nmeth.3337.
- Camp RL, Dolled-Filhart M, Rimm DL. X-tile: a new bio-informatics tool for biomarker assessment and outcome-based cut-point optimization. Clin Cancer Res: An Official Journal of the American Association for Cancer Research. 2004 2004/November/10;10:7252–7259. doi:10.1158/1078-0432.Ccr-04-0713.
- Goeman JJ. L1 penalized estimation in the Cox proportional hazards model. Biom J. 2010 2009/November/26;52:70–84. doi:10.1002/bimj.200900028.
- Subramanian A, Tamayo P, Mootha V, Mukherjee S, Ebert BL, Gillette MA, Paulovich A, Pomeroy SL, Golub TR, Lander ES, et al. Gene set enrichment analysis: a knowledge-based approach for interpreting genome-wide expression profiles. Proc Natl Acad Sci USA. 2005;102(43):15545–15550. doi:10.1073/pnas.0506580102.
- Yu G, Wang L-G, Han Y, He Q-Y. clusterProfiler: an R package for comparing biological themes among gene clusters. Omics-a Journal of Integrative Biology. 2012;16:284–287. doi:10.1089/omi.2011.0118.
- Tibshirani R. Regression shrinkage selection via the LASSO. J R Stat Soc Series B Stat Methodol. 2011;73:273–282.