
ABSTRACT
Angiotensin-converting enzyme (ACE) inhibitors are frequently used to treat hypertension and congestive heart failure. Preclinical data show that ACE plays a role on both innate and adaptive immune responses. Since interactions between ACE inhibitors and immune checkpoint inhibitors (ICIs) have not been reported, the aim of this study is to investigate the influence of ACE inhibitors on non-small cell lung cancer (NSCLC) patients treated with programmed cell death-1 (PD-1)/programmed cell death-ligand 1 (PD-L1) inhibitors. We conducted a retrospective cohort analysis of NSCLC patients treated with PD-1/PD-L1 inhibitors. Clinical and co-medication data as well as tumor biopsies were collected. Groups were defined according to patients’ co-medications at the time of ICI initiation. Among the 178 patients included, 22 (13.1%) received ACE inhibitors. While baseline characteristics were similar in both groups, ACE inhibitors group had a shorter median PFS (Progression-Free Survival) compared to the control group: 1.97 vs. 2.56 months, p = .01 (HR = 1.8 CI95% 1.1–2.8). Using CIBERSORT, RNA sequencing suggested that tumors from the ACE inhibitors group had less M1 macrophages, activated mast cells, NK cells and memory activated T cells, thus suggesting an immunosuppressed state. In vitro, the ACE inhibitor, captopril, induced M2 marker at the cell surface of monocytes engaged into M1 differentiation. Thus, ACE inhibitors prescription concomitant to PD-1/PD-L1 inhibitors treatment seems to be associated with impaired outcome and with a tumor immunosuppressed state in patients with advanced NSCLC. These results should be validated in larger prospective cohorts.
Introduction
Immune checkpoint inhibitors (ICIs) targeting the programmed cell death-1 (PD-1) and programmed cell death ligand-1 (PD-L1) are currently used in lung cancer therapy. These treatments are the standard of care as monotherapy when used in first line, if 50% of cancer cells express PD-L1. Additionally, they are also used in second or further lines after chemotherapy failure, regardless of PD-L1 status.Citation1 Moreover, anti PD-1/PD-L1 is efficient in combination with anti CTLA-4 or chemotherapy in the first line setting.Citation2–4 Recently, ICIs have also demonstrated efficacy in patients treated in the neoadjuvant setting, or with localized tumors with concomitant chemo-radiation therapy.Citation5,Citation6 Despite these unprecedented advances, many patients develop primary or acquired resistance to ICIs. Primary resistance occurs in 35% to 44% cases and remains difficult to predict.Citation7,Citation8 In addition, some patients also present rapid hyperprogression, following ICIs treatment.Citation9 Together, these findings underline the unmet need to find additional biomarkers to optimize ICIs administration.Citation10 Important efforts have been dedicated to develop powerful new biomarkers, which focus on surrogate markers of antitumor immune response, such as inflammatory gene expression signaturesCitation11,Citation12 or T-cell infiltration.Citation13,Citation14 Genetic biomarkers are also powerful tools which help to predict response to ICIs. Tumor mutational burdenCitation15–19 produced neopeptidesCitation20 and some particular genetic mutations or signaturesCitation21 can also be associated with response or resistance to ICIs.Citation22
In addition to these genetic parameters, some clinical factors are also associated with response to ICIs. Performance status is the most important clinical biomarker of response to ICIs and patients with WHO performance status of 2 or more have a very poor probability to respond to ICIs monotherapy.Citation23 Increasing attention has been attributed to certain concomitant medications, which have recently been associated with poor response to ICI. For example, baseline or prolonged corticosteroid use has been shown to abrogate the immune response and worsen outcomes in patients with NSCLC.Citation24,Citation25 Likewise, antibiotics use has also been associated with resistance to anti-PD-1/PD-L1 mAb.Citation26 The rationale behind this observation is based on preclinical observations showing that an intact intestinal microbiota is required for maintaining gut homeostasis and to promote anti-cancer immune response.Citation27–29 Antibiotics can reduce gut microbiota diversity and impede antitumor immune response or promote immunosuppression. Due to age and associated comorbidities, patients with NSCLC frequently receive additional concomitant therapies. Notwithstanding corticosteroids and antibiotics, perhaps the most frequent of these concomitant medications are anti-diabetic and cardiovascular drugs. Interestingly, many biological data have highlighted the effect of these concomitant therapies on innate and adaptive immune response,Citation30–32 therefore building a rationale for the impact of these drugs on ICIs efficacy. In this large retrospective study, we aim to further define the impact of concomitant drug use on ICI efficacy in patients with NSCLC treated with anti-PD-1/PD-L1.
Results
Patients’ characteristics
One hundred and seventy eight patients were included in this study. Twenty-three patients and 155 patients were treated in first line or further line, respectively, with either pembrolizumab, nivolumab (anti-PD-1) or durvalumab (anti-PD-L1). The frequency of concomitant treatment usage was 59%. We noted the use of steroids in 36 patients (20.3%) and antibiotics in 31 patients (17.5%). The BMI median was quite elevated with a median of 24.1. Oral anti diabetes drugs were used in 55 patients (31.1%) and cardiovascular-related drugs in 36 patients (20.3%) (). Twenty-two patients (12.4%) received ACE inhibitors. However, ACE inhibitors group was more frequently treated with statins, beta-blockers and metformin.
Table 1. Summary of clinical characteristics of the patients
Impact of ACE inhibitors on patients’ response to anti-PD-1/PD-L1 treatment
We analyzed whether an association between clinical characteristics, concomitant drug use and progression free survival (PFS) and overall survival (OS) was observed ( and ). Only WHO performance was associated with PFS and OS status. Additionally, treatment line was associated with PFS. In contrast to previous observations, steroid and antibiotics use were not significantly associated neither with PFS nor with OS. Concerning other concomitant drugs, we observed that only ACE inhibitor use was associated with poor PFS and OS ( and ). Indeed, ACE inhibitors group had a lower response rate, shorter median PFS compared to the control group: 1.97 vs. 2.56 months, p = .01 (HR = 1.8 CI95% 1.1–2.8) and OS 9.82 vs. 11.60 months, p = .07 (HR = 1.6 CI95% 1.0–2.7) (,)). Importantly, no statistical difference was observed between ACE inhibitors group and patients that did not receive ACE inhibitors ().
Table 2. Hazard ratios (HR) for Overall survival (OS) and Progression-free survival (PFS). PFS and OS and corresponding 95%CI and p-values. Univariate Model
Figure 1. Effect of patient’s characteristics, treatments and co-medication on PFS and OS. Forest plot of hazard ratios for PFS and OS. Corresponding 95%CI and p-values are represented
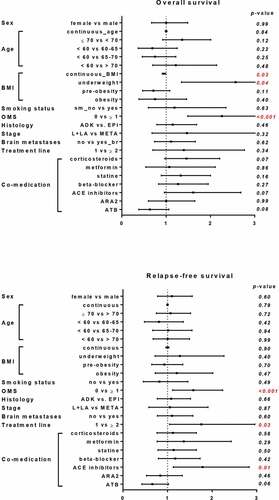
Figure 2. Influence of ACE inhibitor co-medication on patient response to ICIs. Kaplan-Meier curves comparing patient’s PFS and OS according to ACE inhibitor prescription. Patients were stratified according to ACE inhibitor treatment and Kaplan-Meier estimates PFS (a) and OS (b)
Then, we carried out a multivariate analysis to assess the effect of ACE inhibitor administration, taking into account classical prognostic factors. The negative impact of ACE inhibitors group was maintained after multivariate analyses after adjustment for known risk factors (HR = 1. 9 CI95% 1.1–3.2 p = .01 for PFS and HR = 2.0 CI95% 1.1–3.5 p = .02 for OS) ().
Table 3. Hazard ratios (HR) for Overall survival (OS) and Progression-free survival (PFS). PFS and OS and corresponding 95%CI and p-values. Multivariate model
Effects of ACE inhibitors on intra-tumor immune cells composition
To gain further insight on the molecular mechanisms underlining these observations, RNA sequencing was performed for 29 patients (26 from the no ACE inhibitor group and 3 from the ACE inhibitors group). We assessed immune cell composition in this cohort using CIBERSORT, a bioinformatics algorithm used to evaluate immune cell composition based on gene expression profiles. This software was able to estimate 19 immune cell types on the 22 available. We observed that the levels of M1 macrophages, activated mast cells, NK cells, eosinophils and memory CD4 activated T cells were nearly undetectable in ACE inhibitors group in comparison to control group (). While this tendency is not significant (due to the low number of patients in ACE inhibitors group), it suggests a negative effect of ACE inhibitors on immune response.
Figure 3. Influence of ACE inhibitor co-medication on immune cell infiltration in the tumor. Percentages of immune cells are estimated by deconvolution method CIBERSORT in patients who received ACE-inhibitor (Yes) or not (No). p, represent Wilcoxon test values
In vitro effects of an ACE inhibitor on human macrophage differentiation
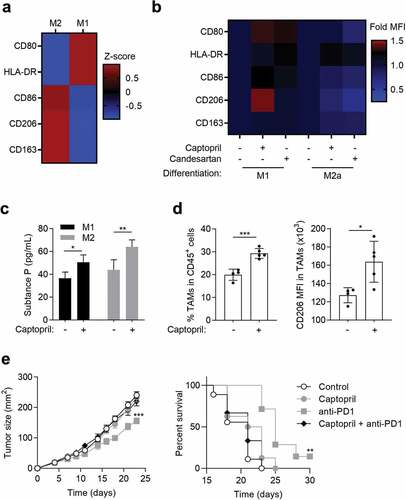
Since the balance M1/M2 macrophages plays an important role in tumor progression, we evaluated the effects of captopril (an ACE inhibitor) on M1 and M2 macrophage differentiation in vitro. Human blood monocytes were differentiated in vitro into M1 or M2 and the expression of specific markers was evaluated by flow cytometry (). Captopril was able to induce the M2 marker CD206 expression when monocytes were engaged into M1 macrophage differentiation (). Another effect of captopril was observed on the expression of CD80 along M1 differentiation. However, this effect was not specific, as it was also observed with candesartan, an angiotensin receptor antagonist (ARA2) (). Since ACE can degrade substance P, a neuropeptide with potent proinflammatory properties,Citation33 we analyzed the effect of captopril on macrophages production of substance P. We observed that M1 and M2 macrophages produced substance P and that captopril increased this production (). These results suggest that inhibiting ACE inhibits substance P degradation and may favor M2/M1 balance.
Figure 4. Effect of captopril on macrophages. (a to c) Human monocytes (n = 3) were differentiated for 6 d into M1 or M2 macrophages. (a and b) Expression level (mean MFI of 3 different donors) of different markers after cell staining with specific antibodies to analyze M1 and M2 differentiation by flow cytometry. (a) MFI z-score of markers expression at basal level. (b) Fold expression of the different markers analyzed by flow cytometry to compare human monocytes differentiated for 6 d into M1 or M2 macrophages with or without captopril (100 µM) or candesartan (10 µM). (c) Human monocytes were differentiated for 6 d into M1 or M2 macrophages with or without captopril (100 µM) and substance P concentration in cell supernatants was evaluated by ELISA. Data represent the mean of 3 different donors ± s.d. *, p < .05; **, p < .01. (d and e) MC38 tumor bearing mice were daily treated or not per os with 25mg/kg captopril with or without i.p. injections of 10mg/kg anti-PD-1 mAb three times a week. (d) Macrophage occurrence in tumors and CD206 expression in TAMs (n = 4 or 5 animals per group) were analyzed by flow cytometry. (e) Tumor size was monitored (mean ± s.e.m) and mice survival was calculated (n = 7 to 9 animals per group). *, p < .05; **, p < .01; ***, p < .005
Effects of an ACE inhibitor on macrophage differentiation and on anti-PD-1 antitumor properties in mice
The effects of captopril in mice were addressed in MC38 tumor-bearing mice, a model responsive to anti-PD1 mAbs. Daily treatment with captopril increases the proportion of tumor associated macrophages (TAMs) (). As observed in human macrophages, in vivo captopril treatment also induces an increase in the M2 marker, CD206 (). Tumor-bearing mice treatment with anti-PD-1 mAb induced a delay in tumor growth (). This effect was lost, when mice were daily treated with captopril.
These results suggest that inhibiting ACE increases CD206+ macrophages within the tumor and inhibits anti-PD-1 therapeutic effects in mice.
Discussion
In this study, we showed that lung cancer patients treated with ACE inhibitors in addition to immunotherapy have a lower PFS and OS than patients treated with other hypertension medication, such as ARA2 or with anti-diabetes or cardiovascular support treatments ().
Figure 5. Hypothetical scheme of ACE inhibitors effects. ACE inhibitors downmodulate ACE and consequently substance P degradation. Accumulation of substance P favors M2 differentiation at the expense of M1 and blunts ICIs anti-tumor response
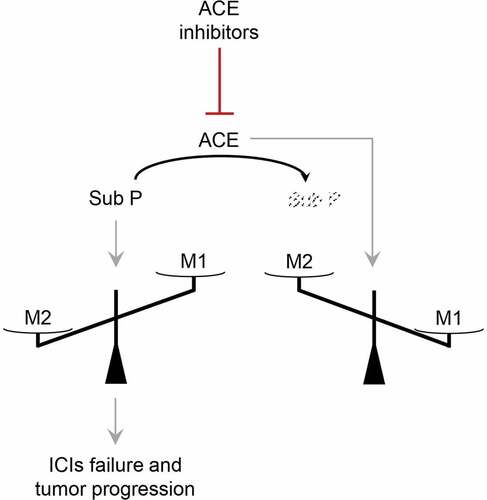
ACE is a cell surface zinc metallopeptidase that degrades oligopeptides in the extracellular environment.Citation34 ACE is an essential player in the renin-angiotensin system in which renin first produces angiotensin I from angiotensinogen. ACE cleaves angiotensin I, releasing the effector angiotensin II. This system also regulates blood pressure and electrolyte balance mainly through the production of angiotensin II. Consequently, ACE inhibitors are now widely used to treat hypertension and heart failure.Citation34
Many previous studies proposed a potential immune effect of ACE. Angiotensin II mediates several pro-inflammatory responses by signaling through AT1R. Notably, macrophages express AT1R and ACE can promote M1 differentiation and production of inflammatory cytokines by these cells.Citation35 Likewise, ACE can be located in the endoplasmic reticulum and promote optimal processing of MHC class I peptides.Citation36 ACE can also drive neutrophils and macrophages to produce increased levels of radical oxygen species, which promote cancer cell elimination.Citation37–39 The capacity of ACE inhibitors to blunt all these parameters could be deleterious for antitumor immune response. It has been shown that ACE inhibitors can dampen the recruitment of anti-tumor cells such as CD8+/CD4+ T cells and macrophages, restraining the elimination of cancer cells.Citation40 In this study, we observed a lower level of M1 macrophages, activated mast cells, NK cells and memory CD4 activated T cells markers in the tumor of ACE inhibitors treated patients. M1 macrophages secrete pro-inflammatory cytokines responsible for the recruitment of Th1 cells, cytotoxic T lymphocytes and activated NK cells at the tumor site, leading to an anti-tumor immune response. Cytokines secreted by M2 macrophages inhibit these events, leading to a pro-tumor immune response.Citation41 Thus, the balance between M1 and M2 differentiation can dictate anti-cancer immune response, and therefore, the tumor’s fate. Khan et al. recently showed that ACE, and more particularly ACE C-domain, inhibits murine melanoma tumor growth, while its inhibition by ramipril favors it. These effects of ACE were attributed to its capacity to improve M1 differentiation and repress M2 differentiation.Citation42 In addition to the effect on Angiotensin II, ACE inhibitors can also limit the cleavage of substance P and bradykinin, two neuropeptides with potent proinflammatory properties.Citation33,Citation43 In murine myeloid cells, it has been observed that substance P can increase M2 macrophage markers (CD163, CD206) on murine bone marrow-derived cells, via a PI3K/Akt/mTOR-dependent pathway.Citation44 Here, we observed that ACE inhibitors decreased the presence of M1 macrophages in patient’s tumor of and that captopril (but not candesartan) increased the M2 marker CD206 at the cell surface of monocytes engaged into an M1 differentiation, in vitro. We can speculate that ACE inhibitors specifically deviate M1 macrophages toward an M2-like phenotype. This might explain the discrepancies observed in this study between ACE inhibitors and ARA2 inhibitors in patient’s response to anti-PD-1/PD-L1.
ACE inhibitor prescription concomitant to PD-1/PD-L1 inhibitors treatment is associated with impaired outcome in patients with advanced NSCLC. This impairment is independent of standard prognostic factors. Biological correlative analyses suggest a tumor immunosuppressed state in ACE inhibitors group. Further studies are required to confirm this hypothesis.
Patients and methods
Ethics approval and consent to participate
The study was conducted in accordance with the Declaration of Helsinki. All participating patients fully agreed with the use of their medical records in clinical research. The study was performed in agreement with the General Data Protection Regulation European law.
Patients
All patients with metastatic NSCLC (n = 178) at Georges Francois Leclerc center, Dijon, France treated with ICIs were identified based on chart records between June 2013 and December 2018, until data lock of August 2019. Patients treated in the first line setting with pembrolizumab or in second or further lines with nivolumab or durvalumab were included.
Medical records were retrospectively analyzed to determine any oral or intravenous concomitant drug use during the treatment with anti PD-1 mAb. Use of cardiac, diabetes-related drugs, antibiotics (longer than 7 d) or corticoids (higher than 10 mg equivalent prednisolone, for more than 7 d) starting after the beginning of anti PD-1 therapy were recorded. Clinicopathological characteristics were collected for all patients. Tumor response was evaluated by computed tomography (CT) scan, every four cycles. Response evaluation criteria in solid tumors (RECIST) 1.1 was used to define objective clinical response. All patients were followed-up until death or data lock.
RNA sequencing analysis
Total RNA was extracted from formalin-fixed paraffin-embedded (FFPE) tumor slices (5 × 5 µm) using the Maxwell 16 LEV RNA FFPE Purification kit (Promega), following manufacturer’s instructions. Libraries were prepared from total RNA with the TruSeq Stranded Total RNA using Ribo-Zero (Illumina) according to manufacturer’s instructions. Once qualified, paired-end libraries were sequenced using 2 × 75 bp output on a NextSeq 500 device (Illumina).
The abundance of transcripts from RNA-seq data was quantified through the kallisto program.Citation45 Quality control was assessed through FastQC software (http://www.bioinformatics.babraham.ac.uk/projects/fastqc). All quality controls were checked for the 29 patients. Gene-level count matrices were then created with the DESeq2 library.Citation46 Low-count genes were pre-filtered by removing genes with less than 10 reads. Data were normalized as TPM (transcript per million reads). Data were normalized as TPM (transcript per million reads). Corresponding data are available upon request. Immune infiltrates were evaluated using CIBERSORT LM22 software. Gene expression data with standard annotations were uploaded to the CIBERSORT web portal (http://cibersort.stanford.edu), and the algorithm was run using the LM22 signature and 1000 permutations.Citation47
Statistical analysis
Patients’ characteristics were described according to hospital and compared using Fisher or chi-squared test for categorical data and t-test for continuous data. Patient’s characteristics were described according to angiotensin converting enzyme inhibitor (ACE) use. Progression-free survival (PFS) was calculated as the time from the date of treatment initiation to the first recorded evidence of disease progression by CT scan, clinical evaluation or death. Overall survival (OS) was calculated as the time from the date of treatment initiation to the date of death whatever the cause. Survival curves were estimated using the Kaplan–Meier method and compared with the Log-rank test (univariate analysis). Univariate and multivariable Cox regression models were used to determine HRs and 95% confidence intervals (CIs) for PFS and OS. Statistical tests were two-sided, and a P-value <0.05 was considered statistically significant. Data analysis was performed using R statistical software (http://www.R-project.org/) and presented with Prism 7 (GraphPad, San Diego, CA, USA).
In vitro experiments
Human peripheral blood monocytes were obtained from healthy donors, after informed consent, and purified using the human StraightFrom Buffy Coat CD14 MicroBead Kit (130–114-976, Miltenyi Biotec), according to manufacturer’s instructions, seeded in X–VIVO 10 medium (BE04-380Q, Ozyme) and treated the next day with cytokines from R&D systems. Monocytes were incubated 6 d with 100 ng/mL GM-CSF (215-GM-010) (+ 10 ng/mL LPS (L3024-5 MG, Sigma-Aldrich) and 50 ng/mL IFNγ (285-IF-100) for the last 3 d) to generate M1 macrophages. Monocytes were incubated for 6 d with 100 ng/mL M-CSF (216-MC-005) combined with IL-4 (204-IL-010, 10 ng/mL) and IL-10 (217-IL-005, 10 ng/mL) to generate M2 phenotype. Along with macrophage differentiation, the effect of captopril (sc-200,566, 100 µM) or candesartan (sc-217,825, 10 µM) (Santa Cruz Biotechnologies) was tested.
After differentiation, cells were stained in Flow Cytometry Staining Buffer (FSB – 00-4222-26, eBioscience) with specific antibodies, anti-CD45-BV785 (BLE304048), anti-CD163-FITC (BLE333618) from Biolegend, anti-CD206-PE (IM2741), anti-CD86-PC5.5 (B30647), anti-CD80-APC (B30642), anti-HLA-DR-KrOr (B00070) from Beckman coulter, and stained with DRAQ7 (B25595, Beckman coulter) for 15 minutes at room temperature in the dark, washed twice in FBS and analyzed by flow cytometry. Acquisition was performed on a Cytoflex 13 C cytometer (Beckman Coulter) and cells were analyzed using Cytexpert software (Beckman Coulter). The Mean Fluorescence Intensity (MFI) of specific markers was studied.
Substance P concentration was evaluated in cell supernatants using substance P ELISA assay (KGE007 – R&D systems) according to manufacturer’s instructions.
Dataset comparisons were performed with GraphPad Prism 8, using paired Student’s t tests (test group compared to control group). All P values were two tailed.
In vivo experiments
All animals were bred and maintained according to both the FELASA and the Animal Experimental Ethics Committee Guidelines (N° C 21 464 04 EA, University of Burgundy, France). Female C57BL/6 mice used were between 6 and 8 weeks and were obtained from Charles River Laboratories. To induce tumor formation, 1.106 MC38 cells were injected subcutaneously into mice. Animals were treated from day 7 after tumor-cell injection (tumor size, 30 mm2), every day per os with 25 mg/kg captopril (Santa Cruz Biotechnology) in hypromellose and every 2–3 d i.p. with 10 mg/kg inVivo mAb anti-mouse PD-1 (BioXcell BE0146). Tumor size was measured three times a week with a caliper.
Tumors were recovered after 17 d of treatment, cells were dissociated using the tumor dissociation kit (130–096-730) with the gentleMACS dissociator (Miltenyi Biotec). Cells were then stained with a APC anti-mouse CD45 (Miltenyi Biotec, 130–110-660), a BV650 anti-mouse Ly6G (127,641), a BV785 anti-mouse CD11b (101,243), a BV605 anti-mouse F4/80 (123,133), a A488 anti-HLA-DR (107,615), a APC-A700 anti-mouse CD206 (141,734) from biologend and Fixable Viability Dye (FVD) eFluor 780 (eBioscience) for 15 minutes at RT. After washing, cells were analyzed with a CytoFlex (Beckman Coulter) and a CytExpert software. TAMs were characterized with a CD45+, CD11b+, Ly6G−, F4/80+, HLA-DR+ phenotype and CD206 MFI was measured in these cells.
Acknowledgments
We thank Isabel Gregoire for carefully reading the manuscript. We thank Romain Boidot from the Platform of Transfer in Cancer Biology, Dijon, France, for providing RNAseq data.
Disclosure statement
The authors declare that they have no competing interest.
Additional information
Funding
References
- Santini FC, Hellmann MD. PD-1/PD-L1 axis in lung cancer. Cancer J. 2018;24:15–11. doi:10.1097/PPO.0000000000000300.
- Shen K, Cui J, Wei Y, Chen X, Liu G, Gao X, Li W, Lu H, Zhan P, Lv T, et al. Effectiveness and safety of PD-1/PD-L1 or CTLA4 inhibitors combined with chemotherapy as a first-line treatment for lung cancer: A meta-analysis. J Thorac Dis. 2018;10:6636–6652. doi:10.21037/jtd.2018.11.72.
- Gandhi L, Rodriguez-Abreu D, Gadgeel S, Esteban E, Felip E, De Angelis F, Domine M, Clingan P, Hochmair MJ, Powell SF, et al. Pembrolizumab plus chemotherapy in metastatic non-small-cell lung cancer. N Engl J Med. 2018;378:2078–2092. doi:10.1056/NEJMoa1801005.
- Ready N, Hellmann MD, Awad MM, Otterson GA, Gutierrez M, Gainor JF, Borghaei H, Jolivet J, Horn L, Mates M, et al. First-line Nivolumab plus Ipilimumab in advanced non-small-cell lung cancer (CheckMate 568): outcomes by programmed death ligand 1 and tumor mutational burden as biomarkers. J Clin Oncol. 2019;37:992–1000. doi:10.1200/JCO.18.01042.
- O’Donnell JS, Hoefsmit EP, Smyth MJ, Blank CU, Teng MWL. The promise of neoadjuvant immunotherapy and surgery for cancer treatment. Clin Cancer Res. 2019;25:5743–5751. doi:10.1158/1078-0432.CCR-18-2641.
- Gray JE, Villegas A, Daniel D, Vicente D, Murakami S, Hui R, Tykodi SS, Sosman JA, Procopio G, Plimack ER, et al. Three-year overall survival with durvalumab after chemoradiotherapy in stage III NSCLC-update from Pacific. J Thorac Oncol. 2019.
- Motzer RJ, Escudier B, McDermott DF, George S, Hammers HJ, Srinivas S, Tykodi SS, Sosman JA, Procopio G, Plimack ER, et al. Nivolumab versus Everolimus in advanced renal-cell carcinoma. N Engl J Med. 2015;373:1803–1813. doi:10.1056/NEJMoa1510665.
- Borghaei H, Paz-Ares L, Horn L, Spigel DR, Steins M, Ready NE, Chow LQ, Vokes EE, Felip E, Holgado E, et al. Nivolumab versus Docetaxel in advanced nonsquamous non-small-cell lung cancer. N Engl J Med. 2015;373:1627–1639. doi:10.1056/NEJMoa1507643.
- Frelaut M, Le Tourneau C, Borcoman E. Hyperprogression under Immunotherapy. Int J Mol Sci. 2019;20:2674–2688.
- Inamura K. Update on Immunohistochemistry for the diagnosis of lung cancer. Cancers (Basel). 2018;10:72–87.
- Gao J, Shi LZ, Zhao H, Chen J, Xiong L, He Q, Chen T, Roszik J, Bernatchez C, Woodman SE, et al. Loss of IFN-gamma pathway genes in tumor cells as a mechanism of resistance to anti-CTLA-4 therapy. Cell. 2016;167:397–404 e9.
- Ayers M, Lunceford J, Nebozhyn M, Murphy E, Loboda A, Kaufman DR, Albright A, Cheng JD, Kang SP, Shankaran V, et al. IFN-gamma-related mRNA profile predicts clinical response to PD-1 blockade. J Clin Invest. 2017;127:2930–2940. doi:10.1172/JCI91190.
- Havel JJ, Chowell D, Chan TA. The evolving landscape of biomarkers for checkpoint inhibitor immunotherapy. Nat Rev Cancer. 2019;19:133–150.
- Fumet JD, Richard C, Ledys F, Klopfenstein Q, Joubert P, Routy B, Truntzer C, Gagné A, Hamel M-A, Guimaraes CF, et al. Prognostic and predictive role of CD8 and PD-L1 determination in lung tumor tissue of patients under anti-PD-1 therapy. Br J Cancer. 2018;119:950–960. doi:10.1038/s41416-018-0220-9.
- Carbone DP, Reck M, Paz-Ares L, Creelan B, Horn L, Steins M, Felip E, van den Heuvel MM, Ciuleanu T-E, Badin F, et al. First-line Nivolumab in stage IV or recurrent non-small-cell lung cancer. N Engl J Med. 2017;376:2415–2426. doi:10.1056/NEJMoa1613493.
- Rizvi NA, Hellmann MD, Snyder A, Kvistborg P, Makarov V, Havel JJ, Lee W, Yuan J, Wong P, Ho TS, et al. Cancer immunology. Mutational landscape determines sensitivity to PD-1 blockade in non-small cell lung cancer. Science. 2015;348:124–128. doi:10.1126/science.aaa1348.
- Chae YK, Davis AA, Raparia K, Agte S, Pan A, Mohindra N, Villaflor V, Giles F. Association of tumor mutational burden with DNA repair mutations and response to anti-PD-1/PD-L1 therapy in non-small-cell lung cancer. Clin Lung Cancer. 2019;20:88–96 e6. doi:10.1016/j.cllc.2018.09.008.
- Yarchoan M, Hopkins A, Jaffee EM. Tumor mutational burden and response rate to PD-1 inhibition. N Engl J Med. 2017;377:2500–2501. doi:10.1056/NEJMc1713444.
- Richard C, Fumet JD, Chevrier S, Derangere V, Ledys F, Lagrange A, Favier L, Coudert B, Arnould L, Truntzer C, et al. Exome analysis reveals genomic markers associated with better efficacy of Nivolumab in lung cancer patients. Clin Cancer Res. 2019;25:957–966. doi:10.1158/1078-0432.CCR-18-1940.
- McGranahan N, Furness AJ, Rosenthal R, Ramskov S, Lyngaa R, Saini SK, Jamal-Hanjani M, Wilson GA, Birkbak NJ, Hiley CT, et al. Clonal neoantigens elicit T cell immunoreactivity and sensitivity to immune checkpoint blockade. Science. 2016;351:1463–1469. doi:10.1126/science.aaf1490.
- Conway JR, Kofman E, Mo SS, Elmarakeby H, Van Allen E. Genomics of response to immune checkpoint therapies for cancer: implications for precision medicine. Genome Med. 2018;10:93. doi:10.1186/s13073-018-0605-7.
- Kaderbhai C, Tharin Z, Ghiringhelli F. The role of molecular profiling to predict the response to immune checkpoint inhibitors in lung cancer. Cancers (Basel). 2019;11: 201–214.
- Nosrati A, Tsai KK, Goldinger SM, Tumeh P, Grimes B, Loo K, Algazi AP, Nguyen-Kim TDL, Levesque M, Dummer R, et al. Evaluation of clinicopathological factors in PD-1 response: derivation and validation of a prediction scale for response to PD-1 monotherapy. Br J Cancer. 2017;116(9):1141–1147. doi:10.1038/bjc.2017.70.
- Fuca G, Galli G, Poggi M, Lo Russo G, Proto C, Imbimbo M, Ferrara R, Zilembo N, Ganzinelli M, Sica A, et al. Modulation of peripheral blood immune cells by early use of steroids and its association with clinical outcomes in patients with metastatic non-small cell lung cancer treated with immune checkpoint inhibitors. ESMO Open. 2019;4:e000457.
- Arbour KC, Mezquita L, Long N, Rizvi H, Auclin E, Ni A, Martínez-Bernal G, Ferrara R, Lai WV, Hendriks LEL, et al. Impact of baseline steroids on efficacy of programmed cell death-1 and programmed death-ligand 1 blockade in patients with non-small-cell lung cancer. J Clin Oncol. 2018;36:2872–2878. doi:10.1200/JCO.2018.79.0006.
- Elkrief A, Derosa L, Kroemer G, Zitvogel L, Routy B. The negative impact of antibiotics on outcomes in cancer patients treated with immunotherapy: a new independent prognostic factor? Ann Oncol. 2019;30:1572–1579. doi:10.1093/annonc/mdz206.
- Lozupone CA, Stombaugh JI, Gordon JI, Jansson JK, Knight R. Diversity, stability and resilience of the human gut microbiota. Nature. 2012;489:220–230. doi:10.1038/nature11550.
- Zitvogel L, Ayyoub M, Routy B, Kroemer G. Microbiome and anticancer immunosurveillance. Cell. 2016;165:276–287. doi:10.1016/j.cell.2016.03.001.
- Pinato DJ, Gramenitskaya D, Altmann DM, Boyton RJ, Mullish BH, Marchesi JR, Bower M. Antibiotic therapy and outcome from immune-checkpoint inhibitors. J Immunother Cancer. 2019;7:287. doi:10.1186/s40425-019-0775-x.
- Tousoulis D, Psarros C, Demosthenous M, Patel R, Antoniades C, Stefanadis C. Innate and adaptive inflammation as a therapeutic target in vascular disease: the emerging role of statins. J Am Coll Cardiol. 2014;63:2491–2502. doi:10.1016/j.jacc.2014.01.054.
- de Oliveira S, Houseright RA, Graves AL, Golenberg N, Korte BG, Miskolci V, Huttenlocher A. Metformin modulates innate immune-mediated inflammation and early progression of NAFLD-associated hepatocellular carcinoma in zebrafish. J Hepatol. 2019;70:710–721. doi:10.1016/j.jhep.2018.11.034.
- Bucsek MJ, Qiao G, MacDonald CR, Giridharan T, Evans L, Niedzwecki B, Liu H, Kokolus KM, Eng JW, Messmer MN, et al. Beta-adrenergic signaling in mice housed at standard temperatures suppresses an effector phenotype in CD8(+) T cells and undermines checkpoint inhibitor therapy. Cancer Res. 2017;77:5639–5651. doi:10.1158/0008-5472.CAN-17-0546.
- Devin JK, Pretorius M, Nian H, Yu C, FTt B, Brown NJ. Substance P increases sympathetic activity during combined angiotensin-converting enzyme and dipeptidyl peptidase-4 inhibition. Hypertension. 2014;63:951–957. doi:10.1161/HYPERTENSIONAHA.113.02767.
- Shen XZ, Bernstein KE. The peptide network regulated by angiotensin converting enzyme (ACE) in hematopoiesis. Cell Cycle. 2011;10:1363–1369. doi:10.4161/cc.10.9.15444.
- Yamamoto S, Yancey PG, Zuo Y, Ma LJ, Kaseda R, Fogo AB, Ichikawa I, Linton MF, Fazio S, Kon V, et al. Macrophage polarization by angiotensin II-type 1 receptor aggravates renal injury-acceleration of atherosclerosis. Arterioscler Thromb Vasc Biol. 2011;31:2856–2864. doi:10.1161/ATVBAHA.111.237198.
- Shen XZ, Billet S, Lin C, Okwan-Duodu D, Chen X, Lukacher AE, Bernstein KE. The carboxypeptidase ACE shapes the MHC class I peptide repertoire. Nat Immunol. 2011;12:1078–1085. doi:10.1038/ni.2107.
- Khan Z, Shen XZ, Bernstein EA, Giani JF, Eriguchi M, Zhao TV, Gonzalez-Villalobos RA, Fuchs S, Liu GY, Bernstein KE, et al. Angiotensin-converting enzyme enhances the oxidative response and bactericidal activity of neutrophils. Blood. 2017;130(3):328–339. doi:10.1182/blood-2016-11-752006.
- Shen XZ, Li P, Weiss D, Fuchs S, Xiao HD, Adams JA, Williams IR, Capecchi MR, Taylor WR, Bernstein KE, et al. Mice with enhanced macrophage angiotensin-converting enzyme are resistant to melanoma. Am J Pathol. 2007;170(6):2122–2134. doi:10.2353/ajpath.2007.061205.
- Bernstein KE, Khan Z, Giani JF, Cao DY, Bernstein EA, Shen XZ. Angiotensin-converting enzyme in innate and adaptive immunity. Nat Rev Nephrol. 2018;14:325–336. doi:10.1038/nrneph.2018.15.
- Wysocki PJ, Kwiatkowska EP, Kazimierczak U, Suchorska W, Kowalczyk DW, Mackiewicz A. Captopril, an angiotensin-converting enzyme inhibitor, promotes growth of immunogenic tumors in mice. Clin Cancer Res. 2006;12:4095–4102. doi:10.1158/1078-0432.CCR-05-2489.
- Lakshmi Narendra B, Eshvendar Reddy K, Shantikumar S, Ramakrishna S. Immune system: a double-edged sword in cancer. Inflamm Res. 2013;62:823–834. doi:10.1007/s00011-013-0645-9.
- Khan Z, Cao DY, Giani JF, Bernstein EA, Veiras LC, Fuchs S, Wang Y, Peng Z, Kalkum M, Liu GY, et al. Overexpression of the C-domain of angiotensin-converting enzyme reduces melanoma growth by stimulating M1 macrophage polarization. J Biol Chem. 2019;294:4368–4380. doi:10.1074/jbc.RA118.006275.
- Okwan-Duodu D, Landry J, Shen XZ, Diaz R. Angiotensin-converting enzyme and the tumor microenvironment: mechanisms beyond angiogenesis. Am J Physiol Regul Integr Comp Physiol. 2013;305:R205–15.
- Lim JE, Chung E, Son Y. A neuropeptide, Substance-P, directly induces tissue-repairing M2 like macrophages by activating the PI3K/Akt/mTOR pathway even in the presence of IFNgamma. Sci Rep. 2017;7:9417. doi:10.1038/s41598-017-09639-7.
- Bray NL, Pimentel H, Melsted P, Pachter L. Near-optimal probabilistic RNA-seq quantification. Nat Biotechnol. 2016;34:525–527. doi:10.1038/nbt.3519.
- Love MI, Huber W, Anders S. Moderated estimation of fold change and dispersion for RNA-seq data with DESeq2. Genome Biol. 2014;15:550. doi:10.1186/s13059-014-0550-8.
- Newman AM, Liu CL, Green MR, Gentles AJ, Feng W, Xu Y, Hoang CD, Diehn M, Alizadeh AA. Robust enumeration of cell subsets from tissue expression profiles. Nat Methods. 2015;12:453–457. doi:10.1038/nmeth.3337.