
ABSTRACT
Objectives
Tumor necrosis receptor super family (TNFRSF) plays an important role in regulating the function of CD8+ T cells. In this study, we explored the clinical significance and immune profile of TNFRSF9+ CD8+ T cells in clear cell renal cell carcinoma (ccRCC)
Methods
The infiltration of immune cells was determined by immunohistochemistry in ZS cohort from our hospital and their prognostic value was further determined by Cox regression. Functional status of CD8+ T cells in ccRCC was determined by flow cytometry in 29 fresh tumor samples. In silico analysis on a TCGA cohort and other datasets was performed to further demonstrate our findings.
Results
High TNFRSF9+ CD8+ T cells infiltration was associated with inferior overall survival in ZS cohort (p = .0016) and TCGA-KIRC cohort (p = .018). TNFRSF9+ CD8+ T cells expressed higher exhaustion markers (PD-1, TIM-3, CTLA-4, and TIGIT), and effector markers (IFN-γ, GZMB, CD107a, and Ki-67), than their TNFRSF9 negative counterparts. In silico analysis indicated the expression of TNFRSF9 was significantly correlated with IFNG, GZMK, MKI-67, PDCD1, HAVCR2, TIGIT, and CTLA-4 in CD8+ T cells. However, higher TNFRSF9 signature was correlated with larger tumor size shrinkage (p = .003) and better progression-free survival (p = .012) in patients treated with nivolumab but not everolimus.
Conclusion
TNFRSF9+ CD8+ T cells, which possessed both exhaustion and effector phenotype, were identified as an adverse prognosticator in ccRCC. These cells enrichment was associated with better immunotherapy response which indicated these cells potentially be crucial in immunotherapy.
Background
The advent of immunotherapy in clear cell renal cell carcinoma (ccRCC) could be tracked back to the cytokine era.Citation1 During the past three decades, the predominant treatment for ccRCC has changed from cytokine therapy to targeted therapy.Citation2 However, immune checkpoint blockade (ICB) is showing promising potentialCitation3 for treating ccRCC and is regarded as the renaissance of immune therapy in ccRCC. In tumor microenvironment (TME), T cells undergo persistent antigen exposure, which hierarchically impairs T cell function and finally brings T cell into a dysfunctional state called “exhaustion”.Citation4 Co-inhibitory receptors, like programmed death-1 (PD-1), and cytotoxic T lymphocyte-associated antigen-4 (CTLA-4), were traditionally envisioned as exhaustion markers of T cells,Citation4 which is the theoretical basis of ICB.
For ccRCC, immunotherapy has taken the limelight since the publishing of the CheckMate-025 study.Citation3 Agents now available in clinical practice are mainly antagonist antibodies targeting the PD-1 (or its ligand) and CTLA-4, such as nivolumab, pembrolizumab, and ipilimumab. However, the response was not universal among patients.Citation3 Previous studies have discovered that T cell dysfunction is never a single mechanism process,Citation4 thus a single agent treatment may not meet a complete response in all patients. Intuitively and experimentally, high CD8+ T cells infiltration is associated with a favorable prognosis in patients with cancer.Citation5 However, ccRCC is the distinct outlier as higher CD8+ T cells density was associated with worse outcomes in ccRCC.Citation6,Citation7 This unconventional result may indicate the distinct function status and heterogeneityCitation8 of CD8+ T cells in ccRCC. More insights could be provided through detailed investigation and identification of the subpopulations of CD8+ T cells.Citation9
Besides the co-inhibitory receptors, co-stimulatory receptors are also required for the well-function of CD8+ T cells.Citation10 Many receptors in immunoglobulin superfamily (like CD28, inducible T cell co‑stimulator [ICOS]) and tumor necrosis factor receptor superfamily (TNFSF) exert costimulatory actions.Citation10 TNFSRF9, also known as 4–1BB, was first identified in mouse in 1989,Citation11 and the human homolog was also discovered in 1990s.Citation12,Citation13 Cardinally, TNFRSF9 was thought to be an antigen stimulation inducible co-stimulatory receptor, which transiently expressed after T cells activation.Citation14 It could be expressed on activated CD8+ T cells, activated CD4+ T cells, natural killer (NK) cell, and endotheliocytes.Citation15 Co-stimulatory signaling mediated by TNFRSF9 could give rise to signaling cascades within T cells, which further promotes T cells proliferation, secretion of cytokines, resistance to activation-induced cell death (AICD),Citation16 and development of memory T cells.Citation14 Thus, TNFRSF9 was regarded as a potential immunotherapy target for cancer therapy.Citation17 Agonist antibody targeting TNFRSF9 was reported to be a promising way to active CD8+ T cells and thus promote the eradication of established tumors. And now some clinical trials were launched, even though it encountered some obstacles because of toxicity.Citation18,Citation19 Furthermore, a study on hepatocellular carcinoma has revealed that TNFRSF9 delineates a distinct activation status of exhausted tumor-infiltrating CD8+ T cells.Citation20 However, recent studies suggested a potential relationship between TNFRSF9 and T cells exhaustion,Citation8,Citation21 which indicated the complicated role of TNFRSF9 in immune response. Also, the function of TNRSF9+ CD8+ T cells in ccRCC has not been well delineated.
In this study, we explored the clinical significance and functional status of TNRSF9+ CD8+ T cells in ccRCC and discussed the potential mechanism and application in tumor immunotherapy.
Patients, materials and methods
Patient cohort
With approval by our Institutional Review Board (approval number B2015-030), and based on the inclusion criteria: i) undergone radical or partial nephrectomy at our institute; ii) pathologically diagnosed ccRCC iii) adults with age ≥18-year-old, and exclusion criteria: i) accompanied with other malignant tumors ii) preoperative systemic treatment iii) without complete/available follow-up/clinical/pathological data, a total of 250 ccRCC patients between Jan 2005 and Jan 2008 were enrolled for immunohistochemistry (IHC) and survival analysis (this cohort was hereafter called ZS cohort). Tissue specimens from these patients were constructed into tissue microarrays (TMA). Patients were routinely followed up every three months and last follow up was May 2017. Two endpoints, death and recurrence of disease, were analyzed. Overall survival (OS) was defined as time from surgery to death. Recurrence-free survival (RFS) was defined as time from surgery to first recurrence. Patients were censored if lost follow up or not reach endpoints for OS or RFS. Fresh tumor tissue samples were obtained from 29 ccRCC patients during surgery between December 2018 and August 2019 in our institute. Of these 29 samples, 11 of them were paired matched with peritumoral tissue samples and peripheral blood samples. These fresh samples were used for flow cytometry analyses or immunofluorescent experiments.
Reagents and antibodies
The details of antibodies, reagents, or software were provided in Supplement Table 1.
Immunohistochemistry and immunofluorescence
TMA slides were routinely dewaxed with xylene and rehydrated with graded alcohol (from 100% to 75%). Antigen retrieval was achieved by heating the slides in 0.01 M sodium citrate buffer (pH = 6). The 10% goat serum was used as blocking solution. Then, the slides were stained with rabbit anti-human TNFRSF9 antibody overnight at 4°C and subsequently stained with secondary antibody (HRP-labeled goat anti rabbit IgG) for 30 min at 37°C. Before staining detection with diaminoben-zidine system, the slides were treated with 3%H2O2 for 30 min at 37°C to inhibit the endogenous peroxidase. The slides were further incubated with mouse anti-human CD8a antibodies followed by staining with the alkaline phosphatase labeled goat anti-mouse IgG antibody. The staining was detected with the VECTOR Blue Substrate Kit followed the instruction. The staining results were observed and recorded with Nikon microscope. The number of immune cells were determined as the mean number of these cells in four respective views (400X) and transformed into number per mm2. Two pathologists who blinded to the follow-up data manually counted the immune cells and average numbers were finally used. Patients in ZS cohort were divided into two groups (high vs. low) according to the median number of CD8+ T cells (84 cells per mm2) or TNFRSF9+ CD8+ T cells (8 cells per mm2). For immunofluorescence, frozen sections were fixed on slides. Then the slides were incubated with primary antibodies overnight at 4°C. Secondary antibodies with Cy3 and FITC conjugation were used. Nuclear was stained with DAPI. The slides were viewed on confocal microscope (FV3000, Olympus, Tokyo, Japan).
Flow cytometry
Tumor tissue and paracancerous tissues (at least 1 cm away from tumor site) samples were obtained from surgery. Blood samples were obtained before surgery and stored in heparin anticoagulant tube at 4°C till experiment (commonly for 1 to 2 hours). Solid tissue samples were firstly digested with collagenase IV at 37°C and passed through 70 μm strainers. Then, samples were incubated with red blood cell (RBC) lysis buffer to obtained single-cell suspension while the blood samples were simply incubated with RBC lysis buffer. After Fc receptor blocked, the cells were stained with fluorescently labeled antibodies under 4°C for 30 min with appropriate procedures. Fixation/Permeabilization Solution Kit or Transcription Factor Buffer Set were used under manufacturer’s instruction if necessary. All experiments were carried out as soon as possible after surgery. Data were recorded with the FACS Celesta flow cytometer (BD Bioscience) and analyzed with FlowJo V10.3 software (TreeStar).
In silico analysis
The RNA-seq and clinical data of The Cancer Genome Atlas (TCGA) kidney clear cell carcinoma (KIRC) cohort (hereafter called TCGA-KIRC) were downloaded from https://portal.gdc.cancer.gov/on July 25th 2019. Single-cell sequencing data of ccRCC, metastatic melanoma (GSE72056, by Tirosh et al.) and liver cancer (GSE98638 by Zheng et al.)Citation22–24 were downloaded from the Gene Expression Omnibus (GEO) repository (https://www.ncbi.nlm.nih.gov/gds/). Two sequencing datasetsCitation25,Citation26 of ICB cohort (ccRCC [anti-PD-1] and melanoma [anti-PD-1]) were also used in our study. Especially, in the ICB cohort of ccRCC, only samples from metastasis loci were used. Genes’ expression was normalized to Transcripts Per Kilobase Million (TPM) in TCGA-KIRC cohort. In other database, genes’ expression was processed as its original form and analyzed with proper procedures. Other data, including tumor size change, survival data, and treatment response were acquired from previous studies.
The TNFRSF9+ CD8+ T cells signature was developed through analyzed the single-cell sequencing data of ccRCC. The CD8+ T cells were defined using SingleR package.Citation27 CD8+ T cells with TNFRSF9 expression level higher than rest 66.67% CD8+ T cells were defined as TNFRSF9+ CD8+ T cells. Then the function FindMarkers in SeuratCitation28 package v3.0 was used to find marker genes of TNFRSF9+ CD8+ T cells. The top 50 marker genes (ordered by the log fold change) with significant and positive correlation with TNFRSF9 in TCGA-KIRC were regarded as the marker genes of TNFRSF9+ CD8+ T cells. Thus, a total of 36 genes were finally defined as marker genes of TNFRSF9+ CD8+ T cells. The TNFRSF9+ CD8+ T cells signature and other immune cells’ signature in TCGA-KIRC or ICB cohortCitation25,Citation26 was determined by single sample gene sets enrichment analysis (ssGSEA) method with these marker genes and other immune cells’ marker genes,Citation29–31 respectively. Patients were divided into high or low TNFRSF9+ CD8+ T cells signature group based on “surv_cutpoint” function in survminer package in different cohorts (TCGA-KIRC cohort cut point: −0.042; ICB cohort [ccRCC] cut point: 1.076; ICB cohort [melanoma] cut point: −0.967). GSEA analysisCitation32,Citation33 on a JAVA platform with MSigDB C5 and C7 was performed in KIRC-TCGA cohort and a ccRCC single-cell sequencing database, respectively. In addition, we validated these marker genes by examining the efficacy of the signature to predicting TNFRSF9+ CD8+ T cells in another single-cell sequencing data of liver cancer (GSE98638, Supplement Figure 2B). We believe this TNFRSF9+ CD8+ T cells signature could well simulate the TNFRSF9+ CD8+ T cells density in samples with bulk RNA sequencing data. All in silico analysis was performed with R-3.6.0.Citation34
Statistical analysis
Data were shown as mean ± SD or range (median) for each characteristic. Student’s t test, paired t test, or Mann-Whitney-Wilcoxon test was appropriately used for quantitative data comparison between groups. Categorical variables were analyzed by the Pearson chi-square test or Fisher’s exact test. Survival curves were developed by Kaplan-Meier method and analyzed with log rank test. Correlation between two variables was determined by Pearson or Spearman correlation coefficient. Prognostic value of clinical or pathological parameters were further determined by Cox proportional hazard regression and summarized as hazard ratio (HR, 95% confidence interval, 95% CI). Bonferonni adjustment and False Discovery Rate determined by Benjamini & Hochberg method were used for the correction of multiple comparison.
All tests were two-sided, and a p value <.05 was considered as statistically significant. All analyses were performed by SPSS software version 23.0 (IBM SPSS). Graphs were developed by GraphPad Prism 8.0 or R-3.6.0.
Results
TNFRSF9+CD8+ T cells were enriched in ccRCC tissues
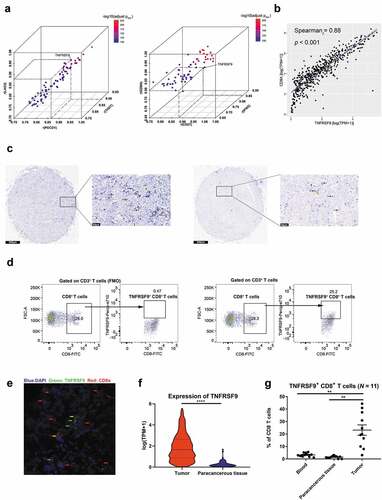
As shown in ), TNFRSF9 expression both significantly correlated with exhaustion markers (TIGIT, LAG3, and PDCD1, all r ≥ 0.8) and effector phenotype markers (CD27, IFNG, and GZMA, all r ≥ 0.8) in TCGA-KIRC cohort. Through evaluating the correlation between TNFRSF9 and other immune cell markers (including CD8A, CD4, CD19, NCAM1, ITGAX, CD68, TPSAP1, and CEACAM8), we found that TNFRSF9 showed the most significant correlation with CD8A, which indicated a strong co-expression of TNFRSF9 and CD8A () and Supplement Figure 1A-G). The co-expression between TNFRSF9 and CD8A was further been validated by the detection of TNFRSF9+ CD8+ T cells in tumor tissue both by immunohistochemistry and immunofluorescence (). In the TCGA-KIRC cohort, the expression of TNFRSF9 was significantly higher in tumor when compared with that in precancerous tissue ()). Correspondingly, the percentage of TNFRSF9+ CD8+ T cells in CD8+ T cells was significantly higher in tumor samples compared with that in peritumoral and blood samples (). These results indicated that TNFRSF9+ CD8+ T cells were enriched in ccRCC tissues.
Figure 1. TNFRSF9 was correlated with immune-related genes and TNFRSF9+ CD8+ T cells were enriched in ccRCC tissues
The TNFRSF9+ CD8+ T cells were associated with the disease progression and worse prognosis in ccRCC patients
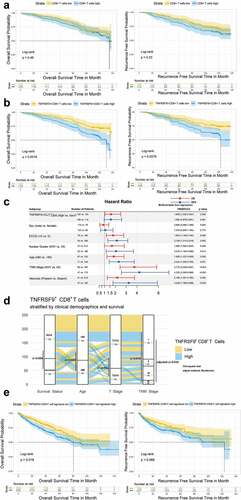
Since the TNFRSF9+ CD8+ T cells were enriched in tumor tissue, the prognostic value of this population was investigated. Clinical characteristics of ZS cohort were provided in Supplement Table 2. Kaplan-Meier plot with log-rank test showed a trend (but not significant) of worse prognosis in patients with high CD8+ T cells infiltration (), p for OS: 0.46; p for RFS: 0.23). However, the high TNFRSF9+ CD8+ T cells were associated with worse OS or RFS (), p= .0016 and p= .0069, respectively). Multivariate Cox regression analysis suggested that high TNFRSF9+ CD8+ T cells infiltration was still associated with inferior OS after adjusted for sex, ECOG score, nuclear grade, age, necrosis, and TNM stage (), HR = 1.609, 95% CI = 1.032–2.507 & p= .036 in OS, and HR = 1.592, 95% CI = 0.978–2.591 & p= .061 in RFS). In addition, high TNFRSF9+ CD8+ T cells infiltration were associated with higher T stage or TNM stage, which indicated a potential relationship between TNFRSF9+ CD8+ T cells and disease progression ()). In addition, as shown in ), patients with higher TNFRSF9+ CD8+ T cells signature also held a worse OS but not RFS (Cox analysis: HR = 2.36, 95% CI = 1.16–4.81, p= .018 and HR = 1.73, 95% CI = 0.71–4.18, p= .226, respectively; log-rank test: p= .018 and p= .068, respectively) in TCGA-KIRC cohort. Furthermore, in TCGA-KIRC cohort, high TNFRSF9+ CD8+ T cells signature was also more frequently present in high T stage or TNM stage (Supplement Figure 2C).
Figure 2. Intratumoral TNFRSF9+ CD8+ T cells were associated with ccRCC disease progression and prognosis
TNFRSF9+CD8+ T cells held both exhausted and effector phenotype
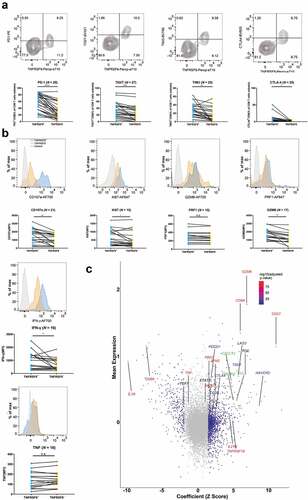
As described above, the expression of TNFRSF9 was significantly associated with exhaustion markers and effector phenotype markers in TCGA-KIRC cohort, which delineated a distinct and complicated role of TNFRSF9 in anti-tumor immune response. Thus, we next to investigate the functional status of TNFRSF9+ CD8+ T cells. TNFRSF9+ CD8+ T cells expressed more exhaustion makers (PD-1, TIGIT, TIM-3, and CTLA-4) than TNFRSF9− CD8+ T cells ()). On the other hand, the expression of CD107a, Ki-67, GZMB, and IFN-γ was also increased in TNFRSF9+ CD8+ T cells ()). The expression of TNFRSF9 was also correlated with exhausted markers (TIGIT and TIM3) and effector associated molecules (CD107a, Ki-67, GZMB, and IFN-γ) in CD8+ T cells (Supplement Figure 3). The seemingly contradictory results were further supported by the findings in ccRCC single-cell sequencing database.Citation24 The expression of TNFRSF9 was significantly correlated with both exhaustion markers (e.g. PDCD1, LAG3, HAVCR2, CTLA4, and TIGIT) and effector phenotype markers in CD8+ T cells (e.g. GZMK, PRF1, IFNG, CD27, and MKI67) in a ccRCC single-cell RNA sequencing database ()). Similar results were observed in liver and melanoma single-cell RNA sequencing database (Supplement Figure 4A). In GSEA analysis (Supplement Figure 4B), pathways related to negative regulation and activation of T cell-mediated immune response were both enriched in high TNFRSF9+ CD8+ T cells signature group (KIRC-TCGA cohort). Similarly, higher expression of TNFRSF9 was associated with both exhausted T cells and effector T cells (a ccRCC single-cell sequencing database). Collectively, these findings indicated that TNFRSF9+ CD8+ T cells held a “dual phenotype”, which deserved further investigation.
Figure 3. Intratumoral TNFRSF9+ CD8+ T cells held both exhaustion phenotype and effector phenotype
TNFRSF9+ CD8+ T cells were associated with a complicated immune contexture in ccRCC
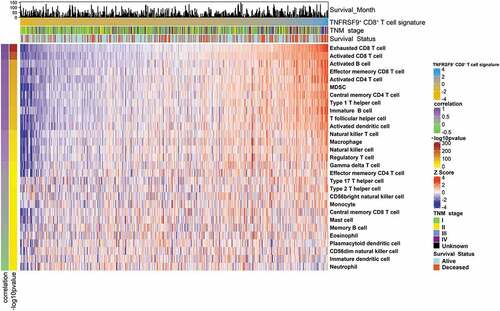
Tumor cells, immune cells, and stromal cells constituted an intricate and delicate balance in the TME.Citation35 To investigate the potential mechanisms of the formation of “dual phenotype” of TNFRSF9+ CD8+ T cells, we analyzed the relationship between TNFRSF9+ CD8+ T cells and other immune cells. The immune cell population was determined by ssGSEA in KIRC-TCGA cohort. In TCGA-KIRC cohort, the TNFRSF9+ CD8+ T cells were significantly correlated with both immune-suppressed cells (Macrophages, Tregs, MDSCs, and Th2) and immune-promoted cells (Activated CD4+ T cells, and Th1 cells, ). Interestingly, the TNFRSF9+ CD8+ T cells were also correlated with Exhausted CD8+ T cells and Activated CD8+ T cells, which further supported the “dual phenotype” of TNFRSF9+ CD8+ T cells.
Figure 4. TNFRSF9+ CD8+ T cells associated with a complicated immune contexture
High TNFRSF9+ CD8+ T cells signature was associated with a better ICB response in ccRCC
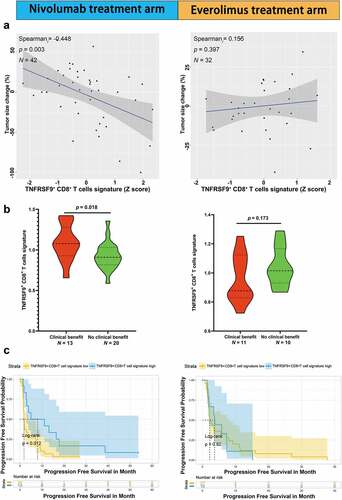
The role of TNFRSF9+ CD8+ T cells in response to ICB was analyzed in public datasets of ccRCC and melanoma from Braun et al. and Riaz et al.,Citation25,Citation26 respectively. In the ccRCC cohort from Braun et al., higher TNFRSF9+ CD8+ T cells signature was associated with higher max tumor size shrinkage in nivolumab treatment arm () left, r= −0.448, p= .003) but not everolimus treatment arm () right, r= 0.155, p= .397). There TNFRSF9+ CD8+ T cells signature were also higher in patients with objective response (complete response and partial response) than those with progressed diseased group in nivolumab treatment arm () left, p= .018) but not everolimus treatment arm ( right, p= .173). Higher TNFRSF9+ CD8+ T cells signature was associated with better progression-free survival in nivolumab treatment arm () left, log rank p= .012) but not everolimus treatment arm () right, log rank p= .820). In the melanoma cohort from Riaz et al., there was a trend of higher TNFRSF9+ CD8+ T cells signature (pre-treatment) in the objective response group (Supplement Figure 5A left, p= .083), and this trend reached significance after ICB treatment (Supplement Figure 5A middle, p= .008). Interestingly, the TNFRSF9+ CD8+ T cells signature was significantly increased after treatment of nivolumab (Supplement Figure 5A right, p= .005). Higher TNFRSF9+ CD8+ T cells signature was also associated with better progression-free survival (Supplement Figure 5B, log rank p = .040). These results indicated that TNFRSF9+ CD8+ T cells might exert a crucial anti-tumor effect in response to ICB.
Figure 5. High TNFRSF9+ CD8+ T cells signature was associated with a better ICB response in ccRCC
Discussion
The origin of cancer immunotherapy could be tracked back to as early as 1890s, in which Coley tentatively injected Streptococcus pyogenes cultures into tumor patients and archived success to some extent.Citation36 Currently, it is growing vigorously as immunotherapy has been recommended as first-line treatment in many cancers. In ccRCC, high CD8 + T cells infiltration was reported to be associated with inferior prognosis.Citation7 This seemly paradoxical finding indicates the heterogeneity of CD8+ T cells.Citation8 Further studies on subpopulation of CD8+ T cells are needed for the better understanding of the immune contexture in ccRCC. Thus, in this study, we focused on the TNFRSF9+ CD8+ T cells subpopulation and revealed that this population of CD8+ T cells held a “dual phenotypes” and may play crucial role in the ICB response.
TNFRSF9 and its ligand, TNFSF9, were overexpressed in ccRCC, compared with adjacent non-tumor tissues, which were thought to be emerging therapeutic targets.Citation37 As a co-stimulatory receptor, combination therapy comprised agonist monoclonal antibody targeting TNFRSF9 and CAR-T cells containing TNFRSF9 domain have been explored for therapy of ccRCC in animal models.Citation38,Citation39 Results indicated that the treatment response required CD8+ T cells, which implied the significance of TNFRSF9+ CD8+ T cells in ccRCC.
Correlation analysis in TCGA-KIRC cohort found that expression of TNFRSF9 was most significantly correlated with CD8A but no other immune cell markers. A mass cytometry analyses in ccRCC tumor also revealed that TNFRSF9 was more enriched in CD8+ T cells.Citation8 Furthermore, our flow cytometry results confirmed the enrichment of TNFRSF9+ CD8+ T cells in ccRCC tumors (compared with peritumoral and peripheral blood). TNFRSF9+ CD8+ T cell abundance was also found in ovarian cancer by Ye et al.Citation40 The enrichment of TNFRSF9+ CD8+ T cells might be associated with the activation induced expression pattern of TNFRSF9.Citation14,Citation41
High TNFRSF9+ CD8+ T cells infiltration was found to be associated with higher T stage, TNM stage, and poor prognosis. However, in the same cohort, high CD8+ T cells infiltration shows a trend of but not significant association with poor prognosis, which further indicated the importance of investigation on subpopulation of CD8+ T cells. In addition, it must be mentioned that the result does not necessarily mean that TNFRSF9+ CD8+ T cells exert a deleterious effect on prognosis. Further in vitro or in vivo studies are needed to investigate the effect of TNFRSF9+ CD8+ T cells on prognosis of ccRCC patients with or without ICB.
Our study found that TNFRSF9+ CD8+ T cells signature significantly correlated with MDSC signature, Th1, and Th2 signature. Previous studies have revealed that the function of CD8+ T cells was regulated by not limit to helper T cells, but also myeloid cells.Citation42 Thus, our findings suggested that the function status of TNFRSF9+ CD8+ T cells might partly result from the complicated interaction among immune cells (helper T cells, CD8+ T cells and myeloid cells) within the tumor.
The notion of T cell exhaustion was firstly proposed based on researches of chronic virus infection and confirmed in TME later,Citation4,Citation43 which is now constantly being updated. Dysfunctional T cells, or at least, some of them are not totally inert, but still retain suboptimal function of cytotoxicity and proliferationCitation21 and might be required for tumor control.Citation44 Our study revealed that TNFRSF9+ CD8+ T cells held both exhaustion and effector phenotype. Similarly, TNFRSF9 was found to be associated with activation/dysfunction module in a mouse tumor model.Citation45 Studies also suggested that TNFRSF9 was co-expressed with co-inhibitory/stimulatory receptors in tumor-infiltrating CD8+ T cells in ccRCC and other cancers,Citation8,Citation46 which implied a “dual phenotype”. Furthermore, a scRNA sequencing study on melanoma revealed that CD8+ T cells with PD1 and TIM3 expression are the most proliferative T cell populations with high levels of effector molecules.Citation21 These findings implied that TNFRSF9+ CD8+ T cells in ccRCC with “dual phenotype” may play a distinct and important role in immune response.
This “dual phenotypes” characteristic indicated the potential immunotherapy response ability of TNFRSF9+ CD8+ T cells. Studies in metastasis melanoma patients treated with ICB suggested that responding patients expressed higher levels of TNFRSF9 or with higher TNFRSF9+ CD8+ T cells.Citation47,Citation48 In addition, it was found that TNFRSF9 could be a marker of tumor-reactive CD8+ T cells and TNFRSF9+ T cells mediated superior antitumor effects than TNFRSF9− T cells.Citation40 This “dual phenotypes” of TNFRSF9+ CD8+ T cells indicated that these cells may be not terminally exhausted,Citation21 but could respond to ICB. A study focused on hepatocellular carcinoma also revealed that TNFRSF9 was a distinct activation status marker of highly exhausted CD8+ T cells and TNFRSF9+ PD1high CD8+ T cells exhibited higher activation markers than their TNFRSF9− counterparts.Citation20 In ccRCC, higher TNFRSF9+ CD8+ T cells signature was significantly associated with higher shrinkage of tumor size and better response to ICB. This could be partly explained by the high expression of both PD-1 and effector phenotype markers in TNFRSF9+ CD8+ T cells. Furthermore, the observation that high tumor shrinkage was correlated with high TNFRSF9+ CD8+ T cells signature in nivolumab treatment arm but not everolimus treatment arm further suggested a potential role of TNFRSF9+ CD8+ T cells and its predictive value in response of ICB in ccRCC.
Since exhausted T cells were thought to be maintained by persistent antigen stimulationCitation49 and TNFRSF9 expression could be prolonged if the antigen persists,Citation50 TNFRSF9 may thus promote the maintenance of dysfunctional T cells. These results further indicated the densities of TNFRSF9+ CD8+ T cells in tumor samples might be used as a predictor of ICB response in ccRCC. Furthermore, it was found that activation of TNFRSF9 could reverse the dysfunctional state of CD8+ T cells.Citation51,Citation52 Nowadays, some clinical trials regarding the combination of TNFRSF9 agonist antibody and other immunotherapy agents have been launched,Citation53 which made the TNFRSF9 a promising novel immunotherapy target in ccRCC.
Conclusion
This study identified that TNFRSF9+ CD8+ T cells were enriched in ccRCC and could be applied as a prognosticator. This subpopulation of CD8+ T cells was held both effector phenotype and exhausted phenotype. High enrichment of TNFRSF9+ CD8+ T cells was associated with superior response of ICB in ccRCC, which indicated that they could be a predictor of immunotherapy and a novel therapy target.
Ethics approval and consent to participate
This study was approved by the Clinical Research Ethics Committee of Zhongshan Hospital, Fudan University, with the approval number B2015-030. Written informed consents were obtained from patients included.
Consent for publication:
All authors provide their consent for publication.
Conflict of interest
The authors have declared no conflicts of interest.
List of Abbreviations
| ccRCC | = | clear cell renal carcinoma |
| TNFRSF9 | = | Tumor necrosis factor receptor super family 9 |
| ICB | = | immune check point blockade |
| TME | = | tumor microenvironment |
| OS | = | overall survival |
| RFS | = | recurrence free survival |
| HR | = | hazard ratio |
| CI | = | confidence interval |
Supplemental Material
Download ()Acknowledgments
We thank Dr. Lingli Chen (Department of Pathology, Zhongshan Hospital, Fudan University, Shanghai, China) and Dr. Yunyi Kong (Department of Pathology, Fudan University Shanghai Cancer Center, Shanghai, China) for their excellent pathological technology help. The results are in part based upon data generated by the TCGA Research Network: https://www.cancer.gov/tcga.
Data availability
All data generated that are relevant to the results presented in this article are included
in this article. Other data that were not relevant for the results presented here are
available from the corresponding author Dr. Xu upon reasonable request and ethically possible.
Supplemental material
Supplemental data for this article can be accessed on the publisher’s website.
Additional information
Funding
References
- Oliver RT, Nethersell AB, Bottomley JM. Unexplained spontaneous regression and alpha-interferon as treatment for metastatic renal carcinoma. Br J Urol. 1989;63(2):128–12. doi:10.1111/j.1464-410X.1989.tb05147.x.
- Motzer RJ, Hutson TE, Tomczak P, Michaelson MD, Bukowski RM, Rixe O, Oudard S, Negrier S, Szczylik C, Kim ST, et al. Sunitinib versus interferon alfa in metastatic renal-cell carcinoma. N Engl J Med. 2007;356(2):115–124. doi:10.1056/NEJMoa065044.
- Motzer RJ, Escudier B, McDermott DF, George S, Hammers HJ, Srinivas S, Tykodi SS, Sosman JA, Procopio G, Plimack ER, et al. Nivolumab versus everolimus in advanced renal-cell carcinoma. N Engl J Med. 2015;373(19):1803–1813.
- Thommen DS, Schumacher TN, Cell T. Dysfunction in cancer. Cancer Cell. 2018;33(4):547–562. doi:10.1016/j.ccell.2018.03.012.
- Fridman WH, Zitvogel L, Sautes-Fridman C, Kroemer G. The immune contexture in cancer prognosis and treatment. Nat Rev Clin Oncol. 2017;14(12):717–734.
- Giraldo NA, Becht E, Pages F, Skliris G, Verkarre V, Vano Y, Mejean A, Saint-Aubert N, Lacroix L, Natario I, et al. Orchestration and prognostic significance of immune checkpoints in the microenvironment of primary and metastatic renal cell cancer. Clini Cancer Res. 2015;21(13):3031–3040. doi:10.1158/1078-0432.CCR-14-2926.
- Nakano O, Sato M, Naito Y, Suzuki K, Orikasa S, Aizawa M, Suzuki Y, Shintaku I, Nagura H, Ohtani H. Proliferative activity of intratumoral CD8(+) T-lymphocytes as a prognostic factor in human renal cell carcinoma: clinicopathologic demonstration of antitumor immunity. Cancer Res. 2001;61(13):5132–5136.
- Chevrier S, Levine JH, Zanotelli VRT, Silina K, Schulz D, Bacac M, Ries CH, Ailles L, Jewett MAS, Moch H, et al. An immune atlas of clear cell renal cell carcinoma. Cell. 2017;169(4):736–749.e18. doi:10.1016/j.cell.2017.04.016.
- Qi Y, Xia Y, Lin Z, Qu Y, Qi Y, Chen Y, Zhou Q, Zeng H, Wang J, Chang Y, et al. Tumor-infiltrating CD39+CD8+ T cells determine poor prognosis and immune evasion in clear cell renal cell carcinoma patients. Cancer Immunol Immunother. 2020;69(8):1565–1576. doi:10.1007/s00262-020-02563-2.
- Mayes PA, Hance KW, Hoos A. The promise and challenges of immune agonist antibody development in cancer. Nat Rev Drug Discov. 2018;17:509–527.
- Kwon BS, Weissman SM. cDNA sequences of two inducible T-cell genes. Proc Natl Acad Sci U S A. 1989;86(6):1963–1967. doi:10.1073/pnas.86.6.1963.
- Alderson MR, Smith CA, Tough TW, Davis-Smith T, Armitage RJ, Falk B, Roux E, Baker E, Sutherland GR, Din WS, et al. Molecular and biological characterization of human 4-1BB and its ligand. Eur J Immunol. 1994;24(9):2219–2227. doi:10.1002/eji.1830240943.
- Schwarz H, Tuckwell J, Lotz M. A receptor induced by lymphocyte activation (ILA): a new member of the human nerve-growth-factor/tumor-necrosis-factor receptor family. Gene. 1993;134(2):295–298. doi:10.1016/0378-1119(93)90110-O.
- Bartkowiak T, Curran MA. 4-1BB agonists: multi-potent potentiators of tumor immunity. Front Oncol. 2015;5. doi:10.3389/fonc.2015.00117.
- Vinay DS, Kwon BS. 4-1BB signaling beyond T cells. Cell Mol Immunol. 2011;8(4):281–284. doi:10.1038/cmi.2010.82.
- Hernandez-Chacon JA, Li Y, Wu RC, Bernatchez C, Wang Y, Weber JS, Hwu P, Radvanyi LG. Costimulation through the CD137/4-1BB pathway protects human melanoma tumor-infiltrating lymphocytes from activation-induced cell death and enhances antitumor effector function. J Immunother. 2011;34(3):236–250. doi:10.1097/CJI.0b013e318209e7ec.
- Tolcher AW, Sznol M, Hu-Lieskovan S, Papadopoulos KP, Patnaik A, Rasco DW, Di Gravio D, Huang B, Gambhire D, Chen Y, et al. Phase Ib study of utomilumab (PF-05082566), a 4-1BB/CD137 agonist, IN COMBINATION WITH PEMBROLIZUMAB (MK-3475) in patients with advanced solid tumors. Clini Cancer Res. 2017;23(18):5349–5357. doi:10.1158/1078-0432.CCR-17-1243.
- Melero I, Shuford WW, Newby SA, Aruffo A, Ledbetter JA, Hellström KE, Mittler RS, Chen L. Monoclonal antibodies against the 4-1BB T-cell activation molecule eradicate established tumors. Nat Med. 1997;3(6):682–685. doi:10.1038/nm0697-682.
- Segal NH, Logan TF, Hodi FS, McDermott D, Melero I, Hamid O, Schmidt H, Robert C, Chiarion-Sileni V, Ascierto PA, et al. Results from an integrated safety analysis of urelumab, an agonist anti-CD137 monoclonal antibody. Clini Cancer Res. 2017;23(8):1929–1936. doi:10.1158/1078-0432.CCR-16-1272.
- Kim HD, Park S, Jeong S, Lee YJ, Lee H, Kim CG, Kim KH, Hong SM, Lee JY, Kim S, et al. 4-1BB delineates distinct activation status of exhausted tumor-infiltrating CD8(+) T cells in hepatocellular carcinoma. Hepatology. 2020; 71(3): 955-971.
- Li H, van der Leun AM, Yofe I, Lubling Y, Gelbard-Solodkin D, van Akkooi ACJ, van den Braber M, Rozeman EA, Haanen JBAG, Blank CU, et al. Dysfunctional CD8 T cells form a proliferative, dynamically regulated compartment within human melanoma. Cell.
- Tirosh I, Izar B, Prakadan SM, Wadsworth MH, Treacy D, Trombetta JJ, Rotem A, Rodman C, Lian C, Murphy G, et al. Dissecting the multicellular ecosystem of metastatic melanoma by single-cell RNA-seq. Science. 2016;352(6282):189–196. doi:10.1126/science.aad0501.
- Zheng C, Zheng L, Yoo J-K, Guo H, Zhang Y, Guo X, Kang B, Hu R, Huang JY, Zhang Q, et al. Landscape of infiltrating T cells in liver cancer revealed by single-cell sequencing. Cell. 2017;169(7):1342–1356.e16. doi:10.1016/j.cell.2017.05.035.
- Young MD, Mitchell TJ, Vieira Braga FA, Tran MGB, Stewart BJ, Ferdinand JR, Collord G, Botting RA, Popescu D-M, Loudon KW, et al. Single-cell transcriptomes from human kidneys reveal the cellular identity of renal tumors. Science. 2018;361(6402):594–599. doi:10.1126/science.aat1699.
- Riaz N, Havel JJ, Makarov V, Desrichard A, Urba WJ, Sims JS, Hodi FS, Martín-Algarra S, Mandal R, Sharfman WH, et al. Tumor and microenvironment evolution during immunotherapy with nivolumab. Cell. 2017;171(4):934–949.e16. doi:10.1016/j.cell.2017.09.028.
- Braun DA, Hou Y, Bakouny Z, Ficial M, Sant’ Angelo M, Forman J, Ross-Macdonald P, Berger AC, Jegede OA, Elagina L, et al. Interplay of somatic alterations and immune infiltration modulates response to PD-1 blockade in advanced clear cell renal cell carcinoma. Nat Med. 2020;26(6):909–918. doi:10.1038/s41591-020-0839-y.
- Aran D, Looney AP, Liu L, Wu E, Fong V, Hsu A, Chak S, Naikawadi RP, Wolters PJ, Abate AR, et al. Reference-based analysis of lung single-cell sequencing reveals a transitional profibrotic macrophage. Nat Immunol. 2019;20(2):163–172. doi:10.1038/s41590-018-0276-y.
- Stuart T, Butler A, Hoffman P, Hafemeister C, Papalexi E, Mauck WM, Hao Y, Stoeckius M, Smibert P, Satija R, et al. Comprehensive integration of single-cell data. Cell. 2019;177(7):1888–1902.e21. doi:10.1016/j.cell.2019.05.031.
- Charoentong P, Finotello F, Angelova M, Mayer C, Efremova M, Rieder D, Hackl H, Trajanoski Z. Pan-cancer immunogenomic analyses reveal genotype-immunophenotype relationships and predictors of response to checkpoint blockade. Cell Rep. 2017;18(1):248–262. doi:10.1016/j.celrep.2016.12.019.
- Barbie DA, Tamayo P, Boehm JS, Kim SY, Moody SE, Dunn IF, Schinzel AC, Sandy P, Meylan E, Scholl C, et al. Systematic RNA interference reveals that oncogenic KRAS-driven cancers require TBK1. Nature. 2009;462(7269):108–112. doi:10.1038/nature08460.
- Guo X, Zhang Y, Zheng L, Zheng C, Song J, Zhang Q, Kang B, Liu Z, Jin L, Xing R, et al. Global characterization of T cells in non-small-cell lung cancer by single-cell sequencing. Nat Med. 2018;24(7):978–985. doi:10.1038/s41591-018-0045-3.
- Mootha VK, Lindgren CM, Eriksson K-F, Subramanian A, Sihag S, Lehar J, Puigserver P, Carlsson E, Ridderstråle M, Laurila E, et al. PGC-1alpha-responsive genes involved in oxidative phosphorylation are coordinately downregulated in human diabetes. Nat Genet. 2003;34(3):267–273. doi:10.1038/ng1180.
- Subramanian A, Tamayo P, Mootha VK, Mukherjee S, Ebert BL, Gillette MA, Paulovich A, Pomeroy SL, Golub TR, Lander ES, et al. Gene set enrichment analysis: a knowledge-based approach for interpreting genome-wide expression profiles. Proc Natl Acad Sci U S A. 2005;102(43):15545–15550. doi:10.1073/pnas.0506580102.
- R Core Team. R: A language and environment for statistical computing; 2019. https://www.R-project.org/.Access date: May 8th, 2019.
- Fridman WH, Pagès F, Sautès-Fridman C, Galon J. The immune contexture in human tumours: impact on clinical outcome. Nat Rev Cancer. 2012;12(4):298–306. doi:10.1038/nrc3245.
- Coley WB. Contribution to the knowledge of sarcoma. Ann Surg. 1891;14(3):199–220. doi:10.1097/00000658-189112000-00015.
- Tronik-Le RD, Sautreuil M, Bentriou M, Vérine J, Palma MB, Daouya M, Bouhidel F, Lemler S, LeMaoult J, Desgrandchamps F, et al. Comprehensive landscape of immune-checkpoints uncovered in clear cell renal cell carcinoma reveals new and emerging therapeutic targets. Cancer Immunol Immunother. 2020;69(7):1237–1252. doi:10.1007/s00262-020-02530-x.
- Ju S, Cheon S-H, Park S-M, Tam NQ, Kim YM, An WG, Kim B-S. Eradication of established renal cell carcinoma by a combination of 5-fluorouracil and anti-4-1BB monoclonal antibody in mice. Int J Cancer. 2008;122(12):2784–2790. doi:10.1002/ijc.23457.
- Westwood JA, Darcy PK, Guru P, Sharkey J, Pegram HJ, Amos SM, Smyth MJ, Kershaw MH. Three agonist antibodies in combination with high-dose IL-2 eradicate orthotopic kidney cancer in mice. J Transl Med. 2010;8(1):42. doi:10.1186/1479-5876-8-42.
- Ye Q, Song D-G, Poussin M, Yamamoto T, Best A, Li C, Coukos G, Powell DJ. CD137 accurately identifies and enriches for naturally occurring tumor-reactive t cells in tumor. Clini Cancer Res. 2014;20(1):44–55. doi:10.1158/1078-0432.CCR-13-0945.
- Palazón A, Martínez-Forero I, Teijeira A, Morales-Kastresana A, Alfaro C, Sanmamed MF, Perez-Gracia JL, Peñuelas I, Hervás-Stubbs S, Rouzaut A, et al. The HIF-1α hypoxia response in tumor-infiltrating T lymphocytes induces functional CD137 (4-1BB) for immunotherapy. Cancer Discov. 2012;2(7):608–623. doi:10.1158/2159-8290.CD-11-0314.
- Wang W, Marinis JM, Beal AM, Savadkar S, Wu Y, Khan M, Taunk PS, Wu N, Su W, Wu J, et al. RIP1 kinase drives macrophage-mediated adaptive immune tolerance in pancreatic cancer. Cancer Cell. 2018;34(5):757–774.e7. doi:10.1016/j.ccell.2018.10.006.
- Gallimore A, Glithero A, Godkin A, Tissot AC, Plückthun A, Elliott T, Hengartner H, Zinkernagel R. Induction and exhaustion of lymphocytic choriomeningitis virus–specific cytotoxic t lymphocytes visualized using soluble tetrameric major histocompatibility complex class i–peptide complexes. J Exp Med. 1998;187(9):1383–1393. doi:10.1084/jem.187.9.1383.
- Kallies A, Zehn D, Utzschneider DT. Precursor exhausted T cells: key to successful immunotherapy? Nat Rev Immunol. 2020;20(2):128–136. doi:10.1038/s41577-019-0223-7.
- Singer M, Wang C, Cong L, Marjanovic ND, Kowalczyk MS, Zhang H, Nyman J, Sakuishi K, Kurtulus S, Gennert D, et al. A distinct gene module for dysfunction uncoupled from activation in tumor-infiltrating T cells. Cell. 2016;166(6):1500–1511.e9. doi:10.1016/j.cell.2016.08.052.
- Azizi E, Carr AJ, Plitas G, Cornish AE, Konopacki C, Prabhakaran S, Nainys J, Wu K, Kiseliovas V, Setty M, et al. Single-cell map of diverse immune phenotypes in the breast tumor microenvironment. Cell. 2018;174(5):1293–1308.e36. doi:10.1016/j.cell.2018.05.060.
- Gide TN, Quek C, Menzies AM, Tasker AT, Shang P, Holst J, Madore J, Lim SY, Velickovic R, Wongchenko M, et al. Distinct Immune cell populations define response to anti-PD-1 monotherapy and anti-PD-1/anti-CTLA-4 combined therapy. Cancer Cell. 2019;35(2):238–255.e6. doi:10.1016/j.ccell.2019.01.003.
- Jacquelot N, Roberti MP, Enot DP, Rusakiewicz S, Ternès N, Jegou S, Woods DM, Sodré AL, Hansen M, Meirow Y, et al. Predictors of responses to immune checkpoint blockade in advanced melanoma. Nat Commun. 2017;8(1): 592–13. doi:10.1038/s41467-017-00608-2.
- McLane LM, Abdel-Hakeem MS, Wherry EJ. CD8 T cell exhaustion during chronic viral infection and cancer. Annu Rev Immunol. 2019;37(1):457–495. doi:10.1146/annurev-immunol-041015-055318.
- Shin H, Blackburn SD, Blattman JN, Wherry EJ. Viral antigen and extensive division maintain virus-specific CD8 T cells during chronic infection. J Exp Med. 2007;204(4):941–949. doi:10.1084/jem.20061937.
- Wilcox RA, Tamada K, Flies DB, Zhu G, Chapoval AI, Blazar BR, Kast WM, Chen L. Ligation of CD137 receptor prevents and reverses established anergy of CD8+ cytolytic T lymphocytes in vivo. Blood. 2004;103(1):177–184. doi:10.1182/blood-2003-06-2184.
- Williams JB, Horton BL, Zheng Y, Duan Y, Powell JD, Gajewski TF. The EGR2 targets LAG-3 and 4-1BB describe and regulate dysfunctional antigen-specific CD8+ T cells in the tumor microenvironment. J Exp Med. 2017;214(2):381–400. doi:10.1084/jem.20160485.
- Chester C, Sanmamed MF, Wang J, Melero I. Immunotherapy targeting 4-1BB: mechanistic rationale, clinical results, and future strategies. Blood. 2018;131(1):49–57. doi:10.1182/blood-2017-06-741041.