
ABSTRACT
Immune checkpoint blockade (ICB) has demonstrated an impressive outcome in patients with metastatic melanoma, yet, durable complete response; even with Ipilimumab/Nivolumab combo are under 30%. Primary and acquired resistance in response to ICB is commonly due to a tumor immune escape mechanism dictated by the tumor microenvironment (TME). Macrophage Migratory Inhibition Factor (MIF) has emerged as an immunosuppressive factor secreted in the TME. We have previously demonstrated that blockade of the MIF-CD74 signaling on macrophages and dendritic cells restored the anti-tumor immune response against melanoma. Here, we report that inhibition of the MIF-CD74 axis combined with ipilimumab could render resistant melanoma to better respond to anti-CTLA-4 treatment. We provide evidence that blocking the MIF-CD74 signaling potentiates CD8+ T-cells infiltration and drives pro-inflammatory M1 conversion of macrophages in the TME. Furthermore, MIF inhibition resulted in reprogramming the metabolic pathway by reducing lactate production, HIF-1α and PD-L1 expression in the resistant melanoma cells. Melanoma patient data extracted from the TCGA database supports the hypothesis that high MIF expression strongly correlates with poor response to ICB therapy. Our findings provide a rationale for combining anti-CTLA-4 with MIF inhibitors as a potential strategy to overcome resistance to ICB therapy in melanoma, turning a “cold” tumor into a “hot” one mediated by the activation of innate immunity and reprogramming of tumor metabolism and reduced PD-L1 expression in melanoma cells.
Introduction
The tumor microenvironment (TME) is an essential component of the tumor structureCitation1. The crosstalk between stromal cells and those of the immune system provides an important balance in the control of neoplasia development.Citation2 Immunological escape is a key step in establishment and maintenance of tumor progression.Citation3 The interaction between cells in the microenvironment is mainly mediated by secretion of pro-tolerogenic factors resulting in functional losses of cells of innate and adaptive immunity.Citation4 In recent years the Macrophage Migration Inhibitory Factor (MIF) has been considered an important pro-tolerogenic factor secreted in the TME.Citation5,Citation6 MIF was identified in 1966 by Bloom and Bennett as a pro-inflammatory cytokine secreted by T cells, acting as a strong inhibitor of the migration of macrophages.Citation7 MIF is not only secreted by lymphocytes but also by other immune cells such as macrophages and nonimmune cells such as endothelial, epithelial, and tumor cells.Citation5–9 Following its secretion, in the TME, MIF can bind to its receptor CD74, which is expressed on tumor associated macrophages,Citation10 dendritic cells (DC), regulatory T cells (Tregs) and myeloid-derived suppressor cells (MDSC), promoting immunological escape and tumor growth.Citation5,Citation11–13 In addition to its immunosuppressive effects on innate immune cells, MIF can also modulate the adaptive immune response through suppression of cytotoxic T lymphocytes (CTL).Citation14,Citation15
We have previously demonstrated that blockade of the MIF-CD74 signaling pathway on macrophages and dendritic cells restored the anti-tumor immune response against metastatic melanoma.Citation5 Blocking of the MIF-CD74 signaling on MOs and DCs using peptide-based immunotherapy resulted in the restoration of their pro-inflammatory and anti-tumor functions.Citation5 MIF exerts its inhibitory effect on the adaptive immune response by reducing the infiltration of both CD4+ and CD8+ T-cells.Citation15 It promotes tumor growth through increased Treg accumulation resulting from the modulation of IL-2 production.Citation14
Previous evidence has shown the important correlation between MIF overexpression and the poor survival of advanced melanoma patients.Citation16,Citation17 Ekmekcioglu et al.Citation17 performed a survival analysis in stage III melanoma patients, and have shown a correlation between high MIF expression levels and poor clinical prognosis.Citation17 In a different study, Schoenfeld et al.Citation18 identified that late stage melanoma patients, who positively responded to CTLA-4 blockade immunotherapy combined with a GM-CSF vaccine, naturally developed auto-antibodies against MIF.Citation18 This study suggests that neutralization of MIF activity may have supported these therapeutic response and improved survival in these patients.Citation18 Given the fact that CTLA-4 blockade improves outcomes in patients with metastatic melanoma,Citation19 it is possible that a combination therapeutic approach of adaptive immune potentiating (anti-CTLA-4) with reversal of innate immune suppressive mechanisms (MIF inhibition) may yield synergistic clinical responses in patients with advanced melanoma.
Here we report that inhibition of the MIF-CD74 axis combined with ipilimumab can improve the therapeutic response of immune checkpoint refractory melanoma to CTLA-4 blockade. We provide evidence that blocking the MIF-CD74 axis potentiates CD8+ T cell infiltration and promotes macrophage conversion to an M1-like phenotype in the TME. Furthermore, MIF inhibition resulted in reprogramming of melanoma tumor metabolism by reducing lactate production and decreasing HIF-1α and PD-L1 expression in the resistant cells. These data support the rationale of targeting MIF inhibition as a potential strategy to overcome resistance to immune checkpoint blockade in melanoma.
Material and methods
Cell lines and reagents
The murine melanoma cell line B16-BL6 TMT (sensitive to anti-CTLA-4) and B16-BL6 3I-F4 (completely resistant to anti-CTLA-4) were obtained from Dr. Michael A. Curran (MD Anderson Cancer Center, Houston, TX) and maintained in RPMI 1640, supplemented with 10% FBS, 2 mM glutamine, 1% non-essential amino acids, and 1% antibiotics antimycotic. Anti – CTLA-4 (clone 9H10), PD-L1 (clone 10F.9G2), and IgG2b isotype control (clone MPC-11) were purchased from BioXCell (West Lebanon, NH, USA).
Tumor injections and treatments
Six- to 8-wk-old male C57BL/6WT mice were purchased from The Jackson Laboratory. Mice were injected subcutaneously with 1 × 10⁵ of TMT or 3I-F4 cells. Mice were then randomized and treated with i.p. injection of anti-CTLA-4 100 µg or anti-PD-L1 250 µg on days 3, 6, 9 and 12. The dosage of anti-CTLA-4 and anti-PD-L1 antibodies were doubled on day 3 (,f). The small molecule 4-IPP (Sigma Aldrich 475846) was used to inhibit the MIF/CD74 axis. 4-IPP (80 mg/Kg) was diluted in corn oil and administered via i.p. as described in ,f. Mice were euthanized on day 15. Tumor volume was measured every day using the following formula: (wide2) × (length) / 2 for caliper measurements.
In the experimental lung metastasis model, mice were injected i.v. (tail vein) with 1 × 10⁵ TMT or 3I-F4 cells. Mice were then treated as described for the subcutaneous model (,f). After 14 days, mice were euthanized, lungs were harvested and assessed for the number of lung colonies. The number of lung metastases was quantified under a microscope (Nikon, Tokyo). All animal experiments were conducted in accordance with the American Association for Laboratory Animal Science regulations with the approval of The University of Texas MD Anderson Cancer Center Institutional Animal Care & Use Committee.
Tissue paraffin immunofluorescence
Deparaffinization and antigen retrieval were performed in murine melanoma subcutaneous tumors using Antigen Retrieval Buffer (Abcam ab52488 and ab93684) and stained as previously described.Citation20 The following antibodies were used for immune staining as described previously:Citation5 anti-CD3 (ab16669), anti-CD4 (ab183685), anti-CD8 (ab22378), anti-granzyme B (ab4059), anti-F4/80 (ab6640), anti-iNOS (ab3523), anti-Arg.1 (ab91279), anti-LDHA (ab52488), and Goat Anti-Rabbit Alexa 488 (ab150077), all antibodies were purchased from Abcam. Images were obtained by using an Axio Observer Light Microscope with the Apotome.2 (Zeiss). Metastatic melanoma lesions were gated by generating a region of interest, and threshold merged fluorescence limited to ROI and calculated using the ImageJ software.
Lactate assay
Lactate levels were measured using lactate colorimetric/Fluorometric assay Kit (Biovision Incorporated K607) in TMT and 3I-F4 melanoma cells under hypoxia or normoxia culture conditions. Briefly, 5 × 10⁵ cells were plated into 24-wells plate, treated with 100 µM of 4-IPP, cultured in hypoxia conditions (<1% O2) or normoxia condition and incubated for 24 hours. The medium was then collected and the lactate production was measured as per the manufacturer’s instruction. The O.D. of each well was measured using Epoch (Bio Tek) spectrophotometer. Measurements were performed in 5 replicas from 3 independents experiments.
Western blotting analysis
Protein samples were generated from TMT or 3I-F4 melanoma cells treated with 4-IPP (100 µM) and cultured under hypoxia or normoxia conditions for 24 hours. After incubation, cells were subjected to SDS-PAGE and Western blotting (WB) analysis. WB was performed to detect the following with the respective antibodies: anti–HIF-1α (Abcam ab51608) and PD-L1 (Abcam ab213480) and α-tubulin (Sigma T-5168). HRP-conjugated secondary antibodies were used, followed by incubation with the Western ECL blotting substrates (Bio-Rad 1705062).
TCGA and TIMER analysis
mRNA expression and clinical data of The Cancer Genome Atlas (TCGA) GDC TCGA Skin Cancer Melanomas dataset (SKCM) were downloaded from the Xena Functional Genomics Explorer of University of California Santa Cruz (https://xenabrowser.net).Citation21 We extracted the biological pathways involved in the GDC TCGA SKCM cohort (n = 477) or in the anti-CTLA-4 therapy patient’s cohort (n = 26), and applied the nCounter Pan-Cancer Immune Profiling gene set of 730 genes (NanoString technologies) on UCSC Cancer Genomics Browser to investigate the biological pathways correlated with MIF expression levels. The results obtained were extracted in the .csv format and analyzed by GraphPad Prism 8 for correlation studies. The immune genes of the TCGA RNA-seq data set were performed among those with significant Spearman’s correlation to MIF expression in the SKCM patient’s cohort included in an anti-CTLA-4 therapy. The genes were sorted from the lowest rank (negative correlation) to the highest rank (positive correlation). Those genes predicting significant survival differences (p < .05) were selected for further immune network analysis. Network plots were generated using the NodeXL-basic add-on to Excel. These immune genes were separated into different immune categories and divided into columns. We also considered the low- and high-variance state of these genes into TCGA-SKCM anti-CTLA-4 therapy cohort. Therefore, high variance is associated with increased plasticity (thicker lines) and low variance with diminished plasticity (thinner lines) in response to MIF expression changes. We calculated the expression variance (σ2) of genes across the TCGA SKCM anti-CTLA-4 therapy cohort to predict how MIF expression impacts the expression of a particular gene by applying the following formula σ2 = Σ(X-µ)2/N, where X represents the RNA-seq expression value of a particular gene, µ is the mean of the entire RNA expression for this particular gene in the cohort and N is the distribution number (TCGA-SKCM anti-CTLA-4 therapy, N = 26). Sphere size represents the number of genes assigned to a given immune category.
The correlation significance between immune genes and high MIF expression in TCGA-SKCM cohort treated with anti-CTLA-4 was also assessed in a volcano analysis. High MIF expression profile was used to determine the cohort cutoff for high and low immune gene expression in the TCGA-SKCM cohort treated with anti-CTLA-4 therapy (MIF cutoff = 19.27). The p value of high and low gene expression groups was calculated for each gene using an unpaired, two-tail t-Test. Further, the – log10 (p value) was determined for each gene. The fold change of each gene expression in the cohort was calculated by determining the ratio between the averages of high and low gene expression groups. Further, the log2 (fold change) was calculated for each gene. Positive values for log2 (fold change) represent the upregulated genes and negative log2 (fold change) values represent downregulated genes, following MIF high expression levels. A volcano plot was generated to analyze the significance (p ≤0.05, -log10(p value) ≥ 1.30) and log2(fold change) values lower than −0.2 and -log10(p value) higher than 1.3. Further, we used the GEPIA (http://gepia2.cancer-pku.cn/#survival) to assess MIF expression levels in several cancer types, as well the overall survival analyses based on the cancer type and cancer subtype to determine the significant prognostic impact of MIF expression level.Citation22 Also, we interrogated the Tumor IMmune Estimation Resource (TIMER)Citation23 (https://cistrome.shinyapps.io/timer/) to assess the correlation expression between MIF and T-regs and exhausted markers signature expression levels. To assess the impact of MIF expression in immune infiltration cells and Tumor Immune Dysfunction and Exclusion, we used the TIDE TCGA data base of patients in the ipilimumab program cohort (http://tide.dfci.harvard.edu/). We also assessed the overall survival based on T cells exclusion as a prognosticator cancer immunotherapy response.Citation24
MIF quantification
The MIF concentration was determined in TMT or 3I-F4 melanoma cells under hypoxia or normoxia culture conditions. Briefly, 5 × 10⁵ cells were plated into 24-wells plate, treated with 100 µM of 4-IPP, cultured in hypoxia conditions (< 1% O2) or normoxia conditions for 24 h. The medium was collected and fifty microliters was used for MIF quantification using the Mouse MIF DuoSet Sandwich ELISA kit (R&D Systems DY1978) in accordance with the manufacturer’s instructions. Samples were read in an Epoch microplate spectrophotometer at 405 nm (BioTek). Each sample has 5 replicas from 3 independent experiments.
Microarray analysis
The microarray analysis from TMT and 3I-F4 cells were performed as previously described in Jaiswal et al.Citation25 Briefly, tumor cells (TMT or 3I-F4) were sorted from mice tumor using flow cytometry. Total RNA was extracted using the RNeasy Mini Kit (Quiagen, MD). Microarray analyses were performed from four independent RNA samples from tumor cells using MouseRef-8 bead chip arrays (Illumina). Microarray data was normalized as per manufacturer’s instructions and processed in R (version 3.4.1). Differential expression between resistant and parental tumor cells was performed by a fold-change in absolute value equal.
Quantification and statistical analysis
All data were analyzed using GraphPad Prism 8.0 (GraphPad Software, Inc) and are presented as the means ± standard deviation. The significant differences in the immune gene expression along MIFlo, MIFmid and MIFhi groups were estimated by using one-way analysis of variance followed by Bonferroni’s multiple comparisons test. Survival analysis was performed in Xena Browser using Kaplan-Meier assay and was compared using the log-rank test. The correlation between different mRNA expression and overall survival (OS) of TCGA-SKCM patients was evaluated by nonparametric Spearman’s correlation, two-tailed, where *0.01 < p < .05, **0.001 < p < .01; ***0.0001 < p < .001 and ****p < .0001 indicated the ranges of significant differences.
Results
Elevated MIF expression levels are correlated with poor overall survival and poor response to checkpoint blockade in metastatic melanoma cohorts
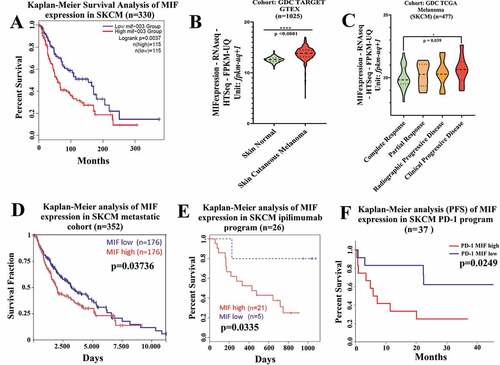
We first focused our studies on mining the TCGA data for the association between MIF expression, melanoma progression, and survival. We found that MIF is highly expressed in many cancer types, but particularly in melanoma patients (Figure S1a). Analysis of data from 230 melanoma patients demonstrated that high MIF expression correlated with poor survival (cutoff 19.78 for MIF expression, and 300 months as default end point) (). Using cohort GDC TARGET GTEX (n = 1025) of melanoma patients, we found that MIF expression in Skin Cancer Melanoma (SKCM) was significantly higher than in with normal skin (). Next, we analyzed MIF expression levels in GDC TCGA melanoma patients (n = 477) following therapeutic treatments (chemotherapy or immunotherapy). MIF expression level was significantly higher in a poor prognosis patient’s cohort, (i.e. patients with clinically progressive disease) compared to patients experiencing complete responses (). When we assessed metastatic melanoma cohorts, we found that high MIF expression level was also associated with a significantly decreased survival in metastatic patients (cutoff 20.28 for MIF expression, and 10,000 days as default end point), indicated by the red curve on the Kaplan-Meier statistical test results (). Mining the cohort of patients receiving ipilimumab therapy (anti-CTLA-4 antibody), we found that high MIF expression level was associated with poor response in terms of overall survival (OS) (), as well as in progression free survival (PFS) analyses (Figure S1b). Lastly, we examined a cohort of patients who received anti-PD-1 therapy (n = 37), indicating that high MIF expression levels were associated with significantly poor response and survival (). Taken together, these findings confirmed that high MIF expression level is strongly associated with poor survival prognosis in SKCM, and showed that high expression is strongly correlated with poor response in patients receiving in immune-checkpoint blockade therapy, which led us to hypothesize that combination of immune-checkpoint blockage therapy with MIF inhibitors might improve patient outcome.
Figure 1. High MIF expression correlates with poor overall survival in melanoma patient cohorts (a) Kaplan-Meier analysis performed in public TCGA database (http://gepia2.cancer-pku.cn/#index) correlating the high MIF expression levels with poor overall survival in SKCM patients (n = 230). (b) Comparison of MIF expression levels in normal versus SKCM patients sorted from public GDC TARGET GTEX cohort (Xena Browser, University of California) (n = 1025). (c) High MIF expression correlates with clinical progressive disease based on data from GDC TCGA SKCM assessed from GDC TCGA melanoma cohort (Xena Browser, University of California) (n = 477). (d) Overall survival by Kaplan-Meier analysis sorted in GDC TCGA SKCM metastatic cohort (Xena Browser, University of California) (n = 352). (e) Kaplan-Meier analysis assessed from TIDE (Tumor Immune Dysfunction and Exclusion) database correlating the MIF high expression levels with poor Overall Survival (OS) in SKCM patients cohort receiving anti-CTLA-4 therapy (red curve) (n = 26). (f) Inverse correlation between high MIF expression and Progression Free Survival in SKCM patient cohort treated with anti-PD-1 antibody therapy (n = 37). ANOVA t-test was used for statistical analysis. *P < .05, **P < .01, and ****P < .0001
MIF/CD74 axis inhibition overcomes resistance to anti-CTLA-4 therapy and inhibits melanoma growth and metastasis
The chief MIF-binding receptor is CD74 which is expressed in melanoma cells,Citation9,Citation11 as well as on immune cells such as macrophages, DC and B cells.Citation5,Citation12,Citation26 To evaluate the therapeutic association between MIF/CD74 axis inhibition and the immune-checkpoint blockade, we used 4-IPP, a small molecule that prevents MIF binding to its receptor CD74,Citation27 in combination with either anti–CTLA-4 or anti-PD-L1 antibodies. For the in vivo studies, we utilized the B16/BL6 TMT (tdTomato+) melanoma model (responsive to CTLA-4 immunotherapy) and the derivative B16/BL6 3I-F4 cells (completely resistant to CTLA-4 immunotherapy) either subcutaneously (s.c., tumor growth) or intravenously (i.v., experimental lung metastasis assay).Citation25 In the subcutaneous model we injected 105 melanoma cells in the right flank of the mice, and 3, 6, 9 and 12 days later, mice were injected i.p. with anti–CTLA-4 antibody (clone 9H10), or anti-PD-L1 antibody (clone RMP1-14) alone or in combination with 4-IPP. The treatment regimen is depicted in . 4-IPP was injected seven times (marked as blue arrows) starting on day 6. The treatment protocol also included 4 injections of anti-CTLA-4 antibody or anti-PD-L1 antibody (marked with green arrows) as shown in . The immune-check point antibody doses were given at double the amount for the 1st dose compared to subsequent doses ().
Figure 2. MIF/CD74 axis inhibition enhances immune-checkpoint blockade therapy efficacy. (a) Experimental design using subcutaneous models. Mice were injected on the right flank with 1 × 10⁵ TMT (sensitive anti-CTLA-4 antibody) or 3I-F4 (resistant anti-CTLA-4 antibody) and followed up for 16 days. Green arrows represent anti-CTLA-4 or anti-PD-L1 injections, while blue arrows indicating 4-IPP injections. (b) Treatment with anti-CTLA-4 alone significantly decreased tumor growth in TMT S.C. model (p < .0001). The combination of anti-CTLA-4 with 4-IPP treatment proved to be significantly more effective than treatment with anti-CTLA-4 alone (p < .01); (c) anti-CTLA-4 alone had no effect in the resistant 3I-F4 tumor cells, however, when combined with 4-IPP, a decrease in tumor growth was observed (p < .001); (d, e) Treatment with anti-PD-L1 alone or in combination with 4-IPP significantly inhibited tumor growth in both TMT or 3I-F4 tumor cells. No advantage was observed in the combination treatment; (f) Experimental design using intravenous (i.v.) model. Mice were injected in the tail vein with 106 TMT or 3I-F4 and followed up for 14 days. Green arrows represent anti-CTLA-4 or anti-PD-L1 treatment, while blue arrows represent 4-IPP treatment. (g) Effect of anti-CTLA-4 alone or in combination with 4-IPP on TMT tumor cells significantly reduced the lung nodules number as compared with the vehicle (corn oil) plus IgG2 control. The combination treatment was significantly more effective than treatment with anti-CTLA-4 alone (p < .01). The anti-PD-L1 treatment alone or in combination with 4-IPP showed no effect in TMT I.V. model. (h) Treatment with anti-CTLA-4 alone had no effect on 3I-F4 lung colonies number, however, when combined with 4-IPP, a significant decrease in the lung colonies number was observed (p < .01). The anti-PD-L1 alone or combined with 4-IPP had no effect in 3I-F4 I.V. model. Data are cumulative of one experiment with five mice per group. Error bars represent the mean ± SEM. *P < .05, **P < .01, and ****P < .0001 using t-Test statistical analysis
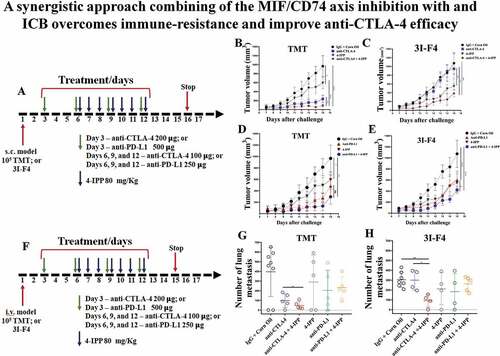
We found that treatment with anti–CTLA-4 antibody alone (blue curve in ), significantly reduced tumor growth only in the sensitive melanoma line (TMT) but not in the resistant cells (3I-F4) (blue curve in ). When anti–CTLA-4 was combined with 4-IPP, we observed a significantly lower tumor size in both sensitive (TMT) and resistant (3I-F4) cell lines (red curves in ,c respectively). The actual tumor sizes in these experiments are depicted in Figure S2a,b. We also evaluated the association between 4-IPP and anti-PD-L1 antibody treatment alone or in combination with 4-IPP. The PD-L1 antibody alone exhibited antitumor activity reducing tumor size in the TMT model ( and S2c). The 3I-F4 cells also responded to anti-PD-L1 alone therapy with a modest reduction in tumor size ( and S2d). Furthermore, the combination treatment of anti-PD-L1 and 4-IPP, although it showed a trend toward improved antitumor response on TMT cells, did not significantly improve outcome compared with antibody alone (). This therapeutic combination, however, did significantly improve the antitumor response in the checkpoint resistant 3I-F4 cells, when compared to the antibody alone, in reducing tumor size ( and S2d).
Next, we studied the combination of anti-CTLA-4 or anti-PD-L1 antibodies with 4-IPP in the experimental lung metastases model. To that end, 7 daily injections were given, starting on day 6 daily for 12 days (depicted in ). On day 15, after i.v. challenge of tumor cells, the animals were euthanized, and lung metastatic nodules were quantified. We found that anti-CTLA-4 antibody alone reduced lung metastases number in the sensitive TMT melanoma cell line (). As expected, anti-CTLA-4 alone did not show anti-metastatic response in the resistant cells (). The combination treatment of anti-CTLA-4 and 4-IPP, however, significantly reduced the number of lung metastases in both cell lines (shown in green ,h). The anti-PD-L1 alone or in combination did not affect the number of lung metastases of both sensitive and resistant models (,h marked in green). Taken together, these data reveal that anti-CTLA-4 antibody in combination with 4-IPP can overcome immune-checkpoint resistance, suggesting a new therapeutic approach by adding 4-IPP to anti-CTLA-4 aiming to improve patient’s outcomes.
High MIF expression levels correlate with tumor microenvironment immunosuppressive networks
To investigate the role of high MIF expression levels in immune network regulation within the TME, we expanded our analysis by interrogating the TCGA-SKCM RNA-seq data using a panel of 730 immune genes defined by the nCounter Pan Cancer immune panel (NanoString, Seattle). Using Spearman’s correlation analysis, we identified one hundred and ninety-five immune related genes that are correlated with high MIF expression levels in a cohort of patients receiving anti-CTLA-4 therapy. Amongst the 195 identified genes, 160 genes were negatively correlated, while 35 genes were positively correlated (r score varying from −0.6 to 0.70) (Figure S3). We then performed a volcano plot analysis, to assess the relationship between the p-value of a statistical test of each gene in the cohort of patients receiving anti-CTLA-4 therapy versus the magnitude in expression value of the MIF represented by the fold change (log2 MIF expression). depicts a color grade corresponding to the variance from negative to positive fold change relative to MIF expression. Interestingly, our findings show modulation of multiple genes involved in innate and/or adoptive immune pathways (represented by black arrows), the arrowed genes include CD276 (B7-H3) which has been reported to promote tumor progression by inhibiting the function of CD8+ T cells and NK cells;Citation28 CTAGE1 which is a cutaneous-T-cell-lymphoma-specific tumor antigen found in melanoma,Citation29 MAGE-A4, a cancer-testes antigen which has previously been targeted in adoptive T cell therapy;Citation30 PIN1,a modulator of type-1 immune responses that increases production of pro-inflammatory cytokines including IFN-γ, IL-2 and CXCL-10;Citation31 and TLR9 which can act to promote DC maturation and to boost CTL responses against tumor antigensCitation32,Citation33 (). These results indicate that high MIF expression levels are correlated with an immune suppressive TME gene signature.
Figure 3. High MIF expression levels correlate with immunosuppressive networks in melanoma patients. (a) The RNA-seq MIF expression data from GDC TCGA melanoma patients who received anti-CTLA-4 therapy (https://xenabrowser.net/) (n = 26).Volcano plot depicting the most significant upregulated and downregulated immune genes, with high MIF expression levels. Several genes with immunosuppressive functions were identified. (b) MIF-suppressed immune networks in CTLA-4-resistant metastatic melanoma. Red dots represent immune suppression categories while green and blue dots represent immune activation categories and general immune categories respectively. Red thick, green thick and blue thick lines indicate immune suppression categories, immune activation categories and general immune categories, respectively. (c) Kaplan-Meier analysis correlating the T-cell dysfunctions with MIF expression levels in melanoma patients treated with anti-CTLA-4 therapy sorted from public TCGA TIDE (Tumor Immune Dysfunction and Exclusion) database (MIF high n = 10; MIF low n = 307). (d) Spearman´s correlation analysis between MIF expression levels and Treg markers (FOXP3 and IL2RA) were sorted from the TIMER (Tumor IMmune Estimation Resource) database using metastatic melanoma patient cohort (N = 368). MIF expression levels showed a significantly positive correlation with FOXP3 and IL2RA expression levels
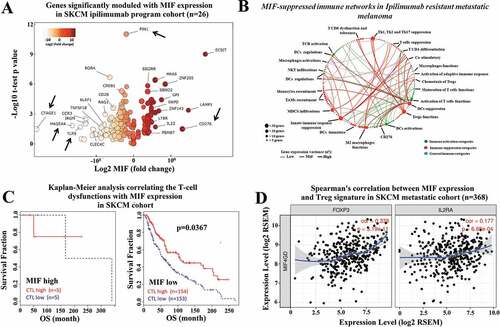
We then used network analysis, which was performed in the non-responding anti-CTLA-4 treated patients, to categorize immune genes following high MIF expression levels, that levels that demonstrated the highest correlation with immune suppression within the tumor microenvironment. All immune genes correlated with high MIF expression were simultaneously sorted in different subcategories of the immune response, which were used to build an interactive transcriptomic network for visualization of the predominant immune profile driven by SKCM with high MIF expression levels. We performed a gene immune response network analysis based on major immune categories subdivided as follows: immune activation categories (green marker); immune suppression categories (red marker); and general immune categories (blue marker) (). In this analysis, the variance of gene expression (σ2) is represented by the thickness of the connecting lines, indicating the plasticity of the network toward high MIF expression levels.
Our findings show that most of the modulated immune genes correlate with a dominance of immune-suppressive pathways, represented by red lines predominantly with high expression variance (thick lines), including Treg function, Th1 suppression, Th2 activation, T cell tolerance responses, dendritic cells suppression, M2 macrophages, and immune-checkpoint receptors (ICRs). Immune networks related to effective anti-tumor response are indicated by the green lines, and are predominantly associated with low-expression variance (thickness) (), whereas the immune suppressive networks are indicated by red lines, which are predominantly associated with high expression variance (thickness). Taken together these analyses indicate that high MIF expression in melanoma patients after anti-CTLA-4 therapy is correlated with the presence of a highly immunosuppressive environment.
We next expanded our analysis by interrogating the TIDE (Tumor Immune Dysfunction and Exclusion) and TIMER (Tumor IMmune Estimation Resource) data bases. Both are computational frameworks developed to evaluate the potential of tumor immune escape and the gene expression profiles in the cancer cells.Citation23,Citation34 First, we used TIMER to analyze the correlation between high MIF expression levels versus immune cell infiltration profiles (CD4, CD8 T cells and macrophages) in primary and metastatic melanoma patient cohorts. We found that in the metastatic patient cohort, the high MIF expression levels are negatively correlated with CD4 Teffector cells, CD8 T cells, and macrophage immune infiltration (Figure S4). By mining the TIDE database,Citation24 we found that there is an inverse correlation between MIF expression levels and cytotoxic T lymphocytes (CTL) infiltration. Our analysis revealed that low MIF expression associates with high CTL infiltration leading to a better survival response in the SKCM metastatic patient cohort (n = 317) (). Using the TIMER database, we attempted to correlate MIF expression and Treg markers (FoxP3 and IL2RA) and markers of a T cell exhaustion signature (HAVCR2, TIGIT, LAG3, PDCD1, CXCL13 and CTLA-4) in the metastatic melanoma patient cohort (n = 368). We observed that high MIF expression levels are positively correlated with FoxP3 and IL2RA expression levels (), and are also positively correlated with HAVCR2, TIGIT, LAG3, PDCD1, CXCL13, and CTLA-4 expression levels (Figure S5). Taken together, these results suggest that high MIF expression is correlated with inhibition of immune cell infiltration and may cause immune tolerance in the SKCM metastatic patient cohort.
Immune checkpoint-blockade therapy combined with 4-IPP enhances M1-like macrophage phenotype and decreases M2-like phenotype
Macrophages (MOs.) play a central role in modulating the immune response against cancer.Citation7 In melanoma, as well as in other solid tumors, pro-inflammatory M1 MOs are suppressed by tumor cells and lose their ability to trigger and support the immune response against cancer.Citation35,Citation36 In the TME, TAM commonly acquire an M2-like phenotype that abrogates the antitumor immune response and supports tumor development, metastasis, and resistance to therapies.Citation35–37 We investigated the M1/M2 MOs balance within the TME from our subcutaneous in vivo study, using TMT (anti-CTLA-4 sensitive) or 3I-F4 (anti-CTLA-4 resistant) in the syngeneic mouse melanoma model receiving either anti-CTLA-4 or anti-PD-L1 antibody alone or in combination with 4-IPP as described before (). Our findings show that anti-CTLA-4 antibody alone (indicated in blue bar) enhanced significantly M1-like (F4/80+iNOS+) MO phenotype infiltration only in TMT tumors ( and S6a), but not in 3I-F4 tumors ( and S6c). When we assessed the M2-like (F4/80+Arg1+) MO phenotype, we found a decrease of M2-like TAM infiltration only in the TMT tumors ( and S6b). Anti-CTLA-4 treatment alone did not modulate the M2-like phenotype in 3I-F4 tumors ( and S6d).
Figure 4. Immune-checkpoint blockade therapy, combined with 4-IPP, enhance M1-like macrophage and triggers antitumor effect. Subcutaneous tumors from TMT or 3I-F4 tumor cells were stained using anti-F4/80 and anti-iNOS as markers for the M1-like macrophage population while anti-F4/80, and anti-Arg.1 were used to identify the M2-like macrophage population. (a) Quantification of M1-like macrophages infiltration after treatment with anti-CTLA-4 alone or in combination with 4-IPP showed an increase in M1-like MO in TMT tumors; (b) Quantification analysis of anti-CTLA-4 alone had no effect on 3I-F4 tumors, whereas when combined with 4-IPP it induced an increase in M1-like macrophage infiltration in the TME. (c) Quantification of M2-like macrophages after anti-CTLA-4 therapy alone or combined with 4-IPP showed a decrease in M2-like macrophages in the TMT tumors. (d) Quantification of M2-like macrophages after treatment with anti-CTLA-4 alone showed no effect in 3I-F4 tumor cells, whereas the combination with 4-IPP significantly reduced the M2-like macrophage phenotype; (e, f) Quantification of M1-like macrophages after treatment with anti-PD-L1 therapy alone or combined with 4-IPP significantly increased the M1-like macrophage infiltration in both models (TMT) and (3I-F4) tumors. (g, h) Quantification of M2-like macrophage phenotype after treatment with anti-PD-L1 therapy alone or combined with 4-IPP showed a significant decrease of M2-like macrophage infiltration in both models (TMT) and (3I-F4) tumors; N = 5 mice per group; at least three fields assessed per sample. Graphs show quantification of positive F4/80+ Arg1+ or F4/80+ Arg.1 +. Error bars represent the mean ± SEM. *P < .05, **P < .01, and ***P < .001 using a two-tailed unpaired t-test
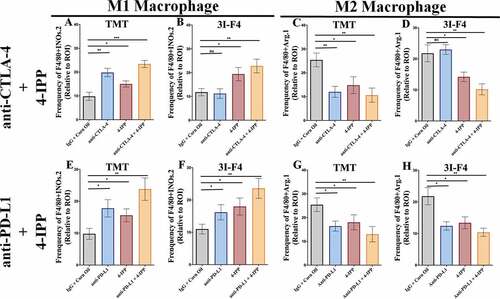
The M1-like and M2-like populations were then evaluated in animals treated with a combination of immune-checkpoint blockade and 4-IPP. The results showed that anti-CTLA-4 combined with 4-IPP (represented in brown bar) increased M1-like phenotype in both TMT ( and S6a) and 3I-F4 tumors ( and S6c). As expected, we also found that combination therapy decreased significantly the M2-like phenotype in both TMT ( and S6b) and 3I-F4 tumors ( and S6d).
The same analyses were performed in mice treated with anti-PD-L1 antibody alone (represented in blue bar) or combined with 4-IPP (represented in brown bar) therapy in TMT and 3I-F4 tumors (–h). We observed a significant increase of M1-like phenotype in both models of TMT ( and S6a), and 3I-F4 tumors ( and S6c). In addition, we found that a combination treatment of anti-PD-L1 with 4-IPP resulted in a decrease of M2-like phenotype in both melanoma models, TMT ( and S6b), and 3I-F4 ( and S6d). These findings suggest that the combination treatment of immune-checkpoint blockade and 4-IPP increased the M1-like macrophage population thus, providing critical innate immune support for an adaptive antitumor immune response in both checkpoint-sensitive and, more importantly, checkpoint-resistant melanoma cells.
MIF/CD74 axis inhibition combined with immune-checkpoint blockade therapy increase CD8+ TIL and triggers antitumor responses
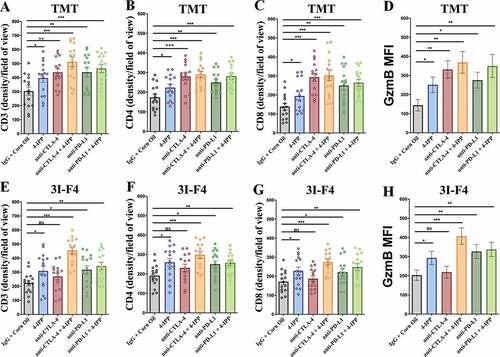
Previous data showed that patients with large number of TIL demonstrated a better response to immune-checkpoint blockade therapy. We therefore assessed the TIL in the subcutaneous model using TMT and 3I-F4 cells (). We found that CTLA-4 antibody alone (represented in red bar) significantly increased the CD3+ TIL ( and S7a), CD4 ( and S7b) and CD8+ T cells ( and S7c), as well as granzyme B expression ( and S7d) only in TMT, but not in the 3I-F4 tumor cells ( and S7e–h). Notably, we found that anti-CTLA-4 antibody combined with 4-IPP (represented in brown bar) significantly induced TILs in both models, showing increases in the CD3+, CD4+, and CD8+ infiltrates and granzyme B expression ( and S7a–h). The anti-PD-L1 antibody alone or combined with 4-IPP was able to increase TIL in both models, displaying enhanced CD3, CD4, CD8 infiltrates and granzyme B expression ( and S7a–h). Taken together, these findings suggest that combination treatment of immune-checkpoint blockade therapy with 4-IPP restored the adaptive immune response by increasing the CD8+ TIL frequency and triggering antitumorigenic functions in resistant melanoma tumors.
Figure 5. Immune-checkpoints blockade combined with MIF/CD74 axis inhibition enhance T-cell infiltration. TMT or 3I-F4 tumors were stained with anti-CD3+, anti-CD4+, anti-CD8+ cells and anti-Granzyme b. All quantifications were performed in mice treated with anti-CTLA-4 or anti-PD-L1 antibodies alone or in combination with 4-IPP. (a) Quantification of CD3 T-cells infiltration in TMT tumors; (b) Quantification of CD4 T-cells infiltration in TMT tumors; (c) Quantification of CD8 T-cells infiltration in TMT tumors; (d) Quantification of Granzyme b secretion in TMT tumor microenvironment. All quantifications showed that immune-checkpoint blockade antibodies alone or combined with 4-IPP induced an increase in T-cell infiltration in TMT tumor microenvironment. (e) Quantification of CD3 T-cells infiltration on 3I-F4 tumors; (f) Quantification of CD4 T-cells infiltration in 3I-F4 tumors; (g) Quantification of CD8 T-cells infiltration in 3I-F4 tumors; (h) Quantification of Granzyme b secretion in 3I-F4 tumor. All quantifications showed that anti-CTLA-4 alone did not induce T-cell infiltration, but when combined with 4-IPP a significant increased of T-cell infiltration in 3I-F4 tumors was observed. The anti-PD-L1 antibody alone or combined with 4-PP, significantly increased T-cell infiltration in 3I-F4 tumors; N = 5 mice per group; at least three fields assessed per sample. Graphs show quantification of positive CD3+, or CD4+, CD8+ T cells or gramzyme b. Error bars represent the mean ± SEM. *P < .05, **P < .01, and ***P < .001 using a two-tailed unpaired t-test
MIF/CD74 axis inhibition down-regulates the lactate metabolic pathway
We have previously reported that MIF is secreted by B16F10 melanoma cells and is highly expressed in lung metastatic lesions.Citation5 Here, we used an ELISA to measure the secretion of MIF in TMT and 3I-F4 cells. MIF expression was significant higher in resistant 3I-F4 cells than in the anti-CTLA-4 sensitive cells (). Moreover, gene expression profiling of parental cells vs 3I-F4 revealed that resistant cell lines showed increase of CD74, MIF4GD, CD274 (PD-L1), HIF-1α and LDHA expression levels as compared to the sensitive cell lines (Supplementary 8C).
Figure 6. MIF/CD74 axis inhibition down-regulates lactate production levels in vitro and in vivo. (a) Secretion of MIF under normoxia condition in the TMT and 3I-F4 tumor cell cultures incubated for 24 h, in ELISA kit. (b) Quantification of lactate concentration in media under normoxia condition from TMT and 3I-F4 tumor cells cultured for 24 hours using ELISA kit. (c) Quantification of lactate concentration in media under hypoxia condition in TMT and 3I-F4 tumor cells cultured for 24 hours using ELISA kit. (d) Quantification of lactate concentration in media under hypoxia condition in TMT cells treated with 100 µM of 4-IPP and incubated for 24 h, inELISA kit. (e) Quantification of lactate concentration in media under hypoxia condition in 3I-F4 cells treated with 100 µM of 4-IPP and incubated for 24 hours. (f) Western blotting analysis of HIF-1α expression in TMT or 3I-F4 cell lines after treatment with 100 µM of 4-IPP for 24 h under hypoxia condition. (g) PD-L1 expression analysis by Western blotting analysis in TMT or 3I-F4 cell lines after treatment with 100 µM of 4-IPP for 24 hours under hypoxia condition. All in vitro data represent three biologically independent experiments. (h) The Immunofluorescence (IF) staining was examined from the subcutaneous model using TMT tumor cells. Tissue samples were stained using anti-LDHA. Quantifications were performed in mice treated with anti-CTLA-4 or anti-PD-L1 alone or in combination with 4-IPP. (i) Quantification of LDHA expression was performed in the subcutaneous model using the 3I-F4 tumors; N = 5 mice per group; at least three fields were examined per sample. Graphs show quantification of positive LDHA expression. Error bars represent the mean ± SEM. *P < .05, **P < .01, and ***P < .001 using a two-tailed unpaired t-test
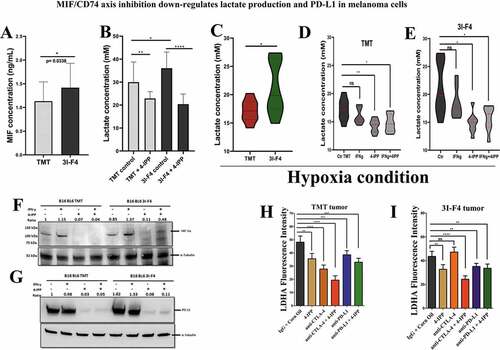
Most recently, several studies have pointed to the glycolytic metabolism as a key pathway involved in triggering immune suppression, and consequently, resistance to immunotherapy.Citation38,Citation39 Metabolic changes can be induced by rapidly dividing tumor cells, which exhibit complex and dynamic metabolic reprogramming and a high rate of glucose consumption.Citation39–41 This phenomenon is called the “Warburg effect” and is recognized as one of the hallmarks of cancer.Citation42,Citation43 A previous study has indicated that the “Warburg effect” can be triggered by the activation of the MIF/CD74 axis.Citation44 Based on this rationale, we performed an in vitro study to assess the lactate production generated by TMT and 3I-F4 cells after treatment with 4-IPP. We found that treatment of TMT or 3I-F4 with 4-IPP significantly decreased lactate production (). We also analyzed the amount of lactate production after MIF/CD74 axis inhibition under hypoxic conditions and we found that 3I-F4 cells secreted significantly more lactate than TMT cells (), and when treated with 4-IPP, both cell lines showed significantly reduced lactate production (,e).
A close correlation between glycolytic products, i.e. pyruvate, lactate, and HIF-1α expression levels has also been documented.Citation45 This study has reported on a feed-forward mechanism in which HIF-1α induces a glycolytic metabolic pathway with elevated pyruvate/lactate concentration, which in turn increases HIF-1α activity.Citation45 We therefore investigated if the MIF/CD74 axis inhibition, that reduces lactate production, would interfere with HIF-1α expression. A Western blotting analysis using TMT and 3I-F4 cells under hypoxic conditions showed that 4-IPP treatment significantly decreased HIF-1α expression in both cell lines (TMT) and (3I-F4) ().
HIF-1α is associated with immune resistance by directly regulating programmed cell death-1 protein (PD-L1) expression levels in multiple cancer types.Citation46 Moreover, recently, Imaoka et al.Citation9 showed that MIF/C74 axis inhibition can induce downregulation of PD-L1 expression in melanoma cells.Citation9 In addition, the MIF/CD74 axis was associated with increased HIF-1α expression levels, and was closely correlated with PD-L1 expression in tumor cells.Citation9 We therefore decided next to assess the PD-L1 expression levels in TMT and 3I-F4 cell lines under hypoxic condition after 4-IPP treatment. We found that 4-IPP significantly reduced the PD-L1 expression levels in both cell lines ().
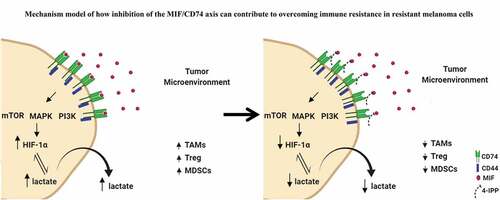
To validate our hypothesis that MIF/CD74 axis inhibition can modulate lactate production, we evaluated the Lactate Dehydrogenase A (LDHA) expression levels in the subcutaneous model as shown in . LDHA is responsible for the rapid conversion of pyruvate into lactate supporting the high glycolytic rates of cancer cells in which lactate is transported across the plasma membrane and accumulated in the extracellular space.Citation47 Our results showed that anti-CTLA-4 alone significantly reduced LDHA production only in TMT tumor cells ( and S8a) but did not reduce the LDHA production in 3I-F4 tumor cells ( and S8b). More importantly, combination treatment of anti-CTLA-4 with 4-IPP decreased the LDHA production in both tumor models (TMT) and (3I-F4) (,i and 8a,b). Also, the combination therapy resulted in a significant reduction in LDHA expression (,i and S8a,b). Lastly, we utilized TIMER (Tumor IMmune Estimation Resource), a public TCGA database, to evaluate the correlation between MIF and LDHA or CD274 (PD-L1) expression levels in the metastatic melanoma patients cohort (n =368). This analysis showed that MIF expression levels were positively correlated with both LDHA and CD274 expression levels (Supplementary 8D). Taken together, these results suggest that MIF/CD74 axis inhibition can reduce the lactate levels generated by the resistant cell line (3I-F4). Our findings support a mechanistic model () in which MIF/CD74 axis inhibition decreases HIF-1α and PD-L1 expression levels causing metabolic reprogramming of the TME, and, supporting restoration of sensitivity to immune checkpoint blockade.
Figure 7. Mechanistic model of how inhibition of the MIF-CD74 axis overcomes resistance of melanoma cells to immune checkpoint blockade. Inhibition of MIF signaling reduces HIF-1α expression levels in resistant cell line (3I-F4) causing reprogramming of the glycolytic pathway by reducing lactate production influencing the TME structure to increase the efficacy of ICB
Discussion
In previous studies, we have utilized an Ig-CDR-based peptide (C36L1) that binds directly to the MIF receptor (CD74) and blocks MIF-CD74 signaling. Blockade of MIF-CD74 signaling on macrophages and dendritic cells restored their anti-tumor immune activity against metastatic melanoma.Citation5 Other studies have also highlighted the role of MIF within the TME with an emphasis on the suppression of innate cells.Citation5,Citation9,Citation11,Citation16,Citation26,Citation48,Citation49 As MIF has been largely linked to immune suppression of innate immunity, the possibility of inhibiting the MIF-CD74 axis to act synergistically with checkpoint inhibitors is the subject of the current study.
Our TCGA analysis also confirmed that high MIF expression levels are associated with poor survival in the metastatic melanoma cohort and was associated with poor responses in patients receiving anti-CTLA-4 therapy. These findings and the previous reports confirmed that the high MIF expression in stage II melanoma is associated with tumor progression.Citation17 Immunosuppressive networks from TCGA analysis, in correlation with MIF expression, may not only influence the quality and quantity of local anti-tumor immune response, but also affect immunotherapy outcome using ICB, leading to regulation or exclusion of Teffector lymphocytes, and also to the alternative polarization of macrophages toward a tolerogenic phenotype in the TME. Our TCGA analysis detected several key immune biomarkers, such as CD276, ACTAGE1, MAGE-4, PIN1, and TLR9, which correlated with high MIF expression levels in melanoma patients treated with anti-CTLA-4 therapy.Citation29,Citation30,Citation32,Citation33,Citation50 These immune biomarkers are associated with innate immune suppressive pathways, suggesting that high MIF expression contributes to switching off the innate immune response contributing to immune resistance.
Pharmacologic blockade of MIF/CD74 interaction restores the TME immunogenic profile, as well as the effective anti-tumor immune response against metastatic melanoma and glioblastoma.Citation5,Citation51 The CD74 monoclonal blocking antibody milatuzumab is currently approved by the Food and Drug Administration (FDA) in the United States for the treatment of multiple myeloma, non-Hodgkin lymphomas, and other CD74 positive cancers.Citation52,Citation53 Also imalumab (Bax69), a novel recombinant monoclonal antibody that targets oxMIF, has been evaluated in a phase 1 clinical study in patients with advanced solid tumors.Citation54 Our current study combining immune-checkpoint blockade with MIF/CD74 axis inhibition to restore the immunogenic phenotype and to overcome immune resistance is, however, the first to be reported.
Combination therapy between immune-checkpoint blockade and MIF/CD74 axis inhibition has been evaluated by assessing tumor growth in a experimental lung metastatic model (,b), using TMT cells (sensitive to anti-CTLA-4 antibody) and 3I-F4 cells (completely resistant to anti-CTLA-4 antibody). To modulate innate immunity, we used 4-IPP, a small-molecule that covalently binds to the catalytically active NH2-terminal proline, and irreversibly prevents MIF from binding to its receptor CD74,Citation27 with and without immune checkpoint blockade. By utilizing such novel therapeutic approach, we were able to restore an effective immune response, mainly in resistant melanoma tumor cells (3I-F4), by increasing infiltration of M1 macrophages, along with CD3+, CD4+, CD8+ T cells and secretion of Granzyme B in the TME, thus, reducing tumor growth. These findings corroborate our TCGA data analysis demonstrating a positive correlation between MIF expression levels and FOXP3 and IL2RA (Treg signature genes),Citation55,Citation56 as well as the exhausted T-cell signature (HAVCR2, TIGIT, LAG3, PDCD1, CXCL13 and CTLA-4).Citation57,Citation58
Although the main focus of our work is to mobilize both innate and adaptive immunity with MIF/CD74 axis inhibition, we cannot rule out other pathways that can also contribute to restore the immunogenicity of the tumor. In this regard, we focused our attention on the close correlation between products generated from glycolytic metabolism and immune resistance.Citation38,Citation39,Citation59,Citation60 The “Warburg effect” was considered, as a hallmark of the tumor metabolism modulating the microenvironment promoting tumor progression and immune escape.Citation10,Citation40,Citation61 Previous work suggested that the Warburg phenomenon can be orchestrated via MIF/CD74 axis activation, by triggering a metabolic imbalance.Citation44 This is supported by our present observation that lactate production increased in CTLA-4-resistant 3I-F4 cells. In addition, the in vivo inhibition of the MIF/CD74 axis combined with immunotherapy modulated LDHA expression, an enzyme that catalyzes the conversion of pyruvate and L-lactate, suggesting a direct correlation between less lactate and the more effective therapeutic response.
Several metabolic pathways and factors can orchestrate the production of pyruvate and lactate. Hypoxia, induced in the course of progression by many solid tumors, is a key factor influencing this metabolic imbalance.Citation40,Citation61,Citation62 The cellular response to hypoxia is mainly mediated by the hypoxia-inducible factor (HIF) family of transcription factors, which regulate the expression of multiple genes,Citation63 including transcriptional induction of MIF expression.Citation62 Zhu et al.Citation62 showed that HIF-1α/MIF axis regulates the migration, differentiation and pro-angiogenic function of CD11b+Gr-1+ myeloid cells supporting tumor growth of head and neck squamous cell carcinoma (HNSCC).Citation62
In summary, we provide here the basis for the rationale to combine anti-CTLA-4 immune checkpoint blockade with inhibition of the MIF-CD74 axis. We provide evidence that inhibition of the MIF-CD74 axis resulted in the activation of innate immunity and reprogramming of tumor metabolism and reduced PD-L1 expression in melanoma cells (). Thus, our findings show that targeting the MIF/CD74 axis could provide a new strategy for overcoming resistance to immune checkpoint blockade therapy in melanoma.
Disclosure of potential conflicts of interest
The authors declare no potential conflicts of interest.
Authors’ contributions
Conception and design: RAA, ES, and MBE;
Analysis and interpretation of data: RAA, SW, MBE;
Microarray conception, design and analysis: ARJ, AL, MAC;
PD-1 TCGA analysis conception and design: GM.
Writing, review, and/or revision of manuscript: RAA, ES, SW, MAC, GM, LRT, MBE.
Study supervision: LRT and MBE
Supplemental Material
Download ()Acknowledgments
We thank the funding from the FAPESP (Grants numbers: 2017/09393-6 and 2018/18385-0).
Supplementary material
Supplemental data for this article can be accessed on the publisher’s website.
Additional information
Funding
References
- Balkwill FR, Capasso M, Hagemann T. The tumor microenvironment at a glance. The Company of Biologists Ltd; 2012;125(23):5591–5596.
- Hanahan D, Weinberg RA. Hallmarks of cancer: the next generation. Cell. 2011;144(5):646–13. doi:10.1016/j.cell.2011.02.013.
- Vinay DS, Ryan EP, Pawelec G, Talib WH, Stagg J, Elkord E, Lichtor T, Decker WK, Whelan RL, Kumara HMCS, editors. Immune evasion in cancer: mechanistic basis and therapeutic strategies. Semin Cancer Biol. 2015;35:S185–S198. Elsevier. doi:10.1016/j.semcancer.2015.03.004.
- Binnewies M, Roberts EW, Kersten K, Chan V, Fearon DF, Merad M, Coussens LM, Gabrilovich DI, Ostrand-Rosenberg S, Hedrick CC. Understanding the tumor immune microenvironment (TIME) for effective therapy. Nat Med. 2018;24(5):541–550. doi:10.1038/s41591-018-0014-x.
- Figueiredo C, Azevedo R, Mousdell S, Resende-Lara P, Ireland L, Santos A, Girola N, Cunha RL, Schmid, MC, Polonelli L, et al. Blockade of MIF-CD74 signalling on macrophages and dendritic cells restores the anti-tumour immune response against metastatic melanoma. Front Immunol. 2018;9:1132. doi:10.3389/fimmu.2018.01132.
- Yaddanapudi K, Putty K, Rendon B, Lamont G, Faughn J, Mitchell R. Control of tumor-associated macrophage alternative activation by MIF. AACR; 2013190(6):2984–2993.
- Kindt N, Journe F, Laurent G, Saussez S. Involvement of macrophage migration inhibitory factor in cancer and novel therapeutic targets. Oncol Lett. 2016;12(4):2247–2253. doi:10.3892/ol.2016.4929.
- Wang X, Chen T, Leng L, Fan J, Cao K, Duan Z, Zhang X, Shao C, Wu M, Tadmori I. MIF produced by bone marrow-derived macrophages contributes to teratoma progression after embryonic stem cell transplantation. Cancer Res. 2012;72(11):2867–2878. doi:10.1158/0008-5472.CAN-11-3247.
- Imaoka M, Tanese K, Masugi Y, Hayashi M, Sakamoto M. Macrophage migration inhibitory factor‐CD74 interaction regulates the expression of programmed cell death ligand 1 in melanoma cells. Cancer Sci. 2019;110(7):2273. doi:10.1111/cas.14038.
- Romero-Garcia S, Moreno-Altamirano MMB, Prado-Garcia H, Sánchez-García FJ. Lactate contribution to the tumor microenvironment: mechanisms, effects on immune cells and therapeutic relevance. Front Immunol. 2016;7:52. doi:10.3389/fimmu.2016.00052.
- Tanese K, Hashimoto Y, Berkova Z, Wang Y, Samaniego F, Lee JE, Ekmekcioglu S, Grimm EA. Cell surface CD74–MIF interactions drive melanoma survival in response to interferon-γ. J Invest Dermatol. 2015;135(11):2775–2784. doi:10.1038/jid.2015.204.
- Gil-Yarom N, Radomir L, Sever L, Kramer MP, Lewinsky H, Bornstein C, Blecher-Gonen R, Barnett-Itzhaki Z, Mirkin V, Friedlander G. CD74 is a novel transcription regulator. Proc Natl Acad Sci. 2017;114(3):562–567. doi:10.1073/pnas.1612195114.
- Chesney JA, Mitchell RA, Yaddanapudi K. Myeloid‐derived suppressor cells—a new therapeutic target to overcome resistance to cancer immunotherapy. J Leukoc Biol. 2017;102:727–740.
- Choi S, Kim H-R, Leng L, Kang I, Jorgensen WL, Cho C-S, Bucala R, Kim W-U. Role of macrophage migration inhibitory factor in the regulatory T cell response of tumor-bearing mice. J Immunol. 2012;189(8):3905–3913. doi:10.4049/jimmunol.1102152.
- Abe R, Peng T, Sailors J, Bucala R, Metz CN. Regulation of the CTL response by macrophage migration inhibitory factor. J Immunol. 2001;166(2):747–753. doi:10.4049/jimmunol.166.2.747.
- Yaddanapudi K, Rendon BE, Lamont G, Kim EJ, Al Rayyan N, Richie J, Albeituni S, Waigel S, Wise A, Mitchell RA. MIF is necessary for late-stage melanoma patient MDSC immune suppression and differentiation. Cancer Immunol Res. 2016;4(2):101–112. doi:10.1158/2326-6066.CIR-15-0070-T.
- Ekmekcioglu S, Davies MA, Tanese K, Roszik J, Shin-Sim M, Bassett RL, Milton DR, Woodman SE, Prieto VG, Gershenwald JE. Inflammatory marker testing identifies CD74 expression in melanoma tumor cells, and its expression associates with favorable survival for stage III melanoma. Clin Cancer Res. 2016;22(12):3016–3024. doi:10.1158/1078-0432.CCR-15-2226.
- Schoenfeld J, Jinushi M, Nakazaki Y, Wiener D, Park J, Soiffer R, Neuberg D, Mihm M, Hodi FS, Dranoff G. Active immunotherapy induces antibody responses that target tumor angiogenesis. Cancer Res. 2010;70(24):10150–10160. doi:10.1158/0008-5472.CAN-10-1852.
- Postow MA, Chesney J, Pavlick AC, Robert C, Grossmann K, McDermott D, Linette GP, Meyer N, Giguere JK, Agarwala SS. Nivolumab and ipilimumab versus ipilimumab in untreated melanoma. N Engl J Med. 2015;372(21):2006–2017. doi:10.1056/NEJMoa1414428.
- Ireland L, Santos A, Ahmed MS, Rainer C, Nielsen SR, Quaranta V, Weyer-Czernilofsky U, Engle DD, Perez-Mancera PA, Coupland SE. Chemoresistance in pancreatic cancer is driven by stroma-derived insulin-like growth factors. Cancer Res. 2016;76(23):6851–6863. doi:10.1158/0008-5472.CAN-16-1201.
- Cline MS, Craft B, Swatloski T, Goldman M, Ma S, Haussler D, Zhu J. Exploring TCGA pan-cancer data at the UCSC cancer genomics browser. Sci Rep. 2013;3(1):2652. doi:10.1038/srep02652.
- Tang Z, Li C, Kang B, Gao G, Li C, Zhang Z. GEPIA: a web server for cancer and normal gene expression profiling and interactive analyses. Nucleic Acids Res. 2017;45(W1):W98–W102. doi:10.1093/nar/gkx247.
- Li T, Fan J, Wang B, Traugh N, Chen Q, Liu JS, Li B, Liu XS. TIMER: a web server for comprehensive analysis of tumor-infiltrating immune cells. Cancer Res. 2017;77(21):e108–e10. doi:10.1158/0008-5472.CAN-17-0307.
- Fu J, Li K, Zhang W, Wan C, Zhang J, Jiang P, Liu XS. Large-scale public data reuse to model immunotherapy response and resistance. Genome Med. 2020;12(1):1–8. doi:10.1186/s13073-020-0721-z.
- Jaiswal AR, Liu AJ, Pudakalakatti S, Dutta P, Jayaprakash P, Bartkowiak T, Ager CR, Wang Z-Q, Reuben A, Cooper ZA. Melanoma evolves complete immunotherapy resistance through the acquisition of a hypermetabolic phenotype. Cancer Immunol Res. 2020;8(11):1365–1380. doi:10.1158/2326-6066.CIR-19-0005.
- Wang Z-Q, Milne K, Webb JR, Watson PH. CD74 and intratumoral immune response in breast cancer. Oncotarget. 2017;8(8):12664. doi:10.18632/oncotarget.8610.
- Xu L, Li Y, Sun H, Zhen X, Qiao C, Tian S, Hou T. Current developments of macrophage migration inhibitory factor (MIF) inhibitors. Drug Discov Today. 2013;18(11–12):592–600. doi:10.1016/j.drudis.2012.12.013.
- Cai D, Li J, Liu D, Hong S, Qiao Q, Sun Q, Xie S, Guo L. Tumor-expressed B7-H3 mediates the inhibition of antitumor T-cell functions in ovarian cancer insensitive to PD-1 blockade therapy. Cell Mol Immunol. 201917(3):227–236.
- Koch J, Dübel S, Usener D, Schadendorf D, Eichmüller S. cTAGE: a cutaneous T cell lymphoma associated antigen family with tumor-specific splicing. J Invest Dermatol. 2003;121(1):198–206. doi:10.1046/j.1523-1747.2003.12318.x.
- Zajac P, Schultz-Thater E, Tornillo L, Sadowski C, Trella E, Mengus C, Iezzi G, Spagnoli GC. MAGE-A antigens and cancer immunotherapy. Front Med. 2017;4:18. doi:10.3389/fmed.2017.00018.
- Tun-Kyi A, Finn G, Greenwood A, Nowak M, Lee TH, Asara JM, Tsokos GC, Fitzgerald K, Israel E, Li X. Essential role for the prolyl isomerase Pin1 in Toll-like receptor signaling and type I interferon–mediated immunity. Nat Immunol. 2011;12(8):733. doi:10.1038/ni.2069.
- Urban-Wojciuk Z, Khan MM, Oyler BL, Fåhraeus R, Marek-Trzonkowska NM, Nita-Lazar A, Hupp TR, Goodlett DR. The role of TLRs in anti-cancer immunity and tumor rejection. Front Immunol. 2019;10:2388. doi:10.3389/fimmu.2019.02388.
- Krieg AM. Development of TLR9 agonists for cancer therapy. J Clin Invest. 2007;117(5):1184–1194. doi:10.1172/JCI31414.
- Jiang P, Gu S, Pan D, Fu J, Sahu A, Hu X, Li Z, Traugh N, Bu X, Li B, et al. Signatures of T cell dysfunction and exclusion predict cancer immunotherapy response. Nat Med. 2018Oct;24(10):1550–1558.
- Noy R, Pollard JW. Tumor-associated macrophages: from mechanisms to therapy. Immunity. 2014;41(1):49–61. doi:10.1016/j.immuni.2014.06.010.
- Schmidt SV, Nino-Castro AC, Schultze JL. Regulatory dendritic cells: there is more than just immune activation. Front Immunol. 2012;3:274. doi:10.3389/fimmu.2012.00274.
- Nielsen SR, Quaranta V, Linford A, Emeagi P, Rainer C, Santos A, Ireland L, Sakai T, Sakai K, Kim Y-S. Macrophage-secreted granulin supports pancreatic cancer metastasis by inducing liver fibrosis. Nat Cell Biol. 2016;18(5):549. doi:10.1038/ncb3340.
- Biswas SK. Metabolic reprogramming of immune cells in cancer progression. Immunity. 2015;43(3):435–449. doi:10.1016/j.immuni.2015.09.001.
- Cairns RA, Mak TW. Fire and water: tumor cell adaptation to metabolic conditions. Exp Cell Res. 2017;356(2):204–208. doi:10.1016/j.yexcr.2017.04.029.
- Kareva I, Hahnfeldt P. The emerging “hallmarks” of metabolic reprogramming and immune evasion: distinct or linked? Cancer Res. 2013;73(9):2737–2742. doi:10.1158/0008-5472.CAN-12-3696.
- Harel M, Ortenberg R, Varanasi SK, Mangalhara KC, Mardamshina M, Markovits E, Baruch EN, Tripple V, Arama-Chayoth M, Greenberg E. Proteomics of melanoma response to immunotherapy reveals mitochondrial dependence. Cell. 2019;179(1):236–50.e18. doi:10.1016/j.cell.2019.08.012.
- Warburg O. On the origin of cancer cells. Science. 1956;123(3191):309–314. doi:10.1126/science.123.3191.309.
- Paudel BB, Quaranta V. Metabolic plasticity meets gene regulation. Proc Natl Acad Sci. 2019;116(9):3370–3372. doi:10.1073/pnas.1900169116.
- Li J, Zhang J, Xie F, Peng J, Wu X. Macrophage migration inhibitory factor promotes Warburg effect via activation of the NF‑κB/HIF‑1α pathway in lung cancer. Int J Mol Med. 2018;41:1062–1068.
- Meijer TW, Kaanders JH, Span PN, Bussink J. Targeting hypoxia, HIF-1, and tumor glucose metabolism to improve radiotherapy efficacy. AACR; 2012 Oct 15;18(20):5585–5594.
- Wang Y, Wang H, Yao H, Li C, Fang J-Y J-Y, Xu J. Regulation of PD-L1: emerging routes for targeting tumor immune evasion. Front Pharmacol. 2018;9:536. doi:10.3389/fphar.2018.00536.
- San-Millán I, Brooks GA. Reexamining cancer metabolism: lactate production for carcinogenesis could be the purpose and explanation of the Warburg effect. Carcinogenesis. 2017;38:119–133.
- Simpson KD, Templeton DJ, Cross JV. Macrophage migration inhibitory factor promotes tumor growth and metastasis by inducing myeloid-derived suppressor cells in the tumor microenvironment. J Immunol. 2012;189(12):5533–5540. doi:10.4049/jimmunol.1201161.
- Waigel S, Rendon BE, Lamont G, Richie J, Mitchell RA, Yaddanapudi K. MIF inhibition reverts the gene expression profile of human melanoma cell line-induced MDSCs to normal monocytes. Genomics Data. 2016;7:240–242.
- Esnault S, Braun RK, Shen Z-J, Xiang Z, Heninger E, Love RB, Sandor M, Malter JS. Pin1 modulates the type 1 immune response. PLoS One. 2007;2:2. doi:10.1371/journal.pone.0000226.
- Mangano K, Mazzon E, Basile MS, Di Marco R, Bramanti P, Mammana S, Petralia MC, Fagone P, Nicoletti F. Pathogenic role for macrophage migration inhibitory factor in glioblastoma and its targeting with specific inhibitors as novel tailored therapeutic approach. Oncotarget. 2018;9:17951.
- Govindan SV, Cardillo TM, Sharkey RM, Tat F, Gold DV, Goldenberg DM. Milatuzumab–SN-38 conjugates for the treatment of CD74+ cancers. Mol Cancer Ther. 2013;12(6):968–978. doi:10.1158/1535-7163.MCT-12-1170.
- Kaufman JL, Niesvizky R, Stadtmauer EA, Chanan‐Khan A, Siegel D, Horne H, Wegener WA, Goldenberg DM. Phase I, multicentre, dose‐escalation trial of monotherapy with milatuzumab (humanized anti‐CD 74 monoclonal antibody) in relapsed or refractory multiple myeloma. Br J Haematol. 2013;163(4):478–486. doi:10.1111/bjh.12565.
- Mahalingam D, Patel M, Sachdev J, Hart L, Halama N, Ramanathan R, Sarantopoulos J, Liu X, Yazji S, Jäger D. Anti-oxidized macrophage migration inhibitory factor (oxMIF) antibody imalumab (BAX69) in advanced solid tumors: final results of first-in-human phase 1 study. Ann Oncol. 2016;27(suppl_6):vi116. doi:10.1093/annonc/mdw368.08.
- Fu W, Ergun A, Lu T, Hill JA, Haxhinasto S, Fassett MS, Gazit R, Adoro S, Glimcher L, Chan S, et al. A multiply redundant genetic switch’locks in’the transcriptional signature of regulatory T cells. Nat Immunol. 2012;13:972.
- Fontenot JD, Rasmussen JP, Gavin MA, Rudensky AY. A function for interleukin 2 in Foxp3-expressing regulatory T cells. Nat Immunol. 2005;6(11):1142–1151. doi:10.1038/ni1263.
- Sade-Feldman M, Yizhak K, Bjorgaard SL, Ray JP, de Boer CG, Jenkins RW, Lieb DJ, Chen JH, Frederick DT, Barzily-Rokni M, et al. Defining T cell states associated with response to checkpoint immunotherapy in melanoma. Cell. 2018;175:998–1013.e20.
- Wherry EJ, Ha S-J, Kaech SM, Haining WN, Sarkar S, Kalia V, Subramaniam S, Blattman JN, Barber DL, Ahmed R. Molecular signature of CD8+ T cell exhaustion during chronic viral infection. Immunity. 2007;27(4):670–684. doi:10.1016/j.immuni.2007.09.006.
- Ramapriyan R, Caetano MS, Barsoumian HB, Mafra ACP, Zambalde EP, Menon H, Tsouko E, Welsh JW, Cortez MA. Altered cancer metabolism in mechanisms of immunotherapy resistance. Pharmacol Ther. 2019;195:162–171. doi:10.1016/j.pharmthera.2018.11.004.
- Doherty JR, Cleveland JL. Targeting lactate metabolism for cancer therapeutics. J Clin Invest. 2013;123(9):3685–3692. doi:10.1172/JCI69741.
- Spencer NY, Stanton RC, editors. The Warburg effect, lactate, and nearly a century of trying to cure cancer. Semin Nephrol. 2019;39(4):380–393. Elsevier. doi:10.1016/j.semnephrol.2019.04.007.
- Zhu G, Tang Y, Geng N, Zheng M, Jiang J, Li L, Li K, Lei Z, Chen W, Fan Y. HIF-α/MIF and NF-κB/IL-6 axes contribute to the recruitment of CD11b+Gr-1+ myeloid cells in hypoxic microenvironment of HNSCC. Neoplasia (New York, NY). 2014;16(2):168. doi:10.1593/neo.132034.
- Wigerup C, Påhlman S, Bexell D. Therapeutic targeting of hypoxia and hypoxia-inducible factors in cancer. Pharmacol Ther. 2016;164:152–169. doi:10.1016/j.pharmthera.2016.04.009.