
ABSTRACT
Nuclear factor of activated T cells 3 (NFATc3) has been reported to upregulate type I interferons (IFNs) expression, and the abnormal expression and activation of NFATc3 were closely related to tumorigenesis. However, the potential function of NFATc3 in hepatitis B virus (HBV)-related hepatocellular carcinoma (HCC) remains to be elucidated. In this study, we found that NFATc3 gene was frequently deleted and downregulated in HCC tumor tissues, and that the downregulation of NFATc3 was associated with poor prognosis of HCC patients. The gain- and loss-of-function experiments demonstrated that NFATc3 inhibited HCC cell proliferation and invasion, as well as HBV replication. Mechanistically, NFATc3 could bind to the promoters of IFNL1 and IFNB1 genes and prompt the production of IFNs and interferon-stimulated genes. Furthermore, retinoic acid-inducible gene-I (RIG-I) pathway activation increased NFATc3 expression and nuclear localization, and activated NFATc3 further enhanced RIG-I-mediated IFN responses. Collectively, our findings reveal a novel regulatory signaling cascade, the RIG-I/NFATc3/IFNs axis, which inhibits hepatocarcinogenesis and HBV replication by enhancing the immune response in hepatocytes, and this functional axis might potentially be exploited for therapeutic benefits in the clinical treatment of HBV-related HCC.
1. Introduction
Chronic hepatitis B caused by hepatitis B virus (HBV) infection is the leading cause of cirrhosis and hepatocellular carcinoma (HCC).Citation1 Despite the existence of effective prophylactic vaccine, approximately 257 million people worldwide are living with chronic HBV infection and high risk of developing cirrhosis and HCC.Citation2 It is recognized that accumulation of genetic damage due to immune-mediated hepatic inflammation was involved in HCC development.Citation3 However, the complex and multifactorial pathogenic mechanisms underlying the development of HBV-related HCC are still poorly understood.
The nuclear factor of activated T cells (NFAT) family is a group of calcium/calcineurin-dependent transcription factors which is originally identified as mediators for activation of cytokine genes in T cells during immune response.Citation4 More than three decades after the discovery, the NFAT proteins are found to be expressed in many kinds of cells other than immune cells and play critical roles during and after embryonic development, including inflammatory response, cardiac valve formation, myocardial development and other biological processes.Citation5 The NFAT family has four typical members, including NFATc1, NFATc2, NFATc3 and NFATc4. Accumulating evidences has indicated that the abnormal expression of NFAT proteins was involved in the development and progression of cancers.Citation6 However, different NFAT proteins appeared to have distinct roles in the development of cancers.
NFATc3 is a member of NFAT family which has been shown to have either pro-tumor or anti-tumor effects, depending on the physiologic and cellular context. For example, T cell lymphoma and breast cancer were more frequently observed in Nfatc3 deficient mice, which suggested that NFATc3 appeared to have anti-tumor potential in these two cancers.Citation7,Citation8 While in oral/oropharyngeal squamous cell carcinomas, NFATc3 expression and activation promoted tumor development.Citation9,Citation10 However, the expression status and function of NFATc3 in hepatocarcinogenesis remain largely unknown.
The human interferon (IFN) response is a key innate immune mechanism to fight virus infection and tumor development. IFNs are a group of signaling proteins released by host cells in response to the presence of viruses, bacteria, parasites and tumor cells.Citation11 After binding to receptors, IFNs activate downstream JAK-STAT pathways and induce hundreds of interferon-stimulated genes (ISGs) to exert anti-tumor and anti-virus function. Among IFNs, type I IFNs are representative cytokines of host innate immune response, which have been used in clinical treatment for HBV infection and HCC.Citation12,Citation13 Type III IFNs (also called IFN-λ) are predominantly expressed in hepatocytes which also exert significant anti-viral activity and extensive anti-tumor function in various types of cancers including HCC.Citation14,Citation15 Recently, NFATc3 has been found to positively regulate type I IFNs production and enhance interferon regulate factor 7 (IRF7)-mediated IFN response in plasmacytoid dendritic cells (pDCs), Citation16 while in hepatocytes, IRF7 is mainly involved in retinoic acid-inducible gene-I (RIG-I)/mitochondrial antiviral protein (MAVS) pathway.Citation17 In hepatocytes, whether NFATc3 plays a role in RIG-I/MAVS-mediated innate immunity and regulates the expression of IFNs, especially IFN-λs, remains to be elucidated.
In the present study, we aim to explore the role of NFATc3 in the regulation of HBV replication and HCC development. We found that NFATc3 expression was downregulated in HCC tissues caused by gene copy deletion. Interestingly, we identified that NFATc3 functions as a downstream transcription factor of RIG-I-MAVS-IRF7 pathway to upregulate IFNL1 and IFNB1 expression in hepatocytes, thereby inhibiting oncogenic properties of HCC cells as well as HBV replication. Thus, our findings provide new insights into the function and mechanism of NFATc3 in hepatocarcinogenesis.
2. Materials and methods
2.1. Clinical samples and patient information.
Seventy-five pairs of frozen HCC samples were collected from the Affiliated Cancer Hospital of Zhengzhou University from 2009 to 2012. All HCC tissues were histopathologically confirmed with primary HCC criteria and showed cirrhosis of varying degrees. All cases were hepatitis B surface antigen (HBsAg) positive, with elevated or normal levels of alanine aminotransferase (ALT), and ranged in age from 28 to 75 years old. The clinicopathological characteristics of patients including gender, age, Barcelona Clinic Liver Cancer (BCLC) stage, tumor size and number, capsule, intrahepatic metastasis, portal venous thrombus, and alpha-fetoprotein (AFP) levels were shown in Supplementary Table S1. Seven normal liver tissues were obtained from healthy liver donors. The study protocol was approved by the Ethics Committee of Peking University Health Science Center. Informed consent was obtained from each participant.
2.2. Databases
The gene sequence information was obtained from National Center for Biotechnology Information (NCBI) database (https://www.ncbi.nlm.nih.gov/). The Cancer Genome Atlas (TCGA) data were downloaded from MEXPRESS (https://mexpress.be) and cBioPortal for Cancer Genomics (http://www.cbioportal.org/) websites for further analysis.Citation18–20 The genomic profiles included DNA methylation, copy-number alteration (CNA) and mutation from GISTIC and mRNA expression z-scores (RNA Seq V2 RSEM). The GSE83148 data were downloaded from Gene Expression Omnibus (GEO) (http://www.ncbi.nlm.gov/geo/).Citation21 The prognostic value of gene mRNA expression in TCGA was evaluated using an online database, Kaplan-Meier Plotter (www.kmplot.com).Citation22 To analyze the overall survival (OS) of HCC patients, samples were split into two groups by best cutoff (high vs. low expression) and assessed by a Kaplan-Meier survival plot, with the hazard ratio (HR) of 95% confidence intervals (CI) and log-rank p value.
2.3. Cell lines
HEK293T, Hep3B, SMMC7721, SNU449, SK-Hep1, Huh7, HepG2 and 2fTGH cells were maintained in DMEM supplemented with 10% fetal bovine serum, 100 U/mL penicillin, 100 µg/mL streptomycin and 5% CO2. For HepAD38 cells, the media were additionally supplemented with 400 µg/mL G418 sulfate (InvivoGen).Citation23 HEK293T, Hep3B, SNU449, SK-Hep1, Huh7 and HepG2 cells were purchased from the American Type Culture Collection (Manassas, VA, USA). Human HCC cell line SMMC7721 was purchased from Cell Resources Center of Peking Union Medical College (Beijing, P.R. China), and the origin of SMMC7721 has been proved with STR, hepatic gene expression and specific gene mutations.Citation24 2fTGH-ISRE cells were provided by Professor Fuping You (Peking University, Beijing, China).Citation25
2.4. Plasmids and transfection
HBV expression plasmid contains 1.2 × C type HBV genome was constructed with pBlueBac4.5 vector which can only replicate in prokaryotic cells. The prcccDNA and pCMV-Cre plasmids were gifts from Professor Qiang Deng (Fudan University, Shanghai, China) Citation26 NFATc3 cDNA clone (Origene) was constructed into pcDNA3.1/V5-His vector, which can express wild-type NFATc3 protein with His-tag in C terminal. NFATc3 cDNA clone was also constructed into pLEX-MCS vector, which can express NFATc3 wild-type protein with Flag-tag in C terminal. Luciferase plasmids containing IFNB1 promoter and interferon-stimulated response element (ISRE), constructed into PGL3-basic vector, were gifts from Professor Jianhua Yang (Baylor College of Medicine, Houston, TX, USA).Citation27 IFNL1 promoter (region: −986 to −1) was cloned into pGL3-Basic vector (Promega, US). NFATc3 binding sites on IFNB1 and IFNL1 promoters were mutated by the site-directed mutagenesis method (Takara, PrimerSTAR Max DNA Polymerase, Japan) with the constructs encoding wild-type IFNB1-Luc and IFNL1-Luc as the template. Expressing plasmids of IRF3, IRF7 and MAVS were gifts from Professor Fuping You (Peking University, Beijing, China).Citation28 All vectors were transfected into cells using lipofectamine 2000 (Invitrogen, Carlsbad, CA).
2.5. Sendai virus infection
The Sendai virus (SeV) was provided by Professor Fuping YouCitation28 and kept at −80°C. After thawing, the virus was added into the cultural supernatant, and cells were harvested after 24–36 hours.
2.6. IFN pathway blocking
Recombinant orthopoxviral immunomodulatory proteins (B18R, Ebioscience, US) were added into the cultural supernatant with a final concentration of 200 ng/mL, the supernatant and cells were harvested after 24–120 hours.
2.7. CCK-8 assay
A total of 1 × 10⁴ cells were seeded in 96-well plates with six duplications, and then CCK-8 assay (Beyotime, CN) was carried out to assess cell viability through measuring the absorbance at the wavelength of 450 nm by the TECAN infinite M200 Multimode microplate reader (Tecan, Mechelen, Belgium).
2.8. Transwell assay
Transwell assay was conducted to measure the ability of cell migration. Around 100 μL serum-free medium containing cells (1 × 10⁶ cells/mL) were planted into the upper chamber with a pore size of 8 μm (Corning, Corning, NY, US), meanwhile, 800 μL medium containing 10% FBS was added in the lower chamber. After 48 hours, migrated cells were fixed with paraformaldehyde and stained with crystal violet (Beyotime, CN), then counted with Image‐pro Plus 6.0 software under 40× magnification (five views per well). The experiments were performed in triplicate and repeated 3 times.
2.9. Wound healing assay
Cells were seeded in the 6-well plates. After 12 hours, the cell monolayer was scratched with a sterile 10 μL pipette tip to generate a line-shaped wound. Then the cells were cultured in DMEM without FBS. Forty-eight hours later, images of the scratches were acquired with a digital camera. The scratch areas were quantified using Image‐pro Plus 6.0 software. The experiments were performed in triplicate and repeated 3 times.
2.10. Dual luciferase reporter assay
Cells were seeded in 24-well plates, then transfected with the IFNB1-Luc or IFNL1-Luc plasmids together with pRL-TK renilla vector (Promega, US). Thirty-six hours after transfection, cells were lysed and luciferase activity was detected with a dual-luciferase reporter assay kit (Promega, US). The two fTGH-ISRE luciferase assay was performed as previously described.Citation25 The experiments were performed in triplicate and repeated 3 times.
2.11. Quantitative real-time PCR
Total RNAs were extracted from the cells or tissues using TRIzol® Reagent according to the manufacturer’s instructions (Invitrogen) and genomic DNA was removed using DNase I (TaKara). The reverse transcription of total RNA to cDNA was performed with Thremo RT supermix kit. Quantitative Real-time PCR (qRT-PCR) was performed using the ABI StepOnePlus Real-time PCR Detection System (Applied Biosystems, US) with an SYBR green fluorescence system. The primers used in this study are provided in Supplementary Table S3, using CTBP as internal control gene for hepatoma cells and GAPDH for HEK293T. The experiments were performed in triplicate and repeated 3 times.
2.12. RNA-sequencing and data analysis
SeV-infected WT and NFATc3-KO SMMC7721 cells were sent to Majorbio-Tech for sequencing. The transcriptome library was prepared following TruSeqTM RNA sample preparation Kit from Illumina (San Diego, CA) using 1 μg of total RNA. Firstly, messenger RNA was isolated according to polyA selection method by oligo (dT) beads and then fragmented by fragmentation buffer firstly. Secondly, double-stranded cDNA was synthesized using a SuperScript double-stranded cDNA synthesis kit (Invitrogen, CA) with random hexamer primers (Illumina). Then the synthesized cDNA was subjected to end-repair, phosphorylation and ‘A’ base addition according to Illumina’s library construction protocol. Libraries were size selected for cDNA target fragments of 200–300 bp on 2% Low Range Ultra Agarose followed by PCR amplified using Phusion DNA polymerase (NEB) for 15 PCR cycles. After quantified by TBS380, paired-end RNA-seq sequencing library was sequenced with the Illumina HiSeq xten/NovaSeq 6000 sequencer (2 × 150 bp read length), and the data were analyzed on the free online platform of Majorbio Cloud Platform (www.majorbio.com).
2.13. Methylation-specific restrictive enzyme-based quantitative PCR (MSRE-qPCR)
MSRE-qPCR was performed as described, Citation29 and designed primers were as follows:
NFATc3 methy forward:5’-AGGCCCTGCCCATTGGGGTTCGCT-3ʹ;
NFATc3 methy reverse:5’-TTCGCCCCGGTGGCTGCGCCT-3ʹ.
2.14. CRISPR/Cas9 strategy
SMMC7721 cells were transduced with double Px458-Cas9 plasmids containing guide RNA targeting NFATc3 gene, and then Cas9 expressing cells were selected and clonal expanded. The knockout efficiency was determined by immunoblotting. The sequences of the two guide RNA targeting NFATc3 gene were as follows:
First (sense), 5ʹ-CCGATGACTACTGCAAACTG-3ʹ;
Second (sense), 5ʹ-CGCCGCCGCCCCCGGGCTCG-3ʹ.
2.15. Chromatin immunoprecipitation assay
HEK293T cells were fixed, lysed, and sonicated. Precleared lysates were incubated overnight at 4°C with mouse anti-Flag antibody, or control mouse IgG. Immunocomplex was collected, purified, and analyzed by Real-time PCR. Primers used for ChIP-PCR were as followed:
IFNB1: Forward: 5ʹ-gttcttgaattctcaggtcg-3ʹ; Reverse: 5ʹ-cccactttcacttctccctt-3ʹ;
IFNL1: Forward: 5ʹ-ccttcttgatgcagctccca-3ʹ; Reverse: 5ʹ-cacgcaaaatgggcaatcca-3ʹ.
2.16. Nuclear-cytoplasmic protein fractionation and western blotting
Cells were seeded in 60 mm dishes, and nuclear-cytoplasmic fractionation was conducted using the lysate buffers of NEPER Nuclear and Cytoplasmic Extraction Reagents kit (Thermo Fisher Scientific, US) according to the manufacturer’s protocol, supplemented with protease inhibitor cocktail (Roche). The protein lysates were separated by 10% sodium dodecyl sulfates polyacrylamide gel and then electrophoretically transferred (Bio-Rad) onto the PVDF membrane (Amersham Biosciences, Uppsala, Sweden). After blocking, membranes were incubated with the relevant primary antibodies at 4°C overnight, and then incubated with the secondary antibodies at room temperature for one hour, LaminB1 was used as internal control protein for nucleus, GAPDH, α-Tublin and β-Actin for cytoplasm or total. Band signals were visualized by Odyssey Imager (LI-COR Biosciences, Lincoln, NE). The antibodies used for immunoblot and/or immunoprecipitation assays were provided in Supplementary Table S4.
2.17. Tumor xenograft assay
A total of 2.5 × 10⁶ WT and NFATc3-KO SMMC7721 cells were injected into underarm skin on each side of the same nude mouse simultaneously (6-week old, female), then the mice were monitored for tumor forming every 3 days, tumor dimensions were measured twice a week and tumor volume was calculated using Volume = π/6×(length)×(width)2. After eight weeks, the mice were sacrificed and tumors were obtained for measuring the sizes and weights of tumors. All experiments in mice were conducted according to institutional guidelines of Peking University Health Science Center.
2.18. Hydrodynamic injection (HDI)
The hydrodynamic injection was performed as previously described.Citation30 Briefly, 16 μg plasmids were injected into the tail vein of C57BL/6 mice (6-week old, male) in 2 mL PBS (almost equivalent to 8% of the mouse body weight) within 5 seconds. Then sera were collected at 3, 5 and 7th days post-injection. C57BL/6 mice were purchased from the Department of Laboratory Animal Science, Peking University Health Science Center. Animals were housed in specific pathogen-free barrier facilities. All experiments in mice were conducted according to institutional guidelines of Peking University Health Science Center.
2.19. Detection of HBV DNA
The HBV DNA in the cell culture medium and sera of mice were extracted using the EasyPure Viral DNA Kit (TransGen Biotech, CN) according to the manufacturer’s instructions. Then the HBV DNA was detected by qPCR assay. The serial dilutions of pBB4.5–1.2× HBV plasmid were used as standards of quantification. The experiments were performed in triplicate and repeated 3 times.
2.20. Detection of HBsAg and HBeAg
The levels of HBsAg and HBeAg in the cell culture supernatant or mouse sera were measured in triplicate by the diagnostic kit for the quantitative determination of HBsAg or HBeAg (time-resolved Immunofluorometric Assay) (PerkinElmer, Waltham, MA, USA) following the manufacturer’s instructions.
2.21. Statistical analysis
For all the bar graphs, data were presented as means ± SD. GraphPad Prism software, version 7.00 for Windows (GraphPad Software, Inc., La Jolla, CA), was used for survival curves, charts, and statistical analysis. For the comparison of quantitative data between groups, the Student’s t-test was used, otherwise, independent sample rank sum test was used; survival was calculated using Kaplan-Meier’s method and compared using log-rank test; Spearman rank correlation test was used to calculate the correlation between two nonparametric values. Differences in means were considered statistically significant at P < .05. Significance levels are: *, P < .05; **, P < .01; ***, P < .001; ****, P < .0001; ns, not significant.
3. Results
3.1. NFATc3 expression is downregulated in HCC tissues due to gene deletion
Based on the data from The Cancer Genome Atlas (TCGA), we investigated the expression of NFATc3 in HCC. The results showed that NFATc3 expression was downregulated in HCC tissues () and the lower NFATc3 expression was significantly correlated with the poor 5-year overall survival (OS) in patients with HCC (n = 343, P= .048) (). Consistently, we confirmed that the mRNA level of NFATc3 in tumor tissues was significantly lower than that in paired para-tumor tissues, and both were significantly lower than that in normal liver tissues in our HBV-related HCC cohort (). The downregulation of NFATc3 was further confirmed at the protein level in five pairs of HBV-related HCC tissues (). In line with the survival data from TCGA, patients with lower NFATc3 mRNA expression had significantly lower 5-years OS rate (P= .021) than those with higher NFATc3 expression () in our HBV-related HCC cohort. Moreover, we investigated the correlations between the expression status of NFATc3 and clinical parameters including tumor size, tumor number, TNM stage and BCLC stage, but no significant correlation was found (Table S2). We also analyzed the expression and clinical significance of NFATc1, NFATc2 and NFATc4 in TCGA database. However, no survival prognosis associations between these genes expression and HCC patients were observed (Supplementary Figure 1a). These results indicated that NFATc3 expression was downregulated in HCC and might be related to the development and progression of HCC.
Figure 1. NFATc3 expression is downregulated in HCC tissues due to gene copy deletion. (a) NFATc3 mRNA levels in tumor (n = 372) and non-tumor (n = 50) tissues in TCGA-HCC database. (b) The association of NFATc3 expression status in tumor tissues and the prognosis of HCC patients (n = 364) in TCGA database. (c) NFATc3 mRNA levels in normal hepatic tissues (n = 7), paired para-tumor (n = 75) and tumor (n = 75) tissues of HBV-related HCC in our cohort, measured by qRT-PCR. (d) NFATc3 protein expression level in tumor (T, n = 5) and paired para-tumor (PT, n = 5) tissues of HBV-HCC patients in our cohort, examined by western blot. (e) The association of NFATc3 expression in tumor tissues and the prognosis of HCC patients (n = 60) in our HBV-related HCC cohort. (f, g) The copy number alterations (CNAs) of NFAT family genes in tumor tissues (n = 372) in TCGA-HCC database (f) and in HBV-related HCC tissues (n = 25) revealed by aCGH analysis (g). (h) NFATc3 mRNA expression in tumor tissues of NFATc3 copy neutral (0), heterozygous deletion (−1) and duplication (1/2) groups in TCGA-HCC database. (i) NFATc3 gene CNAs in HCC tissues caused by HBV, HCV and non-virus pathogenies. (a, c, h) Data were presented as the mean ± SD, P value was calculated by performing un-paired Student’s t-test, ***, P < .001; ****, P < .0001; ns, not significant. (b and e) Survival was calculated using Kaplan-Meier’s method and compared using log-rank test. (d) Data were representative of three experiments
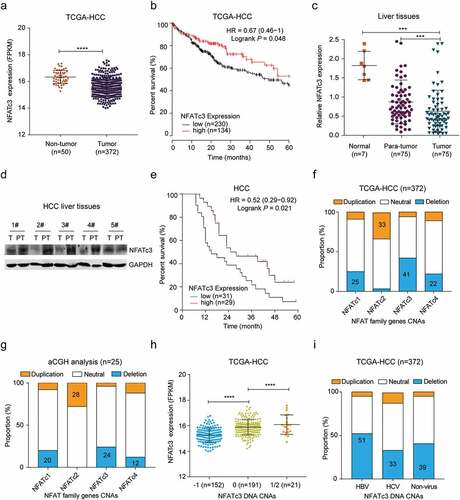
Next, we analyzed the potential mechanism for the downregulation of NFATc3 expression in HCC. Based on the TCGA-HCC database, we analyzed the copy number alterations (CNAs) of NFATc3 gene and found that NFATc3 gene was deleted in 44% (152/343) HCC tissues, which was the highest deletion rate among NFAT family genes (). In consistent with this result, our previous array-based comparative genomic hybridization (aCGH) data of 25 HBV-related HCC tissuesCitation31 showed that NFATc3 gene also had the highest deletion rate (24%, 6/25) (). Importantly, the corresponding mRNA expression level of NFATc3 in gene copy deleted HCC tissues was significantly lower than that in neutral tissues (), while the expression level of NFATc1, NFATc2 and NFATc4 had no difference between these two groups (Supplementary Figure 1b). Furthermore, we analyzed the CNAs of NFATc3 gene in HCC with different etiology including HBV, HCV and non-virus infection in TCGA database. The results showed that NFATc3 gene deletion occurred in all three kinds of HCC, while the deletion frequency in HBV-HCC group (51%) was the highest (). Consistently, the NFATc3 mRNA expression was also downregulated in the deletion group of HBV-HCC tissues (Supplementary Figure 1c). To explore other causes of NFATc3 downregulation, the methylation status of NFATc3 CpG island site in non-tumor and tumor tissues was also compared. However, no significant difference of NFATc3 gene methylation between tumor and non-tumor tissues in TCGA database (Supplementary Figure 1d) or in paired tumor and para-tumor tissues derived from HBV-related HCC patients was observed (Supplementary Figure 1e), indicating the downregulation of NFATc3 expression was not caused by methylation modification. We also analyzed the NFATc3 gene mutation profile in TCGA-HCC database and found that there were five tumor samples with NFATc3 gene missense mutations among 372 HCC samples. Taken together, these results indicated that NFATc3 expression was downregulated mainly due to gene deletion in HCC tumor tissues, especially in HBV-related HCC.
3.2. NFATc3 inhibits the proliferation and migration capabilities of hepatoma cells
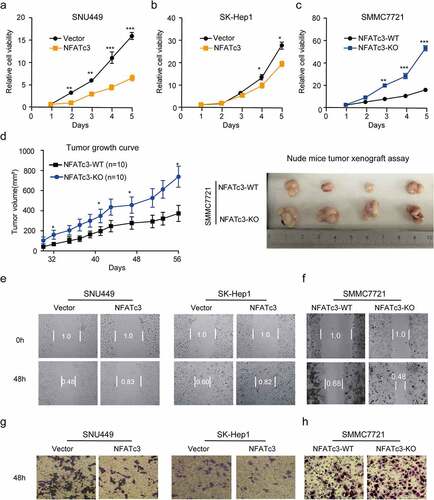
To better understand the role of NFATc3 in HCC, we determined the effects of NFATc3 on proliferation and migration abilities of HCC cells by using gain- and loss-of-function experiments. According to endogenous NFATc3 protein expression levels (Supplementary Figure 2a), we constructed a stable NFATc3 knockout (NFATc3-KO) SMMC7721 cell line by CRISPR-Cas9 gene-editing system (Supplementary Figure 2b), while overexpressed NFATc3 in SK-Hep1 and SNU449 cells (Supplementary Figure 2c). The cell viability assay revealed that overexpression of NFATc3 significantly inhibited the proliferation of SNU449 () and SK-Hep1 () cells from the third day after NFATc3 overexpression. Conversely, NFATc3 knockout accelerated the proliferation of SMMC7721 cells (). To extend our understanding of NFATc3 on tumor development in vivo, we subcutaneously injected NFATc3-KO and WT SMMC7721 cells into 4-week-old nude mice. As expected, we observed that the volume curves indicated faster growth of tumors in NFATc3-KO cells (, left panel) and the tumors formed by NFATc3-KO cells (, right panel) exhibited larger sizes and weights (Supplementary Figure 2d), suggesting that NFATc3 knockout could promote the growth of hepatoma cells. Next, we performed wound healing and transwell assays to detect the effects of NFATc3 on cell migration ability. The results showed that NFATc3 overexpression significantly inhibited the migration () and invasion () capabilities of SK-Hep1 and SNU449 cells according to statistical results of scratch area change (Supplementary Figure 2e) and the number of cells invading through the membrane (Supplementary Figure 2g). In contrast, knockout of NFATc3 significantly facilitated the migration () and invasion of SMMC7721 cells () which had a smaller scratch area ratio (Supplementary Figure 2f) and more cells invading through the membrane (Supplementary Figure 2h). Taken together, these results indicated that NFATc3 might function as a suppressor gene by inhibiting the proliferation and migration abilities of hepatoma cells.
Figure 2. NFATc3 inhibits the proliferation and migration capabilities of hepatoma cells. (a,b) Continuous CCK-8 assay for 5 days in SNU449 (a) and SK-Hep1 (b) cells after NFATc3 expression or vector plasmids transfected for 48 hours. (c) Continuous CCK-8 assay for 5 days in WT& NFATc3-KO SMMC7721 cells with normal culture. (d) The growth curve of tumors formed by WT (n = 10) and NFATc3-KO SMMC7721 (n = 10) cells in nude mice (Left panel) and representative images of xenografted tumors exfoliated from nude mice (Right panel) at day 56 after inoculation. (e) Representative images of wound healing experiments in SNU449 and SK-Hep1 cells with or without NFATc3 overexpressed for 48 hours. (f) Representative images of wound healing experiments in WT& NFATc3-KO SMMC7721 cells with normal culture. (g) Representative images of Transwell experiments in SNU449 and SK-Hep1 cell lines with or without NFATc3 overexpressed for 48 hours. (h) Representative images of Transwell experiments in WT& NFATc3-KO SMMC7721 cells with normal culture. (a-d) Data were presented as the mean ± SD, P value was calculated by performing un-paired Student’s t-test, *, P < .05; **, P< .01; ***, P < .001; ns, not significant. (e-h) Data were representative of three experiments
3.3. NFATc3 effectively decreases the replication of HBV
It is well known that HBV infection is a leading cause of HCC. However, it remains unclear whether NFATc3 could suppress liver cancer by inhibiting HBV replication. To investigate the role of NFATc3 on HBV replication, we detected the levels of HBV-indicated markers in NFATc3 overexpressing or knockout hepatoma cells. The results of qPCR, ELISA and RT-qPCR assays showed that ectopic NFATc3 expression significantly decreased the levels of HBV DNA, hepatitis B surface antigen (HBsAg) and hepatitis B e antigen (HBeAg) in culture supernatant, and 3.5 kb HBV RNA in cells, when we co-expressed NFATc3 and HBV replisome in Hep3B cells (). Consistently, the overexpression of NFATc3 led to the similar results in HepAD38 cells, a tetracycline inducible HBV expressing cell line (). In contrast, the levels of HBV-indicated markers were greatly elevated in NFATc3-KO SMMC7721 cells, as compared to WT cells (). Moreover, we confirmed that NFATc3 and 1.2x HBV plasmids co-delivered into mice by hydrodynamic injection significantly decreased both HBsAg and HBeAg levels in mice sera (). These results indicated that NFATc3 significantly inhibited HBV replication in hepatocytes.
Figure 3. NFATc3 effectively decreases HBV replication. (a, b) Transient co-transfected 1.2x HBV plasmid and NFATc3 plasmid or vector in Hep3B cell lines (a), transient transfected NFATc3 plasmid or vector in HepAD38 cells (tet-off, b), after 5 days and detect four HBV indicators, HBsAg, HBeAg, and HBV DNA in cultural supernatant, 3.5 kb HBV RNA in cell. (c) Transient co-transfected prcccDNA plus pCMV-Cre or pCMV-vector in WT& NFATc3-KO SMMC7721 cells for 5 days, detected HBV indicators. (d) In the C57BL/6 wide-type mouse model established by hydrodynamic tail vein injection of 1.2× HBV replication clone plasmid, together transfecting with human NFATc3 expressing or vector plasmids, and detected HBsAg and HBeAg levels in peripheral blood of the mice at 3, 5 and 7 days. (e) The peripheral blood HBV DNA levels between high (n = 18) and low (n = 18) NFATc3 expression groups (according expression median in para-tumor tissues) in our HBV-related HCC cohort. Data were presented as the mean ± SD, P value was calculated by performing un-paired Student’s t-test, *, P < .05; **, P< .01; ***, P < .001; ns, not significant
Next, we analyzed the correlation between HBV DNA level and NFATc3 expression in HCC patients. Based on the data derived from our HBV-related HCC patient cohort, we found that patients with lower NFATc3 mRNA expression in para-tumor tissues had significantly higher serum HBV DNA levels (), supporting the potential anti-viral role of NFATc3 against HBV.
3.4. NFATc3 is critical for IFN responses in hepatocytes
According to the previous studies, NFATc3 could upregulate type I IFNs expression downstream the Toll-like receptor 7/9 in pDCs to inhibit virus replication.Citation16 In nonimmune cells, RIG-I is an important pattern recognition receptor (PRR) to recognize viral RNA, and induce downstream IFN response.Citation32 It has been reported that the RNA sensor RIG-I could recognize HBV derived pre-genomic RNA (pgRNA) to promote IFN-λ production.Citation33 Thus, to further explore the effect of NFATc3 on immune genes expression in hepatocytes, we performed next-generation RNA sequencing (RNA-Seq) in WT and NFATc3-KO SMMC7721 cells, with Sendai virus (SeV) infection which can activate innate immune through RIG-I pathway.Citation34 Using RNA-seq approach, we first analyzed differentially expressed genes (DEGs, fold change > 2) between two groups () and screened out innate immune-related DEGs (). With further analysis of the RNA-seq results, we found that only the expression of IFNB1 in type I IFNs and type III IFNs (IFNL1, IFNL2 and IFNL3) could be detected in SMMC7721 cells, while IFNAs were below the detection limit. Compared to WT cells post infection, the expression of IFNL1 was significantly downregulated in NFATc3-KO SMMC7721 cells (-Log10 (P adjust) = 17, Log2 (fold change) = 2.21). However, the expression of IFNB1, IFNL2 and IFNL3 showed no significant difference between two groups of cells (). Besides IFNs, some ISGs were also downregulated significantly in NFATc3-KO SMMC7721 cells ().
Figure 4. NFATc3 is critical for IFN responses. (a-d) WT and NFATc3-KO SMMC7721 cells were infected with SeV for 12 hours, the RNA was harvested followed by RNA-sequencing analysis. (a) The volcano map of upregulated (red), downregulated (green) and no significant difference (gray) expression of genes between two groups. (b) Heat map of differentially expressed immune genes. (c, d) The expression of IFNs (c) and ISGs (d) between two groups. (e, f) WT/NFATc3-KO SMMC7721 cells were infected with SeV for 24 hours, measured IFNs and ISGs expression by qRT-PCR (e), and RIG-I expression by western blot (f). (g, h) Vector control and NFATc3 overexpressing HEK293T cells were infected with SeV for 24 hours, measured IFNs and ISGs expression by qRT-PCR (g), and RIG-I expression by western blot (h). Data were presented as the mean ± SD, P value was calculated by performing un-paired Student’s t-test, *, P < .05; **, P< .01; ***, P < .001; ns, not significant. (a-d) n = 3 cultures. (f, h) Data were representative of three experiments
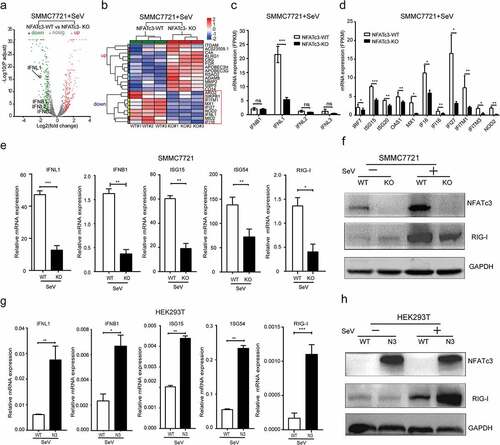
To confirm the effect of NFATc3 on IFNs and ISGs expression after SeV infection, we performed qRT-PCR to detect the mRNA expression levels of IFNL1, IFNB1, ISG15, ISG54 and RIG-I, which are important and highly induced immune genes in hepatocytes.Citation35–37 The results showed that mRNA levels of IFNL1, IFNB1, ISG15, ISG54 and RIG-I were significantly lower in NFATc3-KO SMMC7721 cells than that in WT cells post SeV infection (). And consisted of the mRNA level, the protein level of RIG-I was also downregulated in NFATc3-KO SMMC7721 cells after SeV infection (). Conversely, overexpression of NFATc3 in HEK293T cells increased the mRNA level of these genes () and the protein level of RIG-I () after SeV infection. Taken together, these results suggested that NFATc3 could specifically upregulate IFNL1 and IFNB1 expression and activate downstream ISGs in hepatocytes. Since the endogenous expression level of IFNAs was too low in hepatoma cells and knockout of NFATc3 did not affect the expression of IFNL2 and IFNL3 genes, we did not analyze these IFNs in this study.
3.5. NFATc3 induces the transcription of IFNs by binding to their promoters
It has been reported that NFATc3 can bind to the consensus sequence (T/AGGAAA) within the promoter regions of the target genes.Citation38 We analyzed the sequences in the promoter regions of IFNL1 and IFNB1 genes and found that both promoters contained potential NFATc3 binding sites. To explore whether NFATc3 regulates the transcription of IFNB1 and IFNL1 genes in hepatocytes, we constructed luciferase reporter plasmids containing the promoter regions of IFNL1 and IFNB1 genes with wild-type or mutant (T/AGGAAA to T/ACCTTT) NFATc3 binding sites (). By using dual luciferase reporter system, we demonstrated that NFATc3 increased the transcriptional activities of wild-type promoters of IFNL1 and IFNB1 in HEK293T and hepatoma cell lines including SK-Hep1, SNU449, and Hep3B respectively, and this effect was attenuated or even abolished when NFATc3 binding site was mutated (). In addition, the luciferase activity of both wild-type IFNB1 and IFNL1 promoter was increased by NFATc3 in a dose-dependent manner, while mutant IFNB1 and IFNL1 promoters were not affected by NFATc3 (Supplementary Figure 3a, b). Further ChIP-PCR assay confirmed that NFATc3 could bind to the targeted DNA fragments in IFNB1 and IFNL1 promoters (). Meanwhile, we observed that the interferon-stimulated response element (ISRE) activities were also activated by ectopic NFATc3 expression in HEK293T and hepatoma cell lines including Hep3B, SNU449, and SK-Hep1 (Supplementary Figure 3c). Consistent with this result, treated with culture supernatants from all four cells with ectopic NFATc3 expression could significantly increase luciferase activities in 2 fTGH-ISRE cells (Supplementary Figure 3d), supporting the induction of IFNs in those NFATc3 overexpressing cells.
Figure 5. NFATc3 induces the transcription of IFNs by binding to their promoters. (a) Diagram for wide-type and mutant binding sites of NFATc3 on IFNL1 and IFNB1 promoters. (b, c) Transfected with plasmid encoding NFATc3 or empty vector in HEK293T and hepatoma cell lines for 36 hours, detected luciferase activities of NFATc3 wide-type and binding site-mutant IFNL1 (b) and IFNB1 (c) promoters. (d) ChIP and semi-quantitative PCR were used to detect interactions between NFATc3 to IFNL1 and IFNB1 promoters after over-expressing NFATc3 with flag-tag in HEK293T cells for 48 hours, integrated optical density of each band was measured and analyzed. (e, f) qRT-PCR analysis of IFNs and ISGs expression in SNU449, SK-Hep1, Hep3B (e) and NFATc3-KO SMMC7721 (f) cells with or without NFATc3 expression plasmid transfected for 48 hours. (g) Expression correlation between NFATc3 and RIG-I gene in liver tissues in TCGA database. (h) Protein levels of NFATc3 and RIG-I in 293 T and Hep3B cells after over-expressed NFATc3 for 48 hours. (i, j) Analysis of expression correlations between NFATc3 and IFNL1 (i, n = 36) or IFNB1 (j, n = 18) in para-tumor tissues of HBV-related HCC patients in our cohort. (b, c, e-h) Data were presented as the mean ± SD, P value was calculated by performing un-paired Student’s t-test, *, P < .05; **, P< .01; ***, P < .001; ns, not significant. (g, i, j) Spearman rank correlation test was used to calculate a correlation between two nonparametric values. (d, h) Data were representative of three experiments
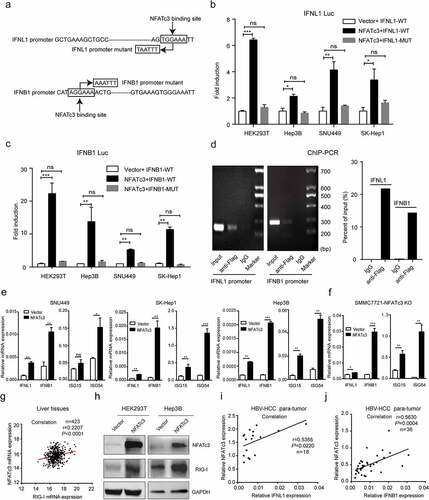
Next, we confirmed that the mRNA levels of IFNL1, IFNB1, ISG15 and ISG54 were significantly upregulated in hepatoma cell lines () with overexpression of NFATc3. Similar results were observed in HEK293T cells (Supplementary Figure 3e). Importantly, transient transfection of NFATc3 plasmid in NFATc3-KO SMMC7721 cells could rescue the expression of IFNL1, IFNB1, ISG15 and ISG54 (). As for RIG-I, which could inhibit HCC carcinogenesis and predict HCC patient prognosis, Citation39,Citation40 a positive correlation was found between RIG-I and NFATc3 mRNA expression in TCGA-HCC database (), and RIG-I protein level was increased after NFATc3 overexpressing in HEK293T and Hep3B cells (). Furthermore, we confirmed that the mRNA level of NFATc3 was positively correlated with that of IFNL1 () and IFNB1 () in para-tumor tissues from HBV-related HCC patients. And in HBV-infected liver tissues from GSE83148 database, positive correlations between NFATc3 and IFNL1/IFNL3 expression also existed (Supplementary Figure 3f, g). The above results indicated that NFATc3 could bind to the promoter regions of IFNL1 and IFNB1, and promote their transcription and downstream ISGs expression in hepatocytes.
3.6. IFNs pathway mediates the anti-HCC and anti-HBV functions of NFATc3 in hepatocytes
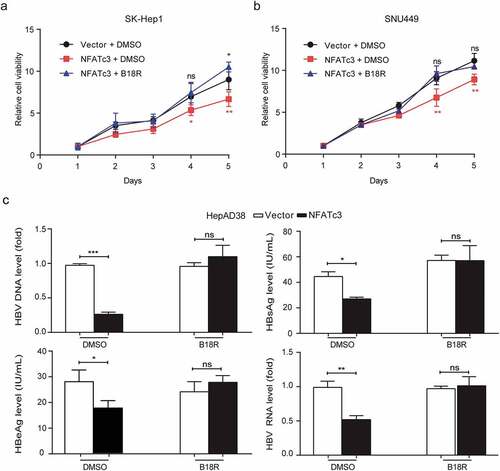
The IFNs are important immune cytokines which have been used for treatment of hepatitis B and HCC. To further confirm whether NFATc3 exerts anti-HCC and anti-HBV function through upregulating IFNs in hepatocytes, we treated NFATc3 overexpressed SK-Hep1, SNU449 and HepAD38 cells by using recombinant orthopoxviral immunomodulatory proteins (B18R), an IFN receptors antagonist, to block type I and type III IFN pathways.Citation41,Citation42 We found that the inhibitory effects of NFATc3 on the cell proliferation were reversed in SK-Hep1 and SNU449 cells (). Similarly, B18R treatment significantly attenuated the inhibitory effects of NFATc3 on HBV replication (). These results suggested that NFATc3 plays important anti-HCC and anti-HBV roles in an IFN-dependent manner in hepatocytes.
Figure 6. IFNs pathway mediates the anti-HCC and anti-HBV functions of NFATc3 in hepatocytes. (a, b) Continuous CCK-8 assay for 5 days in SNU449 (a) and SK-Hep1 (b) cells after NFATc3 expression plasmid or vector transfected for 48 hours, added DMSO or B18R (200 ng/mL). (c) NFATc3 was overexpressed in HepAD38 cells with DMSO or B18R (200 ng/mL) added, 5 days later, four HBV indicators, HBV DNA, HBsAg, HBeAg in supernatant and 3.5 kb HBV RNA in cell were detected. Data were presented as the mean ± SD, P value was calculated by performing un-paired Student’s t-test, *, P < .05; **, P < .01; ***, P < .001; ns, not significant
3.7. NFATc3 enhances RIG-I/MAVS/IRF7-mediated IFN response
The downstream signaling mediated by RIG-I requires the protein adaptor MAVS, which coordinates the activation of IRF3 and IRF7 and thereby inducing IFNs expression.Citation32 To investigate whether NFATc3 is involved in RIG-I pathway-mediated IFNs induction, we performed a series of experiments by using NFATc3 overexpressing and knockout cells. First, we detected the transcriptional activities of wild-type IFNL1 and IFNB1 promoters after co-expressing NFATc3 with MAVS, IRF7 and IRF3 respectively in HEK293T cells. The results showed that overexpression of any of these proteins could upregulate the promoter activities of wild-type IFNL1 and IFNB1, while NFATc3 exhibited significantly stronger synergistic effects on IFN promoters only when co-expressing with MAVS () or IRF7 (). However, no such synergistic effect on mutant IFNL1 promoter was observed (Supplementary Figure 4a). Such upregulating effects of NFATc3 on IFNB1 and IFNL1 promoters exhibited a dose-dependent manner with MAVS (Supplementary Figure 4b) or IRF7 co-expression (Supplementary Figure 4c). Secondly, we tested the expression of IFNL1 and IFNB1 after co-expressing NFATc3 with MAVS and IRF7, respectively. The synergistic effects between NFATc3 and MAVS or IRF7 on upregulating the expression of IFNs () and downstream ISGs () were also confirmed in HEK293T cells. These results were further supported in WT and NFATc3-KO SMMC7721 cells. As shown in , knockout of NFATc3 significantly weakened the promoter activities of IFNL1 and IFNB1 after MAVS or IRF7 overexpression. Consistently, NFATc3 knockout significantly inhibited MAVS- or IRF7-induced IFN response in SMMC7721 cells (). Next, the transcriptional activities of IFNL1 and IFNB1 promoters were detected in HEK293T cells with NFATc3 overexpression and in SMMC7721 cells with NFATc3 knockout after SeV infection. The synergistic effects between NFATc3 and MAVS or IRF7 on upregulating the transcription activities of wild-type IFNL1 and IFNB1 promoters were also observed in HEK293T () and SMMC7721 cells (). And the upregulating effect of NFATc3 on IFNL1 promoter activity after RIG-I activation was not observed when NFATc3 binding site was mutated in HEK293T cells (Supplementary Figure 4d). These findings indicated that NFATc3 might be involved in RIG-I/MAVS/IRF7-mediated IFN response in hepatocytes.
Figure 7. NFATc3 enhances RIG-I/MAVS/IRF7-mediated IFN response. (a,b) Luciferase activities of wild-type IFNL1 (a) and IFNB1 (b) promoters in HEK-293 T cells co-transfected plasmids encoding MAVS, IRF7 and IRF3 with NFATc3 or empty vector for 36 hours. (c,d) qRT-PCR analysis of IFNs (c) and ISGs (d) mRNA expression in HEK293T cells transfected with plasmids encoding MAVS or IRF7 together with NFATc3 or empty vector for 48 hours. (e), Luciferase activities of IFNL1 and IFNB1 promoters were detected after transfection of plasmids encoding MAVS or IRF7 in WT and NFATc3-KO SMMC7721 cells for 48 hours. (f, g) IFNs (f) and ISGs (g) mRNA levels detected after overexpression of MAVS or IRF7 in WT and SMMC7721-KO cells. (h) Luciferase activities of IFNL1 and IFNB1 promoters were measured in vector control and NFATc3 overexpressing HEK293T cells infected with SeV for 24 hours. (i) Luciferase activities of IFNL1 and IFNB1 promoters were measured in WT/NFATc3-KO SMMC772 cells infected with SeV for 24 hours. Data were presented as the mean ± SD, P value was calculated by performing un-paired Student’s t-test, *, P < .05; **, P< .01; ***, P < .001; ns, not significant
3.8. RIG-I/MAVS/IRF7 pathway upregulates NFATc3 expression and promotes its nuclear localization
The expression status of NFAT proteins and their translocation from the cytoplasm to the nucleus are critical for activating the transcription of downstream target genes.Citation43 Thus, we investigated whether the activation of RIG-I/MAVS/IRF7 pathway could regulate the expression and localization of NFATc3. The qRT-PCR and western blot assays identified a significant upregulation of NFATc3 mRNA and protein level in both SMMC7721 () and Huh7 cells infected with SeV (). In addition, the nuclear localized NFATc3 protein was significantly increased both in SMMC7721 () and Huh7 cells (). In consistent with the above results, overexpression of either MAVS or IRF7 also increased endogenous expression and nuclear localization of NFATc3 in SMMC7721 () and Huh7 cells (). Furthermore, in GSE83148 database, NFATc3 mRNA level was positively correlated with MAVS and IRF7 mRNA levels in liver tissues (Supplementary Figure 5a, b). Taken together, the above results suggested that RIG-I/MAVS/IRF7 pathway might mediate NFATc3 activation through upregulating its expression and promoting its nuclear localization.
Figure 8. RIG-I/MAVS/IRF7 pathway upregulates NFATc3 expression and promotes its nuclear localization. (a-d) After infected with SeV for 12 hours, the mRNA and total protein levels of NFATc3 and RIG-I in SMMC7721 (a) and Huh7 (c) cells were detected, and the cytosolic and nuclear NFATc3 protein levels in SMMC7721 (b) and Huh7 cells (d) were also detected. (e-h) After overexpressing MAVS or IRF7 in hepatoma cells for 48 hours, the mRNA and total protein levels of NFATc3 in SMMC7721 (e) and Huh7 (g) cells were detected, and the cytosolic and nuclear NFATc3 protein levels in SMMC7721 (f) and Huh7 cells (h) were also detected. (a, c, e, and g) Data were presented as the mean ± SD, P value was calculated by performing un-paired Student’s t-test, *, P < .05; **, P< .01; ***, P < .001; ns, not significant. Data were representative of three experiments
To further explore the relationship between NFATc3 and RIG-I pathway in HCC, we analyzed our aCGH data and TCGA-HCC database. The results showed that besides NFATc3, high deletion frequencies of RIG-I, MAVS and IRF7 were also found in HCC tumor tissues. More than half of the tumor tissues had at least one of these genes deleted in our cohort (Supplementary Figure 5c) and data from TCGA-HCC database (Supplementary Figure 5d). Similar to NFATc3, downregulated expression of RIG-I and IRF7 was also observed in gene copy deleted groups compared to neutral groups in HCC tumor tissues (Supplementary Figure 5e). The mRNA levels of these two genes were also lower in HCC tumor tissues compared with non-tumor samples (Supplementary Figure 5f). Taken together, these results indicated that the disability of innate immunity due to NFATc3/RIG-I/MAVS/IRF7 axis inactivation plays an important role in hepatocarcinogenesis.
4. Discussion
NFAT proteins were firstly described almost three decades ago. Since then, the physiological functions of different NFAT homologues in the immune system and many other tissues have been uncovered. However, the role of individual NFAT members in the context of tumorigenesis and virus infection in hepatocytes remains unrevealed. We reported here for the first time that NFATc3 gene was frequently deleted and caused its downregulated expression in HCC, and propose the possibility that NFATc3 might function as a tumor suppressor by activating anti-tumor and anti-virus immune responses in hepatocytes. Mechanistically, NFATc3 functions as a downstream transcription factor of RIG-I-MAVS-IRF7 pathway to upregulate IFNL1 and IFNB1 expression in hepatocytes.
The involvement of NFAT proteins in carcinogenesis and immunity has been reported.Citation44 In this study, the downregulation of NFATc3 was found mainly caused by gene copy deletion in HCC tumor tissues, and more importantly, lower NFATc3 expression was associated with poor prognosis of HCC patients. More than that, NFATc3 inhibited the proliferation and migration capabilities of hepatoma cells, suggested a potential tumor suppressor role of NFATc3 in HCC. In addition, NFATc3 inhibited HBV replication in both in vitro and in vivo HBV replication systems. In line with this, negative correlation was found between NFATc3 mRNA level and serum HBV viral load in HBV-related HCC patients. Thus, we conclude that NFATc3 is able to suppress HCC by inhibiting cell proliferation and migration, as well as HBV replication since HBV is a carcinogenic virus.Citation45 However, further studies are needed to confirm the interference between NFATc3 and HBV replication in HBV model systems that recapitulate natural infection process.
As transcription factors, NFAT proteins induce the expression of cytokines including IL-2, IL-3, IL-4, and IL-5.Citation46 It has been postulated that NFATs are not involved in IFNs production based on evolutionary analysis.Citation47 However, a recent study has demonstrated that NFATc3 is a unique member of the NFAT family that plays a critical role in regulating type I IFNs production in pDCs.Citation16 In this study, we analyzed the sequences of all type I and type III IFN promoters and found that NFAT binding site (T/AGGAAA) exists within the promoters of all type I IFNs, as well as IFNL1, but not IFNL2 or IFNL3. Since among all type I IFNs, only the expression of IFNB1 could be detected in SMMC7721 cells in our RNA-seq data, we focused on the regulatory effect of NFATc3 on IFNB1 and IFNL1 in our further study. By using ChIP-PCR, qRT-PCR and luciferase assays, we demonstrated that NFATc3 could bind to the promoter regions of both IFNB1 and IFNL1 and transcriptionally activate the expression of IFNs. Also, NFATc3 could activate ISGs expression by upregulating IFNs expression. Furthermore, we confirmed that the IFNs receptor antagonist could attenuate the inhibitory effects of NFATc3 on both HCC cell proliferation and HBV replication. Thus, we conclude that NFATc3 plays important anti-HCC and anti-HBV roles in an IFN-dependent manner in hepatocytes.
As for the RIG-I pathway, RIG-I first recognizes exogenous RNA, then the adaptor MAVS forms prion-like aggregates on the mitochondria to recruit downstream kinases and thereby phosphorylates IRF7 to regulate IFNs and ISGs expression.Citation35,Citation48 In HBV-infected hepatocytes, RIG-I recognizes HBV pgRNA and induces IFN-λ expression.Citation33 In this study, we found that NFATc3 participated in the RIG-I pathway to enhance type I and type III IFN responses in hepatocytes. On the one hand, NFATc3 could enhance the upregulating effect of RIG-I pathway on IFNL1 and IFNB1 promoter activities via synergizing with MAVS and IRF7, which was further confirmed by their synergistic effects on upregulating the expression of IFNs and ISGs. On the other hand, RIG-I pathway activation and overexpression of MAVS or IRF7 could upregulate NFATc3 expression at both mRNA and protein levels, and promote NFATc3 protein translocating into cell nucleus. These results revealed a previously unknown aspect of NFATc3 that functions as a novel positive feedback regulator of RIG-I pathway in hepatocytes. However, the detailed mechanism of this regulation between NFATc3 and RIG-I pathway remains to be further investigated.
Meanwhile, it has been reported that NFATc3 could interact with IRF7 to promote its nuclear localization, Citation16 and we also found that IRF7 conserved recognition sequences (GAAA)Citation49 existed on the promoter of NFATc3 gene. In addition, we noticed a smaller band of NFATc3 protein detected by western blot in hepatoma cell nucleus after SeV stimulation or MAVS and IRF7 overexpression. Since NFAT protein is usually activated upon dephosphorylation by calcineurin, afterward translocating into nucleus, Citation50 the band of NFATc3 with lower molecular weight implicated the dephosphorylation and activated status of NFATc3 protein in the nucleus (). So, the possible regulation mechanism of RIG-I pathway on NFATc3 is that, after RIG-I activation, the phosphorylated IRF7 interacts with NFATc3 to form an IRF7/NFATc3 complex and promotes NFATc3 nuclear localization, while in the nucleus, IRF7 further functions as a transcription factor binding to NFATc3 promoter and upregulating its expression. Further studies are needed to explore the effects and detailed mechanism of RIG-I pathway on NFATc3 protein activation.
In summary, this study demonstrates that NFATc3 directly binds to the promoter regions of IFNL1 and IFNB1 to activate their transcription in a synergized manner with RIG-I pathway, and plays a crucial role in inhibiting HBV replication and HCC tumorigenesis in hepatocytes. During multiple steps of hepatocyte carcinogenesis, deletion of NFATc3 and other genes of RIG-I pathway might facilitate viral replication and eventually promote tumorigenesis. These results provide new insights into the complex molecular regulatory mechanisms of RIG-I/NFATc3/IFNs axis during HBV-related HCC carcinogenesis.
Disclosure of potential conflicts of interest
No potential conflicts of interest were disclosed.
Author’s contributions
Xiaobin Zao and Jin Cheng: acquisition of data, analysis and interpretation of data, drafting of the manuscript, statistical analysis; Xiaoyu Feng, Deyao Li and Tianxu Liu: acquisition of data; Guiwen Guan, Jun Zou and Jing Zhang: statistical analysis; Congle Shen and Ting Zhang: support of experimental technology; Jie Wang and Jia Liu: administrative, technical, or material support; Fuping You: material support, study supervision, critical revision of the manuscript for important intellectual content. Xiangmei Chen and Fengmin Lu: study concept and design, obtained funding, study supervision, critical revision of the manuscript for important intellectual content. All authors of this research have approved the final version of the article.
Abbreviations
| HBV | = | Hepatitis B virus |
| HCC | = | Hepatocellular Carcinoma; |
| IFNs | = | Interferons |
| IFNB1 | = | Interferon Beta 1 |
| IFNL1 | = | Interferon Lambda 1 |
| ISGs | = | Interferon-Stimulated Genes |
| ISRE | = | Interferon-Stimulated Response Element |
| TCGA | = | The Cancer Genome Atlas |
| GEO | = | Gene Expression Omnibus |
| NFATc3 | = | Nuclear Factor of Activated T cells 3 |
| RNA-seq | = | RNA-sequencing |
| RIG-I | = | Retinoic Acid-Inducible Gene I |
| pgRNA | = | pre-genomic RNA |
| MAVS | = | Mitochondrial Antiviral Signaling Protein |
| TLR | = | Toll-Like Receptor |
| IRF | = | Interferon Regulate Factor |
| IL-2 | = | Interleukin-2 |
| pDCs | = | plasmacytoid Dendritic Cells |
| CNAs | = | Copy Number Alterations |
| OS | = | Overall Survival |
| MSRE-qPCR | = | Methylation Specific Restrictive Enzyme based quantitative PCR |
| ChIP | = | Chromatin Immunoprecipitation |
| SeV | = | Sendai virus |
| qPCR | = | quantitative polymerase chain reaction |
| qRT-PCR | = | Quantitative reverse transcription PCR |
| HBsAg | = | Hepatitis B surface Antigen |
| HBeAg | = | Hepatitis B e Antigen |
| NFATc3-WT | = | NFATc3 gene Wild Type |
| NFATc3-KO | = | NFATc3 gene Knock Out. |
Supplemental Material
Download ()Supplementary material
Supplemental data for this article can be accessed on the publisher’s website.
Additional information
Funding
References
- Chan HL, Sung JJ. Hepatocellular carcinoma and hepatitis B virus. Semin Liver Dis. 2006;26(2):153–17. doi:10.1055/s-2006-939753.
- W.H. Organization. Global hepatitis report, 2017. 2017.
- Yang YM, Kim SY, Seki E, Inflammation and liver cancer: molecular mechanisms and therapeutic targets. Semin liver Dis, 39 (2019) 26–42.
- Qin -J-J, Nag S, Wang W, Zhou J, Zhang W-D, Wang H, Zhang R. NFAT as cancer target: mission possible? Biochim Biophys Acta. 2014;1846(2):297–311. doi:10.1016/j.bbcan.2014.07.009.
- Serrano-Perez MC, Fernandez M, Neria F, Berjon-Otero M, Doncel-Perez E, Cano E, Tranque P. NFAT transcription factors regulate survival, proliferation, migration, and differentiation of neural precursor cells. Glia. 2015;63(6):987–1004. doi:10.1002/glia.22797.
- Pan MG, Xiong Y, Chen F. NFAT gene family in inflammation and cancer. Curr Mol Med. 2013;13(4):543–554. doi:10.2174/1566524011313040007.
- Glud SZ, Sorensen AB, Andrulis M, Wang B, Kondo E, Jessen R, Krenacs L, Stelkovics E, Wabl M, Serfling E, et al. A tumor-suppressor function for NFATc3 in T-cell lymphomagenesis by murine leukemia virus. Blood. 2005;106(10):3546–3552. doi:10.1182/blood-2005-02-0493.
- Lee H, Chouinard L, Bonin M, Michel RN. NFATc3 deficiency may contribute to the development of mammary gland adenocarcinoma in aging female mice. Mol Carcinog. 2005;44(3):219–222. doi:10.1002/mc.20136.
- Lee SH, Kieu C, Martin CE, Han J, Chen W, Kim JS, Kang MK, Kim RH, Park N-H, Kim Y, et al. NFATc3 plays an oncogenic role in oral/oropharyngeal squamous cell carcinomas by promoting cancer stemness via expression of OCT4. Oncotarget. 2019;10(23):2306–2319. doi:10.18632/oncotarget.26774.
- Lee SH, Rigas NK, Lee CR, Bang A, Srikanth S, Gwack Y, Kang MK, Kim RH, Park NH, Shin KH. Orai1 promotes tumor progression by enhancing cancer stemness via NFAT signaling in oral/oropharyngeal squamous cell carcinoma. Oncotarget. 2016 Jul 12;7(28):43239–43255. doi:10.18632/oncotarget.9755
- Lin F-C, Young HA. Interferons: success in anti-viral immunotherapy. Cytokine Growth Factor Rev. 2014;25(4):369–376. doi:10.1016/j.cytogfr.2014.07.015.
- Torresi J, Locarnini S. Antiviral chemotherapy for the treatment of hepatitis B virus infections. Gastroenterology. 2000;118(2):S83–103. doi:10.1016/S0016-5085(00)70008-4.
- Patt YZ, Hassan MM, Lozano RD, Brown TD, Vauthey JN, Curley SA, Ellis LM. Phase II trial of systemic continuous fluorouracil and subcutaneous recombinant interferon Alfa-2b for treatment of hepatocellular carcinoma. J Clin Oncol. 2003;21(3):421–427. doi:10.1200/JCO.2003.10.103.
- Zanoni I, Granucci F, Broggi A. Interferon (IFN)-lambda takes the helm: immunomodulatory roles of type III IFNs. Front Immunol. 2017;8:1661.
- Tian S, Hui X, Fan Z, Li Q, Zhang J, Yang X, Ma X, Huang B, Chen D, Chen H. Suppression of hepatocellular carcinoma proliferation and hepatitis B surface antigen secretion with interferon-λ1 or PEG-interferon-λ1. FASEB j.. 2014;28(8):3528–3539. doi:10.1096/fj.14-250704.
- Bao M, Wang Y, Liu Y, Shi P, Lu H, Sha W, Weng L, Hanabuchi S, Qin J, Plumas J, et al. NFATC3 promotes IRF7 transcriptional activity in plasmacy--toid dendritic cells. J Exp Med. 2016;213(11):2383–2398. doi:10.1084/jem.20160438.
- Loo YM, Gale M Jr. Immune signaling by RIG-I-like receptors. Immunity. 2011;34(5):680–692. doi:10.1016/j.immuni.2011.05.003.
- Koch A, Jeschke J, Van Criekinge W, van Engeland M, De Meyer T. MEXPRESS update. Nucleic Acids Res. 2019 2019;47(W1):W561–W565. doi:10.1093/nar/gkz445.
- Gao J, Aksoy BA, Dogrusoz U, Dresdner G, Gross B, Sumer SO, Sun Y, Jacobsen A, Sinha R, Larsson E, et al. Integrative analysis of complex cancer genomics and clinical profiles using the cBioPortal. Sci Signal. 2013;6(269):pl1. doi:10.1126/scisignal.2004088.
- Cerami E, Gao J, Dogrusoz U, Gross BE, Sumer SO, Aksoy BA, Jacobsen A, Byrne CJ, Heuer ML, Larsson E, Antipin Y, Reva B, Goldberg AP, Sander C, Schultz N. The cBio cancer genomics portal: an open platform for exploring multidimensional cancer genomics data. Cancer Discov. 2012 May;2(5):401–4. doi:10.1158/2159-8290.CD-12-0095
- Zhou W, Ma Y, Zhang J, Hu J, Zhang M, Wang Y, Li Y, Wu L, Pan Y, Zhang Y, et al. Predictive model for inflammation grades of chronic hepatitis B: large-scale analysis of clinical parameters and gene expressions. Liver Int. 2017;37:1632–1641.
- Fekete JT, Ősz Á, Pete I, Nagy GR, Vereczkey I, Győrffy B. Predictive biomarkers of platinum and taxane resistance using the transcriptomic data of 1816 ovarian cancer patients. Gynecol Oncol. 2020;156:654–661.
- Ladner SK, Otto MJ, Barker CS, Zaifert K, Wang GH, Guo JT, Seeger C, King RW. Inducible expression of human hepatitis B virus (HBV) in stably transfected hepatoblastoma cells: a novel system for screening potential inhibitors of HBV replication. Antimicrob Agents Chemother. 1997;41:1715–1720.
- Yan Y, Allweiss L, Yang D, Kang J, Wang J, Qian X, Zhang T, Liu H, Wang L, Liu S, et al. Down-regulation of cell membrane localized NTCP expression in proliferating hepatocytes prevents hepatitis B virus infection. Emerging Microbes Infect. 2019;8:879–894.
- Cao L, Liu S, Li Y, Yang G, Luo Y, Li S, Du H, Zhao Y, Wang D, Chen J, et al. The nuclear matrix protein SAFA surveils viral RNA and facilitates immunity by activating antiviral enhancers and super-enhancers. Cell Host Microbe. 2019;26(3):369–384.e368. doi:10.1016/j.chom.2019.08.010.
- Qi Z, Li G, Hu H, Yang C, Zhang X, Leng Q, Xie Y, Yu D, Zhang X, Gao Y, et al. Recombinant covalently closed circular hepatitis B virus DNA induces prolonged viral persistence in immunocompetent mice. J Virol. 2014;88(14):8045–8056. doi:10.1128/JVI.01024-14.
- Fan Y, Mao R, Yu Y, Liu S, Shi Z, Cheng J, Zhang H, An L, Zhao Y, Xu X, et al. USP21 negatively regulates antiviral response by acting as a RIG-I deubiquitinase. J Exp Med. 2014;211(2):313–328. doi:10.1084/jem.20122844.
- You F, Wang P, Yang L, Yang G, Zhao YO, Qian F, Walker W, Sutton R, Montgomery R, Lin R, et al. ELF4 is critical for induction of type I interferon and the host antiviral response. Nat Immunol. 2013;14(12):1237–1246. doi:10.1038/ni.2756.
- Wang Y, Cheng J, Xu C, Liu S, Jiang S, Xu Q, Chen X, Zhuang H, Lu F. Quantitative methylation analysis reveals gender and age differences in p16INK4a hypermethylation in hepatitis B virus-related hepatocellular carcinoma. Liver Int. 2012;32(3):420–428. doi:10.1111/j.1478-3231.2011.02696.x.
- Huang L-R, Wu H-L, Chen P-J, Chen D-S. An immunocompetent mouse model for the tolerance of human chronic hepatitis B virus infection. Proc Natl Acad Sci USA. 2006;103(47):17862–17867. doi:10.1073/pnas.0608578103.
- Jiang S, Yang Z, Li W, Li X, Wang Y, Zhang J, Xu C, Chen P-J, Hou J, McCrae MA, et al. Re-evaluation of the carcinogenic significance of hepatitis B virus integration in hepatocarcinogenesis. PloS One. 2012;7(9):e40363. doi:10.1371/journal.pone.0040363.
- Zevini A, Olagnier D, Hiscott J. Crosstalk between cytoplasmic RIG-I and STING sensing pathways. Trends Immunol. 2017;38:194–205.
- Sato S, Li K, Kameyama T, Hayashi T, Ishida Y, Murakami S, Watanabe T, Iijima S, Sakurai Y, Watashi K, et al. The RNA sensor RIG-I dually functions as an innate sensor and direct antiviral factor for hepatitis B virus. Immunity. 2015;42(1):123–132. doi:10.1016/j.immuni.2014.12.016.
- Rehwinkel J, Tan CP, Goubau D, Schulz O, Pichlmair A, Bier K, Robb N, Vreede F, Barclay W, Fodor E, et al. RIG-I detects viral genomic RNA during negative-strand RNA virus infection. Cell. 2010;140(3):397–408. doi:10.1016/j.cell.2010.01.020.
- Chow KT, Gale M, Loo Y-M. RIG-I and other RNA sensors in antiviral immunity. Annu Rev Immunol. 2018;36(1):667–694. doi:10.1146/annurev-immunol-042617-053309.
- Perng Y-C, Lenschow DJ. ISG15 in antiviral immunity and beyond. Nat Rev Microbiol. 2018;16(7):423–439. doi:10.1038/s41579-018-0020-5.
- Reich NC. A death-promoting role for ISG54/IFIT2. J Interferon Cytokine Res. 2013;33(4):199–205. doi:10.1089/jir.2012.0159.
- Rao A, Luo C, Hogan PG. Transcription factors of the NFAT family: regulation and function. Annual Review of Immunology. 1997;15(1):707–747. doi:10.1146/annurev.immunol.15.1.707.
- Hou J, Zhou Y, Zheng Y, Fan J, Zhou W, Ng IL, Sun H, Qin L, Qiu S, Lee JF, et al. Hepatic RIG-I predicts survival and interferon-α therapeutic response in hepatocellular carcinoma. Cancer Cell. 2014;25(1):49–63. doi:10.1016/j.ccr.2013.11.011.
- Liu Z, Dou C, Jia Y, Li Q, Zheng X, Yao Y, Liu Q, Song T. RIG-I suppresses the migration and invasion of hepatocellular carcinoma cells by regulating MMP9. Int J Oncol. 2015;46(4):1710–1720. doi:10.3892/ijo.2015.2853.
- Bandi P, Pagliaccetti NE, Robek MD. Inhibition of type III interferon activity by orthopoxvirus immunomodulatory proteins. J Interferon Cytokine Res. 2010;30(3):123–134. doi:10.1089/jir.2009.0049.
- Colamonici OR, Domanski P, Sweitzer SM, Larner A, Buller RM. Vaccinia virus B18R gene encodes a type I interferon-binding protein that blocks interferon α Transmembrane Signaling. J Biol Chem. 1995;270(27):15974–15978. doi:10.1074/jbc.270.27.15974.
- Chow CW, Rincón M, Cavanagh J, Dickens M, Davis RJ. Nuclear accumulation of NFAT4 opposed by the JNK signal transduction pathway. Science (New York, NY). 1997;278(5343):1638–1641. doi:10.1126/science.278.5343.1638.
- Müller MR, Rao A. NFAT, immunity and cancer: a transcription factor comes of age. Nat Rev Immunol. 2010;10(9):645–656. doi:10.1038/nri2818.
- Levrero M, Zucman-Rossi J. Mechanisms of HBV-induced hepatocellular carcinoma. J Hepatol. 2016;64(1):S84–s101. doi:10.1016/j.jhep.2016.02.021.
- Macian F. NFAT proteins: key regulators of T-cell development and function, Nature reviews. Immunology. 2005;5(6):472–484. doi:10.1038/nri1632.
- Zanoni I, Granucci F. Regulation and dysregulation of innate immunity by NFAT signaling downstream of pattern recognition receptors (PRRs). Eur J Immunol. 2012;42:1924–1931.
- Knolle PA. Hitting the right button: MAVS-mediated defense against HAV infection. Cell Res. 2017;27(1):7–8. doi:10.1038/cr.2016.139.
- Ning S, Pagano JS, Barber GN. IRF7: activation, regulation, modification and function. Genes Immun. 2011;12:399–414.
- Luo J, Sun L, Lin X, Liu G, Yu J, Parisiadou L, Xie C, Ding J, Cai H. A calcineurin- and NFAT-dependent pathway is involved in α-synuclein-induced degeneration of midbrain dopaminergic neurons. Hum Mol Genet. 2014;23(24):6567–6574. doi:10.1093/hmg/ddu377.