
ABSTRACT
The understanding of the role of B cells in patients with solid tumors remains insufficient. We found that circulating B cells produced TNFα and/or IL-6, associated with unresponsiveness and poor overall survival of melanoma patients treated with anti-CTLA4 antibody. Transcriptome analysis of B cells from melanoma metastases showed enriched expression of inflammatory response genes. Publicly available single B cell data from the tumor microenvironment revealed a negative correlation between TNFα expression and response to immune checkpoint blockade. These findings suggest that B cells contribute to tumor growth via the production of inflammatory cytokines. Possibly, these B cells are different from tertiary lymphoid structure-associated B cells, which have been described to correlate with favorable clinical outcome of cancer patients. Further studies are required to identify and characterize B cell subsets and their functions promoting or counteracting tumor growth, with the aim to identify biomarkers and novel treatment targets.
Introduction
Tumor infiltrating B cells may be associated with favorable prognosis in cancer patients and mice .Citation1–4 B cells can produce antibodies and cytokines and are able to present antigens to T cells .Citation5 B cells with such properties are found within tertiary lymphoid structures (TLS). The presence of TLS in itself may also be associated with a favorable prognosis .Citation6 B cell zones can contain a germinal center and support the generation of memory B cells and B cell receptor class switching .Citation7,Citation8 In patients with lung cancer or melanoma, all common B cell subsets were observed, namely naïve and unswitched/switched memory B cells, and plasma cells .Citation8,Citation9 Activated B cells were able in vitro to present antigens from melanoma lysates to T cells and efficiently activate them .Citation10,Citation11 Higher clonality of CD4+ T cells was observed in lung cancer patients with TLS present in the tumor containing B cells continuously presenting antigens .Citation12 B cells were found to cross-present 30-mer peptides derived from the NY-ESO-1 antigen on MHC-I molecules to cytotoxic T lymphocytes in vitro .Citation13 It is thus important to consider potential contributions that B cells may provide in support of anti-tumor immune responses.
However, B cells may also promote tumor growth. They can produce IL-10 and/or TGFβ, which inhibit anti-tumor immune responses. Such B cells may be termed “regulatory B cells”. Unfortunately, no phenotypical markers are available for their identification, such that functional analyzes are necessary which represent additional methodological challenges .Citation14–18 B cells have been observed in the TME, inhibiting the conversion of cold to hot tumors by using intratumoral vaccination .Citation19 One study showed that a partial depletion of B cells using an anti-CD20 antibody (Rituximab) in colorectal patients led to a reduction in tumor burden in 50% of patients .Citation20 In metastatic melanoma this approach led to a decrease in tumor-associated inflammation .Citation21 The tumor promoting roles of B cells may be associated with their implications in chronic inflammation and/or T cell suppression. Indeed, B cells have been shown to induce a chronically inflamed tumor microenvironment (TME) via the production of cytokines or the generation of immune complexes .Citation21–23
Here we investigated phenotype and functionality of B cells from melanoma patients who received different therapies: 1) early stage patients (stage I/II) who were treated with virus-like particle vaccinesCitation24 , 2) advanced disease (stage III/IV) patients who were vaccinated with Melan-A peptide and adjuvants ;Citation25 and stage IV patients treated with the α-CTLA4 blocking antibody Ipilimumab .Citation26 We found that Ipilimumab non-responders had higher frequencies of TNFα and IL-6 producing peripheral B cells at baseline. Evidence for inflammatory cytokine producing B cells was also found in the other patient’s B cells from blood and tumors.
Materials and methods
Melanoma patients
Blood was obtained from melanoma patients included into two interventional clinical trials (LUD00-018, ClinicalTrials.gov NCT00112229 and CYT004-MelQbG10 04, NCT00306566) and one observational study (Ethics Committee number: 400/11). The patients included are hereby referred to as cohort 1 (Supplementary table 1). Patients from the observational study (400/11) were selected and studied separately and in more detail in cohort 2 (Supplementary table 2). Patients were enrolled upon written informed consent. Eligibility criteria and study design has been previously described .Citation24–26 The studies were designed, approved and conducted according to relevant regulatory standards approved by the Ethics Commission for Clinical Research of the Faculty of Medicine and University of Lausanne (Lausanne, Switzerland), Swissmedic (Swiss Agency for Therapeutic Product) and the Protocol Review Committee of the Ludwig Institute for Cancer Research (New York). Only baseline samples from before the trial treatment were used in this study. While patient samples were directly derived from venous blood samples, control PBMCs from healthy donors were isolated from blood concentrates obtained from the Blood Transfusion Center, Epalinges, Switzerland.
Human melanoma tissue specimens used for RNA sequencing and paired PBMC samples were collected in the framework of the observational study 87/06, approved by the Ethics Committee for Clinical Research of the Faculty of Biology and Medicine of the University of Lausanne. This is hereafter referred to as cohort 3 (Supplementary table 3).
The tissue and paired PBMC samples used for the flow cytometric analysis were collected prior to scheduled surgery as part of oncological treatment upon written informed consent, hereafter referred to as cohort 4 (Supplementary table 4).
Human cell preparation and flow cytometry
Patient or healthy donor PBMCs were isolated from whole blood cells by Lymphoprep (Axis-Shield) centrifugation gradient and cryopreserved in liquid nitrogen. Frozen PBMCs were thawed in a water bath at 37°C. Cells were kept overnight at 37°C and 5% CO2 in RPMI (Gibco), 10% FSC (Gibco) and 100 U/ml IL-2 (Proleukin). Cells were then stimulated for 14 hours with 3 µg/ml CpG 7909 (PF-3512676 provided by Pfizer and Coley Pharmaceutical Group, Wellesley MA), after which 50 ng/ml PMA (Sigma-Aldrich) and 500 ng/ml Ionomycin (Thermo Fischer) were added. After another two hours 2 nM Monensin (Sigma-Aldrich) and 10 µg/ml Brefeldin A (Sigma-Aldrich) were added for another 4 hours. Control samples were kept in RPMI with 10% FSC. Monensin and Brefeldin A were added at the same time point as their stimulated counterpart.
The first step in the staining for flow cytometry analysis was the blocking of the Fc-receptor to avoid unspecific staining using an Fc-blocking reagent (Miltenyi, 130–059-901). The following antibodies were used for the phenotyping and functional characterization of B cells from PBMCs and human melanoma tissue specimens, including the extracellular antibodies against: CD3 (BD Biosciences Cat# 557832, RRID:AB_396890), CD3 (BD Biosciences Cat# 562994, RRID:AB_2737938), CD4 (BioLegend Cat# 317436, RRID:AB_2563050), CD4 (BD Biosciences Cat# 562970, RRID:AB_2744424), CD8 (BioLegend Cat# 344732, RRID:AB_2564624), CD8 (Beckman Coulter Cat# 737659, RRID:AB_2751015), CD8 (Beckman Coulter Cat# 737661, RRID:AB_1575980), CD14 (Beckman Coulter Cat# B01175, RRID:AB_2728099), CD19 (BioLegend Cat# 302208, RRID:AB_314238), CD27 (Thermo Fisher Scientific Cat# 61–0279-42, RRID:AB_2574546), CD5 (Miltenyi Biotec Cat# 130–099-972, RRID:AB_2660340), CD38 (Thermo Fisher Scientific Cat# 56–0389-42, RRID:AB_10804040), IgD (BD Biosciences Cat# 555778, RRID:AB_396113), CD126 (IL6-R) (BD Biosciences Cat# 551850, RRID:AB_394271) and PD-1 (BioLegend Cat# 329920, RRID:AB_10960742). After staining with extracellular antibodies, a live/dead staining (LIVE/DEAD™ Fixable Near-IR Dead Cell Thermo Fisher Scientific Cat# L-34975) was performed. Cells were fixed at RT during 30 minutes (FoxP3 intracellular staining kit, eBioscience). Intracellular staining was performed at room temperature (RT) during 30 minutes in FoxP3 intracellular staining kit permeabilisation buffer (eBioscience). Antibodies used for intracellular staining include: T-bet (BD Biosciences Cat# 562467, RRID:AB_2737621), IL-2 (BD Biosciences Cat# 554565, RRID:AB_395482), IL-2 (BioLegend Cat# 500332, RRID:AB_2563877), IL-6 (BioLegend Cat# 501106, RRID:AB_315154), IL-10 (BioLegend Cat# 506804, RRID:AB_315454), IFNγ (BD Biosciences Cat# 557844, RRID:AB_396894), TNFα (BD Biosciences Cat# 557996, RRID:AB_396978), LTα (Thermo Fisher Scientific Cat# BMS105FI, RRID:AB_10598519) and IDO (a kind gift of Prof. Van den Eynde, Ludwig Institute for Cancer Research Brussels).
Cells were acquired using the Gallios flow cytometer or the CytoFLEX S (Beckman Coulter) and analyzed using FlowJo 10.4.2 (FlowJo LCC).
Cell sorting and RNA sequencing
Tumor-infiltrating lymphocytes were prepared after finely mincing surgery specimens to yield a single cell suspension, which was cryopreserved on the same day as the surgery was performed. In short, cells were thawed and rested overnight in RPMI and FCS. B cells were sorted based on the expression of CD19 (Beckman Coulter Cat# A96418, RRID:AB_2728101) and CD45 (Biolegend Cat# 304012, RRID: AB_314400), only in case of tumor material, using the Astrios (BD Bioscience). Cells were sorted directly into RNA later (Invitrogen, AM7020) to conserve RNA upon cryopreservation at −80°C. RNA was extracted using the RNeasy Plus Micro kit (Qiagen, 74034) following the manufacturer’s protocol. Quality of RNA was tested using a fragment analyzer (Advanced Analytical). Total RNA from all samples used for sequencing had an RQN ≥ 7. Libraries were obtained using the Clontech SMART-Seq v4 (Takara). Single-end sequencing (100bp) was performed using an Illumina HiSeq 2500 sequencer. These last two steps were performed at the Lausanne Genomics Technologies Facility (UNIL, Lausanne).
Transcript quantification was performed using Kallisto .Citation27 In brief, target transcript sequences were obtained from ENSEMBL (GRCh38.p12), and the abundance of transcripts was quantified using Kallisto 0.44.0 with sequence-based bias correction. All other parameters were set to default when running Kallisto. Kallisto’s transcript-level estimates were further summarized at the gene-level using tximport 1.8.0 .Citation28 For downstream analyses, lowly abundant genes were filtered out, library size normalization and variance stabilization were performed using the regularized log transformation from DESeq2 1.22.0, Citation29 and unwanted variation was estimated and regressed out using SVA 3.30.0 .Citation30 ENSEMBL gene ids were converted to gene symbol using org.Hs.eg.db 3.8.2 .Citation31 If a gene symbol was associated with more than one ENSEMBL id, the ENSEMBL id with maximum variance was retained using the collapseRows functionality within the WGCNA R package .Citation32 Differential expression analysis was performed using limma 3.38.1 from Bioconductor .Citation33 Significant genes were identified using an adjusted p-value of 0.05 and log2FoldChange of 1. Gene Set Enrichment Analysis (GSEA) was performed using fgsea 1.8.0 package from Bioconductor with limma’s t-statistic as gene-level statistic .Citation34 Signaling pathways analyzed by GSEA were obtained from the Hallmark gene sets of the MSigDB .Citation35 Heatmap was generated using the pheatmap R Package, Citation36 with clustering distance and method set to Euclidean and ward.D2, respectively. Volcano plots were generated using the ggrepel R package .Citation37 Both raw and processed RNA-seq data have been deposited to Gene Expression Omnibus and will be accessible under accession number GSE157236.
To investigate differences in the expression of IDO1, CSF2, TNF, IL-6, IL-10, IL-2 and LTA in B cells associated with response status (responsive or non-responsive), we used the processed single cell RNA sequencing data reported by Sade-Feldman et al, Citation1 consisting of the expression profiles of 16,291 immune cells from 48 tumor samples of melanoma patients treated with checkpoint inhibitors. We selected the expression profile of 1,379 cells classified as B cells according to the unsupervised clustering of CD45+ cells reported in the study. Then, we used the ‘glmmTMB’ R package to fit a zero inflated generalized linear mixed model to these profiles, setting response status as fixed effects and patient as a random effect .Citation38 To obtain the distributions of mean gene expression by fixed effect level, we used the ‘emmeans’ R package, which estimates marginal means based on the predictions of the fitted model .Citation39
Statistics and analysis
Significance of 2-group comparisons was assessed using the Mann–Whitney test, whereas multi-group comparisons were achieved using the Kruskal-Wallis test, within the GraphPad Prism 8 software. Analysis of co-expression of cytokines was performed using spice version 5.1 .Citation40 Overall survival (OS) was defined as the time between sampling and latest follow-up and death. The significance of Kaplan-Meier survival analysis was assessed by the Log-rank test (within GraphPad Prism 8).
Results
Circulating B cells from melanoma patients show different frequencies, differentiation and functionality depending on disease stage
We first focused on B cells and their subsets from blood because of their easy accessibility and high prevalence, allowing to characterize patient’s B cells both phenotypically and functionally. As we were primarily interested in prognosis and treatment prediction, we used baseline samples and did not analyze post-treatment specimens. Detailed information of the patients is provided in Supplementary table 1. B cells were identified as CD19 positive and their subsets like naïve, unswitched memory and switched memory B cells as IgD+CD27−, IgD+CD27+ and IgD−CD27+, respectively ()). Looking at the different subsets, we observed a decrease in B cell frequencies in stage IV patients (cohort 1, as described in Materials & Methods) compared to healthy donors ()). Analyzing B cell subsets, we observed a difference in unswitched memory B cells, with higher frequencies in stage I/II compared to stage III and IV patients ()). An inverse association could be observed in naïve B cells. Here we saw a significant increase in frequencies in stage III and IV patients compared to stage I patients ()). Phenotypically, we found an increased frequency of IL-6 receptor expression by B cells from stage IV patients compared to stage III patients ()). We did not observe any significant differences in expression of CXCR3, Fas receptor, t-bet or PD-1 (Supplementary figure 1A). While we did not see significant differences depending on gender (data not shown), we could not exclude that the decrease in B cell frequencies in more advanced disease stages was biased by higher patient age. Indeed, B cell frequencies may be lower in the elderly .Citation41,Citation42 We found an inverse correlation between the age at diagnosis and the frequency of B cells (Supplementary figure 1B). Since we were not allowed to know the healthy donor’s age, we could not determine an eventual association with age. However, in agreement with the decrease of B cells in the more advanced disease stages, we also found a negative correlation between B cell frequencies and the LDH values of the same patient, supporting the notion that B cell frequencies decrease with a higher disease burden (Supplementary figure 1B).
Figure 1. B cell frequency, differentiation, phenotype and functionality in peripheral blood of melanoma patients. (a). B cells were identified as CD19+ and subtyped for naïve (IgD+CD27−), unswitched memory (IgD+ CD27+) and switched memory (IgD− CD27+) B cells. (b). B cell frequencies in blood as measured by flow cytometry from healthy donors (n = 34) and patients (n = 56), patients were further subdivided based on stage, including stage I/II (n = 8), III (n = 21) and IV (n = 27). (c). B cell differentiation as measured by flow cytometry and represented as frequency of B cells shown as naïve, switched and unswitched memory cells. Frequencies were analyzed from healthy donors (n = 34) and patients (n = 56), patients were further subdivided based on stage, including stage I/II (n = 8), III (n = 21) and IV (n = 27). (d). B cell phenotypes and function, assessed by flow cytometry, showing IL-6 R expressing B cells and analyzed from healthy donors (n = 21) and patients (n = 45), with stage I/II (n = 8), III (n = 13) and IV (n = 24). Cytokine production was assessed after stimulation with CpG (14 hours) and supplementary addition of PMA and ionomycin for 4 hours by flow cytometry in samples from healthy donors (n = 21) and patients (n = 45), with stage I/II (n = 8), III (n = 13) and IV (n = 24). For IL-10 the sample numbers were different: healthy donors (n = 33) and patients (n = 49), with stage I/II (n = 8), III (n = 15) and IV (n = 26). * p < .05, ** p < .01, *** p < .001 as determined by Kurskal-Wallis test
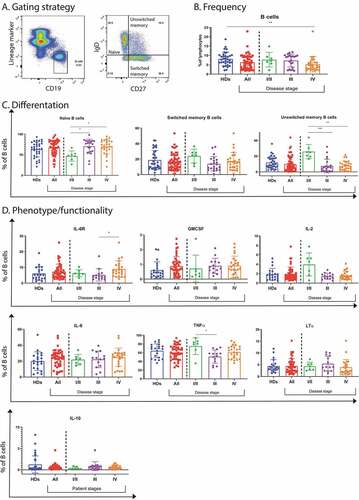
Since only little is known about B cell functionality in cancer, we stimulated B cells and analyzed the production of GMCSF, IL-2, IL-6, TNFα, LTα and IL-10. We found no significant differences between patients and healthy donors, except a reduced TNFα production in stage III patients when compared to stage I/II patients ()). Together, these findings show that B cells from melanoma patients are generally capable of producing cytokines.
Inflammatory cytokine production by circulating B cells correlates with non-responsiveness and short survival of patients treated with anti-CTLA4
Treatment with immune checkpoint blockade (ICB) provides clinical benefit in significant fractions of patients .Citation43 To search for correlations of B cell characteristics with responsiveness to Ipilimumab (anti-CTLA4), we compared B cells from patients responding positively to Ipilimumab with the ones showing no benefit (cohort 2; Supplementary table 2).
Consistent with our results in cohort 1, we found that the frequencies of circulating B cells were decreased in the patients of cohort 2 at baseline ()). The differentiation stages were similar as in healthy donors ()). However, the patient’s B cells showed increased expression of CXCR3, Fas receptor and IL-6 receptor ()). We did not find any significant differences in PD-1, t-bet or cytokine expression in comparison to healthy donors (Supplementary figure 2A). Significantly higher expression of Fas receptor or IL-6 receptor on patient’s B cells seems to indicate activated B cells, trafficking to the site of inflammation as suggested by a higher presence of the chemokine receptor CXCR3 on the patient’s B cell surface.
Figure 2. Circulating B cell frequency, differentiation, phenotype and response to anti-CTLA4 therapy in melanoma patients. (a). B cell frequency and differentiation as measured by flow cytometry including naïve, unswitched and switched memory B cells in healthy donors (n = 34) and patients (n = 21). (b). Phenotypical markers as assessed by flow cytometry including Fas receptor (CD95) and IL-6 receptor from healthy donors (n = 21) and patients (n = 22) as well as CXCR3 from healthy donors (n = 17) and patients (n = 14). (c). IL-6 receptor and cytokine expressing B cells in patients. They were defined as responders (R) (n = 8) when they had complete response, dissociated disease [at the same time presence of progression of some lesion(s) and of regression of other lesion(s)] or partial response. Non-responsive patients (NR) (n = 14) were defined when they had progressive disease. (d). Kaplan-Meier curves of overall survival of patients with lower (blue) or higher (red) frequencies of TNFα+ or IL-6+ B cells than the median. * p < .05, ** p < .01, *** p < .001 as determined by Mann-Whitney test
![Figure 2. Circulating B cell frequency, differentiation, phenotype and response to anti-CTLA4 therapy in melanoma patients. (a). B cell frequency and differentiation as measured by flow cytometry including naïve, unswitched and switched memory B cells in healthy donors (n = 34) and patients (n = 21). (b). Phenotypical markers as assessed by flow cytometry including Fas receptor (CD95) and IL-6 receptor from healthy donors (n = 21) and patients (n = 22) as well as CXCR3 from healthy donors (n = 17) and patients (n = 14). (c). IL-6 receptor and cytokine expressing B cells in patients. They were defined as responders (R) (n = 8) when they had complete response, dissociated disease [at the same time presence of progression of some lesion(s) and of regression of other lesion(s)] or partial response. Non-responsive patients (NR) (n = 14) were defined when they had progressive disease. (d). Kaplan-Meier curves of overall survival of patients with lower (blue) or higher (red) frequencies of TNFα+ or IL-6+ B cells than the median. * p < .05, ** p < .01, *** p < .001 as determined by Mann-Whitney test](/cms/asset/60a09e44-222a-4d01-8228-6ca9c7ae586c/koni_a_1873585_f0002_oc.jpg)
We analyzed associations between B cell frequency, phenotype and functionality with response to ICB. We discovered that peripheral B cells from patients not responding to treatment exhibited a higher expression of IL-6 R and had a higher frequency of B cells producing TNFα and IL-6. We also observed a trend for increased LTα expression ()). Additionally, we found a positive trend, albeit not significant, for higher IL-2 production by B cells from responding patients ()). We did not see significant differences between responders and non-responders when looking at frequencies of B cells subsets and expression of CXCR3, PD-1, Fas receptor, IL-10 and GMCSF (Supplementary figure 2B). Additionally, we did not find any significant differences between the numbers of B cells and their subsets in responder or non-responder patients (Supplementary figure 2B). Together, our data show that inflammatory cytokine producing B cells were more prevalent in non-responder patients. Interestingly, responder patients showed a trend for more IL-2 production ()), a cytokine that supports T cell responses. Finally, we found negative correlations of IL-6 and TNFα levels with overall patient survival ()). Thus, inflammatory B cells, especially producing IL-6 and TNFα, were negatively associated with clinical outcome and could therefore be considered as potential biomarkers.
B cells from the TME show enriched expression of inflammatory and proliferative genes
Besides the results of circulating B cells that potentially reflect systemic immune reactions, we analyzed B cells from the TME. To our knowledge, sorted B cells from the TME have not been profiled to this date. Therefore, we sorted and sequenced B cells from melanoma metastases (n = 5), in parallel with B cells from blood of autologous stage III/IV melanoma patients (n = 5) and healthy donors (n = 4). Clinical data from the corresponding patients (cohort 3) are shown in Supplementary table 3.
We performed paired comparison of TME B cells with autologous blood B cells from the same 5 melanoma patients. The first principle component of our PCA analysis shows that samples segregate based on the origin of the sample (blood or TME) and not per patient ()). 91 genes were differentially over-expressed in tumors compared to blood based on an adjusted p-value of 0.05 and a log fold change of 1. The most interesting hits are indicated on a volcano plot ()). The significantly differentially expressed genes are listed in Supplementary table 5. GSEA shows the presence of some important hallmarks, like Myc targets and IFN α/γ response as well as a downregulation of TGF-β signaling ()).
Figure 3. RNA sequencing analysis of B cells sorted from the TME, patient’s blood and healthy donor’s blood. (a). PCA analysis of B cells from the TME (red) and from the patient’s blood (black). (b). Volcano plot representation of the differential gene expression in B cells from the TME to B cells from patient’s blood. Adjusted p-value cutoff is 0.05 and log2(fold change) of −1 and 1. Hits passing these thresholds are represented in blue. (c). Bar graph representation of statistically significant enriched gene sets in B cells from the tumor compared to B cells from the patient’s blood. (d). PCA analysis of B cells from patient’s blood (red) and from healthy donor blood (black). (e). Volcano plot representation of the differential gene expression from B cells from patient’s blood to B cells from healthy donor blood. Adjusted p-value cutoff is 0.05 and log2(fold change) of −1 and 1. Hits passing these thresholds are represented in blue. (f). Bar graph representation of statistically significantly enriched gene sets in B cells from patient’s blood to B cells from healthy donor blood. (g). Venn diagram of up-and downregulated genes in B cells from patient’s blood compared to B cells from healthy donor’s blood as well as B cells from the tumor to B cells from the patient’s blood. Genes were considered significantly upregulated if the adjusted p-value<0.05 and log2(fold change)>1. Genes were considered significantly downregulated if the adjusted p-value<0.05 and log2(fold change)<-1. The total number of differently expressed genes is also indicated. H. Lists of up- and downregulated genes shown in Figure 3 G
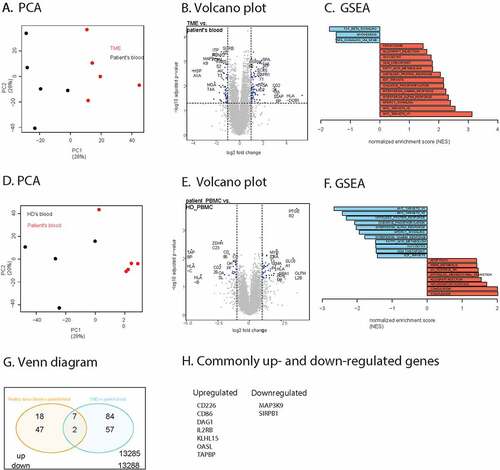
Some of the differences may be due to the fact that we compared cells from tissue versus blood samples. To further focus on disease specific properties, we compared blood B cells from patients with blood B cells from healthy donors. Based on PCA analysis, we found that patient samples cluster together and away from healthy donor samples ()). We found 49 genes that were differentially over-expressed with an adjusted p-value smaller than 0.05 and a log fold change bigger than 1 ()). A full list of these genes is provided in Supplementary table 6. GSEA analysis shows various enrichments such as of complement and inflammatory response genes ()).
Venn analysis of the overlap between over and under-expressed B cell genes shows that two genes were commonly downregulated in patient blood versus healthy donor blood and in the TME versus patient blood ()). Seven genes were commonly upregulated, including the costimulatory molecule CD86 and the IL-2 receptor beta-chain ()).
Thus, even though tissue specific effects may play a role, we find increased expression of inflammatory and IFNγ/α response genes, suggesting that B cells are active and probably producing cytokines. An inflammatory profile was also found in circulating B cells of the non-responding cohort 3 patients by flow cytometry. Therefore, we found that both B cells from the TME and peripheral blood showed inflammatory properties.
B cells from the TME are functional and their TNFα production correlates with response to ICB treatment failure
In order to determine whether we can find further correlations between inflammatory B cells and outcome to ICB treatment, we used the publicly available single cell RNA sequencing dataset published by Sade-Feldman et al .Citation1 We investigated B cell functionality genes, as previously analyzed, like GMCSF, TNFα, LTα, IL-6, IL-2 and IL-10. We found that TNFα correlated with non-response and IL-2 with response to ICB treatment ()). Most of these patients were treated with anti-PD-1 antibodies (i.e. 35 anti-PD-1, 11 anti-CTLA4 + PD-1, and 2 anti-CTLA4) .Citation1 Therefore, also within the TME, TNFα producing B cells negatively correlated with immunotherapy outcome.
Figure 4. A. Distribution of mean gene expression in 1,379 single B cells, by response status (444 cells come from non-responders (NR) and 935 come from responders (R)). Mean expression values were estimated after fitting a zero inflated generalized linear mixed model to the expression profiles of B cells, setting response status as fixed effects and patient as a random effect. The bars represent the confidence intervals of the estimated means. B. Co-expression of cytokines as produced by B cells from respectively the peripheral blood of healthy donors (n = 3) or patients (n = 14), or the TME (n = 10)
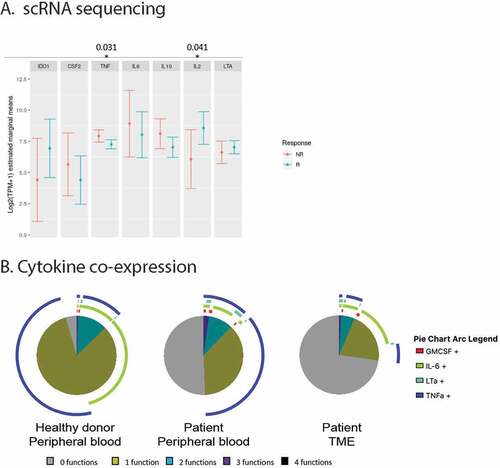
Based on these mRNA data, we performed flow cytometric analyzes to determine cytokine production at the protein level by TME derived B cells from cohort 4 patients, as well as paired blood B cells. Clinical data of the patients included in this cohort is shown in Supplementary table 4. We confirmed the presence of naïve and memory (unswitched and switched) B cell subsets (Supplementary figure 3A). Moreover, B cells from the TME were capable of producing cytokines like GMCSF, IL-2, IL-6, LTα and TNFα. The B cells from the TME expressed inflammatory cytokines, although in part at lower levels than circulating B cells (Supplementary figure 3B). Co-expression of cytokines showed that almost all peripheral B cells from healthy donors produced at least one of the analyzed cytokines. While single cytokine producers dominated, some B cells showed simultaneous production of TNFα and IL-6 ()). In patients, the frequencies of functional B cells were lower, but many B cells were nevertheless capable of producing TNFα, IL-6, LTα and/or GMCSF ()). Larger numbers of tumor biopsies would be required in order to confirm by flow cytometry that patients with weaker inflammatory cytokine production by their B cells have a better clinical outcome, as we found with mRNA data. Moreover, more research is required to distinguish inflammatory B cells from B cells within the TLS that appear to have anti-tumorigenic roles.
Discussion
B cells make up an important part of the adaptive immune system. Their role and function in the immune response to cancer still remain unclear. We found that circulating B cells from melanoma patients are often functional, as they produce GMCSF, IL-2, IL-6, TNFα, LTα and IL-10. Furthermore, we observed a correlation between treatment failure to anti-CTLA4 therapy and inflammatory circulating B cells, and inverse correlations of B cells producing IL-6 and TNFα with overall patient survival. IL-6 is able to inhibit apoptosis in cancer cells as well as to induce angiogenesis. Its presence, as also measured in sera, is often associated with progression in melanoma .Citation44 IL-6 also induces the transcription factor c-Maf in T cells which promotes CD4 Th17 cells and CD8 T cell exhaustion .Citation45,Citation46 TNFα induces immune-regulatory genes in melanoma .Citation47 Even though TNFα is able to induce apoptosis in tumor cells, prolonged exposure may induce survival molecules like anti-apoptotic proteins, proangiogenic factors and metastasis markers .Citation48
For profiling of cells from the TME, we performed RNA sequencing of sorted B cells from melanoma tumors. We found enriched expression of IFNα/γ response genes as well as Myc target genes in B cells from the TME compared to autologous blood B cells, suggesting that B cells are active and produce cytokines in tumors. Furthermore, enrichment of inflammatory response and complement genes were found in B cells from patients as compared to healthy donors, indicating that also at a systemic level B cells are impacted and activated. Finally, single cell RNA sequencing data analysis from B cells from the TME showed that TNFα producing B cells inversely correlated with ICB treatment outcome. Thus, also in the TME, inflammatory B cells may promote resistance to immunotherapy.
Sustained inflammation has been suggested as an emerging hallmark of cancer by Hanahan and Weinberg .Citation49 Previous studies described a role for inflammatory B cells in cancer progression. For example, B cells form immune complexes that can regulate myeloid cell infiltration and chronic inflammation, as shown in a murine squamous carcinoma model. Therapeutic depletion of B cells in this model led to an improved cytotoxic T cell response and improved response to chemotherapy .Citation50,Citation51
On the other hand, IL-2 transcripts in B cells correlated with treatment response, suggesting that these B cells could be involved in T cell activation, a role described for B cells present in TLS, a privileged site for antigen presentation to T cells by DCs, as well as a place for the formation of germinal centers leading to local antibody production in the B cell rich zone. The presence of TLS in different types of cancers is mostly described as a positive prognostic marker .Citation52 Recent evidence shows a positive role for B cells in the TLS and its association with response to ICB. It seems that especially memory and plasma cells contribute to this mechanism .Citation53 However, the functional mechanisms of these B cells remain to be fully elucidated.
While analyzing the B cell cluster from single cell RNA sequencing data of patients treated with ICBCitation1 we found that TNFα transcripts negatively correlated with treatment failure. Even though B cells from the TME showed reduced activation levels as compared to B cells from blood of patients and healthy donors (at the protein level), they were still able to produce inflammatory cytokines. It may not be surprising that the cellular functions in the B cells of the TME were lower than in circulating cells, as similar findings were made for other cell types, particularly for T cells .Citation54
Recent studies on B cells in cancer mostly focused on their anti-tumor associations and functions, which seem to be primarily attributed to B cells found within TLS .Citation53,Citation55 Additionally, two clinical trials have used Rituximab (anti-CD20 monoclonal antibody) in metastatic melanoma patients to target a rare population of CD20-expressing melanoma cells .Citation56,57 The therapies also effectively depleted B cells from the periphery. Even though the clinical results are not conclusive due to the small patient numbers, it seems that depleting B cells did not worsen the clinical outcome. The question whether B cells can be safely targeted deserves more studies.
Specific cell surface markers would improve the distinction of the different B cell subsets, for further investigating their importance, their micro-anatomical location and interactions, and underlying mechanisms. Unfortunately, the surface markers tested in our study (IL-6 R, CD95, PD-1, CXCR3) did not correlate with the production of proinflammatory cytokines (IL-6, TNFα, LTα). Nevertheless, our findings on inflammatory B cells may be considered for ICB outcome prediction. Future studies may determine the functionality of inflammatory B cells in more detail to reach a thorough understanding of their roles in tumor immunology.
Supplemental Material
Download ()Acknowledgments
We thank the patients and donors of healthy blood for their dedicated collaboration. The authors gratefully acknowledge Nicole Montandon for sample processing. We also thank Karin de Visser, Olaia Naveiras, Werner Held and Martin Bachmann for collaboration, support and expert advice.
Disclosure statement
The authors declare no potential conflicts of interest.
Supplementary material
Supplemental data for this article can be accessed on the publisher’s website.
Additional information
Funding
References
- Sade-Feldman M, Yizhak K, Bjorgaard SL, Ray JP, de Boer CG, Jenkins RW, Lieb DJ, Chen JH, Frederick DT, Barzily-Rokni M, et al. Defining T cell states associated with response to checkpoint immunotherapy in melanoma. Cell. 2018;175(4):998–11. doi:10.1016/j.cell.2018.10.038.
- Guy TV, Terry AM, Bolton HA, Hancock DG, Shklovskaya E, Fazekas de St Groth B. Pro- and anti-tumour effects of B cells and antibodies in cancer: a comparison of clinical studies and preclinical models. Cancer Immunol Immunother. 2016;65(8):885–896. doi:10.1007/s00262-016-1848-z.
- DiLillo DJ, Yanaba K, Tedder TF, Cells Are B. Required for optimal CD4 + and CD8 + T cell tumor immunity: therapeutic B cell depletion enhances B16 melanoma growth in mice. J Immunol. 2010;184:4006–4016. doi:10.4049/jimmunol.0903009.
- Fremd C, Schuetz F, Sohn C, Beckhove P, Domschke C. B cell-regulated immune responses in tumor models and cancer patients. Oncoimmunology. 2013. doi:10.4161/onci.25443.
- Tokunaga R, Naseem M, Lo JH, Battaglin F, Soni S, Puccini A, Berger MD, Zhang W, Baba H, Lenz H-J, et al. B cell and B cell-related pathways for novel cancer treatments. Cancer Treat Rev. 2019;73:10–19. doi:10.1016/j.ctrv.2018.12.001.
- Dieu-Nosjean MC, Giraldo NA, Kaplon H, Germain C, Fridman WH, Sautès-Fridman C. Tertiary lymphoid structures, drivers of the anti-tumor responses in human cancers. Immunol Rev. 2016;271:260–275. doi:10.1111/imr.12405.
- Germain C, Gnjatic S, Dieu-Nosjean MC. Tertiary lymphoid structure-associated B cells are key players in anti-tumor immunity. Front Immunol. 2015;6:1–14. doi:10.3389/fimmu.2015.00067.
- Cipponi A, Mercier M, Seremet T, Baurain JF, Theáte I, Van Den Oord J, et al. Neogenesis of lymphoid structures and antibody responses occur in human melanoma metastases. Cancer Res. 2012;72:3997–4007. doi:10.1158/0008-5472.CAN-12-1377.
- Coughlin CM, Vance BA, Grupp SA, Vonderheide RH. RNA-transfected CD40-activated B cells induce functional T-cell responses against viral and tumor antigen targets: implications for pediatric immunotherapy. Blood. 2004;103(6):2046–2054. doi:10.1182/blood-2003-07-2379.
- Schultze JL, Seamon MJ, Nadler LM, Gribben JG, Delgado JC, Daley J, Delgado JC, Gribben JG, Nadler LM. CD40-activated human B cells: an alternative source of highly efficient antigen presenting cells to generate autologous antigen-specific T cells for adoptive immunotherapy. J Clin Invest. 1997;100:2757–2765. doi:10.1172/JCI119822.
- Zhu W, Germain C, Liu Z, Sebastian Y, Devi P, Knockaert S, Brohawn P, Lehmann K, Damotte D, Validire P, et al. A high density of tertiary lymphoid structure B cells in lung tumors is associated with increased CD4+T cell receptor repertoire clonality. Oncoimmunology. 2015; 4. doi:10.1080/2162402X.2015.1051922
- Gnjatic S, Atanackovic D, Matsuo M, Jager E, Lee SY, Valmori D, Chen Y-T, Ritter G, Knuth A, Old LJ, et al. Cross-presentation of HLA class I epitopes from exogenous NY-ESO-1 polypeptides by nonprofessional APCs. J Immunol. 2003;170(3):1191–1196. doi:10.4049/jimmunol.170.3.1191.
- Sarvaria A, Madrigal JA, Saudemont A. B cell regulation in cancer and anti-tumor immunity. Cell Mol Immunol. 2017;14(8):662–674. doi:10.1038/cmi.2017.35.
- He Y, Qian H, Liu Y, Duan L, Li Y, Shi G. The roles of regulatory B cells in cancer. J Immunol Res. Hindawi Publishing Corporation. 2014;2014:1–7. doi:10.1155/2014/215471.
- Wang W, Yuan X, Chen H, Xie G, Ma Y, Zheng Y. Regulatory B cells accelerate hepatocellular carcinoma progression via CD40/CD154 signaling pathway. Cancer Lett. 2014;355:264–272. doi:10.1016/j.canlet.2014.09.026.
- Zhou X, Su YX, Lao XM, Liang YJ, Liao GQ. CD19+IL-10+regulatory B cells affect survival of tongue squamous cell carcinoma patients and induce resting CD4+T cells to CD4+Foxp3+regulatory T cells. Oral Oncol. 2016;53:27–35.
- Shao Y, Lo CM, Ling CC, Liu XB, Ng KTP, Chu ACY, et al. Regulatory B cells accelerate hepatocellular carcinoma progression via CD40/CD154 signaling pathway. Cancer Lett. 2014;355:264–272.
- Newman JH, Chesson CB, Herzog NL, Bommareddy PK, Aspromonte SM Intratumoral injection of the seasonal flu shot converts immunologically cold tumors to hot and serves as an immunotherapy for cancer. 2020;117:1–10.
- Barbera-guillem E, Nelson MB, Barr B, Nyhus K, May KF, Feng L, Sampsel JW. B lymphocyte pathology in human colorectal cancer. Experimental and clinical therapeutic effects of partial B cell depletion. Cancer Immunol Immunother Imm. 2000;48:541–549. doi:10.1007/PL00006672.
- Griss J, Bauer W, Wagner C, Simon M, Chen M, Grabmeier-Pfistershammer K, Maurer-Granofszky M, Roka F, Penz T, Bock C, et al. B cells sustain inflammation and predict response to immune checkpoint blockade in human melanoma. Nat Commun. 2019;10(1). doi:10.1038/s41467-019-12160-2.
- Andreu P, Johansson M, Affara NI, Pucci F, Tan T, Junankar S, Korets L, Lam J, Tawfik D, DeNardo DG, et al. FcRγ activation regulates inflammation-associated squamous carcinogenesis. Cancer Cell. 2010;17(2):121–134. doi:10.1016/j.ccr.2009.12.019.
- De Visser KE, Korets LV, Coussens LM. De novo carcinogenesis promoted by chronic inflammation is B lymphocyte dependent. Cancer Cell. 2005;7(5):411–423. doi:10.1016/j.ccr.2005.04.014.
- Braun M, Jandus C, Maurer P, Hammann-Haenni A, Schwarz K, Bachmann MF, Speiser DE, Romero P. Virus-like particles induce robust human T-helper cell responses. Eur J Immunol. 2012;42(2):330–340. doi:10.1002/eji.201142064.
- Baumgaertner P, Jandus C, Rivals JP, Derré L, Lövgren T, Baitsch L, Guillaume P, Luescher IF, Berthod G, Matter M, et al. Vaccination-induced functional competence of circulating human tumor-specific CD8 T-cells. Int J Cancer. 2012;130:2607–2617. doi:10.1002/ijc.26297.
- Romano E, Kusio-Kobialka M, Foukas PG, Baumgaertner P, Meyer C, Ballabeni P, Michielin O, Weide B, Romero P, Speiser DE, et al. Ipilimumab-dependent cell-mediated cytotoxicity of regulatory T cells ex vivo by nonclassical monocytes in melanoma patients. Proc Natl Acad Sci. 2015;112(19):6140–6145. doi:10.1073/pnas.1417320112.
- Bray NL, Pimentel H, Melsted P, Pachter L. Near-optimal probabilistic RNA-seq quantification. Nat Biotechnol. 2016;34(5):525–527. doi:10.1038/nbt.3519.
- Soneson C, Love MI, Robinson MD Differential analyses for RNA-seq : transcript-level estimates improve gene-level inferences. F1000 Res. 2015;1–10.
- Love MI, Huber W, Anders S. Moderated estimation of fold change and dispersion for RNA-seq data with DESeq2. Genome Biol. 2014;15(12):550. doi:10.1186/s13059-014-0550-8.
- Leek JT, Johnson WE, Parker HS, Jaffe AE, Storey JD. The SVA package for removing batch effects and other unwanted variation in high-throughput experiments. Bioinformatics. 2012;28(6):882–883. doi:10.1093/bioinformatics/bts034.
- Carlson M org.Hs.eg.db: Genome wide annotation for Human. R Packag. version 3.8.2. 2019.
- Salomon DR, Kurian SM, Cai C, Geschwind DH, Langfelder P, Miller JA, et al. Strategies for aggregating gene expression data: the collapseRows R function. BMC Bioinform. 2011. doi:10.1186/1471-2105-12-322.
- Ritchie ME, Phipson B, Wu D, Hu Y, Law CW, Shi W, Smyth GK. Limma powers differential expression analyses for RNA-sequencing and microarray studies. Nucleic Acids Res. 2015;43(7):e47. doi:10.1093/nar/gkv007.
- Sergushichev AA An algorithm for fast preranked gene set enrichment analysis using cumulative statistic calculation. bioRxiv. 2016;060012.
- Liberzon A, Birger C, Thorvaldsdóttir H, Ghandi M, Mesirov JP, Tamayo P. The molecular signatures database hallmark gene set collection. Cell Syst. 2015;1:417–425. doi:10.1016/j.cels.2015.12.004.
- Kolde R. Package ‘ pheatmap ’ [Internet]. 2018. Available from: https://cran.mtu.edu/web/packages/pheatmap/index.html
- Slowikowski K, Schep A, Hughes S, Lukauskas S, Irisson J-O, Kamvar ZN, et al. ggrepel: Automatically Position Non-Overlapping Text Labels with “ggplot2.” 2020. http://github.com/slowkow/ggrepel
- Brooks ME, Kristensen K, van BKJ, Magnusson A, Berg CW, Nielsen A, et al. glmmTMB Balances Speed and Flexibility Among Packages for Zero-inflated Generalized Linear Mixed Modeling. R J. 2017;9:378–400.
- Lenth R. Estimated Marginal Means, aka Least-Squares Means. [Internet]. R Packag. version 1.4. 2019. Available from: https://cran.r-project.org/package=emmeans
- Roederer M, Nozzi JL, Nason MCSPICE. Exploration and analysis of post-cytometric complex multivariate datasets. Cytom Part A. 2011;79 A:167–174. doi:10.1002/cyto.a.21015.
- Colonna-Romano G, Cossarizza A, Aquino A, Scialabba G, Bulati M, Lio D, Candore G, Di Lorenzo G, Fradà G, Caruso C, et al. Age- and gender-related values of lymphocyte subsets in subjects from Northern and Southern Italy. Arch Gerontol Geriatr Suppl Ireland. 2002;8:99–107. doi:10.1016/S0167-4943(02)00109-7.
- Globerson A, Effros RB. Ageing of lymphocytes and lymphocytes in the aged. Immunol Today. [Internet]. Elsevier. 2000;21:515–521. doi:10.1016/S0167-5699(00)01714-X.
- Hodi FS, Chiarion-Sileni V, Gonzalez R, Grob JJ, Rutkowski P, Cowey CL, Lao CD, Schadendorf D, Wagstaff J, Dummer R, et al. Nivolumab plus ipilimumab or nivolumab alone versus ipilimumab alone in advanced melanoma (CheckMate 067): 4-year outcomes of a multicentre, randomised, phase 3 trial. Lancet Oncol. 2018;19:1480–1492. doi:10.1016/S1470-2045(18)30700-9.
- Hoejberg L, Bastholt L, Schmidt H. Interleukin-6 and melanoma. Melanoma Res. 2012;22(5):327–333. doi:10.1097/CMR.0b013e3283543d72.
- Speiser DE, Ho PC, Verdeil G. Regulatory circuits of T cell function in cancer. Nat Rev Immunol. 2016;16:599–611. doi:10.1038/nri.2016.80.
- Imbratta C, Leblond MM, Bouzourène H, Speiser DE, Velin D, Verdeil G. Maf deficiency in T cells dysregulates T reg - T H 17 balance leading to spontaneous colitis. Sci Rep. 2019;9:1–13. doi:10.1038/s41598-019-42486-2.
- Neubert NJ, Tillé L, Barras D, Soneson C, Baumgaertner P, Rimoldi D, Gfeller D, Delorenzi M, Fuertes Marraco SA, Speiser DE, et al. Broad and conserved immune regulation by genetically heterogeneous melanoma cells. Cancer Res. 2017;77(7):1623–1636. doi:10.1158/0008-5472.CAN-16-2680.
- Nenu I, Tudor D, Filip AG, Baldea I. Current position of TNF-α in melanomagenesis. Tumor Biol. 2015;36:6589–6602. doi:10.1007/s13277-015-3639-0.
- Hanahan D, Weinberg RA. Hallmarks of cancer: the next generation. Cell. 2011;144:646–674. doi:10.1016/j.cell.2011.02.013.
- Affara NI, Ruffell B, Medler TR, Gunderson AJ, Johansson M, Bornstein S, Bergsland E, Steinhoff M, Li Y, Gong Q, et al. B cells regulate macrophage phenotype and response to chemotherapy in squamous carcinomas. Cancer Cell. 2014;25(6):809–821. doi:10.1016/j.ccr.2014.04.026.
- Gunderson AJ, Kaneda MM, Tsujikawa T, Nguyen AV, Affara NI, Ruffell B, Gorjestani S, Liudahl SM, Truitt M, Olson P, et al. Bruton tyrosine kinase–Dependent immune cell cross-talk drives pancreas cancer. Cancer Discov. 2016;6(3):270–285. doi:10.1158/2159-8290.CD-15-0827.
- Sautès-Fridman C, Petitprez F, Calderaro J, Fridman WH. Tertiary lymphoid structures in the era of cancer immunotherapy. Nat Rev Cancer. Springer US. 2019;19:307–325. doi:10.1038/s41568-019-0144-6.
- Helmink BA, Reddy SM, Gao J, Zhang S, Basar R, Thakur R, Yizhak K, Sade-Feldman M, Blando J, Han G, et al. B cells and tertiary lymphoid structures promote immunotherapy response. Nature. 2020;577(7791):549–555. doi:10.1038/s41586-019-1922-8.
- Baitsch L, Baumgaertner P, Devêvre E, Raghav SK, Legat A, Barba L, et al. Exhaustion of tumor-specific CD8+ T cells in metastases from melanoma patients. J Clin Invest. 2011;121:23–25. doi:10.1172/JCI46102.
- Germain C, Gnjatic S, Tamzalit F, Knockaert S, Remark R, Goc J, et al. Presence of B cells in tertiary lymphoid structures is associated with a protective immunity in patients with lung cancer. Am J Respir Crit Care Med. 2014;189:832–844. doi:10.1164/rccm.201309-1611OC.
- Pinc A, Somasundaram R, Wagner C, Hörmann M, Karanikas G, Jalili A, Bauer W, Brunner P, Grabmeier-Pfistershammer K, Gschaider M, et al. Targeting CD20 in melanoma patients at high risk of disease recurrence. Mol Ther. [Internet]. The American Society of Gene & Cell Therapy. 2012;20:1056–1062. doi:10.1038/mt.2012.27.
- Winkler JK, Schiller M, Bender C, Enk AH, Hassel JC. Rituximab as a therapeutic option for patients with advanced melanoma. Cancer Immunol Immunother. [Internet]. Springer Berlin Heidelberg. 2018;67:917–924. doi:10.1007/s00262-018-2145-9.