
ABSTRACT
Currently, a significant proportion of cancer patients do not benefit from programmed cell death-1 (PD-1)-targeted therapy. Overcoming drug resistance remains a challenge. In this study, single-cell RNA sequencing and bulk RNA sequencing data from samples collected before and after anti-PD-1 therapy were analyzed. Cell-cell interaction analyses were performed to determine the differences between pretreatment responders and nonresponders and the relative differences in changes from pretreatment to posttreatment status between responders and nonresponders to ultimately investigate the specific mechanisms underlying response and resistance to anti-PD-1 therapy. Bulk-RNA sequencing data were used to validate our results. Furthermore, we analyzed the evolutionary trajectory of ligands/receptors in specific cell types in responders and nonresponders. Based on pretreatment data from responders and nonresponders, we identified several different cell-cell interactions, like WNT5A-PTPRK, EGFR-AREG, AXL-GAS6 and ACKR3-CXCL12. Furthermore, relative differences in the changes from pretreatment to posttreatment status between responders and nonresponders existed in SELE-PSGL-1, CXCR3-CCL19, CCL4-SLC7A1, CXCL12-CXCR3, EGFR-AREG, THBS1-a3b1 complex, TNF-TNFRSF1A, TNF-FAS and TNFSF10-TNFRSF10D interactions. In trajectory analyses of tumor-specific exhausted CD8 T cells using ligand/receptor genes, we identified a cluster of T cells that presented a distinct pattern of ligand/receptor expression. They highly expressed suppressive genes like HAVCR2 and KLRC1, cytotoxic genes like GZMB and FASLG and the tissue-residence-related gene CCL5. These cells had increased expression of survival-related and tissue-residence-related genes, like heat shock protein genes and the interleukin-7 receptor (IL-7R), CACYBP and IFITM3 genes, after anti-PD-1 therapy. These results reveal the mechanisms underlying anti-PD-1 therapy response and offer abundant clues for potential strategies to improve immunotherapy.
SYNOPSIS
Cell-cell interactions in cancers were analyzed using single-cell RNA sequencing data to provide insights into the mechanisms underlying response or resistance to anti-PD-1 therapy. The results may offer abundant clues for potential strategies to improve immunotherapy.
INTRODUCTION
Immunotherapy, for example, immune checkpoint inhibitors (ICIs), has recently shown broad clinical applicability across several tumors.Citation1 Nevertheless, the response rates of cancers to ICIs have been only modest. Among ICI strategies, programmed cell death-1 (PD-1)-targeted therapy has been commonly used in cancer treatment in recent years. The specific mechanisms of tumor resistance to anti-PD-1 therapy remain unclear. According to the treatment response after the application of anti-PD-1 therapy, resistance to anti-PD-1 therapy is classified into two types: primary resistance and adaptive resistance.Citation2 Primary resistance refers to cases in which there is no response to anti-PD-1 therapy from the beginning to the end of treatment. The mechanisms of primary resistance to anti-PD-1 therapy are complex. It is known that proper activation of T cells by antigen-presenting cells, trafficking and infiltration of T cells into tumors, recognition of tumor cells by cytotoxic T cells and release of lytic granules to kill tumor cells are essential for the success of immune surveillance.Citation3 Perturbations in any of these steps can lead to the failure of anti-PD-1 therapy. Thus, tumor resistance to anti-PD-1 therapy can be affected by multiple factors in the tumor microenvironment (TME), including intrinsic tumor factors and extrinsic tumor factors.Citation4 It is now widely accepted that cell-cell interactions exist across the majority of cell types in the TME. All cell types in the TME form a complex network and respond to anti-PD-1 therapy. Multiple types of cells, like cancer-associated fibroblasts (CAFs), myeloid-derived suppressor cells (MDSCs) and regulatory T cells (Tregs), are known to play negative roles in immune surveillance, while myofibroblasts, natural killer (NK) cells and other immune cells are being increasingly identified to play complex roles in immune surveillance. However, it is still unclear how interactions between these cells in the TME affect anti-PD-1 therapy response.
Single-cell RNA sequencing (scRNA-seq) makes it possible to investigate the cell-cell interaction network in the TME,Citation5,Citation6 which may facilitate a better understanding of tumor response or resistance to anti-PD-1 therapy. Cell-cell interaction analyses based on scRNA-seq data from paired samples taken before and after anti-PD-1 therapy can contribute to determining critical cell-cell interactions involved in response or resistance to anti-PD-1 therapy.
In the current study, we explored the mechanisms of response or resistance to anti-PD-1 therapy based on scRNA data from basal cell carcinoma (BCC) and several other immunotherapy datasets. Our study mainly explores the mechanisms underlying response or resistance to immunotherapy from the perspective of ligand-receptor interactions among cells. We believe that the efficacy of immunotherapy is affected by many factors, and among these, the effect of cell-cell communications on immunotherapy has not been systemically explored thus far. We identified several crucial cell-cell interactions that may play critical roles in immunotherapy. Furthermore, we identified a cluster of tumor-specific CD8 T cells in responders (which highly coexpressed CD39 and CD103) that presented a distinct pattern of ligand/receptor expression.Citation7–9 This cluster of cells not only highly expressed negative regulatory ligands/receptors, like HAVCR2, CD52, CSF1, CD74, KLRC1, and CD96,Citation10–15 but also highly expressed positive regulatory ligands/receptors related to immune activation or cytotoxicity, such as GZMB, GNLY, NKG7, FASLG, CLEC2B, TNFRSF9 and CCL5.Citation16,Citation17 Of note, these cells had increased expression of survival- and residence-related genes after anti-PD-1 therapy. Identification of this cluster of cells may contribute to improving adoptive cellular immunotherapy in cancers. Together, these findings provide in-depth insights into the mechanisms underlying and the critical cell-cell interactions that play roles in anti-PD-1 therapy response.
MATERIALS AND METHODS
Materials
scRNA-seq data and bulk-RNA sequencing data regarding anti-PD-1 therapy response were obtained from the Gene Expression Omnibus (GEO) database (scRNA-seq data, GSE123814; bulk-RNA sequencing data, GSE78220, GSE91061, PRJEB23709 and GSE145996). scRNA-seq data were derived from pretreatment and posttreatment site-matched basal cell carcinoma (BCC) samples from the same patient treated with pembrolizumab or cemiplimab.Citation9 Among the patients, su001, su002, su003, su004, su009, and su012 were responders to anti-PD-1 therapy, and su005, su006, su007, su008, and su010 were nonresponders to anti-PD-1 therapy. The bulk-RNA sequencing data of GSE78220 were derived from the pretreatment tumors of 28 patients who received pembrolizumab or nivolumab.Citation18 The data were used for the identification of critical cell-cell interactions that differ between responders and nonresponders. The bulk-RNA sequencing data of GSE91061 were derived from matched pretreatment and posttreatment tumor samples taken from patients who received nivolumab.Citation19 These data were used for the identification of critical cell-cell interactions that showed relative differences in pretreatment to posttreatment changes between responders and nonresponders. Finally, the PRJEB23709 and GSE145996 datasets were used for validation.Citation20,Citation21 Sample information for the 5 abovementioned datasets is listed in Supplemental Table 1.
Single-cell RNA sequencing data quality control and processing
ScRNA data were processed by Cell Ranger (v.2.1.0, 10x Genomics) using the GRCh38 reference genome provided by 10x Genomics. Subsequent analyses were performed using Seurat (version 3.1). Cells that had fewer than 200 detected genes or had >10% mitochondrial gene counts were filtered out. Then, we applied SCTransform to the scRNA-seq data in Seurat, which replaces the “NormalizeData”, “ScaleData” and “FindVariableFeatures” functions in the previous version of Seurat. During normalization, we removed confounding sources of variation (nCount_RNA and mitochondrial mapping percentage).
Principal component analysis and UMAP clustering
Dimensionality reduction was performed by principal component analysis (PCA). Thirty principal components (PCs) were used in subsequent cell cluster analysis with a resolution of 0.8. Nonlinear dimensional reduction was performed using UMAP to visualize the scRNA dataset. Differentially expressed genes were identified using “FindAllMarkers” or “FindMarkers” in Seurat. Gene set variation analysis (GSVA) between specific cell types was performed using the “GSVA” R package.
Annotation of cell clusters
We largely adopted the annotations of cell clusters used in the Yost et al. studyCitation9 and added ACTA2 (α-SMA) as a marker for myofibroblasts, with cells identified as follows: T cells (CD3D, CD3G, CD3E, and CD2), CD8 + T cells (CD8A and GZMA), CD4 + T cells/Tregs (CD4 and FOXP3), NK cells (KLRC1 and KLRC3), B cells (CD19 and CD79A), plasma cells (SLAMF7 and IGKC), macrophages (FCGR2A and CSF1R), dendritic cells (DCs; FLT3), plasmacytoid dendritic cells (pDCs; CLEC4C), fibroblasts (COL1A2), myofibroblasts (α-SMA, MCAM, and MYLK), cancer-associated fibroblasts (CAFs; FAP and PDPN), malignant cells (EPCAM and TP63), endothelial cells (PECAM1 and VWF), and melanocytes (PMEL and MLANA). First, cells were clustered into broad cell types (B cells, NK cells, T cells, CAFs, myofibroblasts, endothelial cells, macrophages, DCs, pDCs, plasma cells, tumor cells and melanocytes). Next, tumor cell and T cell data were isolated from the complete dataset and reclustered based on the first 20 PCs with k = 30 and resolution = 0.4 for tumor cells and resolution = 0.3 for T cells. Finally, cells were clustered into 18 clusters, including 2 malignant clusters (tumor_1 and tumor_2), 2 CD4 + T cell clusters, 3 CD8 + T cell clusters, proliferating T cells, endothelial cells, melanocytes, myofibroblasts, CAFs, DCs, macrophages, pDCs, 2 B cell clusters (B_cells_1 and B_cells_2), and 1 NK cell cluster. Validation of malignant cells was further performed by single-cell copy number variation (CNV) estimation as described in the Yost et al. study. For UMAP visualization, we used the first 30 PCs, a minimum distance of 0.3 and 30 neighbors.
Cell-cell interaction score calculation using cellphoneDB
We investigated cell-cell interactions across all cell types with CellPhoneDB (https://www.cellphonedb.org/). CellPhoneDB is an emerging and frequently used method to uncover cell-cell communication.Citation22,Citation23 Several ligand-receptor databases, such as UniProt, Ensembl, PDB, the IMEx consortium, and IUPHAR, serve as references for CellPhoneDB. To assess cellular crosstalk between different cell types, CellPhoneDB predicts enriched receptor–ligand interactions between two cell types based on the expression of a receptor by one cell type and the expression of a ligand by another cell type. To identify the most relevant interactions between cell types, CellPhoneDB looks for cell-type specific interactions between ligands and receptors. Only receptors and ligands expressed in more than 10% of the cells in the specific cluster are considered significant. CellPhoneDB then performs pairwise comparisons between all cell types. First, CellPhoneDB randomly permutes the cluster labels of all cells (1,000 times as a default) and determines the mean of the average receptor expression level in a cluster and the average ligand expression level in the interacting cluster. For each receptor–ligand pair in each pairwise comparison between two cell types, this generates a null distribution. By calculating the proportion of the means that are equal to or higher than the actual mean, CellPhoneDB obtains a p value for the likelihood of cell-type specificity of a given receptor–ligand complex. Finally, the adjusted p value was calculated by the false discovery rate (“FDR”) method proposed by Yoav Benjamini and Yosef Hochberg for multiple comparison correction across the 384 ligand-receptor pairs and 324 cell pairs. Significant ligand-receptor interaction pairs with adjusted p value <.05 were included in the subsequent analyses.
Profiles of cell-cell interactions between cell pairs
We stratified the scRNA-seq dataset into four groups based on treatment status and response status: pretreatment responders, posttreatment responders, pretreatment nonresponders and posttreatment nonresponders. To assess the profiles of cell-cell interactions, we calculated the total interaction score of each cell pair. The total interaction score was the summation of the scores of all ligand-receptor pairs within a cell pair ( & B and , B, C & D; a deeper red color indicates a higher total interaction score). The total score reflects the abundance and expression levels of ligand-receptor pairs within each cell pair, regardless of whether the interaction involves positive regulatory ligands/receptors or negative regulatory ligands/receptors for antitumor immunity. To visualize the differences in total interaction scores between subgroups, we calculated the ratio of total interaction scores between groups (, the ratio between pretreatment responders and nonresponders; E & F, the ratio between pretreatment and posttreatment status). If the ratio was >1, a red color was used. If the ratio was <1, a blue color was used. Relative differences in the changes from pretreatment to posttreatment status between responders and nonresponders are shown in , as determined by calculating the relative ratio ((the ratio of the posttreatment/pretreatment value in responders)/(the ratio of the posttreatment/pretreatment value in nonresponders)). In addition, the size of the circle of each cell pair reflects the number or the ratio of numbers of ligand-receptor pairs within a cell pair.
Comparison between pretreatment responders and nonresponders
To identify ligand-receptor pairs with significant differences between pretreatment responders and nonresponders, the Mann-Whitney U test was performed to compare the interaction scores of each ligand-receptor pair in all cell pairs between pretreatment responders. The FDR method proposed by Yoav Benjamini and Yosef Hochberg was applied to calculate the adjusted p value. Ligand-receptor pairs with adjusted p value <.05 were preserved.
For visualization, the ratio of responder/nonresponder interaction scores were calculated as follows:
Ratio (pretreatment responders to nonresponders) = score (pretreatment responders)/score (pretreatment nonresponders)
If Ratio (pretreatment responders/nonresponders) >1, a higher level of interaction existed in responders than in nonresponders (indicated with a red color). If Ratio (pretreatment responders/nonresponders) <1, a lower level of interaction existed in responders than in nonresponders (indicated with a blue color) ( & E).
Comparison of Relative Differences in Changes from Pretreatment to Posttreatment between Responders and Nonresponders
We calculated the changes in interaction scores from pretreatment to posttreatment status in responders and nonresponders as follows:
(1) Ratio (post/pre) = posttreatment score/pretreatment score;
The Ratio (post/pre) reflected the changes from pretreatment to posttreatment status. To identify ligand-receptor pairs with significant differences in changes from pretreatment to posttreatment between responders and nonresponders, the Ratio (post/pre) was adopted as a variable and the Mann-Whitney U test was performed to compare the Ratio (post/pre) values between responders and nonresponders. The FDR method proposed by Yoav Benjamini and Yosef Hochberg was applied to calculate the adjusted p value. Ligand-receptor pairs with adjusted p value <.05 were preserved.
For visualization, we calculated the relative differences (responders versus nonresponders) in cell-cell interaction changes (pretreatment to posttreatment status) as described below:
(2) Relative Ratio = Ratio (posttreatment/pretreatment in responders)/Ratio (posttreatment/pretreatment in nonresponders)
The Relative Ratio reflects the relative difference in changes from pretreatment to posttreatment status between responders and nonresponders. If the Relative Ratio value between responders and nonresponders was >1, the specific ligand-receptor interaction relatively increased in responders or relatively decreased in nonresponders during treatment (indicated with a red color in ). If the Relative Ratio value between responders and nonresponders was <1, the specific ligand-receptor interaction relatively decreased in responders or relatively increased in nonresponders during treatment (indicated in a blue color in ).
Identification of “ligand-receptor pairs related to response before treatment” and “ligand-receptor pairs related to response on treatment” with immunotherapy bulk-RNA sequencing data
Patients who received anti-PD-1 therapy were enrolled in the Hugo et al. study,Citation18 and bulk-RNA sequencing data were obtained. Differentially expressed genes (DEGs) were determined by comparing data between pretreatment responders and nonresponders. We intersected the DEGs from Hugo’s study and the ligand/receptor genes we identified by comparing the scRNA-seq data (derived as mentioned above) between pretreatment responders and nonresponders to yield the “Ligand-receptor Pairs related to response before treatment”.
Riaz et al. also collected matched pretreatment and posttreatment samples from the same patients.Citation19 In the Riaz et al. study, DEG analysis was performed between pre- and posttreatment samples, and genes that changed differentially in responders versus nonresponders were considered. We intersected the DEGs from the Riaz study and the ligand/receptor genes we identified by comparing the relative differences in changes from pretreatment to posttreatment status between responders and nonresponders using the scRNA data mentioned above to yield the “Ligand-receptor Pairs related to response on treatment”.
Validation of “ligand-receptor pairs related to response before treatment” and “ligand-receptor pairs related to response on treatment” with other datasets
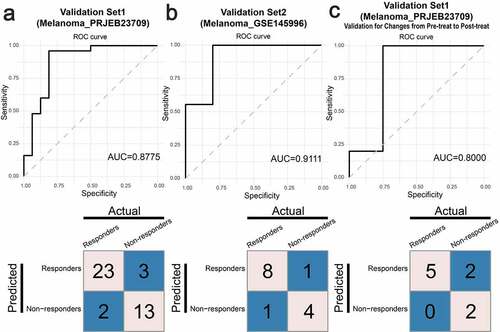
To test whether the “Ligand-receptor Pairs Related to Response Before Treatment” and the “Ligand-receptor Pairs Related to Response on Treatment” could predict the response to immunotherapy, we developed predictive models using XGBoost. We calculated the interaction scores of the “Ligand-receptor Pairs Related to Response Before Treatment” and the “Ligand-receptor Pairs Related to Response on Treatment” by single-sample gene set enrichment analyses (ssGSEA); for example, WNT5A and PTPRK were considered a gene set. Then, we developed predictive models based on the Hugo dataset (the “Ligand-receptor Pairs Related to Response Before Treatment” model) and the Riaz dataset (the “Ligand-receptor Pairs Related to Response On Treatment” model. The change from pretreatment to posttreatment status was calculated as a variable to develop the model). To avoid overfitting, we used the “xgb.train” method with the “xgboost” package in R statistics to develop the models. Two melanoma datasets were used to validate our results (). We used the pretreatment data of set 1 (Melanoma_PRJEB23709, 41 samples) and set 2 (Melanoma_GSE145996, 14 samples) to validate the “Ligand-receptor Pairs Related to Response Before Treatment” model ( & B). We used the data of relative changes from pretreatment to posttreatment status from set 1 (Melanoma_PRJEB23709, 9 samples) to validate the “Ligand-receptor Pairs Related to Response On Treatment” model ().
Trajectory analyses using ligand-receptor genes
Trajectory analyses of all cell types in responders and nonresponders were performed using 970 ligand-receptor gene pairs (Supplemental Table 2) by Monocle3. Marker ligand/receptor pairs in each cell type were identified using the “top_markers” function based on ligand-receptor genes in Monocle3. Trajectory maps were plotted with the “learn_graph” and “plot_cells” functions in Monocle3. To investigate the evolutionary trajectories of ligand/receptor pairs in specific cell types, we isolated subsets of cell types of interest, like exhausted CD8 T cells in responders, for further analyses. Coexpression analysis of ligands/receptors was performed with the Pearson correlation coefficient test and the WGCNA package in R statistics.
Analyses focusing on CAFs and myofibroblasts
To further clarify the functions of CAFs and myofibroblasts, we compared the expression level of several immune-related genes which were considered to be “pro-tumor” or “immune-suppressive” between CAFs and myofibroblasts. We also investigated the pathway activity difference using GSVA analysis based on GO terms.
Statistical analysis
All statistical analyses were performed using R (http://www.rproject.org), SPSS version 25.0 and Python (https://www.python.org/). The detailed statistical methods used for each analysis are described within the figure legends. Two-sided paired or unpaired Student’s t-tests, unpaired Wilcoxon rank-sum (Mann-Whitney U) tests or chi-square tests were used where indicated. The FDR method proposed by Yoav Benjamini and Yosef Hochberg was applied to calculate the adjusted p value. An adjusted p value < .05 was considered to indicate statistical significance. Single-cell analyses were performed mainly with Seurat and Monocle3. All plots were produced with R software and refined with Adobe Illustrator.
RESULTS
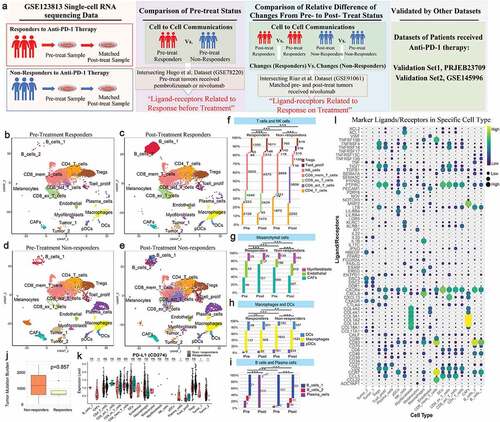
The study overview is shown in . To explore the cell-cell interactions in cancer patients who received anti-PD-1 therapy, we used scRNA-seq and bulk-RNA sequencing data associated with anti-PD-1 therapy in cancer patients from the GEO database. Among these data, scRNA-seq data were derived from paired, site-matched samples taken before and after anti-PD-1 treatment from the same patient and same site with basal cell carcinoma (BCC). A total of 11 patients were included; of these, 6 patients were responders and 5 patients were nonresponders to anti-PD-1 therapy. Overall, scRNA-seq data from 53,030 cells were obtained after quality control. Among the cells, 26,881 cells were from responders (8,836 cells were taken before treatment, and 18,045 cells were taken after treatment), and 26,149 cells were from nonresponders (12,492 cells were taken before treatment, and 13,657 cells were taken after treatment). We largely adopted the cell annotations used in the Yost et al. study, and all cells were assigned to 19 clusters. Then, cells were assigned to 4 groups stratified by response to anti-PD-1 therapy and treatment status (, C, D & E): pretreatment responders, posttreatment responders, pretreatment nonresponders, and posttreatment nonresponders. Of note, immune cells and stromal cells from different groups clustered together, indicating the consistency of the immune cell and stromal cell types across patients and treatment statuses. Malignant cells were further determined by single-cell CNV estimation, as performed in the Yost et al. study. The proportions and counts of each cell type in the four groups are shown in , G, H & I. Next, we analyzed the level of PD-L1 and tumor mutation burden (TMB), which are generally believed to be predictive markers of response to immunotherapy, in pretreatment samples. We found that the expression levels of PD-L1 in tumor cells, CAFs and plasma cells were higher in nonresponders than in responders. The TMB did not show a significant difference between responders and nonresponders. This result may have been caused by the small sample size ( & K). The marker ligand/receptor pairs of each cell type are shown in . We show the top 4 representative ligand/receptor pairs for each cell type.
Figure 1. Study overview, analysis of the tumor microenvironment in patients before and after anti-PD-1 treatment with scRNA-seq, and marker ligands/receptors in specific cell types
Comparison of cell-cell interactions between pretreatment responders and nonresponders
The total interaction scores within each cell pair in pretreatment responders and pretreatment nonresponders are shown in & B, respectively. The ratios of total scores between pretreatment responders and nonresponders are shown in . The abundance and expression of ligand-receptor pairs in CD4 T cells, activated CD8 T cells and NK cells compared to other cells was lower in pretreatment responders than in nonresponders, which indicated that there was more communication between CD4 T cells, activated CD8 T cells, and NK cells and other cells in nonresponders than in responders. The specific details of the differences are provided for each cell pair from pretreatment responders and nonresponders in Supplemental .
Figure 2. Comparison of pretreatment responders and nonresponders
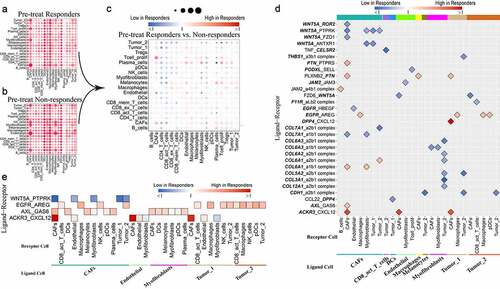
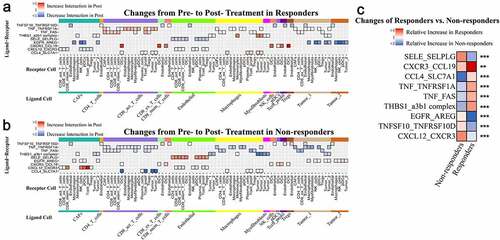
The results of specific comparisons of each ligand-receptor interaction in pretreatment responders with that of nonresponders are shown in (fold difference >2 or <0.5 presented). Consistently, lower levels of WNT5A-, TNF-, NRP2-, CTLA-4-, COL7A1-, CD28- and CCL4-related ligand-receptor pairs were found in pretreatment responders than in nonresponders. In contrast, consistently higher levels of SELE-, MDK-, ICAM1-, CXCL12- and CD74-related ligand-receptor pairs were found in pretreatment responders than in nonresponders. WNT5A-related ligand-receptor pairs were largely found between CAFs and CAFs/myofibroblasts/tumor cells. WNT5A-ROR2/PTPRK/FZD1 interactions between CAFs and CAFs were weaker in responders than in nonresponders. Collagen-related ligand-receptor interactions between myofibroblasts and tumor cells were weaker in responders than in nonresponders. PLXNB2-PTN, EGFR-AREG, and CXCL12-DPP4/ACKR3 (CXCR7) interactions were largely stronger in responders than in nonresponders.
Next, we intersected the ligand/receptor pairs with 693 DEGs identified between pretreatment responders and nonresponders in the Hugo et al. study, which also included pretreatment tumor samples from patients who would receive anti-PD-1 therapy (, Supplemental ). To identify ligand-receptor pairs that differed significantly in all cell pairs between pretreatment responders and nonresponders, the Mann-Whitney U test was performed to compare the interaction scores of each ligand-receptor pair in all cell pairs between pretreatment responders, and ligand-receptor pairs with adjusted p value <.05 were preserved (Supplemental Table 3). WNT5A-PTPRK, EGFR-AREG, AXL-GAS6 and ACKR3-CXCL12 were identified. We called these intersecting ligand-receptor pairs “Ligand-Receptor pairs Related to Response Before Treatment” ().
Comparison of the relative differences in changes from pretreatment to posttreatment status between responders and nonresponders
To visualize the differences in total interaction scores within each cell pair between groups, we calculated the ratio of total interaction scores ( & F, ratio between pretreatment and posttreatment status). The relative differences in changes from pretreatment to posttreatment status between responders and nonresponders are shown in , as derived by calculating the relative ratio: ratio (posttreatment/pretreatment in responders)/ratio (posttreatment/pretreatment in nonresponders)). On the whole, cell-cell interactions between CD4 T cells/activated CD8 T cells/myofibroblasts/NK cells/plasma cells/proliferative T cells and other cells were relatively upregulated in responders compared with nonresponders, while those between B cells/CAFs/endothelial cells/macrophages and other cells were relatively downregulated. The specific details of the relative differences are provided for each cell pair from responders and nonresponders in Supplemental .
Figure 3. Relative differences in changes from pretreatment to posttreatment status between responders and nonresponders
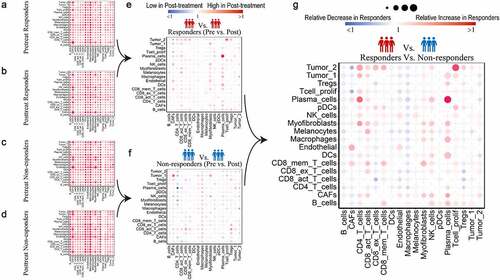
Next, we intersected the ligand/receptor gene pairs with 2,670 DEGs that changed differentially from pretreatment to posttreatment status between responders and nonresponders in the Riaz et al. study, which also contained paired pretreatment and posttreatment samples from the same patient who received anti-PD-1 therapy (, “Ratio (post/pre)” >2 or <0.5 presented, Supplemental ). To identify ligand-receptor pairs with significant relative differences in changes between responders and nonresponders, the Mann-Whitney U test was performed, and ligand-receptor pairs with adjusted p value <.05 were preserved (Supplemental Table 4). SELE-SELPLG, CXCR3-CCL19, CXCL12-CXCR3, CCL4-SLC7A1, TNF-TNFRSF1A, TNF-FAS, TNFSF10-TNFRSF10D, THBS1_a3b1 complex and EGFR-AREG interactions were identified as “Ligand-receptor Pairs Related to Response on Treatment” ().
Figure 4. Relative differences in changes in specific ligand-receptor pairs between responders and nonresponders with “Relative Ratio” >2 or <0.5 (overlapping with DEGs from the Riaz et al. study)
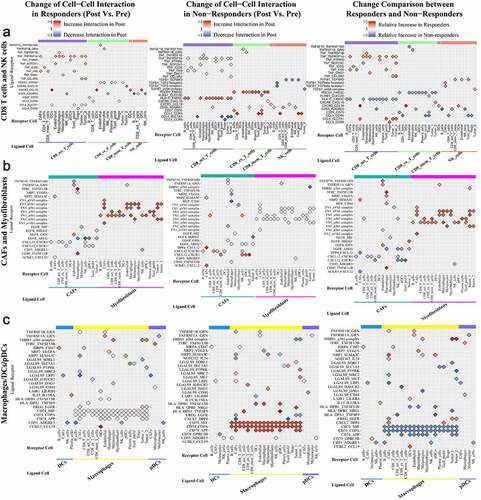
Figure 5. Relative differences in changes in specific ligand-receptor pairs between responders and nonresponders with “Relative Ratio” >2 or <0.5 (overlapping with DEGs identified in the Riaz et al. study)
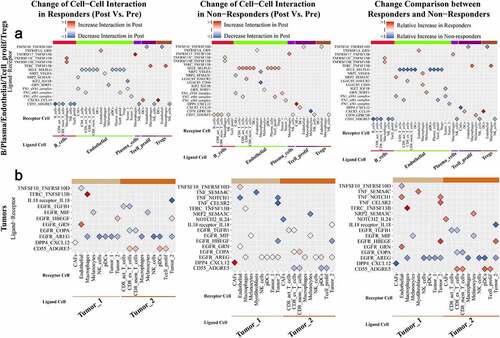
Figure 6. “Ligand-receptors Pairs Related to Response On Treatment” with significant relative differences in changes between responders and nonresponders in our study
Ligand-receptor Pairs Relatively Upregulated in Responders or Downregulated in Nonresponders During Treatment
CCL19-CXCR3/CCRL2 interactions were relatively upregulated in responders versus nonresponders; the CCL19-CXCR3 interaction was mainly observed between DCs and all T cells/NK cells, and the CCL19-CCRL2 interaction was observed between DCs and macrophages. CCL4-SLC7A1/CCR8/CCR5 interactions were relatively stronger between activated CD8 T cells/macrophages and DCs/proliferative T cells/Tregs/tumor cells in responders than in nonresponders; among them, the CCL4-SLC7A1 interaction between activated CD8 T cells and DCs/proliferative T cells/tumor cells was drastically downregulated in nonresponders compared with responders, and the CCL4-CCR8 interaction between activated CD8 T cells to Tregs was drastically upregulated in responders compared with nonresponders. TNF-related ligand-receptor pairs, like TNF-TNFRSF1A and TNF-FAS, were largely upregulated between activated CD8 T cells and other cells in responders, while they were largely downregulated between activated CD8 T cells/macrophages and other cells in nonresponders. THBS1-a3b1 complex interactions were relatively downregulated between CAFs/endothelial cells/macrophages/myofibroblasts/tumor cells and tumor cells in nonresponders. NPR2-VEGFA/SEMA3C/PGF interactions between CAFs/DCs/endothelial cells/macrophages and other cells were upregulated in responders compared with nonresponders. LAIR1-LILRB4 interactions were downregulated between macrophages and DCs/macrophages in nonresponders. IL15-IL15RA interactions were relatively upregulated between DCs and CAFs/plasma cells in responders versus nonresponders. EREG-EGFR interactions between macrophages and CAFs/tumor cells and HBEGF-EGFR interactions between tumor cells and CAFs/tumor cells were upregulated in responders compared with nonresponders.
Ligand-receptor pairs relatively downregulated in responders or upregulated in nonresponders during treatment
SELP/SELL/SELE-SELPLG interactions became relatively stronger in nonresponders; among them, SELE-SELPLG interactions between endothelial cells and T cells/pDCs/plasma cells were drastically relatively upregulated in nonresponders versus responders. TNFSF10/MIF-TNFRSF10D interactions between other cells and endothelial cells and TNFSF13-related ligand-receptor interactions between pDCs/macrophages and other cells were consistently weaker in responders than in nonresponders. AREG-EGFR interactions between macrophages/pDCs/NK cells/tumor cells and CAFs/tumor cells, TGFB1-EGFR interactions between tumor cells and activated CD8 T cells/exhausted CD8 T cells, COPA-EGFR interactions between tumor cells and exhausted CD8 T cells/memory CD8 T cells were relatively weaker in responders than in nonresponders. CXCL12-CXCR3/CXCR4/CXCR7(ACKR3)/DPP4 interactions were consistently downregulated in responders but upregulated in nonresponders; among them, CXCL12-CXCR3/CXCR4/CXCR7 interactions were mainly observed between CAFs/endothelial cells and other cells, and CXCL12-DPP4 interactions were observed between CAFs and CAFs/T cells/tumor cells. CCL5-CCR5/CCR4 interactions between T cells/NK cells and T cells/endothelial cells were upregulated in both responders and nonresponders, but the increases were sharper in nonresponders; CCL5-CCR4 interactions between exhausted CD8 T cells/NK cells and CD4 T cells/Tregs/proliferative T cells were significantly stronger in nonresponders than in responders. CD74-MIF/COPA/APP interactions were significantly downregulated in responders and upregulated in nonresponders. CD74-MIF/COPA/APP interactions were slightly upregulated between B cells/DCs and other cells and were drastically upregulated between macrophages and other cells in nonresponders versus responders. CD55-ADGRE5 interactions were broadly downregulated between several kinds of cells and B cells/CD8 T cells/NK cells/proliferative T cells but upregulated between other immune cells and tumor cells in responders; however, in nonresponders, they showed a different pattern. LGALS9-related ligand-receptor interactions between DCs/endothelial cells/macrophages/pDCs and other cells were relatively stronger in nonresponders than responders, while LGALS9-CD44 interactions were weaker.
Roles of CAFs and myofibroblasts in anti-PD-1 therapy
We found that CAFs and myofibroblasts seemed to play different roles in anti-PD-1 therapy. For example, interactions between FN1 and integrin between CAFs and other cells were drastically upregulated in nonresponders, while these interactions between myofibroblasts and other cells were drastically upregulated in responders. We investigated the expression levels of several immune-related genes in CAFs and myofibroblasts and performed GSVA for CAFs and myofibroblasts (Supplemental and Supplemental Tables 5 & 6).
Trajectory analyses using ligand-receptor genes
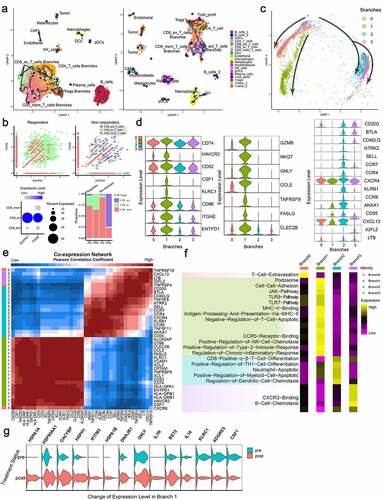
We analyzed the evolutionary trajectory of all cells in responders and nonresponders using Monocle3 with 970 ligand-receptor genes. Cells clustered well according to their specific cell type, which indicated that each cell type had a specific ligand-receptor expression pattern. Overall, there were differences in ligand-receptor expression between cells in responders and nonresponders. It is worth noting that the exhausted CD8 T cells were clearly divided into several branches, some of which were close to other CD8 T cells, while others were close to CD4 T cells and Tregs, implying that the ligand-receptor expression patterns of these exhausted CD8 T cells are similar to those of CD4 T cells and Tregs (). In the Yost study, the researchers found that exhausted CD8 T cells were tumor-specific, coexpressed CD39 (ENTPD1) and CD103 (ITGAE), and showed a large number of expanded clones after anti-PD-1 treatment. Our analysis found that among responders, there was a substantial proportion and number of tumor-specific CD8 T cells coexpressing CD39 and CD103, and the proportion was further increased after treatment. However, in nonresponders, the number and proportion of these tumor-specific CD8 T cells were very low. Even though there were a large number of activated CD8 T cells in nonresponders, less than 10% of cells coexpressed CD39 and CD103, and the ones that did were probably bystander cells (). Focusing on the tumor-specific cells, we found that their ligand-receptor expression patterns changed in three ways, and we divided the cells into four branches: branch 0, branch 1, branch 2, and branch 3 (). We analyzed ligand-receptor coexpression in the exhausted CD8 T cells and then analyzed the differences in ligand-receptor gene expression and pathway activity (using GO terms) in the four branches of cells (, e & F; Supplemental Tables 7 & 8). We found that the level of coexpression of CD39 and CD103 was the highest in the cells of branch 1. It is worth noting that although the cells of branch 1 expressed higher levels of immunosuppressive ligands and receptors, such as HAVCR2, CD52, CSF1, CD74, KLRC1, and CD96, they also expressed higher levels of ligands and receptors related to immune activation or cytotoxicity, such as GZMB, GNLY, NKG7, FASLG, CLEC2B, and TNFRSF9. In addition, the cells of branch 1 also highly expressed CCL5 (which is related to tissue residence). The cells of branch 2 and branch 3 were similar; the cells of branch 2 highly expressed CCR4, CCR7, CXCR4, and KLRB1, and the cells of branch 3 highly expressed CXCL13, IGFL2, and LTB. With regard to pathway activity analyses (GO terms), we found that the ligand-receptor pair expression pattern of branch 1 cells was enriched in cell adhesion, T cell antiapoptotic mechanisms, immune activation (TLR9/7 and the JAK pathway), NK cell recruitment, type 2 immune response, and chronic inflammation. On the other hand, the branch 2 cells showed enrichment in signaling related to induction of cell differentiation, regulation of apoptosis of neutrophils and myeloid cells and recruitment of DCs. The cells of branch 3 showed enrichment of pathways related to B cell recruitment. We further analyzed the changes in branch 1 cells before and after anti-PD-1 treatment (; the DEGs are listed in Supplemental Table 9), and we found that the genes of the heat shock protein family were upregulated, such as HSP70 (HSPA1A and HSPA1B), HSP40 (DNAJB1), HSP90A1, and HSP110 (HSPH1). CACYBP is related to the G checkpoint of the cell cycle, IL7R maintains T cell homeostasis and long-term survival, IFITM3 maintains the long-term survival of tissue-resident CD8 T cells, and IL16 recruits CD4 macrophages, and all of these genes were upregulated. Genes related to immunosuppression, such as ADGRE5, KLRC1 and CSF1, were downregulated.
Figure 7. Trajectory Analyses of All Cell Types and Tumor-Specific CD8 T cells Using Ligand/Receptor-Related Genes
Development and validation of a predictive model based on the “ligand-receptor pairs related to response before treatment” and the “ligand-receptor pairs related to response on treatment”
We developed predictive models using XGBoost to test whether the “Ligand-receptor Pairs Related to Response before Treatment” and the “Ligand-receptor Pairs Related to Response On Treatment” could predict response to anti-PD-1 therapy. We validated the efficacy of the models using two melanoma datasets, which included patients receiving anti-PD-1 therapy. The model using the “Ligand-receptor Pairs Related to Response Before Treatment” achieved an area under the curve (AUC) value of 0.8775 and 0.9111, and the accuracies were 87.8% and 85.7% in the two validation sets, respectively ( & B). The model using the “Ligand-receptor Pairs Related to Response On Treatment” achieved an AUC value of 0.8, and the accuracy was 77.8% ().
Figure 8. Validation of the “Ligand-receptor Pairs Related to Response Before Treatment” and the “Ligand-receptor Pairs Related to Response On Treatment) with additional immunotherapy datasets
Furthermore, we investigated whether the ligands/receptors mentioned in our study were also highly expressed or expressed at low levels in other immunotherapy datasets using the TIDE platform. We found that some ligands/receptors, like TNFRSF10D, TNFRSF1A, FAS, AXL and AREG, were highly positively correlated with immune checkpoint blockade (ICB) benefit in the majority of tested immunotherapy datasets (Supplemental ).
DISCUSSION
Resistance to anti-PD-1 therapy in cancers is a major challenge. Searches for strategies to overcome resistance to anti-PD-1 therapy and improvements in the efficacy of immunotherapy are urgently needed. Cell-cell interactions were analyzed based on scRNA-seq data obtained from paired tumor samples taken before and after anti-PD-1 therapy. We identified several different cell-cell interactions based on pretreatment data from responders and nonresponders, such as WNT5A-PTPRK, EGFR-AREG, AXL-GAS6 and ACKR3-CXCL12. Furthermore, relative differences in the changes from pretreatment to posttreatment status between responders and nonresponders existed for the SELE-PSGL-1, CXCR3-CCL19, CCL4-SLC7A1, CXCL12-CXCR3, EGFR-AREG, THBS1-a3b1 complex, TNF-TNFRSF1A, TNF-FAS and TNFSF10-TNFRSF10D interactions. In addition, we identified a cluster of tumor-specific CD8 T cells that existed in responders but not nonresponders and had a distinct ligand-receptor expression pattern. This cluster of cells coexpressed exhaustion-related genes and cytotoxicity-related genes. They highly expressed ligands/receptors involved in pathways related to cell adhesion, T cell anti-apoptotic mechanisms, immune activation (TLR9/7 and the JAK pathway), NK cell recruitment, type 2 immune response and chronic inflammation. After anti-PD-1 therapy, this cluster of cells had increased expression levels of survival-related genes like heat shock proteins, CACYBP, IL7R and IFITM3. Identification of this cluster of cells may contribute to improving adoptive cellular immunotherapy for cancer. Together, these results provide in-depth insights into the mechanisms underlying response and resistance to anti-PD-1 therapy and highlight promising genes that may be targeted by agents in combination with anti-PD-1 therapy.
Some of the “Ligand-receptor Pairs Related to Response On Treatment” identified in the current study have rarely been reported to affect the efficacy of anti-PD-1 therapy. Amphiregulin (AREG), an epidermal growth factor (EGF) receptor ligand, was shown to induce chemoresistance in cancer cells, and targeting AREG seemed to be a potential strategy that could be used in combination with anti-PD-1 antibodies.Citation24 In our study, the EGFR-AREG interaction was broadly and consistently downregulated between CAFs/tumor cells and macrophages/NK cells/pDCs/tumor cells in responders compared with nonresponders. This result seems to strongly imply that targeting AREG can improve the efficacy of anti-PD-1 therapy. PSGL-1 (SELPLG), an adhesion molecule, has been identified as an immune checkpoint and has been shown to induce T cell exhaustion.Citation25,Citation26 Knockout of PSGL-1 in mice was shown to be conducive to tumor control. In our study, the SELE-SELPLG interaction was significantly and broadly upregulated between endothelial cells and other cells (CAFs/CD4 T cells/effector CD8 T cells/exhausted CD8 T cells/memory CD8 T cells/pDCs/plasma cells/Tregs) in nonresponders. The PSGL-1-related interaction seems to function as another critical mechanism of tumor immune evasion in anti-PD-1 therapy by affecting various types of immune cells. LGALS9 (galectin 9), a ligand of HAVCR2 (TIM-3), has been shown to both promote and inhibit tumor activity depending on its interactions with different cell types.Citation27 LGALS9 has been correlated with tumor adhesion, migration and tumor cell aggregation in previous studies. In our study, LGALS9-related interactions between endothelial cells/DCs/macrophages and other cells were upregulated in nonresponders compared with responders. Whether there is a relationship between the upregulation of LGALS9 interactions in these cells and resistance to anti-PD-1 therapy needs to be determined. IL-15 is a stimulator of both the innate and adaptive immune systems. It was reported that DCs deprived of PD-1 ligands and equipped with IL15/IL15RA expression can induce expansion of CD8 T cells from transplanted cancer patients.Citation28 Similarly, in our study, IL15-IL15RA interactions between DCs and CAFs/plasma cells were increased.
Notably, several ligand-receptor pairs identified in the current study not only have a positive effect on antitumor immunity but also show direct suppression of tumor cells. It was reported that targeting WNT5A could suppress the metastasis of melanoma.Citation29 On the other hand, WNT5A secreted by melanoma cells can drive DC tolerance, and inhibition of WNT5A can reverse DC tolerance and enhance anti-PD-1 efficacy.Citation30,Citation31 In our study, the WNT5A-PTPRK interactions between CAFs and CAFs/endothelial cells/myofibroblasts/tumor cells were decreased. Therefore, WNT5A-related interactions seem to play a negative role in immune surveillance and anti-PD-1 therapy. However, the specific mechanisms by which these WNT5A-related interactions between CAFs and other cells affect antitumor immunity require further clarification. CD74 was shown to promote tumor cell survival by interacting with macrophage migration inhibitory factor (MIF).Citation12 On the other hand, blockade of CD74-MIF signaling in macrophages and DCs could restore the antitumor immune response of macrophages and DCs and subsequently improve the antitumor ability of cytotoxic T cells.Citation32 Consistent with this, in our study, the CD74-MIF interactions between DCs/macrophages/B cells and all types of cells were significantly different between responders (downregulated) and nonresponders (upregulated). In addition, the CD74-COPA and CD74-APP interactions showed the same patterns as the CD74-MIF interaction. However, no previous study has uncovered the antitumor-related functions of these interactions, and further research is needed. CD55 and CD97 (ADGRE5), two membrane-bound complement regulatory proteins (mCRPs), play a role in regulating the complement system. On the one hand, it was reported that CD97 could promote tumor aggressiveness in hepatocellular carcinoma.Citation33 On the other hand, a previous study indicated that the binding of CD97 to CD55 could induce the differentiation of naïve T cells into cells that behave like Tregs, and some data have suggested that the presence of CD55 and CD97 negatively regulates the response to checkpoint inhibitor therapy.Citation34 Consistent with this idea, in our study, CD97-CD55 interactions between B cells/CD8 T cells/NK cells and B cells/CAFs/CD4 T cells/CD8 T cells/DCs/macrophages/myofibroblasts/NK cells/Tregs were relatively weaker in responders than in nonresponders.
Some chemokine-related axes were shown to be induced by anti-PD-1 therapy in the current study, and several of them have already been shown to be effective targets for combination therapy with anti-PD-1. Targeting the CXCL12-CXCR4/CXCR7 axis has been shown to influence tumor cell survival, migration and immune cell infiltration, and targeting CXCL12 or CXCR4 in combination with ICIs was reported to be effective .Citation35 CXCL12 can be produced by CAFs in some cancers, and the binding of CXCL12 to tumor cells can suppress the apoptosis of tumor cells and alter the characteristics of tumor cell adhesion. On the other hand, CXCL12 can influence the recruitment of lymphocytes. In our study, the CXCL12-CXCR4/CXCR7 (ACKR3) interactions between CAFs and CD8 T cells/CD4 T cells/Tregs/DCs/B cells were broadly downregulated in responders compared with nonresponders. CXCL12-CXCR4/CXCR7 interactions appear to influence these kinds of immune cells rather than tumor cells in the context of anti-PD-1 therapy. Of note, in our study, CXCL12 was identified to function by binding not only to CXCR4 but also to CXCR3 and DPP4 among several types of cells. These pairs, in which CXCL12 is the ligand, were consistently downregulated. The CCL19-CCR7 axis plays a role in adaptive immunity, and it was reported that CCRL2 (CRAM-B) competitively binds CCL19 and regulates the CCL19-CCR7 axis.Citation36,Citation37 On the other hand, CCL19-CXCR3 was reported to be associated with the development of thymic metallophilic macrophages.Citation38 It was reported that local injection of CCL19 in combination with anti-PDL1 therapy suppressed tumors in a mouse model. However, very few studies have investigated the roles of CCL19-CCRL2 and CCL19-CXCR3 in antitumor immunotherapy. In our study, the CCL19-CCRL2 interaction between DCs and macrophages was upregulated and the CCL19-CXCR3 interaction between DCs and T cells/NK cells was upregulated in responders compared with nonresponders. The CCL19-related axes seem to affect anti-PD-1 therapy. CCL5 deficiency was reported to promote infiltration of CD8 T cells into the TME and reduce resistance to anti-PD-1 therapy in a mouse model.Citation17 On the other hand, it was reported that antagonists of CCR4 could prevent the recruitment of Tregs into the TME and elicit antitumor responses in combination with anti-CTLA4 therapy.Citation39 In our study, the CCL5-CCR4 interaction between effector CD8 T cells/exhausted CD8 T cells/NK cells and CD4 T cells/proliferative T cells/Tregs was relatively stronger in nonresponders than in responders. A previous study showed that CCL4, a chemokine that recruits CD103+ DCs to the tumor by binding to CCR5, played a role in the response to ICIs.Citation40 CCL4 was also found to regulate functions of lymphocytes including activation, migration and proliferation by binding to CCR8.Citation41 To our knowledge, very few studies have investigated the function of the CCL4-SLC7A1 axis. In our study, CCL4-related interactions, including CCL4-CCR5/CCR8/SLC7A1 interactions, between CD8 T cells/macrophages and DCs/proliferative T cells/Tregs/tumor cells were relatively stronger in responders than in nonresponders.
Several other mechanisms facilitating anti-PD-1 therapy have been reported. The myeloid cell receptor tyrosine kinase AXL was found to be correlated with the expression of PD-L1 and CXCR6 in lung adenocarcinoma, and an AXL inhibitor decreased the expression levels of PD-L1 and CXCR6 in EGFR mutation-positive cell lines.Citation42 Furthermore, an AXL inhibitor was found to augment anti-PD-1 therapy in previous studies.Citation43,Citation44 In our study, we also identified the AXL-GAS6 interaction as a potential regulatory axis affected by anti-PD-1 therapy. Stimulation of TNFRSF4 (OX40) and simultaneous administration of anti-PD-1 antibodies has been predicted to improve survival in human cancer.Citation45 In addition, it was reported that TNFRSF5 (CD40) agonists could reverse resistance to anti-PD-1 therapy.Citation46,Citation47 Therefore, TNF-related axes seem to play a role in immunotherapy. To our surprise, in our study, we found that TNF-TNFRSF1A and TNF-FAS interactions between CD8 T cells/macrophages/tumor cells and other cells were consistently weaker in nonresponders than in responders, while the TNFSF10/MIF-TNFRSF10D interactions between other cells and endothelial cells and the TNFSF13-related ligand-receptor interactions between pDCs/macrophages and other cells were consistently weaker in responders than in nonresponders. It is possible that regulation of these TNF-related axes could improve the efficacy of anti-PD-1 therapy. It has been reported that targeting TGF-β1 and TGF-β2 can enhance the efficacy of anti-PD-1 therapy.Citation48 In our study, TGF-β was inconsistently affected across different cell-cell pairs in responders compared with nonresponders. TGFB1-TGFbeta interactions between CD8 T cells and tumor cells/CD8 T cells were downregulated. In contrast, TGFB1-TGFbeta interactions between NK cells/pDCs and CAFs/T cells/tumor cells were relatively and sharply downregulated in nonresponders versus responders. The TGFB1-TGFbeta receptor axes appeared to have different implications for anti-PD-1 therapy among different cell-cell pairs. We believe that selective targeting of specific TGFB1-related axes could be a better strategy than targeting all TGFbeta-related axes. Neuropilin-1 (NRP-1) was shown to be a potential target for strategies to be used in combination with anti-PD-1 therapy.Citation49 The interaction between NRP-1 and SEMA3A suppressed the migration and tumor-specific cytolytic function of cytotoxic T cells. To our surprise, in our study, we found that NRP-2 (an isoform of NRP-1)-related ligand-receptor interactions, specifically the NRP-2-SEMA3C and NRP-2-VEGFA interactions between CAFs/endothelial cells/DCs/macrophages/tumor cells and other cells, were relatively stronger in responders than in nonresponders. We speculate that NRP-1 and NRP-2 play opposite roles in antitumor immunity.
Previously, the tumor killing ability of exhausted CD8 T cells was believed to be relatively weak, but in our research, we found that there were more exhausted CD8 T cells in responders than in nonresponders to anti-PD-1 therapy. In Yost’s study, the researchers found that these exhausted CD8 T cells had a large number of expanded clones after anti-PD-1 therapy, while other CD8 T cells had few expanded clones. They found that these cells highly coexpressed CD39 and CD103, two markers considered to be tumor-specific T cell identification markers.Citation7,Citation8,Citation50 These findings suggest that these tumor-specific exhausted CD8 T cells may be the main cells killing tumors. Therefore, in our study, we analyzed the evolutionary trajectory of these exhausted CD8 T cells using ligand-receptor gene analyses. We found that these cells developed in three directions, and we divided the cells into four clusters. We found that one cluster of cells expressed the highest levels of CD39 and CD103, and this cluster had a distinct ligand-receptor expression pattern. The cells highly coexpressed immunosuppressive ligands/receptors such as HAVCR2,Citation51 CD74,Citation52 CSF1,Citation11 KLRC1,Citation13 and CD96Citation10 and highly coexpressed cytotoxicity-related or positive regulatory ligands/receptors such as GZMB, GNLY, NKG7, FASLG,Citation16 CLEC2B,Citation53 TNFRSF9 and the tissue residence-related gene CCL5.Citation54 During anti-PD-1 therapy, these cells upregulated genes related to cell survival, like heat shock protein genesCitation55 and CACYBP,Citation56 IFITM3,Citation57 and IL7R,Citation58 and downregulated several immunosuppressive genes, like KLRC1, ADGRE5,Citation33 and CSF1. We speculate that this cluster of tumor-specific cells actually responds to anti-PD-1 treatment and plays a major role in killing tumors. This finding may be helpful for the improvement of adoptive cellular immunotherapy.
Fibroblasts have gained extensive attention from researchers in the field of cancer research in recent years. Fibroblasts activated in the TME are termed CAFs or myofibroblasts depending on their characteristics. Recently, researchers have favored the idea that different subpopulations of fibroblasts in the TME serve heterogeneous functions in cancers. A review of fibroblasts indicated that CAFs (which have high expression of FAP) and myofibroblasts (which have high expression of α-SMA (also known as ACTA2)) are likely to play opposite roles in cancers.Citation59 In our study, CAFs (marked by FAP) expressed higher levels of immunosuppressive and protumor factors, such as SDF1 (CXCL12), CXCL14, IL-6, S100A4, SFRP2, WNT5A, WNT2 and MMPs, than myofibroblasts (marked by α-SMA).Citation60–67 This finding indicates that CAFs are very likely to have protumor effects, while myofibroblasts are likely to have normal or tumor-suppressive effects. Of note, the interactions of myofibroblasts with other cells were found to be increased in responders compared with nonresponders to anti-PD-1 therapy. Among these interactions, the fibronectin-1 (FN1)-integrin interactions between CAFs/myofibroblasts and other cells showed contrasting changes in responders and nonresponders. The FN1-integrin interactions between myofibroblasts and other cells in responders were broadly upregulated, while the FN1-integrin interactions between CAFs and other cells in nonresponders were broadly upregulated. To our knowledge, the functional role of FN1 in cancer development and treatment is complex and not yet fully understood. FN1 is known to be involved in cell adhesion, cell motility, opsonization, wound healing, and maintenance of cell shape. We speculate that, on the one hand, myofibroblasts can alter the architecture of tumors and can replace the role of CAFs in the TME to a certain degree, which probably alters the “barrier” function of the TME to immune cells or drugs; on the other hand, myofibroblasts establish different functional interactions with other cells and play a positive role in antitumor immunity. However, the specific mechanisms remain to be investigated.
Limitations exist in the current study. This study is a hypothesis-driven study based on scRNA-seq data. The roles of some of the genes proposed in the current study in immunotherapy have already been uncovered in several previous studies. However, there has not yet been biological corroboration of the functions and roles of some of the ligands/receptors mentioned in this study in immunotherapy.
In summary, in this work, cell-cell interaction analyses based on scRNA-seq data from paired tumor samples collected before and after anti-PD-1 treatment were performed to uncover the specific mechanisms underlying response and resistance to anti-PD-1 therapy in cancers. We identified several cell-cell interactions that may affect the efficacy of anti-PD-1 therapy. We also identified a cluster of tumor-specific CD8 T cells that presented a distinct pattern of expression of ligands and receptors. These results can be a valuable resource for investigating novel strategies aimed at overcoming resistance to anti-PD-1 therapy and developing new strategies for immunotherapy in cancer patients.
Authors’ contributions
Yi-Quan Jiang, Zi-Xian Wang, Ming Zhong, Xue Han, Lu-Jun Shen, Xuxiazi Zou contributed to the conception and design of the study, acquisition of the data, and analysis and interpretation of the data. Yi-Quan Jiang, Zi-Xian Wang, Xuxiazi Zou, Xue Han, Xin-Yi Liu, Yi-Nan Deng participated in critical drafting and revising of the article for important intellectual content. Yang Yang, Gui-Hua Chen, Wuguo Deng, Jin-Hua Huang contributed to the conception and design of the study and provided final approval of the version to be submitted and any revised versions.
Availability of data and material
All scRNA-seq and bulk-RNA sequencing data generated in this study are deposited in the Gene Expression Omnibus (GEO) under accession numbers GSE123813, GSE78220, GSE91061 and GSE145996 and in the ENA project under accession number PRJEB23709. The codes and supplemental materials are available at https://github.com/Yiquan-Jiang/Supplemental-Materials-for-article-ONCOIMM-20200713.git
Consent for publication
All authors agree with the content of the manuscript.
Data and Code Availability
All scRNA-seq and bulk-RNA sequencing data generated in this study are deposited in the Gene Expression Omnibus (GEO) under accession numbers GSE123813, GSE78220, GSE91061 and GSE145996 and in the ENA project under accession number PRJEB23709. The codes and supplemental materials are available at https://github.com/Yiquan-Jiang/Supplemental-Materials-for-article-ONCOIMM-20200713.git
Ethics approval and consent to participate
Not applicable.
List of abbreviations
Single-cell RNA (scRNA); Programmed cell death-1 (PD-1); immune checkpoint inhibitors (ICIs); Immune checkpoint blockade (ICB); Tumor microenvironment (TME); Cancer-associated fibroblasts (CAFs); Myeloid derived suppressive cells (MDSCs); Regulatory T cells (Tregs); Basal cell carcinoma (BCC); Principal components analysis (PCA); Principal components (PCs); Copy number variation (CNV); Differentially expressed genes (DEGs); Dendritic cells (DCs); plasmacytoid dendritic cells (pDCs), Gene Ontology (GO).
Supplemental Material
Download ()Acknowledgments
Thanks are due to Shuai He and Yu-Pei Chen for assistance with the analyses and valuable discussion.
Disclosure statement
No potential competing interest was reported by the authors.
Supplementary Material
Supplemental data for this article can be accessed on the publisher’s website.
Additional information
Funding
References
- Constantinidou A, Alifieris C, Trafalis DT. Targeting programmed cell death −1 (PD-1) and ligand (PD-L1): a new era in cancer active immunotherapy. Pharmacol Ther. 2019;194:84–18. doi:10.1016/j.pharmthera.2018.09.008.
- Gide TN, Wilmott JS, Scolyer RA, Long GV. Primary and acquired resistance to immune checkpoint inhibitors in metastatic melanoma. Clin Cancer Res. 2018;24(6):1260–1270. doi:10.1158/1078-0432.CCR-17-2267.
- Kim JM, Chen DS. Immune escape to PD-L1/PD-1 blockade: seven steps to success (or failure). Ann Oncol. 2016;27(8):1492–1504. doi:10.1093/annonc/mdw217.
- Pitt JM, Vetizou M, Daillere R, Roberti MP, Yamazaki T, Routy B. Resistance mechanisms to immune-checkpoint blockade in cancer: tumor-intrinsic and -extrinsic factors. Immunity. 2016;44(6):1255–1269. doi:10.1016/j.immuni.2016.06.001.
- Zhang M, Yang H, Wan L, Wang Z, Wang H, Ge C. Single-cell transcriptomic architecture and intercellular crosstalk of human intrahepatic cholangiocarcinoma. J Hepatol. 2020;73(5):1118–1130. doi:10.1016/j.jhep.2020.05.039.
- Xiong X, Kuang H, Ansari S, Liu T, Gong J, Wang S. Landscape of intercellular crosstalk in healthy and NASH liver revealed by single-cell secretome gene analysis. Mol Cell. 2019;75(3):644–60 e5. doi:10.1016/j.molcel.2019.07.028.
- Duhen T, Duhen R, Montler R, Moses J, Moudgil T, De Miranda NF. Co-expression of CD39 and CD103 identifies tumor-reactive CD8 T cells in human solid tumors. Nat Commun. 2018;9(1):2724. doi:10.1038/s41467-018-05072-0.
- Simoni Y, Becht E, Fehlings M, Loh CY, Koo SL, Teng KWW. Bystander CD8(+) T cells are abundant and phenotypically distinct in human tumour infiltrates. Nature. 2018;557(7706):575–579. doi:10.1038/s41586-018-0130-2.
- Yost KE, Satpathy AT, Wells DK, Qi Y, Wang C, Kageyama R. Clonal replacement of tumor-specific T cells following PD-1 blockade. Nat Med. 2019;25(8):1251–1259. doi:10.1038/s41591-019-0522-3.
- Mittal D, Lepletier A, Madore J, Aguilera AR, Stannard K, Blake SJ. CD96 is an immune checkpoint that regulates CD8(+) T-cell antitumor function. Cancer Immunol Res. 2019;7(4):559–571. doi:10.1158/2326-6066.CIR-18-0637.
- Neubert NJ, Schmittnaegel M, Bordry N, Nassiri S, Wald N, Martignier C. T cell-induced CSF1 promotes melanoma resistance to PD1 blockade. Sci Transl Med. 2018;10(436). doi:10.1126/scitranslmed.aan3311.
- Tanese K, Hashimoto Y, Berkova Z, Wang Y, Samaniego F, Lee JE. Cell surface CD74-MIF interactions drive melanoma survival in response to interferon-gamma. J Invest Dermatol. 2015;135(11):2901. doi:10.1038/jid.2015.259.
- Van Montfoort N, Borst L, Korrer MJ, Sluijter M, Marijt KA, Santegoets SJ. NKG2A blockade potentiates CD8 T cell immunity induced by cancer vaccines. Cell. 2018;175(7):1744–55 e15. doi:10.1016/j.cell.2018.10.028.
- Wolf Y, Anderson AC, Kuchroo VK. TIM3 comes of age as an inhibitory receptor. Nat Rev Immunol. 2020;20(3):173–185. doi:10.1038/s41577-019-0224-6.
- Bandala-Sanchez E, Zhang Y, Reinwald S, Dromey JA, Lee BH, Qian J. T cell regulation mediated by interaction of soluble CD52 with the inhibitory receptor Siglec-10. Nat Immunol. 2013;14(7):741–748. doi:10.1038/ni.2610.
- Kassahn D, Nachbur U, Conus S, Micheau O, Schneider P, Simon HU. Distinct requirements for activation-induced cell surface expression of preformed Fas/CD95 ligand and cytolytic granule markers in T cells. Cell Death Differ. 2009;16(1):115–124. doi:10.1038/cdd.2008.133.
- Zhang S, Zhong M, Wang C, Xu Y, Gao WQ, Zhang Y. CCL5-deficiency enhances intratumoral infiltration of CD8(+) T cells in colorectal cancer. Cell Death Dis. 2018;9(7):766. doi:10.1038/s41419-018-0796-2.
- Hugo W, Zaretsky JM, Sun L, Song C, Moreno BH, Hu-Lieskovan S. Genomic and transcriptomic features of response to Anti-PD-1 therapy in metastatic melanoma. Cell. 2017;168(3):542. doi:10.1016/j.cell.2017.01.010.
- Riaz N, Havel JJ, Makarov V, Desrichard A, Urba WJ, Sims JS. Tumor and microenvironment evolution during immunotherapy with nivolumab. Cell. 2017;171(4):934–49 e16. doi:10.1016/j.cell.2017.09.028.
- Amato CM, Hintzsche JD, Wells K, Applegate A, Gorden NT, Vorwald VM. Pre-treatment mutational and transcriptomic landscape of responding metastatic melanoma patients to Anti-PD1 immunotherapy. Cancers (Basel). 2020;12(7). doi:10.3390/cancers12071943.
- Gide TN, Quek C, Menzies AM, Tasker AT, Shang P, Holst J. Distinct immune cell populations define response to Anti-PD-1 monotherapy and Anti-PD-1/Anti-CTLA-4 combined therapy. Cancer Cell. 2019;35(2):238–55 e6. doi:10.1016/j.ccell.2019.01.003.
- Efremova M, Vento-Tormo M, Teichmann SA, Vento-Tormo R. CellPhoneDB: inferring cell-cell communication from combined expression of multi-subunit ligand-receptor complexes. Nat Protoc. 2020;15(4):1484–1506. doi:10.1038/s41596-020-0292-x.
- Vento-Tormo R, Efremova M, Botting RA, Turco MY, Vento-Tormo M, Meyer KB. Single-cell reconstruction of the early maternal-fetal interface in humans. Nature. 2018;563(7731):347–353. doi:10.1038/s41586-018-0698-6.
- Xu Q, Long Q, Zhu D, Fu D, Zhang B, Han L. Targeting amphiregulin (AREG) derived from senescent stromal cells diminishes cancer resistance and averts programmed cell death 1 ligand (PD-L1)-mediated immunosuppression. Aging Cell. 2019;18(6):e13027. doi:10.1111/acel.13027.
- Tinoco R, Carrette F, Barraza ML, Otero DC, Magana J, Bosenberg MW. PSGL-1 is an immune checkpoint regulator that promotes T Cell exhaustion. Immunity. 2016;44(6):1470. doi:10.1016/j.immuni.2016.05.011.
- Tinoco R, Otero DC, Takahashi AA, Lm B. PSGL-1: a new player in the immune checkpoint landscape. Trends Immunol. 2017;38(5):323–335. doi:10.1016/j.it.2017.02.002.
- Chou FC, Chen HY, Kuo CC, Sytwu HK. Role of galectins in tumors and in Clinical immunotherapy. Int J Mol Sci. 2018;19(2). doi:10.3390/ijms19020430.
- Jmj VDB, Smits E, Berneman ZN, Hutten TJA, De Reu H, Vfi VT. Monocyte-derived dendritic cells with silenced PD-1 ligands and transpresenting interleukin-15 stimulate strong tumor-reactive T-cell expansion. Cancer Immunol Res. 2017;5(8):710–715. doi:10.1158/2326-6066.CIR-16-0336.
- Luo C, Balsa E, Perry EA, Liang J, Tavares CD, Vazquez F. H3K27me3-mediated PGC1alpha gene silencing promotes melanoma invasion through WNT5A and YAP. J Clin Invest. 2020;130(2):853–862. doi:10.1172/JCI130038.
- Zhao F, Xiao C, Evans KS, Theivanthiran T, DeVito N, Holtzhausen A. Paracrine Wnt5a-beta-catenin signaling triggers a metabolic program that drives dendritic cell tolerization. Immunity. 2018;48(1):147–60 e7. doi:10.1016/j.immuni.2017.12.004.
- Liu Q, Zhu H, Tiruthani K, Shen L, Chen F, Gao K. Nanoparticle-mediated trapping of Wnt family member 5A in tumor microenvironments enhances immunotherapy for B-Raf Proto-Oncogene mutant melanoma. ACS Nano. 2018;12(2):1250–1261. doi:10.1021/acsnano.7b07384.
- Cr F, Ra A, Mousdell S, Pt R-L, Ireland L, Santos A. Blockade of MIF-CD74 signalling on macrophages and dendritic cells restores the antitumour immune response against metastatic melanoma. Front Immunol. 2018;9:1132. doi:10.3389/fimmu.2018.01132.
- Yin Y, Xu X, Tang J, Zhang W, Zhangyuan G, Ji J. CD97 promotes tumor aggressiveness through the traditional G protein-coupled receptor-mediated signaling in hepatocellular carcinoma. Hepatology. 2018;68(5):1865–1878. doi:10.1002/hep.30068.
- Geller A, Yan J. The role of membrane bound complement regulatory proteins in tumor development and cancer immunotherapy. Front Immunol. 2019;10:1074. doi:10.3389/fimmu.2019.01074.
- Daniel SK, Seo YD, Pillarisetty VG. The CXCL12-CXCR4/CXCR7 axis as a mechanism of immune resistance in gastrointestinal malignancies. Semin Cancer Biol. 2019. doi:10.1016/j.semcancer.2019.12.007.
- Catusse J, Leick M, Groch M, Clark DJ, Buchner MV, Zirlik K. Role of the atypical chemoattractant receptor CRAM in regulating CCL19 induced CCR7 responses in B-cell chronic lymphocytic leukemia. Mol Cancer. 2010;9(1):297. doi:10.1186/1476-4598-9-297.
- Leick M, Catusse J, Follo M, Nibbs RJ, Hartmann TN, Veelken H. CCL19 is a specific ligand of the constitutively recycling atypical human chemokine receptor CRAM-B. Immunology. 2010;129(4):536–546. doi:10.1111/j.1365-2567.2009.03209.x.
- Milicevic NM, Miljkovic MD, Milicevic Z, Labudovic-Borovic M, Wang X, Laan M. Role of CCL19/21 and its possible signaling through CXCR3 in development of metallophilic macrophages in the mouse thymus. Histochem Cell Biol. 2011;135(6):593–601. doi:10.1007/s00418-011-0818-y.
- Robles O, Jackson JJ, Marshall L, Talay O, Chian D, Cutler G. Novel Piperidinyl-Azetidines as potent and selective CCR4 antagonists elicit antitumor response as single agent and in combination with checkpoint inhibitors. J Med Chem. 2020;15. doi:10.1021/acs.jmedchem.0c00988.
- Williford JM, Ishihara J, Ishihara A, Mansurov A, Hosseinchi P, Marchell TM. Recruitment of CD103(+) dendritic cells via tumor-targeted chemokine delivery enhances efficacy of checkpoint inhibitor immunotherapy. Sci Adv. 2019;5(12):eaay1357. doi:10.1126/sciadv.aay1357.
- Bernardini G, Hedrick J, Sozzani S, Luini W, Spinetti G, Weiss M. Identification of the CC chemokines TARC and macrophage inflammatory protein-1 beta as novel functional ligands for the CCR8 receptor. Eur J Immunol. 1998;28(2):582–588. doi:10.1002/(SICI)1521-4141(199802)28:02<582::AID-IMMU582>3.0.CO;2-A.
- Tsukita Y, Fujino N, Miyauchi E, Saito R, Fujishima F, Itakura K. Axl kinase drives immune checkpoint and chemokine signalling pathways in lung adenocarcinomas. Mol Cancer. 2019;18(1):24. doi:10.1186/s12943-019-0953-y.
- Holtzhausen A, Harris W, Ubil E, Hunter DM, Zhao J, Zhang Y. TAM family receptor kinase inhibition reverses MDSC-mediated suppression and augments Anti-PD-1 therapy in Melanoma. Cancer Immunol Res. 2019;7(10):1672–1686. doi:10.1158/2326-6066.CIR-19-0008.
- Sadahiro H, Kang KD, Gibson JT, Minata M, Yu H, Shi J. Activation of the receptor Tyrosine Kinase AXL regulates the immune microenvironment in glioblastoma. Cancer Res. 2018;78(11):3002–3013. doi:10.1158/0008-5472.CAN-17-2433.
- Fromm G, De Silva S, Johannes K, Patel A, Hornblower JC, Schreiber TH. Agonist redirected checkpoint, PD1-Fc-OX40L, for cancer immunotherapy. J Immunother Cancer. 2018;6(1):149. doi:10.1186/s40425-018-0454-3.
- Ahn SH, Choi JY, Kim SD, Park SJ, Kim H. Accelerated elimination of human cancer cells by a CD40 agonist antibody combined with a PD-1 antagonist in CD4-depleted mice. Oncol Lett. 2019;18(6):5889–5896. doi:10.3892/ol.2019.10991.
- Ma HS, Poudel B, Torres ER, Sidhom JW, Robinson TM, Christmas B. A CD40 Agonist and PD-1 Antagonist antibody reprogram the microenvironment of nonimmunogenic tumors to allow T-cell-mediated anticancer activity. Cancer Immunol Res. 2019;7(3):428–442. doi:10.1158/2326-6066.CIR-18-0061.
- Terabe M, Robertson FC, Clark K, De Ravin E, Bloom A, Venzon DJ. Blockade of only TGF-beta 1 and 2 is sufficient to enhance the efficacy of vaccine and PD-1 checkpoint blockade immunotherapy. Oncoimmunology. 2017;6(5):e1308616. doi:10.1080/2162402X.2017.1308616.
- Leclerc M, Voilin E, Gros G, Corgnac S, De Montpreville V, Validire P. Regulation of antitumour CD8 T-cell immunity and checkpoint blockade immunotherapy by Neuropilin-1. Nat Commun. 2019;10(1):3345. doi:10.1038/s41467-019-11280-z.
- Li H, Van Der Leun AM, Yofe I, Lubling Y, Gelbard-Solodkin D, Acj VA. Dysfunctional CD8 T cells form a proliferative, dynamically regulated compartment within human melanoma. Cell. 2019;176(4):775–89 e18. doi:10.1016/j.cell.2018.11.043.
- Das M, Zhu C, Kuchroo VK. Tim-3 and its role in regulating anti-tumor immunity. Immunol Rev. 2017;276(1):97–111. doi:10.1111/imr.12520.
- Vandenbark AA, Meza-Romero R, Benedek G, Andrew S, Huan J, Chou YK. A novel regulatory pathway for autoimmune disease: binding of partial MHC class II constructs to monocytes reduces CD74 expression and induces both specific and bystander T-cell tolerance. J Autoimmun. 2013;40:96–110. doi:10.1016/j.jaut.2012.08.004.
- Kuttruff S, Koch S, Kelp A, Pawelec G, Rammensee HG, Steinle A. NKp80 defines and stimulates a reactive subset of CD8 T cells. Blood. 2009;113(2):358–369. doi:10.1182/blood-2008-03-145615.
- Dangaj D, Bruand M, Grimm AJ, Ronet C, Barras D, Duttagupta PA. Cooperation between constitutive and inducible chemokines enables T Cell engraftment and immune attack in solid tumors. Cancer Cell. 2019;35(6):885–900 e10. doi:10.1016/j.ccell.2019.05.004.
- Beere HM. Death versus survival: functional interaction between the apoptotic and stress-inducible heat shock protein pathways. J Clin Invest. 2005;115(10):2633–2639. doi:10.1172/JCI26471.
- Fukushima T, Zapata JM, Singha NC, Thomas M, Kress CL, Krajewska M. Critical function for SIP, a ubiquitin E3 ligase component of the beta-catenin degradation pathway, for thymocyte development and G1 checkpoint. Immunity. 2006;24(1):29–39. doi:10.1016/j.immuni.2005.12.002.
- Wakim LM, Gupta N, Mintern JD, Villadangos JA. Enhanced survival of lung tissue-resident memory CD8(+) T cells during infection with influenza virus due to selective expression of IFITM3. Nat Immunol. 2013;14(3):238–245. doi:10.1038/ni.2525.
- Ss C, Bc P, Ak S, Ld R, Dj S, Us K. Tumor-specific effector CD8+ T Cells that can establish immunological memory in humans after adoptive transfer are marked by expression of IL7 receptor and c-myc. Cancer Res. 2015;75(16):3216–3226. doi:10.1158/0008-5472.CAN-15-0584.
- Chen X, Song E. Turning foes to friends: targeting cancer-associated fibroblasts. Nat Rev Drug Discov. 2019;18(2):99–115. doi:10.1038/s41573-018-0004-1.
- Kojima Y, Acar A, Eaton EN, Mellody KT, Scheel C, Ben-Porath I. Autocrine TGF-beta and stromal cell-derived factor-1 (SDF-1) signaling drives the evolution of tumor-promoting mammary stromal myofibroblasts. Proc Natl Acad Sci U S A. 2010;107(46):20009–20014. doi:10.1073/pnas.1013805107.
- Augsten M, Sjoberg E, Frings O, Vorrink SU, Frijhoff J, Olsson E. Cancer-associated fibroblasts expressing CXCL14 rely upon NOS1-derived nitric oxide signaling for their tumor-supporting properties. Cancer Res. 2014;74(11):2999–3010. doi:10.1158/0008-5472.CAN-13-2740.
- Zhu Q, Zhang X, Zhang L, Li W, Wu H, Yuan X. The IL-6-STAT3 axis mediates a reciprocal crosstalk between cancer-derived mesenchymal stem cells and neutrophils to synergistically prompt gastric cancer progression. Cell Death Dis. 2014;5(6):e1295. doi:10.1038/cddis.2014.263.
- Grum-Schwensen B, Klingelhofer J, Berg CH, El-Naaman C, Grigorian M, Lukanidin E. Suppression of tumor development and metastasis formation in mice lacking the S100A4(mts1) gene. Cancer Res. 2005;65(9):3772–3780. doi:10.1158/0008-5472.CAN-04-4510.
- Kaur A, Webster MR, Marchbank K, Behera R, Ndoye A, Kugel CH 3rd. sFRP2 in the aged microenvironment drives melanoma metastasis and therapy resistance. Nature. 2016;532(7598):250–254. doi:10.1038/nature17392.
- Endo M, Nishita M, Fujii M, Minami Y. Insight into the role of Wnt5a-induced signaling in normal and cancer cells. Int Rev Cell Mol Biol. 2015;314:117–148.
- Unterleuthner D, Neuhold P, Schwarz K, Janker L, Neuditschko B, Nivarthi H. Cancer-associated fibroblast-derived WNT2 increases tumor angiogenesis in colon cancer. Angiogenesis. 2020;23(2):159–177. doi:10.1007/s10456-019-09688-8.
- Bonnans C, Chou J, Werb Z. Remodelling the extracellular matrix in development and disease. Nat Rev Mol Cell Biol. 2014;15(12):786–801. doi:10.1038/nrm3904.