
ABSTRACT
Different mechanisms lead to immune checkpoint inhibitor (ICI) resistance. Identifying clinically useful biomarkers might improve drug selection and patients’ therapy. We analyzed the soluble immune checkpoints sPD1, sPDL1, sLAG3, and sTIM3 using ELISA and their expression on circulating T cells using FACS in pre- and on-treatment blood samples of ICI treated melanoma patients. In addition, pre-treatment melanoma metastases were stained for TIM3 and LAG3 expression by IHC. Results were correlated with treatment response and progression-free survival (PFS). Resistance to anti-PD1 treatment (n = 48) was associated with high pre-treatment serum levels of sLAG3 (DCR: p = .009; PFS: p = .018; ROC cutoff >148 pg/ml) but not sPD1, sPDL1 or sTIM3. In contrast, resistance to ipilimumab plus nivolumab (n = 42) was associated with high levels of sPD1 (DCR: p = .019, PFS: p = .046; ROC cutoff >167 pg/ml) but not sPDL1, sLAG3 or sTIM3. Both treatment regimens shared a profound increase of sPD1 serum levels with treatment (p < .0001). FACS analysis revealed reduced frequencies of CD3+ CD8+ PD1 + T cells (p = .028) in anti-PD1-resistant patients, whereas increased frequencies of CD3+ CD4+ LAG3 + T cells characterized patients resistant to ipilimumab plus nivolumab (p = .033). Unlike anti-PD1 monotherapy, combination blockade significantly increased proliferating T cells (CD3+ CD8+ Ki67 + T cells; p < .0001) and eosinophils (p = .001). In melanoma metastases, an increased infiltration with TIM3+ or LAG3 + T cells in the tumor microenvironment correlated with a shorter PFS under anti-PD1 treatment (TIM3: p = .019, LAG3: p = .07). Different soluble immune checkpoints characterized checkpoint inhibitor-resistant melanoma. Measuring these serum markers may have the potential to be used in clinical routine.
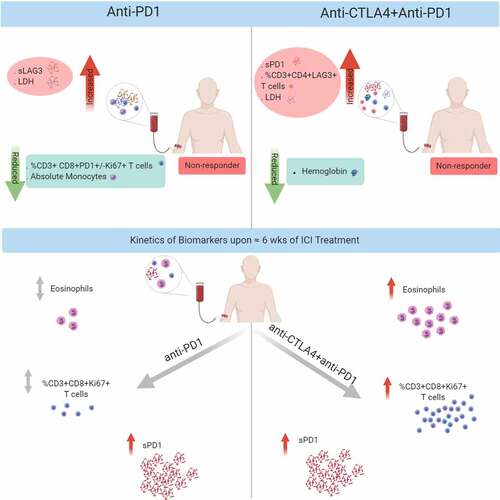
Graphical abstract
Introduction
Immunotherapy with immune checkpoint inhibitors (ICIs), such as anti-programmed cell death 1 (anti-PD1) antibodies pembrolizumab or nivolumab alone or in combination with anti-cytotoxic T-lymphocyte-associated antigen-4 (anti-CTLA4) antibody ipilimumab plus nivolumab, has the potential to induce durable responses and increased overall survival in several tumor entities but especially advanced melanoma.Citation1–5 T cells are the main effector cells of ICI treatment as they express the immune checkpoints CTLA4 and PD1 upon activation which lead to T-cell exhaustion and energy. Blockage of these immune checkpoints thereby restores T-cell activation. However, only about one-third of advanced melanoma patients benefit long term from ICI treatment, most patients eventually progress. Identifying biomarkers to indicate ICI treatment resistance in advance would help to select patients and guide treatment decisions and save patients valuable time for alternative therapies. Moreover, the distinct mechanism of action of anti-CTLA4 and anti-PD1 treatmentCitation6 demands treatment-specific biomarkers.
Multiple mechanisms of ICI resistance are postulated and explored, including the expression of alternative immune checkpoints, such as T cell immunoglobulin and mucin domain-containing molecule-3 (TIM3) and lymphocyte-activation gene 3 (LAG3).Citation7–9 In melanoma metastases, transcriptome analysis revealed an increase in LAG3 expression 2–4 weeks after initiation of PD1 monotherapy (SITC, 2017).Citation10 Johnson et al. have shown that tumors acquire immunosuppressive signals through alternative checkpoints that antagonize MHC-II expression, such as LAG3.Citation9 Together, these data suggest the role of TIM3 and LAG3 expression in resistance to ICI treatment and thus analyzing their expression in melanoma patient samples may help to predict treatment outcome. In the peripheral blood, PD1 + T cells are among the tumor-related T-cell clonesCitation11,Citation12 and the majority of melanoma patients exhibit an increase in circulating Ki67+ PD1+ CD8 + T cells under anti-PD1 treatment.Citation13 Here, a high fold change adjusted for baseline tumor burden correlated with longer progression-free survival (PFS). However, in another investigation, the average frequency of PD1+ CD4+ and TIM3+ CD8+ circulating T cells monitored over the period of anti-PD1 treatment was significantly higher in nonresponders compared to responders.Citation14 In a mouse model, upon CTLA-4 treatment a suppressive ICOS+LAG3+ CD4 + T-cell subset was reduced with a concomitant rise in IL-2-producing T effector cells.Citation15 However, significant findings were only detected under treatment, limiting their usefulness as a predictive biomarker for the clinical routine testing.
Interestingly, immune checkpoint proteins, known to be released by immune or cancer cells can be found in the blood as soluble forms.Citation16–20 Besides the well-studied membrane-bound immune checkpoints, the role of soluble immune checkpoints is actively being explored. Elevated serum concentrations of soluble programmed death-ligand-1 (sPDL1) and soluble PD1 (sPD1) at baseline are linked to an increased risk of disease progression upon treatment with immune checkpoint inhibitors in patients with melanoma.Citation17,Citation21 In a cooperative work, an increase in soluble interleukin-2 and soluble LAG3 (sLAG3) after only one cycle of ipilimumab was detected.Citation15
In this study, we aimed to investigate the soluble immune checkpoints sPD1, sPDL1, sLAG3, and sTIM3 as potential biomarkers for immunotherapy resistance and determine their kinetics in the blood of melanoma patients under ICI treatment with either PD1 monotherapy or ipilimumab plus nivolumab combination therapy. In addition, the expression of these immune checkpoints on circulating T-cell subsets and the infiltration of LAG3+ and TIM3 + T cells in melanoma metastases was studied.
Materials and methods
Patient selection
Patients with advanced melanoma who received treatment with anti-PD1 and/or anti-CTLA4 therapy between 2011 and 2018 were identified from routine patient documentation of the Section of Dermatooncology, Department of Dermatology and NCT Heidelberg. Patients who agreed to biobanking of samples were identified. Cohort I consists of patients with serum samples before and about 6 weeks in median (range 3–16 weeks) on ICI treatment for the analysis of soluble immune checkpoints. If available, PBMCs were used for FACS analyses of the T cell subsets. Cohort II consists of patients with archived formalin-fixed tissue samples from melanoma metastases before ICI treatment start. Patient characteristics and the analytical information of routine clinical blood parameters were extracted from the medical records retrospectively. Five patients with overall survival less than 3 months after ICI treatment initiation were excluded. Biobanking of patient material and the retrospective analysis of patient data were approved by the Ethical Committee of the Medical Faculty of Heidelberg (S-207/2005, S-091/2011, S-454/2015).
Definition of response and survival
We used the following treatment response categories defined by the response evaluation criteria in solid tumors (RECIST v1.1) criteria: complete response (CR), partial response (PR), stable disease (SD), and progressive disease (PD). Patients with PD were classified as nonresponders and patients with CR, PR, or SD as patients with the disease control (DCR) as best response. Progression-free survival (PFS) was measured from the start of treatment to documented evidence of PD or death; patients without an event were censored at the last contact date.
Collection of serum and peripheral blood mononuclear cells
Pre- and on-treatment peripheral blood samples were collected and processed according to the standard NCT biobank protocols. The blood samples were centrifuged at 2,500 × g for 10 min for serum separation, divided into 200–300 uL aliquots, and stored at –80°C. For PBMC isolation, peripheral blood samples were collected in EDTA-coated tubes and carefully layered on top of a Ficoll-Hypaque density gradient solution (Biocoll, Biochrom). After centrifugation, the ring of PBMCs was collected, washed twice, resuspended in PBS, counted, resuspended in freezing medium (70% FCS, 20% X–vivo20, 10% DMSO), and frozen at −80°C before subsequent storage in liquid nitrogen until analysis.
Immunophenotyping via flow cytometry
Cells washed in PBS with 2% FCS (FACS buffer) were incubated with a human Fc receptor blocking reagent (KIOVIG, 100 mg/ml infusion solution, normal human immunoglobulin, Baxter). Live/Dead cell viability dye (Thermo Fisher Scientific) was used to be able to distinguish live and dead cells. Cells were then stained with the following extracellular fluorescent-labeled antibodies (BD Biosciences) according to a T cell panel (staining CD3, CD4, CD8, Ki67, LAG3, PD1, TIM3) or a Treg panel (staining CD3, CD4, CD25, CD127, PD1, FoxP3, Ki67): anti-CD3-FITC (UCHT1), anti-CD4-APC-H7 (RPA-T4), anti-CD8-PerCP-Cy™5.5 (RPA-T8), anti-LAG3-BV421 (T47-530), anti-PD1-PE (T cell panel)/-PE-Cy™7 (Treg panel) (EH12.1), anti-TIM3-Alexa Fluor® 647 (7D3), anti-CD25-APC (M-A251), anti-CD127-PerCP-Cy™5.5 (HIL-7 R-M-21). After staining for cell surface markers, cells were washed twice with FACS buffer and incubated with fixation/permeabilization buffer (Invitrogen) at 4°C for 45 min. After two washes with permeabilization wash buffer, cells were intracellularly stained for FoxP3 (anti-FoxP3-PE (236A/E7), BD Biosciences) and/or Ki67 (anti-Ki67-PE-Cy ™7 (T cell panel)/-BV421 (Treg panel) (B56), BD Biosciences) for 30 min at 4°C. After washing, the cells were analyzed on a BD FACS Canto II (BD Biosciences) with single-stained antibody-capturing beads used for compensation (CompBeads, BD Biosciences). Data were analyzed using FlowJo software version 10 (Tree Star, Ashland, OR, USA). T cells (live, single cells, lymphocytes, CD3+ cells) were divided into CD4+ or CD8+ populations and further gated according to the expression of Ki67, PD1, LAG3, TIM3 for the T cell panel, and CD4+ CD25+ CD127- cells were further divided according to the expression of PD1, FoxP3 or Ki67 for the Treg panel.
ELISA
Serum concentrations of soluble immune checkpoint proteins were measured using commercially available ELISA kits according to the manufacturer’s instructions (PD1 kit (#LS-F470-1, LS Bio), PDL1 kit (#ab214565, Abcam), TIM3 kit (#ab231932, Abcam), LAG3 kit (#ab193707, Abcam). The intra- and inter-assay coefficient of variation was within 8% and 18%.
Immunohistochemistry
Archived FFPE tissue sections were cut (2–3 μm thick), and immunohistochemistry (IHC) was performed using an automated stainer (Leica BOND-MAXTM, Leica Microsystems). The antigens were retrieved by heating the samples for 20 min at 100°C in citrate buffer (pH 6.0). Sections were incubated with rabbit polyclonal anti‐TIM3 antibody (1: 500; #ab185703, Abcam) or rabbit monoclonal anti‐LAG3 antibody (1:500; #ab180187, Abcam) at 37°C for 30 min. The IHC reaction was detected using a Polymer Refine detection kit (#DS9800, Leica Biosystems) and diaminobenzidine was used as a chromogen. Sections were faintly counterstained with hematoxylin. Stained whole slide tissue sections were digitized into high-resolution images using a scanner. The digital images were then marked and the IHC staining of TIM3 and LAG3 in the TME was evaluated as the density of cells, defined as the number of positive cells/mm2 in the tumor region using Visiomorph automated programming tool. The average score of all the areas within the tumor region for each marker was assessed, and the final scores were later categorized based on the median into high or low for statistical analysis.
Statistical analysis
Differences between the different variables in the groups and ICI treatment response were assessed by Mann–Whitney U (MWU) or chi-square test. Differences between pre- and on-treatment samples were analyzed using the Wilcoxon-rank test (WCR). Cutoff values for all significant biomarker variables were determined by ROC curve analysis using response as an event. Kaplan–Meier Analysis and the Log-rank test were used for survival analysis and the hazard ratio (HR) was determined through a Cox proportional hazard regression model. Multivariable regressions were performed to adjust for potential confounders based on univariable regression analysis. Only baseline variables that achieved a significance level of p < .05 were included in the multivariable model. The correlations between continuous variables were determined by Pearson’s coefficient. All statistical analyses were performed using SPSS version 24 (IBM), and the graphs for data presentation was created using GraphPad Prism version 8 (GraphPad Software, Inc., La Jolla, CA, USA). The bars and lines in the column graphs represent median values and 95% CI. All reported p-values are two-sided, and p < .05 was considered to indicate a statistically significant difference.
Results
sLAG3 and sPD1 indicate resistance to anti-PD1 and combined anti-CTLA4 plus anti-PD1 treatment, respectively
Using ELISA, we measured the soluble immune checkpoints sPD1, sPDL1, sLAG3, and sTIM3 in serum samples before and about 6 weeks after the initiation of ICI therapy. Paired serum samples were available from 113 patients with metastasized stage IV melanoma (cohort 1) who were treated with a PD1 antibody and/or ipilimumab at the Section for Dermatooncology, Department of Dermatology and National Center for Tumor Diseases, University Hospital Heidelberg. Patient characteristics are summarized in . Of 113 patients, 48 (43%) patients received anti-PD1 monotherapy (47 pembrolizumab, 1 nivolumab), 42 (37%) ipilimumab plus nivolumab, and 23 (20%) ipilimumab monotherapy. The median follow-up of patients was 14 months.
Table 1. Patient characteristics by treatment group (Cohort 1)
In patients treated with PD1 monotherapy increased concentrations of sLAG3 in pre-treatment samples were observed in patients resistant to the treatment (PD vs DCR, p = .032) with a median value of 186 pg/ml in nonresponding patients and 85 pg/ml in patients with at least stable disease (DCR, ). Univariate Cox regression and Kaplan–Meier analysis revealed that patients with sLAG3 concentrations above 148 pg/ml (ROC cutoff: ) experienced significantly shorter progression-free survival (p = .018; HR: 0.40; 95%CI: 0.19–0.85; log-rank test: p = 0,007) (; ) under anti-PD1 therapy. Apart from sLAG3, serum lactate dehydrogenase (LDH) levels and absolute monocytes in pre-treatment samples of the peripheral blood were found to be significantly associated with the clinical outcome of anti-PD1 treatment (; Supplemental text; Supplemental Figure S1). However, sLAG3 remains a significant predictive factor for the response (p = .014) and PFS (0.016) when adjusted to LDH and absolute monocyte count ().
Table 2. Univariable and multivariable regression analysis of response and PFS to anti-PD1 treatment
Figure 1. sLAG3 indicates resistance to anti-PD1 treatment
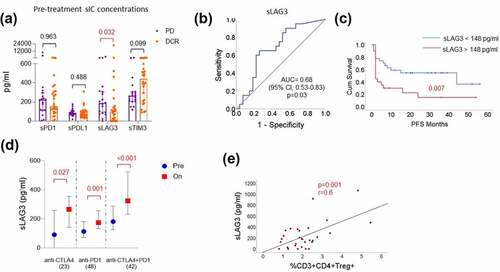
However, no such association between sLAG3 and response to combination treatment with ipilimumab and nivolumab (p = .499) or ipilimumab monotherapy (p = .277) (Supplemental Figure S2) was observed. The sLAG3 concentrations increased in patient serum samples upon all the three immune checkpoint regimens within approximately 6 weeks (). In a similar fashion to the pre-treatment concentrations of sLAG3, a trend of increased sLAG3 under PD1 treatment was observed in nonresponders (p = .135; Supplemental Figure S2). In addition, the concentration of sLAG3 positively correlated with the frequencies of CD3+ CD4+ CD25+ CD127- regulatory T cells (p = .001; r = 0.6) in the peripheral blood ().
A significant difference in the pre-treatment concentration of sPD1 with response was observed in patients treated with ipilimumab plus nivolumab combination treatment (p = .012) in which the patients who were at least stable under treatment (DCR) had a median sPD1 concentration of 149 pg/ml compared to a median concentration of 459 pg/ml in patients who were primarily resistant (PD, ). Univariate Cox regression and Kaplan–Meier analysis revealed that patients with a concentration of sPD1 above 167 pg/ml in pre-treatment samples (ROC cutoff: ) experienced significantly shorter PFS (p = .046; HR: 0.44; 95%CI: 0.20–0.98; log-rank test: p = .029) (; ). Apart from sPD1, LDH and hemoglobin levels in pre-treatment blood samples were found to be significantly associated with response to ipilimumab plus nivolumab combination treatment (; Supplemental text; Supplemental Figure S1). Again, when adjusted to baseline LDH and hemoglobin concentration in the blood, sPD1 remained a significant predictor of response (p = .036) and PFS (p = .038) for the combination treatment ().
Table 3. Univariable and multivariable regression analysis of response and PFS to Anti-CTLA4 plus anti-PD1 combination treatment
Figure 2. sPD1 indicates resistance to anti-CTLA4 plus anti-PD1 combination treatment
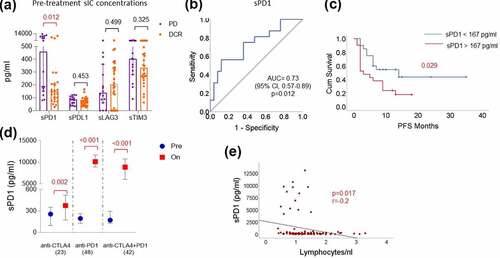
However, following the treatment with anti-PD1 or combination treatment, a dramatic increase of sPD1 concentrations in the blood was observed (p < .0001), compared to patients treated with anti-CTLA4 alone (p = .001) (). Correlation with circulating immune cells and T cell subsets revealed that pre-treatment concentrations of sPD1 negatively correlated with the absolute lymphocyte count (p = .017; r = −0.2; ) and the PD1 expression on CD4+ and CD8 + T cells (Supplemental Figure S3), and positively correlated with the expression of the alternative immune checkpoints LAG3 and TIM3 on CD4+ and CD8 + T cells and proliferating Tregs (p < .05; Supplemental Figure S3).
In this study, we did not find any strong associations between sPDL1 and sTIM3 concentrations and the clinical outcome of ICI treated patients. However, there were significant treatment-specific dynamics of these markers and correlations with other variables in the peripheral blood such as a significant increase in sPDL1 upon combination treatment and a positive correlation between sPDL1 and sTIM3 (supplemental text)
Peripheral T cell subsets indicate response and display differential dynamics upon anti-PD1 and anti-CTLA4 plus anti-PD1 combination treatment
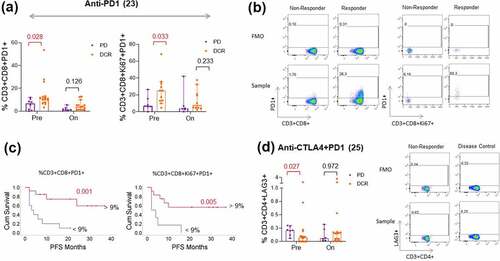
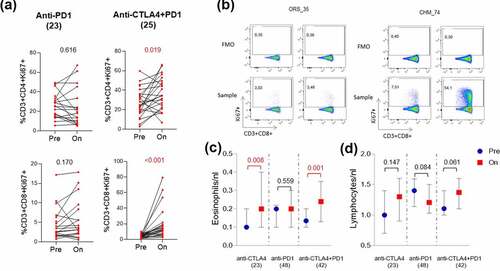
Circulating T cells are targets for ICIs. Therefore, we monitored in a subset of patients from cohort 1 with available samples, the T cell phenotypes in patient blood samples and correlated them with the response to anti-PD1 (pembrolizumab (n = 23) and anti-CTLA4 plus anti-PD1 combination treatment (ipilimumab plus nivolumab (n = 25). The frequencies of CD3 + T lymphocytes from flow cytometry analysis positively correlated with the absolute lymphocyte count analyzed in the clinical routine blood film (p = .001; r = 0.5) (Supplemental Figure S4). A trend of a higher frequency of CD3+ CD4 + T cells was observed in responders to anti-PD1 (p = .053) and combination therapy (p = .183) pre-treatment compared to nonresponders (Supplemental Figure S5). Interestingly, this was not true for CD8 + T cells where nonresponders had intendancy more peripheral CD8+ circulating T cells than responders before treatment (anti-PD1: p = .138; anti-CTLA4+ anti-PD1: p = .13) (Supplemental Figure S6). However, PD1 expression on CD3+ CD8 + T cells (p = .028) or proliferating CD3+ CD8+ Ki67 + T cells (p = .033) pre-treatment was significantly and positively associated with response to anti-PD1 monotherapy (, b). Patients with greater than 9% frequency (ROC cutoff; Supplemental Figure S7A) of CD3+ CD8+ PD1 + T cells or CD3+ CD8+ Ki67+ PD1 + T cells in the blood were more likely to experience longer PFS (p = .001 or p = .005; ). Similarly, even though no statistical significance was found, the same trend could be seen in patients responding to the combination treatment (p = .250 or p = .169; Supplemental Figure S6). Furthermore, upon both anti-PD1 mono and combination therapy, we found a significant decrease in PD1 expression on all T cell compartments (Supplemental Figure S8,9). However, these data have to be interpreted with care as the therapeutic anti-PD1 administration may hamper the detection of PD1 expression by the EH12.1 commercial antibody used in our study. Compared to PD1 (median: 9%), the expression of TIM3 (median: 1.8%) and LAG3 (median 0.18%) on circulating CD3 + T cells is limited to very few cell populations. Nevertheless, with such low frequencies, we found significantly increased numbers of CD3+ CD4+ LAG3 + T cells (p = .027) in nonresponding patients treated with combination treatment () but not in patients treated with anti-PD1 monotherapy (supplemental Figure S5). Moreover, the numbers of CD3+ CD4+ TIM3 + T cells (p = .097) and CD3+ CD8+ TIM3 + T cells (p = .010) increased in patients’ blood upon combination treatment, but the same was not found in patients treated with anti-PD1 monotherapy (Supplemental Figure S8,9).
Figure 3. Different T cell subsets in the blood associated with anti-PD1 and anti-CTLA4 plus anti-PD1 combination treatment response
Furthermore, we observed a significant increase in Ki67 expression on CD3+ CD8 + T cells (p < .0001) upon anti-CTLA4 plus anti-PD1 combination treatment but not on anti-PD1 treatment alone (p = .170). Of note, apart from one patient, the Ki67 marker was increased on CD3+ CD8 + T cells of all the patients who received combination treatment (, b). The same was observed in CD3+ CD4 + T cells upon combination treatment (p = .019) but not upon anti-PD1 treatment (p = .616). Similarly, we found an increase in the absolute eosinophils in blood upon combination treatment (p = .001) but not upon anti-PD1 treatment (p = .559) (). Notably, we did not find any increase in absolute lymphocytes from the clinical blood variables upon combination treatment ().
Figure 4. Systemic immune activation upon combination treatment unlike anti-PD1 treatment
Tumor infiltration of TIM3+ and LAG3 + T cells correlated with a shorter PFS but did not Indicate response to ICI treatment
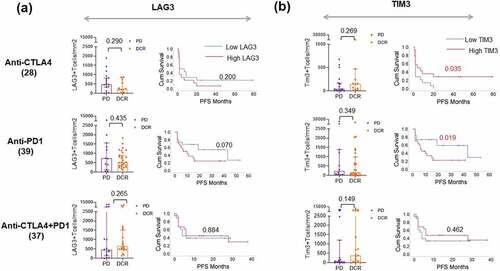
To determine if the presence of alternative immune checkpoints, i.e. that is, TIM3 and LAG3 in the tumor microenvironment indicates resistance to ICI treatment, we then quantified the immunohistochemical expression of TIM3 and LAG3 on T Lymphocytes in pre-treatment tumor sections using a predefined algorithm in a partially overlapping cohort. The patient characteristics of this cohort are given in Supplemental . We found that neither TIM3 nor LAG3 expression in the TME was associated with clinical response to any ICI treatment in the study. However, patients with increased infiltration of TIM3 + T cells (median >152 cells/mm2) and LAG3 + T cells (median >624 cells/mm2) in the TME experienced shorter PFS upon anti-PD1 therapy (p = .019 and p = .070) suggesting that their increased infiltration might contribute to treatment resistance (, b). In contrast, patients with increased TIM3 + T cell infiltration in the TME (median >62 cells/mm2) experienced longer PFS under Ipilimumab (p = .035; ) and a similar trend was observed in terms of response to combination treatment (p = .149; ).
Figure 5. LAG3 and TIM3 expression in TME correlates with PFS under anti-PD1 treatment
Discussion
We evaluated the association between soluble immune checkpoints and peripheral T cell subsets with the response to anti-PD1 or anti-CTLA4 plus anti-PD1 ICI treatments in patients with metastasized melanoma. We show that different biomarkers are associated with the response to the different ICI treatments. Increased serum concentrations of sLAG3, reduced absolute monocytes, and low frequencies of PD1 expressing CD8 + T cell subsets pre-treatment identify nonresponders to anti-PD1 treatment, whereas increased serum concentrations of sPD1, low hemoglobin levels, and high frequencies of LAG3 expressing CD4 + T cells pre-treatment identify nonresponders to anti-CTLA4 plus anti-PD1 combination treatment. Furthermore, the on-treatment analysis of blood samples revealed a common increase of serum soluble immune checkpoints but different T cell activation dynamics upon treatment with anti-PD1 or anti-CTLA4 plus anti-PD1 treatment, e.g. for example, ipilimumab plus nivolumab treatment induced significant proliferation of effector T cells (CD3+ CD8+ Ki67+).
The role of soluble immune checkpoints is an active area of research. The major sources of sLAG3 in the blood are dendritic cells and B cells.Citation22 In vitro, sLAG3 enhances the expansion of melanoma-specific CD8 + T lymphocytesCitation23 and, in contrast, is known to impair monocyte differentiation resulting in reduced immunostimulatory capacities.Citation24 In MHC II expressing melanoma cells, the addition of sLAG3 protects tumor cells from FAS mediated and drug-induced apoptosis.Citation25 In line with this observation, we found increased sLAG3 concentrations in nonresponding patients to anti-PD1 therapy. However, we observed a positive association of sLAG3 with the number of regulatory T cells (CD3+ CD4+ CD25+ CD127-) in the peripheral blood. The mechanism through which sLAG3 is involved in resistance to anti-PD1 therapy particularly remains unclear. It might influence the interaction between MHC class II expressing dendritic cells and T cell activation.
Unlike sLAG3, the increased presence of sPD1 in the blood may directly limit the efficacy of the therapeutic anti-PD1 antibody by competing with its binding to membrane-bound PD1 on immune cells. However, in our study, increased sPD1 concentrations in melanoma patients indicated resistance to ipilimumab plus nivolumab combination treatment but not anti-PD1 monotherapy. The structural difference between the two anti-PD1 therapeutic antibodies, Pembrolizumab and Nivolumab was previously studied and, the two antibodies may have different binding capacities for circulating sPD1Citation26 which might contribute to the resistance for combination treatment with ipilimumab plus nivolumab but not for anti-PD1 therapy as apart from one patient all patients received pembrolizumab in our study. In a recent report elevated sPD1 and sPDL1 were found to be associated with a poor clinical outcome in patients treated with anti-PD1 ± anti-CTLA4 therapy.Citation21 In this study, it is not clear if this result might be mainly influenced by the combination treatment and even though more patients received anti-PD1 monotherapy majority of them received nivolumab. In another recent study, no predictive value of sPD1 serum concentrations for the response to the PD1 monotherapy with pembrolizumab was detectedCitation27 – matching our results here. Furthermore, on-treatment samples revealed that the sPD1 concentrations drastically increase upon anti-PD1 and combination therapy compared to anti-CTLA4 monotherapy. A similar finding of increased sPD1 concentrations upon anti-PD1 treatment was reported recently while profiling plasma proteomics in cutaneous melanoma patients.Citation28 Although the sources of sPD1 in the blood are still unknown, we found a significant negative correlation between the serum concentrations of sPD1 and PD1 expression on T cell subsets. Interestingly, we also noticed a positive correlation between sPD1 and the frequencies of LAG3 and TIM3 positive T cells analyzed at the same time points. In vitro, the coculturing of dendritic cells with T cells and sPD1 resulted in inhibition of T cell proliferation.Citation29 Increased sPD1 levels in plasma are associated with poor immune infiltration in the TME in Braf wild-type melanoma patients treated with anti-PD1 therapy.Citation30 Together, these reports suggest that sPD1 might have a direct role in hampering anti-tumor immunity. Further studies need to explore the therapeutic resistance mechanisms of sPD1.
Previously, sPDL1 was shown to be associated with response to ipilimumab in melanoma patients, and in 35 patients who received anti-PD1 treatment, two out of four patients with high sPDL1 at pre-treatment had experienced progressive disease.Citation17 However, in our study, we did not observe any significant association between pre-treatment concentrations sPDL1 and response to anti-PD1 or combination treatment. Meanwhile, the limited sample size of the ipilimumab cohort in our study and the variation in sPDL1 concentration cutoffs may result in such differences and make it hard to conclude.
Anti-PD1 therapy directly targets PD1 expressing T cells. Increased frequencies of CD8+ PD1hi CTLA4hi infiltrating T cells in the tumor microenvironment of melanoma patients are linked to better response to anti-PD1 treatment.Citation31 CD8+ PD1 + T cells are known to be tumor-related T cell clones and found in the peripheral blood of melanoma patients.Citation11–13 Accordingly, melanoma patients with low frequencies of CD8+ PD1+ Ki67 + T cells indicate poor survival, and the clinical outcome of anti-PD1 treatment in melanoma patients was shown to be dependent on the ratio of the fold change of CD8+ PD1+ Ki67 + T cells to tumor burden.Citation13 Recently, it was shown that melanoma patients who were responding to anti-PD1 treatment revealed a significant reduction of PD1+ Tregs after one cycle of treatment.Citation32 In contrast, in a recent study, mass spectrometry phenotyping of PD1 expression on T cells analyzed at different time points under therapy showed no difference with the response to anti-PD1 treatment in melanoma patients.Citation33 Our flow cytometric results demonstrate that the low frequencies of PD1 expressing CD8 + T cell subsets in the pre-treatment blood samples may be useful to identify patients resistant to anti-PD1 treatment. Although the same trend for PD1 expressing CD8 + T cells was observed in nonresponding patients to combination treatment, the difference was not as prominent as in the anti-PD1 cohort, which might be partly due to the dual action of anti-CTLA4 along with anti-PD1. Moreover, unlike previous report, we did not observe a relation between on-treatment frequencies of PD1+ Tregs and ICI response. However, our on-treatment samples analyzed were collected upon 6 weeks on ICI treatment instead of after the first cycle of treatment like in the previous report.Citation32 The different technological methods, time points and patient cohorts in these studies may account for such differences. However, further studies with larger patient numbers are warranted.
The expression of alternative immune checkpoints such as LAG3 and TIM3 is limited to a small T cell population in the peripheral blood. In our study, we observed that patients resistant to the combination treatment had increased frequencies of CD3+ CD4+ LAG3 + T cells in the peripheral blood. However, the low frequencies of LAG3 + T cells in blood might be challenging to use peripheral LAG3 + T cells as a biomarker in the clinical setting. Moreover, the increased infiltration of LAG3+ and TIM3 + T cells in the TME indicated a shorter PFS upon anti-PD1 treatment in our study. In contrast, in a recent publication, increased LAG3 mRNA expression in melanoma was associated with better overall survival and progression-free survival under ICI treatment.Citation34 However, in the latter study, the LAG3 mRNA might originate from tumor cells. Under PD1 treatment an increase in LAG3 mRNA level was detected. However, it is not known yet if that is a general phenomenon under therapy or correlated with response or resistance.Citation10
Targeting next generation immune checkpoints such as LAG3 has demonstrated the ability to enhance the efficacy of PD-1 blockade in many models, including a phase 1/2 clinical trial in solid tumors (ESMO 2017).Citation35 Our study results suggest that high circulating sLAG3 in patients might impair effectiveness to anti-PD1 Abs, theoretically these patients might therefore benefit from the combination with a LAG3 inhibitor. Accordingly, nonresponding patients to ipilimumab plus nivolumab combination treatment also had a detectable amount of LAG3 on circulating T cells, which further supports the use of combinational treatment with LAG3 inhibitors for maximum clinical benefit in these patients. However, the impact of neutralizing sLAG3 with LAG3 inhibitors should be further investigated to understand the functional role of sLAG3 in anti-PD1 resistant patients.
Treatment with anti-CTLA4 was previously shown to expand Ki67+ CD4+ and CD8 + T cells in the peripheral blood after 3–6 months of treatment in melanoma patients.Citation36,Citation37 In a recent study, increased proliferation of CD8 + T cells upon anti-PD1 treatment was limited to PD1 expressing T cells, whereas anti-CTLA4 plus anti-PD1 combination treatment induced proliferation of CD8 + T cells irrespective of PD1 expression.Citation6 In line with these reports, our analysis demonstrates that anti-CTLA4 plus anti-PD1 combination treatment results in increased frequencies of proliferating CD4+ Ki67+ and CD8+ Ki67 + T cells, unlike anti-PD1 monotherapy. A similar phenomenon was observed with absolute eosinophils in the blood as we found an increased number of eosinophils upon treatment with combination treatment and upon anti-CTLA4 treatment but not anti-PD1 monotherapy. Together, these data demonstrate that combination treatment results in a profound T cell proliferation compared to monotherapy with anti-PD1.
Limitations
Although the data provide a unique insight into peripheral blood biomarkers and their differential dynamics associated with different ICI treatment regimens, there are several potential limitations associated with this study. First, the retrospective design of the study and the heterogeneity of patients poses a challenge that can only be partially compensated by multivariate analyses including prognostic factors such as LDH as a known marker for tumor load. Second, there was a lack of a sufficient sample size to be able to split the cohorts into discovery and validation cohorts. Hence, these findings need to be verified in a preferably treatment-naive patient cohort to confirm the predictive nature of these markers with ICI treatment outcomes. And finally, further analyses are needed to explore the functional connections between soluble immune checkpoints and the expression of them on T cells, other immune cells, and even tumor cells.
Conclusion
Monitoring soluble immune checkpoints and T cell subsets in melanoma patients’ blood before the treatment might be useful to predict response to anti-PD1 or anti-CTLA4 plus anti-PD1 combination treatment in advance. Hence, further studies including a large number of patients are warranted to validate these biomarkers for clinical use. Besides, anti-CTLA4 plus anti-PD1 treatment display partially different dynamics of serum and immune cell markers in blood compared to anti-PD1 treatment alone.
CONFLICTS OF INTEREST
JCH has received honoraria from BMS, MSD, Novartis, Roche, Pierre Fabre, Sanofi, Almirall; Consultant or Advisory Role: MSD, Pierre Fabre, Sunpharma; Research funding: BMS; Travel support: Pierre Fabre. AE has received advisory honoraria from Biotest AG, MSD Oncology, Galderma, Janssen Cilag, AbbVie as well as speaker’s honoraria from Roche Pharma. NH reports grants from Bristol Myers-Squibb, during the conduct of the study; grants from Merck KgA Darmstadt, outside the submitted work. This research was supported by a research grant from Bristol Myers-Squibb. MW, DM, NL, IH, JR, TES, and RE declare no additional potential conflicts of interest.
STUDY APPROVAL
Biobanking of patient material and the retrospective analysis of patient data were approved by the Ethical Committee of the Medical Faculty of Heidelberg (S-207/2005, S-091/2011, S-454/2015). Written informed consent was received from patients for biobanking of patient material and the retrospective analysis of data.
AUTHOR CONTRIBUTIONS
DM and JCH conceived and designed the experiments. DM, NL, IH, JR, and RE participated in conducting experiments. IH, JR, and DM contributed to the sample collection and interpretation of the data. TES contributed to the collection of clinical data. DM and JCH contributed to statistical analysis. DM, MW, and JCH drafted the manuscript. DM, MW, NL, IH, JR, TES, RE, NH, AE, and JCH read and approved the manuscript.
Supplemental Material
Download ()Acknowledgments
The authors would like to thank all the patients and their families for their contribution to this study. The authors are very grateful to Mr. Simon Ogrodnik and Prof. Holger Sültmann from Cancer Genome Research Unit, DKFZ, for their resources and support. A special acknowledgment to Ms. Simone Jünger from the Immune Monitoring Unit, DKFZ for their technical support for this project. The work has been previously presented as a poster at ESMO 2020 (#1126P). Graphical abstract created using Biorender.
Supplementary material
Supplemental data for this article can be accessed on the publisher’s website
Additional information
Funding
References
- Robert C, Long GV, Brady B, Dutriaux C, Maio M, Mortier L, Hassel JC, Rutkowski P, McNeil C, Kalinka-Warzocha E, et al. Nivolumab in previously untreated melanoma without BRAF mutation. N Engl J Med. 2015;372(4):320–12. doi:10.1056/NEJMoa1412082.
- Robert C, Schachter J, Long GV, Arance A, Grob JJ, Mortier L, Daud A, Carlino MS, McNeil C, Lotem M, et al. Pembrolizumab versus Ipilimumab in advanced Melanoma. N Engl J Med. 2015;372(26):2521–2532. doi:10.1056/NEJMoa1503093.
- Larkin J, Chiarion-Sileni V, Gonzalez R, Grob JJ, Cowey CL, Lao CD, Schadendorf D, Dummer R, Smylie M, Rutkowski P, et al. Combined Nivolumab and Ipilimumab or Monotherapy in untreated Melanoma. N Engl J Med. 2015;373(1):23–34. doi:10.1056/NEJMoa1504030.
- Larkin J, Chiarion-Sileni V, Gonzalez R, Grob JJ, Rutkowski P, Lao CD, Cowey CL, Schadendorf D, Wagstaff J, Dummer R, et al. Five-Year Survival with Combined Nivolumab and Ipilimumab in Advanced Melanoma. N Engl J Med. 2019;381(16):1535–1546. doi:10.1056/NEJMoa1910836.
- Hodi FS, Chesney J, Pavlick AC, Robert C, Grossmann KF, McDermott DF, Linette GP, Meyer N, .Giguere JK, et al. Combined nivolumab and ipilimumab versus ipilimumab alone in patients with advanced melanoma: 2-year overall survival outcomes in a multicentre, randomised, controlled, phase 2 trial. Lancet Oncol. 2016;17(11):1558–1568. doi:10.1016/S1470-2045(16)30366-7.
- Wei SC, Anang N-A-AS, Sharma R, Andrews MC, Reuben A, Levine JH, Cogdill AP, Mancuso JJ, Wargo JA, Pe'er D, et al. Combination anti–CTLA-4 plus anti–PD-1 checkpoint blockade utilizes cellular mechanisms partially distinct from monotherapies. Proceedings of the National Academy of Sciences. 2019;116(45):22699–22709. doi:10.1073/pnas.1821218116.
- Koyama S, Akbay EA, Li YY, Herter-Sprie GS, Buczkowski KA, Richards WG, Gandhi L, Redig AJ, Rodig SJ, Asahina H, et al. Adaptive resistance to therapeutic PD-1 blockade is associated with upregulation of alternative immune checkpoints. Nat Commun. 2016;7(1):10501. doi:10.1038/ncomms10501.
- Thommen DS, Schreiner J, Müller P, Herzig P, Roller A, Belousov A, Umana P, Pisa P, Klein C, Bacac M, et al. Progression of lung cancer is associated with increased dysfunction of T cells defined by coexpression of multiple inhibitory receptors. Cancer Immunol Res. 2015;3(12):1344–1355. doi:10.1158/2326-6066.CIR-15-0097.
- Johnson DB, Nixon MJ, Wang Y, Wang DY, Castellanos E, Estrada MV, Ericsson-Gonzalez PI, Cote CH, Salgado R, Sanchez et al. Tumor-specific MHC-II expression drives a unique pattern of resistance to immunotherapy via LAG-3/FCRL6 engagement. JCI Insight. 2018;3(24):e120360. doi: 10.1172/jci.insight.120360.
- Edwards R, Hedvat C, Cogswell J, Locke D, Lee G, Baxi V, Vitazka P, Szabo P, Jin C, Pandya D, et al. 32nd annual meeting and pre-conference programs of the Society for Immunotherapy of Cancer (SITC 2017): late-breaking abstracts. J Immunother Cancer. 2017;5:89.
- Gros A, Parkhurst MR, Tran E, Pasetto A, Robbins PF, llyas S, Prickett TD, Gartner JJ, Crystal JS, Roberts IM, et al. Prospective identification of neoantigen-specific lymphocytes in the peripheral blood of melanoma patients. Nat Med. 2016;22(4):433–438. doi:10.1038/nm.4051.
- Gros A, Tran E, Parkhurst MR, llyas S, Pasetto A, Groh EM, Robbins PF, Yossef R, Garcia-Garijo A, Fajardo CA, et al. Recognition of human gastrointestinal cancer neoantigens by circulating PD-1+ lymphocytes. J Clin Invest. 2019;129(11):4992–5004. doi:10.1172/JCI127967.
- Huang AC, Postow MA, Orlowski RJ, Mick R, Bengsch B, Manne S, Xu W, Harmon S, Giles JR, Wenz B, et al. T-cell invigoration to tumour burden ratio associated with anti-PD-1 response. Nature. 2017;545(7652):60–65. doi:10.1038/nature22079.
- Graves M, CelliMarchett G, Van Zyl B, Tang D, Vilain RE, Van der Westhuizen A, Bowden NA. Monitoring patient response to Pembrolizumab with peripheral blood exhaustion marker profiles. Front Med (Lausanne). 2019;6:113. doi:10.3389/fmed.2019.00113.
- Hannani D, Vétizou M, Enot D, Rusakiewicz S, Chaput N, Klatzmann D, Desbois M, Jacquelot N, Vimond N, Chouaib S, et al. Anticancer immunotherapy by CTLA-4 blockade: obligatory contribution of IL-2 receptors and negative prognostic impact of soluble CD25. Cell Res. 2015;25(2):208–224. doi:10.1038/cr.2015.3.
- Nielsen C, Ohm-Laursen L, Barington T, Husby S, Lillevang ST. Alternative splice variants of the human PD-1 gene. Cell Immunol. 2005;235(2):109–116. doi:10.1016/j.cellimm.2005.07.007.
- Zhou J, Mahoney KM, Giobbie-Hurder A, Zhao F, Lee S, Liao X, Rodig S, Li J, Wu X, Butterfield LH, et al. Soluble PD-L1 as a biomarker in malignant Melanoma treated with checkpoint blockade. Cancer Immunol Res. 2017;5(6):480–492. doi:10.1158/2326-6066.CIR-16-0329.
- Li N, Workman CJ, Martin SM, Vignali DA. Biochemical analysis of the regulatory T cell protein lymphocyte activation gene-3 (LAG-3; CD223). J Immunol. 2004;173(11):6806–6812. doi:10.4049/jimmunol.173.11.6806.
- Li N, Wang Y, Forbes K, Vignali KM, Heale BS, Saftig P, Hrtmann D, Black RA, Rossi JJ, Blobel CP, et al. Metalloproteases regulate T-cell proliferation and effector function via LAG-3. Embo J. 2007;26(2):494–504. doi:10.1038/sj.emboj.7601520.
- Clayton KL, Douglas-Vail MB, Nur-ur Rahman AK, Medcalf KE, Xie IY, Chew GM, Tandon R, Lanteri MC, Norris PJ, Deeks SG, et al. Soluble T cell immunoglobulin mucin domain 3 is shed from CD8+ T cells by the sheddase ADAM10, is increased in plasma during untreated HIV infection, and correlates with HIV disease progression. J Virol. 2015;89(7):3723–3736. doi:10.1128/JVI.00006-15.
- Ugurel S, Schadendorf D, Horny K, Sucker A, Schramm S, Utikal J, Phöler C, Herbst R, Schilling B, Blank C, et al. Elevated baseline serum PD-1 or PD-L1 predicts poor outcome of PD-1 inhibition therapy in metastatic melanoma. Ann Oncol. 2020;31(1):144–152. doi:10.1016/j.annonc.2019.09.005.
- Workman CJ, Wang Y, El Kasmi KC, Pardoll DM, Murray PJ, Drake CG, Vignali DA. LAG-3 regulates plasmacytoid dendritic cell homeostasis. J Immunol. 2009;182(4):1885–1891. doi:10.4049/jimmunol.0800185.
- Casati C, Camisaschi C, Rini F, Arienti F, Rivoltini L, Triebel F, Parmiani G, Castelli C. Soluble human LAG-3 molecule amplifies the in vitro generation of type 1 tumor-specific immunity. Cancer Res. 2006;66(8):4450–4460. doi:10.1158/0008-5472.CAN-05-2728.
- Buisson S, Triebel F. LAG-3 (CD223) reduces macrophage and dendritic cell differentiation from monocyte precursors. Immunology. 2005;114(3):369–374. doi:10.1111/j.1365-2567.2004.02087.x.
- Hemon P, Jean-Louis F, Ramgolam K, Brignone C, Viguier M, Bachelez H, Triebel F, Charron D, Aoudjit F, AI-Daccak R, et al. MHC class II engagement by its ligand LAG-3 (CD223) contributes to melanoma resistance to apoptosis. J Immunol. 2011;186(9):5173–5183. doi:10.4049/jimmunol.1002050.
- Tan S, Zhang H, Chai Y, Song H, Tong Z, Wang Q, Qi J, Wong G, Zhu X, Liu WJ, et al. An unexpected N-terminal loop in PD-1 dominates binding by nivolumab. Nat Commun. 2017;8(1):14369. doi:10.1038/ncomms14369.
- Music M, Iafolla MAJ, Ren AH, Soosaipillai A, Prassas I, Diamandis EP. Serum PD-1 is elevated after Pembrolizumab treatment but has no predictive value. Mol Cancer Ther. 2019;18(10):1844–1851. doi:10.1158/1535-7163.MCT-19-0132.
- Babacic H, Lehtio J, Pico De Coana Y, Pernemalm M, Eriksson H. In-depth plasma proteomics reveals increase in circulating PD-1 during anti-PD-1 immunotherapy in patients with metastatic cutaneous melanoma. J Immunother Cancer. 2020;8(1):8. doi:10.1136/jitc-2019-000204.
- Kuipers H, Muskens F, Willart M, Hijdra D, van Assema FB, Coyle AJ, Hoogsteden HC, Lambrecht BN. Contribution of the PD-1 ligands/PD-1 signaling pathway to dendritic cell-mediated CD4+ T cell activation. Eur J Immunol. 2006;36(9):2472–2482. doi:10.1002/eji.200635978.
- Incorvaia L, Badalamenti G, Rinaldi G, Iovanna JL, Olive D, Swayden M, Terruso L, Vincenzi B, Fulfaro F, Bazan V, et al. Can the plasma PD-1 levels predict the presence and efficiency of tumor-infiltrating lymphocytes in patients with metastatic melanoma? Ther Adv Med Oncol. 2019;11:1758835919848872. doi:10.1177/1758835919848872.
- Daud AI, Loo K, Pauli ML, Sanchez-Rodriguez R, Sandoval PM, Taravati K, Tsai K, Nosrati A, Nardo L, Alvarado MD, et al. Tumor immune profiling predicts response to anti-PD-1 therapy in human melanoma. J Clin Invest. 2016;126(9):3447–3452. doi:10.1172/JCI87324.
- Gambichler T, Schröter U, Höxtermann S, Susok L, Stockfleth E, Becker JC. Decline of programmed death-1-positive circulating T regulatory cells predicts more favourable clinical outcome of patients with melanoma under immune checkpoint blockade. Br J Dermatol. 2020;182(5):1214–1220. doi:10.1111/bjd.18379.
- Pirozyan MR, McGuire HM, Emran AA, Tseng HY, Tiffen JC, Lee JH, Carlino MS, Menzies AM, Long GV, Scolyer RA, et al. Pretreatment innate cell populations and CD4 T cells in blood are associated with response to immune checkpoint blockade in Melanoma patients. Front Immunol. 2020;11:372. doi:10.3389/fimmu.2020.00372.
- Frohlich A, Sirokay J, Fietz S, Vogt TJ, Dietrich J, Zarbl R, Florin M, Kuster P, Saavedra G, Valladolid SR, et al. Molecular, clinicopathological, and immune correlates of LAG3 promoter DNA methylation in melanoma. EBioMedicine. 2020;59:102962. doi:10.1016/j.ebiom.2020.102962.
- Ascierto PA, Bono P, Bhatia S, Melero I, Nyakas MS, Svane IM, Larkin J, Gomez-Roca C, Schadendorf D, Dummer R, et al. Efficacy of BMS-986016, a monoclonal antibody that targets lymphocyte activation gene-3 (LAG-3), in combination with nivolumab in pts with melanoma who progressed during prior anti-PD-1/PD-L1 therapy (mel prior IO) in all-comer and biomarker-enriched populations. Annals of Oncology. 2017;28:v611–v612.
- Wang W, Yu D, Sarnaik AA, Yu B, Hall M, Morelli D, Zhang Y, Zhao X, Weber JS. Biomarkers on melanoma patient T cells associated with ipilimumab treatment. J Transl Med. 2012;10(1):146. doi:10.1186/1479-5876-10-146.
- Twyman-Saint Victor C, Rech AJ, Maity A, Rengan R, Pauken KE, Stelekati E, Benci JL, Xu B, Dada H, Odorizzi PM, et al. Radiation and dual checkpoint blockade activate non-redundant immune mechanisms in cancer. Nature. 2015;520(7547):373–377. doi:10.1038/nature14292.