
ABSTRACT
The inhibitory receptor TIGIT, as well as theectonucleotidases CD39 and CD73 constitute potential exhaustion markers for T cells. Detailed analysis of these markers can shed light into dysregulation of the T-cell response in acute myeloid leukemia (AML) and will help to identify potential therapeutic targets. The phenotype and expression of transcription factors was assessed on different T-cell populations derived from peripheral blood (PB, n = 38) and bone marrow (BM, n = 43). PB and BM from patients with AML diagnosis, in remission and at relapse were compared with PB from healthy volunteers (HD) (n = 12) using multiparameter flow cytometry. An increased frequency of terminally differentiated (CD45R−CCR7−)CD8+ T cells was detected in PB and BM regardless of the disease state. Moreover, we detected an increased frequency of two distinct T-cell populations characterized by the co-expression of PD-1 or CD39 on TIGIT+CD73−CD8+ T cells in newly diagnosed and relapsed AML in comparison to HDs. In contrast to the PD-1+TIGIT+CD73−CD8+ T-cell population, the frequency of CD39+TIGIT+CD73−CD8+ T cells was normalized in remission. PD-1+- and CD39+TIGIT+CD73−CD8+ T cells exhibited additional features of exhaustion by decreased expression of CD127 and TCF-1 and increased intracellular expression of the transcription factor TOX.
CD8+ T cells in AML exhibit a key signature of two subpopulations, PD-1+TOX+TIGIT+CD73−CD8+- and CD39+TOX+TIGIT+CD73−CD8+ T cells that were increased at different stages of the disease. These results provide a rationale to analyze TIGIT blockade in combination with inhibition of the purinergic signaling and depletion of TOX to improve T-cell mediated cytotoxicity in AML.
Abbreviations: AML: Acute myeloid leukemia; pAML: newly diagnosed AML; rAML: relapse AML; lrAML: AML in remission; HD: healthy donor; PB: peripheral blood; BM: bone marrow; TIGIT: T-cell immunoreceptor with Ig and ITIM domains; PD-1: Programmed cell death protein 1; CD73: ecto-5′-nucleotidase; CD39: ectonucleoside triphosphate diphosphohydrolase 1; ATP: adenosine triphosphate; ADO: adenosine; CD127: interleukin-7 receptor; CAR-T cell: chimeric antigen receptor T cell; TCF-1: transcription factor T-cell factor 1; TOX: Thymocyte selection-associated high mobility group box protein; NFAT: nuclear factor of activated T cells; NA: Naïve; CM: Central Memory; EM Effector Memory; EMRA: Terminal Effector Memory cells; FMO: Fluorescence minus one; PVR: poliovirus receptor; PVRL2: poliovirus receptor-related 2; IFN-γ: Interferon-γ; IL-2: interleukin-2; MCF: multiparametric flow cytometry; TNFα: Tumornekrosefaktor α; RT: room temperature.
Introduction
Novel immunotherapeutic strategies based on enhancement of T-cell function are constantly being developed for the treatment of acute myeloid leukemia (AML).Citation1 These strategies include vaccines, T-cell recruiting bispecific antibody constructs, chimeric antigen receptor (CAR) T cells and immune checkpoint inhibitors.Citation2 However, apart from allogeneic stem cell transplantation, the results of immunological approaches to treat AML have been less encouraging compared to other tumor entities.Citation3 It is becoming increasingly apparent that AML is a heterogeneous disease with various immunosuppressive mechanisms to overcome immune surveillance. Therefore, a detailed knowledge of T-cell function during the course of the disease, e.g. at diagnosis, relapse and at remission, is essential.
Inhibitory receptors and their ligands such as programmed cell death protein 1/programmed cell death 1 ligand (PD-1/PD-L1) play a crucial role in the regulation of inflammatory responses by inhibiting T-cell effector activity. During chronic infection and cancer T cells are exposed to persistent antigen stimulation, which are often associated with loss of T-cell function and upregulation of multiple inhibitory receptors, a state called T-cell exhaustion.Citation4 We and others have recently identified the coinhibitory receptor T-cell immunoglobulin and immunoreceptor tyrosine–based inhibitory motif (ITIM) domain (TIGIT) as a potential target for immunotherapeutic strategies in AML.Citation5 TIGIT is expressed on (virus-specific) CD8+ and both conventional CD4+ (conCD4+) and regulatory CD4+ (regCD4+) T cells, as well as natural killer (NK) cells in chronic infections and cancer.Citation6,Citation7
The ectoenzymes CD73 (ecto-5′-nucleotidase) and CD39 (ectonucleoside triphosphate diphosphohydrolase 1) are related to the purinergic signaling that regulates lymphocyte activation and function. Adenosine triphosphate (ATP) released from cells under conditions of stress, inflammation or by regulated secretion is converted to adenosine (ADO) by sequential dephosphorylation by CD39 and CD73.Citation8 ADO evokes predominantly anti-inflammatory signals.Citation8 In cancer, CD73 and CD39 are upregulated in solid tumor cells and increasingly recognized as promising targets for immunotherapeutical approaches.Citation9,Citation10 Moreover, CD73 seems to play a role as costimulatory molecule for T-cell differentiation.Citation11 CD39 is expressed on antigen-specific (tumor-infiltrating) CD8+ T cells, conCD4+, regCD4+ T cells and NK cells.Citation12–14
The interleukin-7 receptor (CD127) and the transcription factor T-cell factor 1 (TCF-1) are involved in the development of long-living memory cells and self-renewal in T cell-populations.Citation15 CD127 is required for the establishment and maintenance of memory CD4+ and CD8+ T lymphocytes.Citation16 TCF-1 identifies antigen-experienced murine and human CD8+ T cells that retain potential for lymphoid recirculation and the ability for self-renewal.Citation17
The transcription factor thymocyte selection-associated high mobility group box (TOX) regulates terminal T-cell exhaustion in chronic viral infections and cancer. Scott et al. showed that TOX was highly expressed in human dysfunctional T cells in melanoma, breast, lung and ovarian cancer. Its expression was driven by chronic T-cell receptor stimulation and activation of the NFAT (nuclear factor of activated T cells) family of transcription factors.Citation18,Citation19 Further, the expression of TOX has been associated with failure of CD8+ T-cell re-invigoration upon inhibitory receptor inhibition.Citation18
In this study, we provide a comprehensive analysis of the expression of TIGIT, the ectonucleotidases CD39 and CD73, and of the transcription factors TCF-1 and TOX on CD8+, and conventional and regulatory CD4+ T-cell populations in peripheral blood (PB) and bone marrow (BM) samples from AML patients at different stages of the disease.
Material and methods
Clinical cohorts
Peripheral blood (PB) of AML patients (n = 38) and bone marrow (BM) of AML patients (n = 43) were collected at diagnosis, relapse and in remission before the start of intensive chemotherapy treatment as well as from healthy volunteers (HD, n = 12) after written informed consent in accordance with the Declaration of Helsinki and approval by the local ethics board of the Ärztekammer Hamburg (PV3469). All samples were taken from non-acute promyelocytic leukemia (APL) AML patients.
PB and BM samples were available from patients with newly diagnosed AML (pAML, PB, n = 20, median age 60 years; range 25–88 and BM, n = 24, median age 65 years; range 25–88), patients after chemotherapy-induced complete remission (lrAML, PB, n = 10, median age of 67 years; range 51–80 and BM, n = 10; median age of 62 years; range 51–79) and patients with relapsed AML (rAML, PB, n = 8, median age of 66 years; range 50–74 and BM, n = 9; median age of 66 years; range 48–77). Patients in remission were for a median of 620 days (rang 89–894 days) in CR. Paired PB and BM specimens were obtained from 17 patients with pAML, from 5 patients with rAML and from 7 patients with lrAML. Three patients donated PB and BM at diagnosis and at relapse, one patient donated PB and BM at diagnosis and in remission. PB of 12 healthy volunteers (HD) (with a median age of 48.5 years, range 25–86 years) were obtained as controls (Supplement 1).
Multiparameter flow cytometry, surface and intracellular staining (ICS)
For intracellular staining and multiparametric flow cytometry analysis (MCF), cryopreserved PB and BM mononuclear cells from patients with CD33+ AML were thawed and counted. After washing with PBS and FCR blocking PBMCs were stained with the LIVE/DEAD™ Fixable Near-IR dye (Thermo Fisher) according to the manufacturer’s protocol for exclusion of dead cells. For surface staining, cells were incubated with appropriate fluorochrome-conjugated antibodies, including anti-CD3 (OKT3), anti-CD4 (RPA-T4), anti-CD8 (RPA-T8), anti-CD25 (2A3), anti-CD127 (A019D5), anti-CD45RO (UCHL1), anti-CCR7 (G043H7), anti-TIGIT (A15153G), anti-PD-1 (EH12.2H7), anti-HLA DR (L243), anti-CD39 (A1), anti-CD73 (AD2) and anti-CD33 (P67.6), for 20 min at RT in the dark. For intracellular staining, the cells were subsequently fixed and permeabilized using the Foxp3 Fixation/Permeabilization Buffer Set (eBioscience) according to the manufacturer’s instructions. Subsequently, samples were stained with the fluorochrome‐labeled antibodies anti-TOX (TXRX10; REA473) and anti-TCF-1 (7F11A10) and incubated for 45 min at 4°C in the dark. Antibodies were obtained from Biolegend, ThermoFisher and BD Biosciences. Samples were washed with permeabilization buffer and then resuspended in PBS. Compensation controls were measured using single-stained Comp Beads (Anti-Mouse Ig,κ/Negative Control Compensation Particles Set, BD Biosciences). For live/dead compensation, Comp Beads stained with anti-CD14 (APC Cy-7, BioLegend) were applied. All samples were run on a BD LSR Fortessa flow cytometer with FACS Diva version 8 (BD Biosciences) on a PC.
Statistical analysis
All flow cytometric data were analyzed using FlowJo version 10.5.2. software (Treestar). Statistical analysis was carried out using Prism 7.0 software (GraphPad Software). All groups were tested for normal distribution with the Kolmogorov–Smirnov test. For normally distributed data, parametric tests were applied: for two groups t-tests, for more than two groups ANOVA multiple comparison test. Data that was not normally distributed was tested by the Mann-Whitney test for two unpaired groups, by the Wilcoxon test for paired groups, or Kruskal-Wallis test for more than two groups, respectively. Pearson’s correlation and Spearman’s rank correlation coefficient were applied for bivariate correlation analysis. Frequencies in the text are described as medians unless stated otherwise (as indicated in the figure legend). P-values smaller than 0.05 were considered significant, where *, ** and *** indicate p-values between 0.01 to 0.05, 0.001 to 0.01 and 0.0001 to 0.001, respectively. Statistical analysis and display of multicomponent distributions were performed with SPICE v5.1.
Results
Increased frequency of TIGIT+ and CD73−CD8+ T cells in peripheral blood and bone marrow from patients with newly diagnosed AML
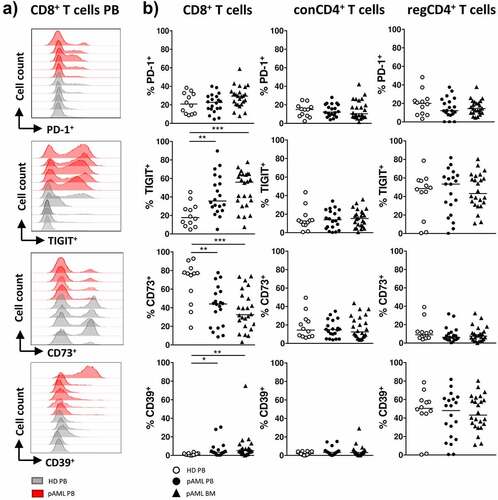
The expression patterns of the coinhibitory molecules PD-1 and TIGIT and the ectonucleotidases CD73 and CD39 were assessed on CD8+, conCD4+ and regCD4+ T cells from the PB and BM of patients with pAML (PB, n = 20 and BM, n = 24) and PB from HDs (PB, n = 12).
A comparison of PB from HDs vs. patients with pAML revealed no differences in the frequency of PD-1 on CD8+, conCD4+ or regCD4+ T cells (). In contrast, we observed an increased frequency of TIGIT+ and CD39+CD8+ T cells and a decreased frequency of CD73+CD8+ T cells in the PB from patients with pAML in comparison to HDs (median of 35.6% vs. 17.6%; p = .0018, median of 3.3% vs. 0.9%; p = .05 and median of 44.1% vs. 76.8%; p = .0041) (). Comparison of CD8+ T cells in BM vs. PB from patients with pAML revealed similar frequencies of TIGIT+-, CD39+- and CD73+CD8+ T cells (). No differences in the frequency of PD-1, TIGIT, CD73 and CD39 expressing cells were found on conCD4+ and regCD4+ T cells between AML and HDs (). In summary CD8+ T cells in the PB and BM from patients with pAML exhibited an aberrant expression of TIGIT, CD39 and CD73 in comparison HDs.
Figure 1. Expression of PD-1, TIGIT, CD73 and CD39 on CD8+ and conCD4+ and regCD4+ T cells in pAML and HDs
Peripheral blood and bone marrow CD8+ T cells of AML patients show a shift toward a terminally differentiated phenotype (CCR7−CD45RO−) regardless of the disease status
CD8+, conCD4+ and regCD4+ T cells in the PB and BM from AML patients with different disease status or HDs were further classified into the following subpopulations on the basis of their expression of CCR7 and CD45RO: Naïve (NA = CCR7+CD45RO−), Central Memory (CM = CCR7+CD45RO+), Effector Memory (EM = CCR7−CD45RO+) and terminal Effector Memory cells expressing CD45RA (EMRA, defined as CCR7−CD45RO−) (for gating strategy see Supplement 3). In comparison to HDs the frequency of CD8+ EMRA T cells was increased (median of 37.8% vs. 8.9%; p = .0013) whereas the frequency of the CD8+ NA T cells was decreased (median of 28.0% vs. 64.3%; p = .0021) in PB from patients with pAML (Supplement 2). Comparison of the CD8+ T cells in PB vs. BM revealed similar frequencies of CD8+ NA and EMRA T cells in both compartments (Supplement 2). Cross-sectional analysis of the PB and BM compartment of AML patients with different disease status showed a persistent increased frequency of the CD8+ EMRA T cells in the PB and BM from patients with pAML, patients in lrAML and with rAML in comparison to HDs (Supplement 2). Together our data show an increased terminally differentiated effector memory subset of CD8+ T cells in the PB and BM from patients with AML, thus providing a rationale to further analyze CD8+ T cells in AML.
Expression of PD-1, TIGIT, CD73 and CD39 is related to the differentiation status of CD8+ T cells in peripheral blood and bone marrow from patients with newly diagnosed AML
It has been shown that the expression of coinhibitory receptors and ectonucleotidases varies according to the differentiation status of the cell.Citation11,Citation20 Increased frequencies of TIGIT+ cells were observed in the CD8+ EM (p = .045) and CD8+ EMRA T-cell populations (p = .047) in PB from patients with pAML in contrast to HDs (Supplement 4A-B). In the BM of patients with pAML we found an increased frequency of TIGIT+ cells only in CD8+ EM T-cell subset in comparison to HDs (p = .06) (Supplement 4B). The decreased frequency of CD73+CD8+ T cells occurred in all four CD8+ differentiation stages in PB of patients with pAML in comparison to HDs (NA: p = .0104 and CM: p = .008 and EM: p = .09 and EMRA p = .023) (Supplement 4A-B). Similar results were observed in the BM from patients with pAML (Supplement 4B). The frequency of CD39+ cells was significantly higher in CD8+ EM (p = .002) and CD8+ EMRA T cells (p = .0092) in PB with similar results in the BM from patients with pAML in contrast to HDs (Supplement 4A+B). Overall, the CD8+ effector memory and terminally differentiated effector memory T-cell population in pAML showed increased expression of TIGIT and CD39 whereas the frequency of CD73+ cells was reduced in this CD8+ T-cell subsets in comparison to HDs.
Increased co-expression of CD39 and PD-1 in TIGIT+CD73−CD8+ T cells of patients with newly diagnosed AML
In our analysis, the most significant differences between newly diagnosed AML patients and HDs occurred in TIGIT and CD73 expression on CD8+ T cells in AML. The frequency of the TIGIT+CD73−CD8+ T-cell subset was significantly increased in the PB and BM from patients with pAML in contrast to HDs (). This specific phenotype of CD8+ T cells was located in the EM and EMRA CD8+ T-cell compartment (Supplement 5A+B). Hence, we further investigated the co-expression of PD-1 and CD39 on CD73+ and CD73−, as well as on TIGIT+ and TIGIT−CD8+ T cells in PB of AML patients. PD-1+ and CD39+ cells were significantly enriched in CD73− and TIGIT+CD8+ T cells in comparison to CD73+ and TIGIT-CD8+ T cells (Supplement 6A-B). Moreover, highest frequencies of PD-1+ cells were observed in the TIGIT+CD73−CD8+ T-cell subset in the PB and BM of patients with pAML in comparison to PB of HDs (PB vs. PB: 41.6% vs. 35.1%; p = .0494 and BM vs. PB: 44.2% vs. 35.1%; p = .0215) (). This was also true for CD39 within the TIGIT+CD73−CD8+ T-cell subset (PB vs. PB: median of 11.3% vs. 3.7%; p = .0063 and BM vs. PB: 13.9% vs. 3.7%; p = .0006) (). Of note, PD-1 and CD39 were not co-expressed on TIGIT+CD73−CD8+ T cells in pAML or HDs (Supplement 7). Analysis by t-distributed stochastic neighbor embedding (tSNE) confirmed that expression of CD39 and PD-1 in AML patients largely overlapped with TIGIT+CD73−CD8+ T cells and clustered within the CD8+ EM and EMRA T-cell subsets (+d). TIGIT expression correlated positively with CD39 expression and negatively with CD73 on CD8+ T cells in the PB from patients with pAML (r = 0.7; p = .003 and r = 0.54; p = .001) (Supplement 5D and 6 C). In summary, in pAML a significant increase of two CD8+ T-cell populations was observable: the PD-1+TIGIT+CD73− and a CD39+TIGIT+CD73−CD8+ T-cell subpopulation.
Figure 2. Increased expression of PD-1 and CD39 on TIGIT+CD73−CD8+ T cells in pAML
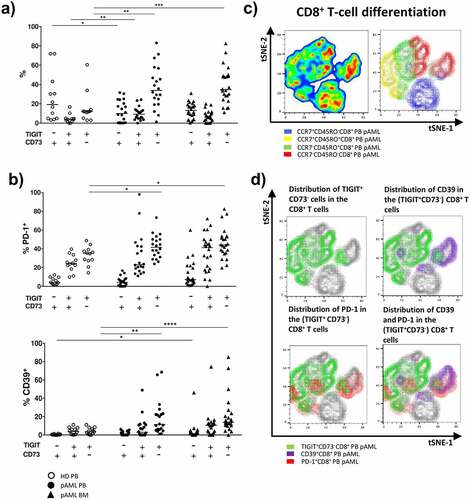
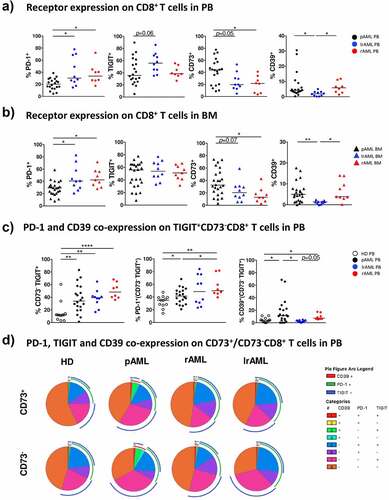
Figure 3. Comparison of the expression of TIGIT, PD-1, CD73 and CD39 on CD8+ T cells in pAML, rAML and lrAML
PD-1+-, CD73– and CD39+CD8+ T cells are increased in PB and BM of patients with a relapse in comparison to newly diagnosed AML
As the expression of TIGIT, CD73, CD39, and PD-1 in pAML was altered in comparison to healthy controls, we set out to analyze their expression shortly after relapse and during stable remission. MCF was performed on CD8+ T cells isolated from patients in remission after intensive chemotherapy (lrAML PB: n = 10; BM: n = 10), and from patients with relapsed AML (rAML PB: n = 8; BM: n = 9) before the start of re-induction chemotherapy. In contrast to pAML the frequency of PD-1+CD8+ T cells was further increased in PB and BM from patients with rAML (PB: median of 33.6% vs. 20.3%; p = .027 and BM: median of 42.4% vs. 29.4%; p = .018) (). Similar expression levels of TIGIT+ and CD39+ on CD8+ T cells were observed when we compared PB and BM from patients with rAML with samples from patients with pAML (). The frequency of CD73+CD8+ T cells was further reduced in PB and BM from patients with rAML in comparison to patients with pAML (PB: CD73 median of 21.6% vs. 44.1%; p = .048 and BM: CD73 median of 12.8% vs. 32.5%; p = .028) ().
Next, we analyzed the co-expression of PD-1 and CD39 on the TIGIT+CD73−CD8+ T-cell subset in rAML. The frequency of PD-1+TIGIT+CD73−CD8+ T cells was further increased in PB from patients with rAML in comparison to patients with pAML and HDs (rAML vs. HD p = .0069; rAML vs. pAML p = .0420) (). Similar findings occurred in the BM of patients with rAML (data not shown). The CD39+TIGIT+CD73−CD8+ T-cell population in PB from patients with rAML was not different from pAML but increased in comparison to PB from HDs (p = .0312) (). As in pAML, TIGIT expression correlated with CD39 expression on CD8+ T cells in PB from patients with rAML (r = 0.8; p < .01) (Supplement 8B).
As in rAML, patients with AML in remission showed a significantly higher frequency of PD-1+CD8+ T cells in PB and BM than patients with pAML (PB: PD-1 median of 30.3% vs. 20.25%; p = .0482 and BM: PD-1 median of 40.74% vs. 29.4%; p = .0408) (). The frequency of PD-1+CD8+ T cells in PB and BM from patients with lrAML was similar to that from patients with rAML (). The TIGIT expression tended to be higher in PB from patients with lrAML in comparison to pAML (p = .06) (). In the BM, we observed similar levels of TIGIT expression in all three disease groups (). Patients with lrAML displayed lower frequencies of CD39+CD8+ T cells than patients with pAML or rAML, also CD73+CD8+ T cells were decreased in lrAML in comparison to patients with pAML (CD73 PB: 19.7% vs. 44.1%; p = .05 and BM 20.4% vs. 32.5%; p = .0671 and CD39 PB 1.92% vs. 4.2%; p = .013 and BM: 1.37% vs. 5.0%; p = .0023) (). Strikingly, the frequency of CD39+TIGIT+CD73−CD8+ T cells in the PB of patients with lrAML did not differ from that observed in HDs, in contrast to the elevated frequencies seen in patients with pAML and rAML (rAML vs. lrAML p = .05 and pAML vs. lrAML p = .031) (). Our data indicates that we have two distinct immunophenotypic CD8+ T-cell subpopulations in AML. The PD-1+TIGIT+CD73−CD8+ T cells persisted in lrAML whereas the CD39+TIGIT+CD73−CD8+ T-cell subpopulation was increased in pAML and rAML and then normalized in lrAML to the frequencies found in HDs.
Decreased expression of CD127 and the transcription factor TCF-1 in CD8+ T cells in peripheral blood and bone marrow of patients with AML
Expression of TCF-1 identifies antigen-experienced CD8+ T cells that retain the ability for self-renewal while producing differentiated effector cells.Citation17 We analyzed TCF-1 expression in subsets of patients with pAML (PB, n = 7 and BM, n = 8), rAML (PB, n = 4 and BM, n = 4), and HDs (PB, n = 5) (Supplement 9A). The frequency of TCF-1+ cells was reduced in CD8+ T cells in PB and BM from patients with pAML compared to HDs (median of 54.0% vs. 78.1%; p = .03 and median of 34.2% vs. 78.1%; p = .0014) (). The reduced frequency of TCF-1+ cells was particularly prominent in the TIGIT+CD73−CD8+ T cells, with the greatest reduction observed in PB and BM of patients with pAML in comparison to HDs (median of 33.9% vs. 67.7%; p = .080 and median of 25.5% vs. 67.7%; p = .0261) (). Furthermore, expression of TCF-1 was inversely correlated with TIGIT expression in PB of patients with pAML (r = −0.87, p < .01) ().
Figure 4. Reduced frequencies of TCF-1+- and CD127+ CD8+ T cells in pAML and rAML vs. HDs
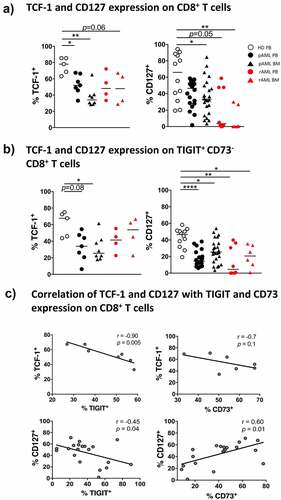
CD127 is expressed on long-living antigen-independent memory CD8+ T cells. Loss of CD127 expression is associated a diminished ability to form long-living memory cells.Citation21 We therefore analyzed the expression of CD127 on CD8+ T cells of patients with pAML (PB, n = 20 and BM, n = 24), rAML (PB, n = 8 and BM, n = 6), and from HDs (PB, n = 12). The frequency of CD127+CD8+ T cells was significantly reduced in BM from patients with pAML compared to PB of HDs (median of 33.3% vs. 66.0%; p = 0.037, respectively) but not in PB of pAML patients (). TIGIT+CD73−CD8+ T cells were predominantly CD127− in PB and BM of patients with pAML in contrast to HDs (PB vs. PB: median of 14.5% vs. 46.6%; p < .0001 and BM vs. PB: median of 25.4% vs. 46.6%; p = .0110) (). Expression of CD127 also correlated with CD73 expression in pAML (r = 0.6; p = .01) ().
In the PB and BM from patients with relapsing AML, the frequency of CD127+CD8+ T cells was reduced in comparison to HDs and patients with pAML (p = .05, p = .0037) (). As in pAML, CD127+ cells were especially reduced in the TIGIT+CD73−CD8+ T-cell subset in PB and BM in patients with rAML in comparison to HDs (p = .0036 and p = .0388) (). However, although the frequency of TCF-1+CD8+ T cells was reduced in BM from patients with rAML compared to HDs (p = .0635) (), we observed no difference in the frequency of TCF-1+ cells in the TIGIT+CD73−CD8+ T cells in rAML or pAML (). Taken together, the frequency of TCF-1+ and CD127+CD8+ T cells was reduced in pAML and rAML. Moreover, we observed an inverse association between the expression of TCF-1 and with TIGIT, and a positive association between CD127 and CD73 on CD8+ T cells.
Increased expression of the transcription factor TOX in CD8+ T cells in peripheral blood and bone marrow from AML patients
To further evaluate the exhaustion state of the CD8+ T cells in AML, we analyzed the expression of the transcription factor TOX. Expression has been associated with loss of the capability for T-cell re-invigoration upon checkpoint blockade.Citation22 Intranuclear TOX expression was assessed in CD8+ T cells of patients with pAML (PB, n = 14 and BM, n = 13), rAML (PB, n = 8 and BM, n = 6), and HDs (PB, n = 10) (Supplement 9A+B).
We detected a significantly increased frequency of CD8+ T cells expressing TOX in PB of patients with pAML compared to HDs (median of 47.9% vs. 26.2%; p = .0224) (). This upregulation of TOX was predominantly found in the TIGIT+CD73−CD8+ T-cell population in AML whereas in HDs no upregulation could be observed (PB vs. PB: 69.0% vs. 26.8%; p = .0152 (). Further co-expression analysis revealed an increased frequency of TOX+ cells in the PD-1+TIGIT+CD73− and the CD39+TIGIT+CD73−CD8+ T-cell subsets in PB from pAML patients compared to HDs (median of 24.1% vs. 12.2%; p = .0471 and median of 7.2% vs. 2.4%; p = .05) (). However, in BM from patients with pAML, the frequency of TOX+ cells was increased only in the CD39+TIGIT+CD73−CD8+ T-cell subset in comparison to HDs (median of 9.1% vs. 2.4%; p = .0415) ().
Figure 5. Increased TOX expression in pAML and rAML in comparison to HDs
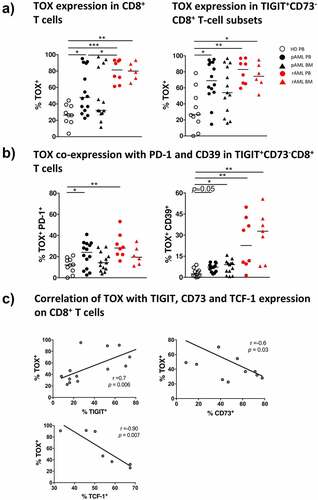
In rAML, the frequency of TOX+CD8+ T cells further increased in PB and BM of the patients in contrast to HDs (median of 81.5% vs. 26.2%; p = .0008 and median of 80.5% vs. 26.2% p = .0039) (). At even higher levels than in pAML in rAML the frequency of TOX+ cells was increased in the TIGIT+CD73−CD8+ T-cell population in PB and BM in contrast to HDs (PB vs. PB: median of 83.0% vs. 26.8%; p = .0036 and BM vs. PB: median of 74.5% vs. 26.8%; p = .0278) (). TOX was dominantly increased in the CD39+TIGIT+CD73−CD8+ T-cell subsets in rAML in contrast to HDs (PB vs. PB: median of 22.7% vs. 2.4%; p = .0053 and BM vs. PB: CD39 median of 32.8% vs. 2.4% p = .0034) (). TOX correlated positively with expression of TIGIT (r = 0.7; p < .01), and negatively with CD73 (r = −0.6; p = .03) and TCF-1 (r = −0.9; p = <0.01) (). In conclusion, we observed an increased expression of TOX in the CD8+ T cells in active AML in comparison to HDs. Moreover, expression of TOX in CD8+ T cells was associated with the PD-1+TIGIT+CD73−CD8+- and CD39+TIGIT+CD73−CD8+ T-cell population.
Discussion
Persistent antigens in the tumor environment can promote T-cell exhaustion.Citation4 Up to now, characterization of T cells in AML has yielded heterogeneous results with regard to whether immune exhaustion is characteristic of T cells in AML.Citation23,Citation24
Analysis of the differentiation status in our cohort confirmed that the frequency of CD8+ terminal differentiated (CD45R0−CCR7−) T cells was increased in the PB and BM regardless of the disease status. TIGIT+, CD39+ and CD73−CD8+ T cells were increased in the PB and BM of patients with pAML and rAML in comparison to HDs. Moreover, TIGIT+CD73−CD8+ T cells co-expressed PD-1 or CD39 in AML. During relapse, the PD-1+TIGIT+CD73−CD8+ T-cell subpopulations further increased and persisted after reaching stable disease remission while the frequency of CD39+TIGIT+CD73−CD8+ T cells returned to the levels found in HDs. CD8+ T cells especially the PD-1+- and CD39+TIGIT+CD73−CD8+ T-cell subsets in pAML and rAML exhibited further features of exhaustion as manifested by decreased expression of the surface molecule CD127 and increased intracellular expression of the transcription factors TOX combined with low levels of TCF-1. Correlation analysis of the multi-receptor expressing CD8+ T-cell subsets with blast counts, relapse or long-term remission as well as correlations with molecular or cytogenetic aberrations did not reach significant results due to the small numbers of patients, especially within the subgroups.
In agreement with other studies, we found that the frequency of PD-1+ cells was increased in patients during leukemia relapse, but also in remission.Citation23 In pAML, however, we observed a significant elevation only for TIGIT on CD8+ T cells.Citation6 TIGIT expression was explicitly related to the CD8+ effector memory T-cell subsets indicating that its expression is part of antigen-experience. TIGIT is expressed by dysfunctional T cells after chronic antigen stimulation in chronic infections and cancer.Citation7,Citation25 Regarding solid neoplasms, Chauvin et al. have demonstrated TIGIT upregulation on tumor antigen specific CD8+ T cells in the PB and tumor tissue of patients with advanced melanoma.Citation25 Functionally, inhibition of the TIGIT or its ligands poliovirus receptor (PVR) and poliovirus receptor-related 2 (PVRL2) in T cells significantly enhanced in vitro cytotoxicity, and prolonged survival in AML mouse model in vivo.Citation5 Importantly, high expression of PVR and PVRL2 was associated with a poorer prognosis in two independent AML patient cohorts, implying immune evasion in these patients.Citation5 TIGIT+CD8+ T cells produced reduced levels of effector cytokines but showed a high proliferation and a high susceptibility to apoptosis, which were partially reverted by TIGIT knockdown.Citation6 These results suggest that the TIGIT pathway is prominent in newly diagnosed AML, whereas multiple suppressive pathways contribute to leukemia relapse.
The expression of CD73 was significantly reduced on CD8+ T cells in PB and BM from patients with pAML in all four differentiation stages: naïve-, central memory-, effector memory- and terminally differentiated effector memory CD8+ T cells. These data are in line with a previous report and indicate that the reduced frequency of CD73+ T cells in AML is not only explained by variances in the differentiation status of cells.Citation26 In oncology CD73 has been identified as a novel target of interest since its expression was shown to be upregulated in response to oncogenic signals, e.g. hypoxic microenvironment.Citation27 High CD73 expression was associated with poor prognosis in the majority of these studies,Citation28–30 but with a better clinical outcome in others.Citation31,Citation32 In our study CD73−CD8+ T cells showed characteristics of exhaustion (e.g. increased expression of PD-1, TIGIT, CD39 and TOX). Functionally, Kong et al. showed that CD73−CD8+ T cells displayed features of exhaustion such as a reduced capacity for cytokine production.Citation26 These data support the hypothesis that loss of CD73 on CD8+ T cells in AML is associated with T-cell dysfunction and exhaustion.
Tumor-specific CD8+ T cells express high levels of CD39 in human cancer. These findings were also reported by independent groups for solid tumors and hematological malignancies.Citation33–35 It has been demonstrated that T-cell receptor engagement in the presence of IL-6 and TGF-β induces CD39 upregulation.Citation36 Moreover, CD39+CD8+ T cells were found not only to be enriched in the tumor microenvironment, but also in invaded lymph nodes and metastases compared to healthy tissues. Expression of CD39 on CD8+ T cells was associated with increased co-expression of PD-1, TIM-3, and LAG-3 as well as with decreased production of TNF, IL-2 and IFN-γ thus generating a characteristic phenotype of dysfunctional CD8+ T cells.Citation12,Citation37 In previous studies it has been demonstrated that inhibition of CD39 expressed by CD8+, CD4+ effector T cells and NK cells enhance proliferation, effector functions including anti-tumor cytotoxicity, and promote conversion from could to “hot” tumors with high immune infiltrates. Moreover, inhibition of CD39 on macrophages and myeloid-derived suppressor cells increased the inflammatory cytokine secretion and maturation of antigen-presenting cells.Citation38,Citation39 The reduced expression of CD39 in remission might be explained by an altered immune milieu, decreased inflammatory cytokines, reduced oxidative stress and hypoxia in remission.Citation39
One of the most important features of T-cell dysfunction seem to be the co-expression of multiple inhibitory receptors.Citation40 We observed increased frequencies of the PD-1+TIGIT+CD73−CD8+- and CD39+TIGIT+CD73−CD8+ T-cell subsets in PB and BM from patients with newly diagnosed and relapsed AML. These data strengthen the hypothesis that inhibitory immune pathways might be heterogeneric and specific for different disease stages. Co-expression of immune-suppressive targets e.g. PD-1, CD39 and TIGIT also provide a rationale for combinatorial targeting of different pathways to create effective leukemia therapeutics.Citation25
Moreover, TIGIT and PD-1 are being evaluated as therapeutic targets in clinical trials or have already been approved for solid and hematologic malignancies.Citation25,Citation41,Citation42 To date, there are several clinical trials investigating the potential of TIGIT alone or in combination with PD-1/PDL-1 inhibition to treat various advanced or metastatic solid malignancies.Citation42 In addition, a specific CD39 inhibitor significantly enhanced the anti-tumor activity of anti-PD-1 and anti-CTLA-4 monoclonal antibodies in a NK cell and IFN-γ dependent manner in a lung metastasis models.Citation14
CD127 and TCF-1 expression is associated with generation of CD8+ memory T-cell responses and long-term maintenance of an effective protective immunity.Citation15 Overexpression of TCF-1 diminishes the expression of coinhibitory receptors e.g. PD-1.Citation43 TCF-1lowPD-1+CD8+ T cells have been recently identified as a terminally differentiated exhausted T-cell subset. In chronic viral infection it has been demonstrated that only TCF-1+PD-1lowCD8+ T cells can be re-invigorated by blockade of the PD-1/PD-L1.Citation44 Moreover, ectopic TCF-1 expression promotes the generation of a stem-like program in exhausted CD8+ T cells, thereby enhancing viral and tumor immunity.Citation45
In our study the expression of TCF-1 correlated negatively with TOX expression in CD8+ T cells. In contrast to the reduced TCF-1 levels, we observed increased expression of TOX in CD8+ T cells in the PB and BM of patients with AML. TOX+ cells were significantly enriched in TIGIT+CD73−CD39+CD8+ T cells in pAML, and even more so in relapsed AML. Our findings underscore the reports that expression of TOX is induced in terminal exhausted CD8+ T cells. Overexpression of TOX boosts expression of PD-1 and additional inhibitory receptors and suppresses effector functions.Citation18,Citation19 These findings indicate that TOX is necessary for preventing over-activation of antigen experienced CD8+ T cells by induction of exhaustion.Citation18 Expression of TOX also hampered re-activation of exhausted memory CD8+ T cells upon coinhibitory receptor blockade and led to fixation of the dysfunctional phenotype.Citation19,Citation46 As a central regulator of T-cell exhaustion, TOX is of great interest as a therapeutic target in immuno-oncology. Seo et al. showed that expression of TOX correlated with PD-1 expression and diminished effector cytokine production. Moreover, the partial knockdown of TOX improved the functionality of CAR-T cells directed against a tumor model, while Khan et al. showed that heterozygous deletion of TOX strengthens the anti-tumor T-cell responses.Citation19,Citation47
Conclusions
In our study CD8+ T cells in the PB and BM from patients with AML exhibit a key signature defined as TIGIT+CD73−CD8+ T cells. These cells can be further subdivided into two populations, the PD-1+TIGIT+CD73−CD8+- and the CD39+TIGIT+CD73−CD8+ T-cell subset. The frequency of PD-1+TIGIT+CD73−CD8+ T cells increased over progression of the disease and persisted in remission whereas the CD39+TIGIT+CD73−CD8+ T-cell population was normalized in remission to levels similar to HDs. These results provide a rationale to combine different immunotherapeutical approaches in AML. In our study, TOX expression was associated with TIGIT and CD73 expression on CD8+ T cells. TOX might regulate the expression of TIGIT, CD39, PD-1 and TCF-1 in the course of chronic antigen stimulation and thus provide an additional potential target to improve T-cell mediated cytotoxicity in AML.
Disclosure of potential conflicts of interest
FB: Travel grant Daiichi Sankyo, Servier, Novartis; advisory board by Jazz. GmbH, Daiichi Sankyo. WF: Membership on an entity’s board of directors or advisory Amgen, ARIAD/Incucyte, Pfizer, Novartis, Jazz Pharmaceuticals, Morphosys, Abbvie, Celgene, TEVA GmbH; patents and royalities Amgen; other support for meeting attendance Amgen, Gilead, Jazz Pharmaceuticals, Servier, Daiichi Sankyo; research funding Amgen, Pfizer; Travel grant, TEVA GmbH, Gilead Inc and Jazz. GmbH; research funding: Pfizer Inc, Amgen.CB: consulting or advisory Lilly/imClone, Merck, Sanofi, Bayer, GSO, AOK Health insurance; research funding Abbvie, ADC Therapeutics, Agile Therapeutics, Alexion Therapeutics, Amgen, Apellis Pharmaceuticals, Astellas Pharma, AstraZeneca, Boehringer Ingelheim, Celgene, Daiichi Sankyo, Gilead Sciences, Incucyte, Karyopharm Therapeutics, Millenium, MSD, Novartis and Roche, travel grants: Merck, Sanofi, Pfizer, Bristol-Meyer Squibb. The remaining authors declare that they have no conflict of interest.
Availability of data and materials
The datasets used and/or analyzed during the current study are available from the corresponding authors on
reasonable request.
Authors’ contributions
FB designed the research study, performed the experiments, analyzed the data, and wrote the manuscript. RW performed the experiments. NW discussed the data. FH, ET, and AR reviewed the data and the manuscript. GV collected the samples. JW and CB reviewed the manuscript. JSzW, CA and WF conceived the concept, oversaw the interpretation and presentation of the data and wrote the manuscript. All authors read and approved the final manuscript.
Ethics approval and consent to participate
The study was approved the local ethics board of the Ärztekammer Hamburg (PV3469). Informed written
consent was obtained from all patients.
Consent for publication
Not applicable.
Supplemental Material
Download ()Acknowledgments
We thank all our patients for their trust, understanding, and willingness to provide their blood samples for our
research. FB thank Elias Brauneck for reviewing the manuscript.
Supplementary material
Supplemental data for this article can be accessed on the publisher’s website
Additional information
Funding
References
- Lamble AJ, Lind EF. Targeting the immune microenvironment in acute myeloid leukemia: a focus on T cell immunity. Front Oncol. 2018;8:213. doi:10.3389/fonc.2018.00213.
- Lichtenegger FS, Krupka C, Haubner S, Köhnke T, Subklewe M. Recent developments in immunotherapy of acute myeloid leukemia. J Hematol Oncol. 2017;10(1):142. doi:10.1186/s13045-017-0505-0.
- Williams BA, Law A, Hunyadkurti J, Desilets S, Leyton JV, Keating A. Antibody therapies for acute myeloid leukemia: unconjugated, toxin-conjugated, radio-conjugated and multivalent formats. J Clin Med. 2019;8(8):8. doi:10.3390/jcm8081261.
- Wherry EJ, Ha SJ, Kaech SM, Haining WN, Sarkar S, Kalia V, Subramaniam S, Blattman JN, Barber DL, Ahmed R, et al. Molecular signature of CD8+ T cell exhaustion during chronic viral infection. Immunity. 2007;27(4):670–13. doi:10.1016/j.immuni.2007.09.006.
- Stamm H, Klingler F, Grossjohann EM, Muschhammer J, Vettorazzi E, Heuser M, Mock U, Thol F, Vohwinkel G, Latuske E, et al. Immune checkpoints PVR and PVRL2 are prognostic markers in AML and their blockade represents a new therapeutic option. Oncogene. 2018;37(39):5269–5280. doi:10.1038/s41388-018-0288-y.
- Kong Y, Zhu L, Schell TD, Zhang J, Claxton DF, Ehmann WC, Rybka WB, George MR, Zeng H, Zheng H, et al. T-cell immunoglobulin and ITIM domain (TIGIT) associates with CD8(+) T-cell exhaustion and poor clinical outcome in AML patients. Clin Cancer Res. 2016;22(12):3057–3066. doi:10.1158/1078-0432.CCR-15-2626.
- Ackermann C, Smits M, Woost R, Eberhard JM, Peine S, Kummer S, Marget M, Kuntzen T, Kwok WW, Lohse AW, et al. HCV-specific CD4+ T cells of patients with acute and chronic HCV infection display high expression of TIGIT and other co-inhibitory molecules. Sci Rep. 2019;9(1):10624. doi:10.1038/s41598-019-47024-8.
- Allard D, Allard B, Gaudreau PO, Chrobak P, Stagg J. CD73-adenosine: a next-generation target in immuno-oncology. Immunotherapy-Uk. 2016;8(2):145–163. doi:10.2217/imt.15.106.
- Jiang T, Xu XF, Qiao M, Li X, Zhao C, Zhou F, Gao G, Wu F, Chen X, Su C, et al. Comprehensive evaluation of NT5E/CD73 expression and its prognostic significance in distinct types of cancers. BMC Cancer. 2018;18(1). ARTN 267. doi:10.1186/s12885-018-4073-7.
- Bastid J, Regairaz A, Bonnefoy N, Déjou C, Giustiniani J, Laheurte C, Cochaud S, Laprevotte E, Funck-Brentano E, Hemon P, et al. Inhibition of CD39 enzymatic function at the surface of tumor cells alleviates their immunosuppressive activity. Cancer Immunol Res. 2015;3(3):254–265. doi:10.1158/2326-6066.Cir-14-0018.
- Toth I, Le AQ, Hartjen P, Thomssen A, Matzat V, Lehmann C, Scheurich C, Beisel C, Busch P, Degen O, et al. Decreased frequency of CD73(+) CD8(+) T cells of HIV-infected patients correlates with immune activation and T cell exhaustion. J Leukocyte Biol. 2013;94(4):551–561. doi:10.1189/jlb.0113018.
- Duhen T, Duhen R, Montler R, Moses J, Moudgil T, De Miranda NF, Goodall CP, Blair TC, Fox BA, McDermott JE, et al. Co-expression of CD39 and CD103 identifies tumor-reactive CD8 T cells in human solid tumors. Nat Commun. 2018;9(1). ARTN 2724. doi:10.1038/s41467-018-05072-0.
- Mohme M, Schliffke S, Maire CL, Rünger A, Glau L, Mende KC, Matschke J, Gehbauer C, Akyüz N, Zapf S, et al. Immunophenotyping of newly diagnosed and recurrent glioblastoma defines distinct immune exhaustion profiles in peripheral and tumor-infiltrating lymphocytes. Clinical Cancer Research. 2018;24(17):4187–4200. doi:10.1158/1078-0432.Ccr-17-2617.
- Zhang HY, Vijayan D, Li XY, Robson SC, Geetha N, Teng MWL, Smyth MJ. The role of NK cells and CD39 in the immunological control of tumor metastases. Oncoimmunology ARTN e1593809. 2019;8(6):e1593809. doi:10.1080/2162402X.2019.1593809.
- Wieland D, Kemming J, Schuch A, Emmerich F, Knolle P, Neumann-Haefelin C, Held W, Zehn D, Hofmann M, Thimme R, et al. TCF1(+) hepatitis C virus-specific CD8(+) T cells are maintained after cessation of chronic antigen stimulation. Nat Commun. 2017;8(1):15050. doi:10.1038/ncomms15050.
- Renkema KR, Huggins MA, Da Silva HB, Knutson TP, Henzler CM, Hamilton SE. KLRG1(+) memory CD8 T cells combine properties of short-lived effectors and long-lived memory. Journal of Immunology. 2020;205(4):1059–1069. doi:10.4049/jimmunol.1901512.
- Kratchmarov R, Magun AM, Reiner SL. TCF1 expression marks self-renewing human CD8(+) T cells. Blood Adv. 2018;2(14):1685–1690. doi:10.1182/bloodadvances.2018016279.
- Scott AC, Dundar F, Zumbo P, Chandran SS, Klebanoff CA, Shakiba M, Trivedi P, Menocal L, Appleby H, Camara S, et al. TOX is a critical regulator of tumour-specific T cell differentiation. Nature. 2019;571(7764):270-+. doi:10.1038/s41586-019-1324-y.
- Khan O, Giles JR, McDonald S, Manne S, Ngiow SF, Patel KP, Werner MT, Huang AC, Alexander KA, Wu JE, et al. TOX transcriptionally and epigenetically programs CD8(+) T cell exhaustion. Nature. 2019;571(7764):211-+. doi:10.1038/s41586-019-1325-x.
- Bono MR, Fernandez D, Flores-Santibanez F, Rosemblatt M, Sauma D. CD73 and CD39 ectonucleotidases in T cell differentiation: beyond immunosuppression. FEBS Lett. 2015;589(22):3454–3460. doi:10.1016/j.febslet.2015.07.027.
- Huster KM, Busch V, Schiemann M, Linkemann K, Kerksiek KM, Wagner H, Busch DH. Selective expression of IL-7 receptor on memory T cells identifies early CD40L-dependent generation of distinct CD8(+) memory T cell subsets. P Natl Acad Sci USA. 2004;101(15):5610–5615. doi:10.1073/pnas.0308054101.
- Kim K, Park S, Park SY, Kim G, Park SM, Cho J-W, Kim DH, Park YM, Koh YW, Kim HR, et al. Single-cell transcriptome analysis reveals TOX as a promoting factor for T cell exhaustion and a predictor for anti-PD-1 responses in human cancer. Genome Med. 2020;12(1). ARTN 22. doi:10.1186/s13073-020-00722-9.
- Schnorfeil FM, Lichtenegger FS, Emmerig K, Schlueter M, Neitz JS, Draenert R, Hiddemann W, Subklewe M. T cells are functionally not impaired in AML: increased PD-1 expression is only seen at time of relapse and correlates with a shift towards the memory T cell compartment. J Hematol Oncol. 2015;8(1). ARTN 93. doi:10.1186/s13045-015-0189-2.
- Williams P, Basu S, Garcia-Manero G, Hourigan CS, Oetjen KA, Cortes JE, Ravandi F, Jabbour EJ, Al‐Hamal Z, Konopleva M, et al. The distribution of T-cell subsets and the expression of immune checkpoint receptors and ligands in patients with newly diagnosed and relapsed acute myeloid leukemia. Cancer. 2019;125(9):1470–1481. doi:10.1002/cncr.31896.
- Chauvin JM, Pagliano O, Fourcade J, Sun Z, Wang H, Sander C, Kirkwood JM, Chen THT, Maurer M, Korman AJ, et al. TIGIT and PD-1 impair tumor antigen-specific CD8(+) T cells in melanoma patients. J Clin Invest. 2015;125(5):2046–2058. doi:10.1172/Jci80445.
- Kong YX, Jia B, Zhao CC, Claxton DF, Sharma A, Annageldiyev C, Fotos JS, Zeng H, Paulson RF, Prabhu KS, et al. Downregulation of CD73 associates with T cell exhaustion in AML patients. J Hematol Oncol. 2019;12(1). ARTN 40. doi:10.1186/s13045-019-0728-3.
- Soleimani A, Farshchi HK, Mirzavi F, Zamani P, Ghaderi A, Amini Y, Khorrami S, Mashayekhi K, Jaafari MR. The therapeutic potential of targeting CD73 and CD73-derived adenosine in melanoma. Biochimie. 2020;176:21–30. doi:10.1016/j.biochi.2020.06.001.
- Ren ZH, Lin CZ, Cao W, Yang R, Lu W, Liu Z-Q, Chen Y-M, Yang X, Tian Z, Wang L-Z, et al. CD73 is associated with poor prognosis in HNSCC. Oncotarget. 2016;7(38):61690–61702. doi:10.18632/oncotarget.11435.
- Leclerc BG, Charlebois R, Chouinard G, Allard B, Pommey S, Saad F, Stagg J. CD73 expression is an independent prognostic factor in prostate cancer. Clinical Cancer Research. 2016;22(1):158–166. doi:10.1158/1078-0432.Ccr-15-1181.
- Gaudreau PO, Allard B, Turcotte M, Stagg J. CD73-adenosine reduces immune responses and survival in ovarian cancer patients. Oncoimmunology. 2016;5(5):e1127496. doi:10.1080/2162402X.2015.1127496.
- Inoue Y, Yoshimura K, Kurabe N, Kahyo T, Kawase A, Tanahashi M, Ogawa H, Inui N, Funai K, Shinmura K, et al. Prognostic impact of CD73 and A2A adenosine receptor expression in non-small-cell lung cancer. Oncotarget. 2017;8(5):8738–8751. doi:10.18632/oncotarget.14434.
- Oh HK, Sin JI, Choi J, Park SH, Lee TS, Choi YS. Overexpression of CD73 in epithelial ovarian carcinoma is associated with better prognosis, lower stage, better differentiation and lower regulatory T cell infiltration. J Gynecol Oncol. 2012;23(4):274–281. doi:10.3802/jgo.2012.23.4.274.
- Cai XY, Wang XF, Li J, Dong J-N, Liu J-Q, Li N-P, Yun B, Xia R-L, Qin J, Sun Y-H, et al. High expression of CD39 in gastric cancer reduces patient outcome following radical resection. Oncol Lett. 2016;12(5):4080–4086. doi:10.3892/ol.2016.5189.
- Kunzli BM, Bernlochner MI, Rath S, Käser S, Csizmadia E, Enjyoji K, Cowan P, d’Apice A, Dwyer K, Rosenberg R, et al. Impact of CD39 and purinergic signalling on the growth and metastasis of colorectal cancer. Purinergic Signal. 2011;7(2):231–241. doi:10.1007/s11302-011-9228-9.
- Vaisitti T, Arruga F, Guerra G, Deaglio S. Ectonucleotidases in blood malignancies: a tale of surface markers and therapeutic targets. Front Immunol. 2019;10. ARTN 2301. doi:10.3389/fimmu.2019.02301.
- Canale FP, Ramello MC, Nunez N, Furlan CLA, Bossio SN, Serrán MG, Boari JT, Del Castillo A, Ledesma M, Sedlik C, et al. CD39 expression defines cell exhaustion in tumor-infiltrating CD8(+) T cells. Cancer Res. 2018;78(1):115–128. doi:10.1158/0008-5472.Can-16-2684.
- Thelen M, Lechner A, Wennhold K, Von Bergwelt-baildon M, Schlößer HA. CD39 expression defines cell exhaustion in tumor-infiltrating CD8(+) T cells—letter. Cancer Res. 2018;78(17):5173–5174. doi:10.1158/0008-5472.Can-18-0873.
- Moesta AK, Li XY, Smyth MJ. Targeting CD39 in cancer. Nat Rev Immunol. 2020;20(12):739–755. doi:10.1038/s41577-020-0376-4.
- Allard D, Allard B, Stagg J. On the mechanism of anti-CD39 immune checkpoint therapy. J Immunother Cancer ARTN e000186. 2020;8(1):e000186. doi:10.1136/jitc-2019-000186.
- Zhang Z, Liu S, Zhang B, Qiao L, Zhang Y, Zhang Y. T cell dysfunction and exhaustion in cancer. Front Cell Dev Biol. 2020;8:17. doi:10.3389/fcell.2020.00017.
- Xin YJ, Hodge JP, Oliva C, Neftelinov ST, Hubbard-Lucey VM, Tang J. Trends in clinical development for PD-1/PD-L1 inhibitors. Nat Rev Drug Discov [published Online First: 2020/03/05]. 2020;19(3):163–164. doi:10.1038/d41573-019-00182-w.
- Qin S, Xu LP, Yi M, Yu S, Wu K, Luo S. Novel immune checkpoint targets: moving beyond PD-1 and CTLA-4. Mol Cancer. 2019;18(1). doi:10.1186/s12943-019-1091-2. ARTN 155.
- Wang YF, Hu JJ, Li YD, Xiao M, Wang H, Tian Q, Li Z, Tang J, Hu L, Tan Y, et al. The transcription factor TCF1 preserves the effector function of exhausted CD8 T cells during chronic viral infection. Front Immunol. 2019;10. ARTN 169. doi:10.3389/fimmu.2019.00169.
- Utzschneider DT, Charmoy M, Chennupati V, Pousse L, Ferreira DP, Calderon-Copete S, Danilo M, Alfei F, Hofmann M, Wieland D, et al. T cell factor 1-expressing memory-like CD8(+) T cells sustain the immune response to chronic viral infections. Immunity. 2016;45(2):415–427. doi:10.1016/j.immuni.2016.07.021.
- Shan Q, Hu SE, Chen X, Danahy DB, Badovinac VP, Zang C, Xue HH. Ectopic Tcf1 expression instills a stem-like program in exhausted CD8(+) T cells to enhance viral and tumor immunity. Cell Mol Immunol. 2020. doi:10.1038/s41423-020-0436-5.
- Mann TH, Kaech SM. CD8(+) T CELLS Tick-TOX, it’s time for T cell exhaustion. Nat Immunol. 2019;20(9):1092–1094. doi:10.1038/s41590-019-0478-y.
- Seo H, Chen J, Gonzalez-Avalos E, Samaniego-Castruita D, Das A, Wang YH, López-Moyado IF, Georges RO, Zhang W, Onodera A, et al. TOX and TOX2 transcription factors cooperate with NR4A transcription factors to impose CD8+ T cell exhaustion. P Natl Acad Sci USA. 2019;116(39):19761. doi:10.1073/pnas.1914896116.