
 ?Mathematical formulae have been encoded as MathML and are displayed in this HTML version using MathJax in order to improve their display. Uncheck the box to turn MathJax off. This feature requires Javascript. Click on a formula to zoom.
ABSTRACT
Clear cell renal cell carcinoma (ccRCC) is the most common kidney malignancy characterized by a poor prognosis. The treatment efficacy of immune checkpoint inhibitors (ICIs) also varies widely in advanced ccRCC. We aim to construct a robust gene signature to improve the prognostic discrimination and prediction of ICIs for ccRCC patients. In this study, adopting differentially expressed genes from seven ccRCC datasets in GEO (Gene Expression Omnibus), a novel signature (FOXM1&TOP2A) was constructed in TCGA (The Cancer Genome Atlas) database by LASSO and Cox regression. Survival and time-dependent ROC analysis revealed the strong predictive ability of our signature in discovery set, two online validation sets and one tissue microarray (TMA) from our institution. High-risk group based on the signature comprises more high-grade (G3&G4) and advanced pathologic stage (stageIII/IV) tumors and presents hyperactivation of cell cycle process according to the functional analysis. Meanwhile, high-risk tumors demonstrate an immunosuppressive phenotype with more infiltrations of regulatory T cells (Tregs), macrophages and high expressions of genes negatively regulating anti-tumor immunity. Low-risk tumors have an improved response to anti-PD-1 therapy and the predictive ability of our signature is better than other recognized biomarkers in ccRCC. A nomogram containing this signature showed a high predictive accuracy with AUCs of 0.90 and 0.84 at 3 and 5 years. Overall, this robust signature could predict prognosis, evaluate immune microenvironment and response to anti-PD-1 therapy in ccRCC, which is very promising in clinical promotion.
Introduction
Clear cell renal cell carcinoma (ccRCC) is the most common subtype of renal cell carcinoma (RCC) and responsible for the majority of RCC-related deaths.Citation1 Surgical resection is recommended for patients with localized ccRCC and many of them possess favorable prognosis.Citation2 However, 20–40% patients would experience tumor progression and death after curative intent surgery.Citation3,Citation4 Benefiting from better understandings of tumor immunogenicity and large numbers of clinical trials, several immune checkpoints inhibitors (ICIs) have been approved for metastatic ccRCC after targeted therapy failure (nivolumab) or in combination with targeted agents (pembrolizumab + axitinib/avelumab + axitinib) as the first-line therapy.Citation5–7 Tumor immune microenvironment (TIME) which comprises infiltrated immune cells and immunomodulatory molecules has been revealed highly correlated with cancer progression and ICIs response.Citation8–10 Thus, constructing a prognostic model with the power of evaluating TIME has a great potentiality of predicting clinical outcomes and immunotherapy response in ccRCC.
In recent years, some powerful multi-gene signatures have been developed to evaluate the postoperative risk or ICIs response for ccRCC. ClearCode34 is a mRNA classifier established from an institutional cohort and The Cancer Genome Atlas (TCGA) database. It demonstrated a satisfactory diagnostic performance over clinical nomograms with c-indices of 0.65–0.70.Citation11 Rini and his collgues developed a 16-gene assay capable of predicting recurrence after surgery for localized ccRCC.Citation12 Deep RNA-seq analysis constructed a B cell-related gene signature to predict efficacy of anti-PD-1 therapy in ccRCC.Citation13 All of these mRNA-based signatures usually incorporated dozens of biomarkers detected by RNA sequencing or RT-PCR without validation by other types of data (such as microarray or tissue microarray), which might restrain their applications in clinical practice.
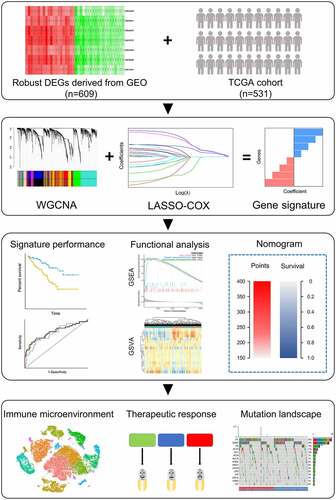
In this study, we integrally analyzed seven ccRCC datasets from Gene Expression Omnibus (GEO) and TCGA database to develop a robust signature, the predictive ability of which was validated in two independent cohorts online and one tissue microarray (TMA) cohort from our institution. This signature further demonstrated strong capacity of estimating TIME and response to immunotherapy in ccRCC. What’s more, in combination with clinicopathological features, a nomogram based on our gene signature presented improved predictive power and risk stratification for ccRCC.
Material and methods
Collection of ccRCC datasets
Microarray datasets applied to robust DEGs analysis were downloaded from GEO (http://www.ncbi.nlm.nih.gov/geo/). All included datasets met the following criteria: Gene expression data containing at least 10 human ccRCC and adjacent normal tissues. Seven ccRCC datasets were finally determined for our research: GSE53757, GSE53000, GSE36895, GSE15641, GSE66272, GSE68417, GSE40435. Clinical and RNA-seq data of ccRCC samples was downloaded from TCGA database (https://cancergenome.nih.gov/). E-MTAB-1980 dataset downloaded from ArrayExpress database (https://www.ebi.ac.uk/arrayexpress/) was served as validation set.
Tissue microarray (TMA) containing ccRCC and adjacent normal samples were collected from patients undergoing nephrectomy in Renji Hospital. Informed consent was obtained from all patients. Clinicopathologic information was collected during the follow-up after surgery. TNM stage was determined according to American Joint Committee on Cancer staging manual (7th edition), and pathological grade was evaluated according to the Fuhrman grading system. This was approved by the Ethics and Research Committees of Renji Hospital, Shanghai Jiao Tong University School of Medicine.
Robust DEGs identification
R packages “affy” or “oligo” were selected to conduct combination of original CEL file, RMA background correction and data normalization according to their compatibility with platforms.Citation14,Citation15 Package “limma” was utilized to find DEGs with the threshold set at log2FoldChange >.585 and adjusted P < .05.Citation16 Then, we utilized the robust rank aggregation (RRA) method to integrate the results of 7 GEO datasets to identify the robust DEGs.Citation17
Co-expression modules construction and hub genes identification
Weighted Gene Co-expression Network Analysis (WGCNA) is a method capable of transforming expression data into co-expression gene modules and exploring the relationship between modules and phenotypic traits.Citation18 In our study, top 3000 upregulated DEGs (according to P) were extracted from RRA analysis to perform WGCNA using the expression data of TCGA cohort. Scale independence and average connectivity degree of network with different power value were tested (ranging from 1 to 18). The appropriate power value was determined when scale independence was above 0.85 with relatively higher connectivity degree. Then, according to topological overlap matrix(TOM)‐based dissimilarities, genes were sorted into different gene modules. The module with the highest correlation with clinical traits was regarded as key module and selected to identify candidate hub genes.
Hub genes were determined by the overlap of candidate hub genes and genes selected from protein–protein interaction (PPI) network.Citation19 These genes were further validated in TCGA cohort. Genes which were upregulated in tumor and significantly correlated with overall survival (OS) of ccRCC patients (P < .01) were chosen for further analysis.
Signature construction
Least Absolute Shrinkage and Selection Operator regression (LASSO) is a form of penalized regression which could be used in screening variables from high dimensional data to construct risk models.Citation20 In our study, patients in TCGA cohort were randomly divided into two group by 3:1 ratio, discovery set (n = 398) and internal validation set (n = 133). LASSO regression was performed on discovery set to find most valuable genes with prognostic power in ccRCC. Optimal value of tuning parameter (λ) were determined by ten-time cross-validation using minimum criteria. Prognostic values of these genes were further validated on the TMA cohort. Multivariate cox regression was used to construct the gene signature. Based on the signature we built, a risk score formula was established as follows:
Coefficient of gene (i) is the regression coefficient of gene (i) in LASSO-Cox regression model and Expression of gene (i) is the expression value of Gene (i) for each patient. Patients were divided into high- and low-risk groups according to the median of risk score.
Enrichment analysis
Gene Ontology (GO) enrichment and Kyoto Encyclopedia of Genes and Genomes (KEGG) pathway analysis were performed on genes in the key module by R package “clusterprofiler”.Citation21 After setting the criteria of adjusted P < .01, GO terms and KEGG pathways were visualized by package “ggplot2”.
We utilized the package “clusterprofiler” to conduct Gene Set Enrichment Analysis (GSEA) analysis for signature genes.Citation21 Meanwhile, the “GSVA” package was used to find significantly correlated pathways.Citation22 adjusted P < .01 was regarded as statistical significance. The gene set “c2.cp.kegg.v6.2.symbols.gmt” and “h.all.v7.2.symbols.gmt” was chosen as the reference gene set.
Nomogram construction
We performed univariate analysis on clinicopathologic parameters and our signature in the TMA cohort. The significant prognostic variables (P < .05) were subsequently incorporated into multivariate Cox regression analysis. R package “rms” was utilized to build the nomogram adopting variables with predictive significance in multivariate analysis (P < .05). Calibration curves were used to assess the consistency between predicted and actual survival outcome. Furthermore, time-dependent ROC curves were applied to compare the predictive accuracy of nomogram, gene risk model and clinicopathologic factors.
Immune infiltration analysis
CIBERSORT, IMMUNCELL AI and ESTIMATE were used to estimate immune cells abundance between high- and low-risk groups using expression data from TCGA database.Citation23–25 Immune-related molecules were further analyzed to understand immune infiltration in ccRCC.Citation26,Citation27
Response to anti-PD-1 therapy
Clinical and RNA-seq data were retrieved from two clinical trials: 1) a phase III study of nivolumab vs. everolimus in patients with previously treated metastatic RCC (CheckMate 025, NCT01668784); 2) a phase II study of metastatic RCC patients treated with nivolumab (CheckMate 010, NCT01354431).Citation28 Details on study designs and treatment for patients in each trail have been published before.Citation5,Citation29 Metastatic ccRCC patients treated with nivolumab were collected to evaluate the predictive ability of our signature.
Somatic variants analysis
Genetic mutation data were downloaded from TCGA database. The “maftools” package was used to analyze somatic variants. The overall mutation status was depicted in high- and low-risk groups. Top five mutated genes were also compared between two risk groups.
Immunohistochemistry (IHC)
The primary antibodies used in IHC for TMA slides were as follows: anti-FOXM1 (Proteintech, #13147-1-AP, 1:100 dilution), anti-TOP2A (Santa Cruz, #sc365916, 1:50 dilution), anti-NUF2 (Bioss, #bs-7714 R, 1:100 dilution), anti-KIF18B (Novus, #NBP1-90882, 1:50 dilution). TMAs were stained according to the conventional streptavidin-peroxidase method of IHC (Zymed Laboratories Inc, San Francisco, CA, USA). Two certified pathologists who were blind to the information of patients independently analyzed the IHC results. At high (200×) magnification, the percentage of positive cells was scored as: 1 (0–25%), 2 (26–50%), 3 (51–75%), 4 (>75%), the intensity of positive staining was classified into 4 scales: 0 (negative), 1 (weak), 2 (moderate), 3 (strong). Then, comprehensive score (staining percentage × intensity) was used to evaluate the expression level of signature genes. Disagreements between two pathologists were resolved by consensus. Comprehensive score = 6 was set as cutoff value to define high and low expression group of signature genes.
Multiplex immunohistochemistry (mIHC)
Staining of TMA slides was performed with the autostainer system Bond III (Leica Biosystems, Austria). Primary antibodies are as follows: anti-CD68 (Gene Tech, #GM087602, 1:100 dilution), anti-CD163 (ABCAM, #ab182422, 1:300 dilution), anti-FOXP3 (R&B, #MAB8214, 1:100 dilution), anti-PD-L1 (CST, #13684, 1:400 dilution). Each slides were scanned with the Pannoramic MIDI (3DHISTECH, Hungary). Multispectral images were evaluated using HALO Image Analysis Platform (Version 2.3.2089.52, Indica Labs, US). Individual cells were identified using the DAPI nucleus staining. Treg cell (FOXP3+), Macrophage (CD68+), Macrophage M2 (CD68+/CD163+) and PD-L1 positive cells were quantified and their percentages in each TMA core were calculated.
Results
Identification of robust DEGs
The design of our study is shown in . The information of 7 ccRCC GEO datasets included in current study is displayed in Table S1. RRA could combine and rank multiple lists of DEGs derived from datasets measured by different platforms.Citation17 A total of 266 ccRCC samples and 343 peritumor tissues were incorporated into RRA analysis to identify the robust DEGs. The expression pattern of top 20 upregulated and down-regulated robust DEGs demonstrated high consistency in different datasets (Figure S1).
Figure 1. Schematic diagram of the study design
Identification of the key module and hub genes
To find the key module most correlated with clinical traits, we performed WGCNA on TCGA cohort extracting robust DEGs derived from the RRA analysis. Clinical information was retrieved from TCGA (). After setting soft-thresholding value as 6 (scale free R2 = .87, mean connectivity = 11.10) and cut height as 0.20, eight co-expression modules were eventually identified (). According to the heatmap of module-trait relationships, green module demonstrates the highest correlations with clinical traits (; R2 = .35 and P = 2e−16 with pathologic stage, R2 = .38 and P = 6e−20 with tumor grade, R2 = .31 and P = 2e−13 with vital status). Module significance analysis further validated that green module is the highest correlated module with survival status of ccRCC patients (). Herein, we determined green module as the key module. GO and KEGG analyses were conducted to obtain further insight into biological function of genes within the key module. Based on adjust P value, top ten significant GO terms for biological process, molecular function and cellular component, as well as KEGG pathways, are shown in Figure S2. The results implied that genes in the key module are mainly involved in mitotic cell cycle, nuclear division and organelle fission.
Figure 2. Identification of the key module by WGCNA. (a) Clustering dendrogram of ccRCC samples and heatmap of clinical traits. The clustering was based on the expression data of robust DEGs. The color intensity in heatmap increased with age, pathological stage and grade. In terms of survival status, white means alive and red means dead. (b) Analysis of the scale-free fit index (left) and the mean connectivity (right) for various soft-thresholding power value. (c) Clustering of module eigengenes. The red line indicates cut height = 0.20. (d) Dendrogram of all DEGs clustered based on a dissimilarity measure (1-TOM) together with assigned module colors. (e) Heatmap of the correlation between module eigengenes and clinical traits of ccRCC. Each cell contains the Pearson correlation coefficient and P value. (f) Distribution of average gene significance and errors in the modules associated with survival status of ccRCC
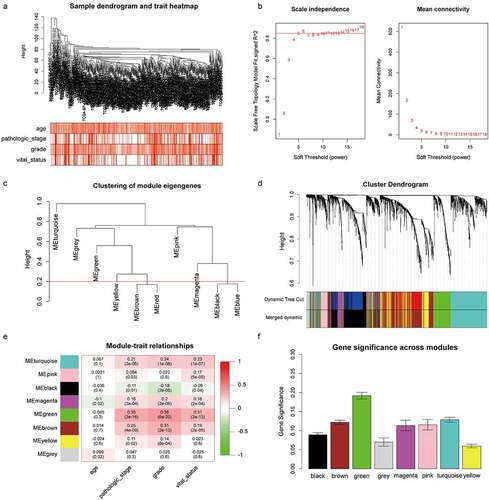
Hub genes were recognized as the overlap of candidate hub genes and gene in MCODE sub module.Citation30 Under the thresholds of Module Membership >.8 and Gene Significance >.2, 53 candidate genes in green module were extracted (Figure S3A), 105 genes were chosen from PPI network after MCODE analysis and visualized by Cytoscape (Figure S3B). Forty nine hub genes were eventually identified after mapping candidate genes to MCODE genes. These hub genes were listed in Table S2. The up-regulation of hub genes in tumors was confirmed by independent samples t-test (P < .01, Table S3 & Figure S4). These genes were further performed Kaplan-Meier survival analysis on GEPIA website (http://gepia.cancer-pku.cn/). Twenty four hub genes highly correlated with OS of ccRCC patients were chosen for further analysis (P < .01, Table S3 & Figure S5).
Construction of the gene signature
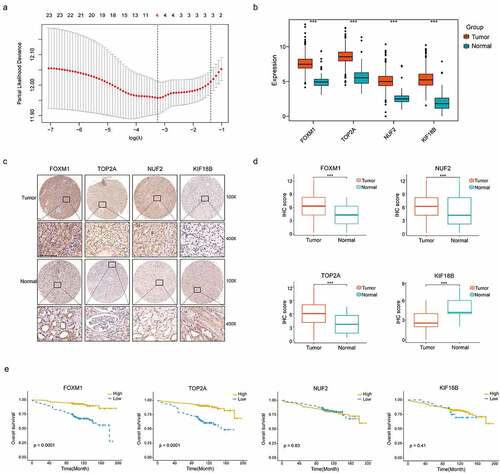
LASSO regression was performed on 24 validated hub genes in discovery set and 4 biomarkers: FOXM1 (Forkhead box M1), TOP2A (DNA Topoisomerase IIα), KIF18B (Kinesin Family member 18B), NUF2 (NUF2 component of NDC80 kinetochore complex) were preserved when the tuning parameter (λ) was minimized to 0.038 and log(λ) was −3.25 (). Immuno-staining of these genes was performed on TMA containing 348 ccRCC tumors and peritumor tissues from our institution. Detailed information of patients in the TMA is shown in . The representative images of four genes expressed in tumors and peritumor tissues are shown in . The result showed all genes were significantly upregulated in tumors from TCGA cohort (P < .001) (), IHC staining revealed protein levels of FOXM1, TOP2A and NUF2 were significantly higher in tumors compared with peritumor tissues (P < .001). While the protein level of KIF18B was reversely upregulated in peritumor tissues (P < .001)(). Furthermore, survival analysis showed that high expressions of FOXM1 and TOP2A were significantly correlated with shortened OS in the TMA cohort (P < .001, ). Finally, TOP2A and FOXM1 were incorporated into the Cox proportional hazard model and risk score = (0.693 FOXM1 expression) + (−0.18
TOP2A expression). According to the median of risk score, patients were divided into high- and low-risk groups.
Table 1. Clinical and pathologic features of 348 ccRCC patients in TMA cohort
Figure 3. Construction of the gene signature. (a) 10-time cross validation for tuning parameter selection by LASSO regression. The solid vertical lines are partial likelihood deviance ± standard error (SE). The dotted vertical lines are drawn at the optimal values by minimum criteria and 1-SE criteria (b) Expression levels of 4 selected genes between tumors and peritumor tissues in TCGA database (c) Representative immunostaining pictures of 4 selected genes. Staining of FOXM1, TOP2A and KIF18B are mainly located in the nuclei as well as cytoplasm, staining of NUF2 are mainly located in the cytoplasm. The upper half comprises images of tumors, images of adjacent normal tissues were at the bottom half. Scale bar: 100 μm. (d) Expression levels of 4 selected genes between tumors and peritumor tissues in the TMA cohort. (e) Kaplan–Meier survival analysis of 4 selected genes in the TMA cohort. ***P < .001
Validation of the gene signature
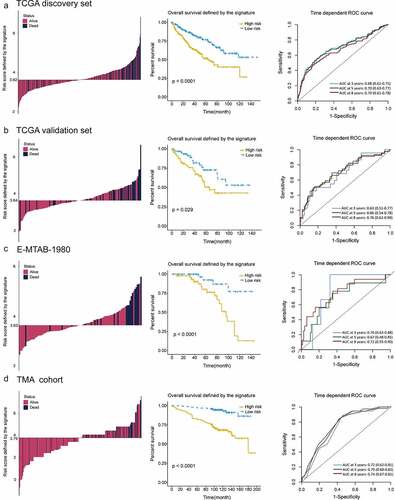
To evaluate the predictive abilities of our signature, we performed Kaplan-Meier survival and time dependent ROC analysis in discovery (n = 398), internal (n = 133) and two external validation sets (E-MTAB-1980, n = 101; TMA cohort, n = 348). In discovery set, high-risk group comprised more death cases than low-risk group (, left panel). The survival rate of patients in high-risk group was significantly lower than those in low-risk group (P < .0001, , middle panel). The predictive accuracy of this signature was 0.68, 0.70 and 0.70 at 3,5 and 8 years (, right panel). In accordance with the results in discovery set, a lower survival rate was observed in high-risk group, both in internal validation set (P = .029, , middle panel) and two external validation sets (P < .0001, , middle panel; P < .0001, , middle panel). In internal validation set, the predictive accuracy of the gene signature was 0.63, 0.66 and 0.76 at 3, 5 and 8 years (, right panel). In external validation sets, this signature also had a good performance in predictive accuracy (AUC: 0.76, 0.67 and 0.72 at 3, 5 and 8 years, , right panel; AUC: 0.72, 0.75 and 0.74 at 3, 5 and 8 years, , right panel).
Figure 4. Distribution of risk score, Kaplan–Meier survival analysis, time-dependent ROC curves at 3, 5, and 8 years between patients at high- and low-risk in TCGA discovery set (a), TCGA validation set (b), E-MTAB-1980 (c) and TMA cohort (d)
High-risk group correlates with higher tumor grade and advanced pathologic stage
Significant differences were found between high- and low-risk groups in tumor grade and pathologic stage. High-risk group comprised more high-grade tumors (G3&G4) than low-risk group (62.5% vs. 45.0% in TCGA cohort, P < .001; 66.7% vs. 17.9% in combined GEO cohort, P < .001; 36.0% vs. 18.4% in E-MTAB-1980 cohort, P = .049; 28.2% vs. 6.9% in TMA cohort, P < .001; ). With respect to the distribution of pathologic stage, patients in high-risk group also underwent significant upstaging compared with those in low-risk group (49.8% vs. 28.2% in TCGA cohort, P < .001; 66.7% vs. 33.3% in combined GEO cohort, P = .032; 39.2% vs. 10.0% in E-MTAB-1980 cohort, P < .001; 8.6% vs. 1.1% in TMA cohort, P < .001; ).
Figure 5. High correlations of the gene signature with tumor grade and pathologic stage followed by functional analysis of signature genes. (a) Distribution of G1&G2 and G3&G4 tumors between high- and low-risk group in TCGA, combined GEO (GSE66272 & GSE36895), E-MTAB-1980 and TMA cohort. (b) Distribution of stage I/II and III/IV tumors between high- and low-risk group in TCGA, combined GEO (GSE66272 & GSE36895), E-MTAB-1980 and TMA cohort. (c) Representative immunostaining pictures of FOXM1 and TOP2A between different tumor grade. Scale bar: 100 μm. Top 3 gene sets enriched in the high-expression group of signature genes (d) FOXM1 (e) TOP2A. Clustering heatmaps of differentially enriched pathways for signature genes based on GSVA. (f) FOXM1 (g) TOP2A. χ2 test was used to test difference in distribution of tumor grade and pathologic stage, *P < .05.**P < .01.***P < .001
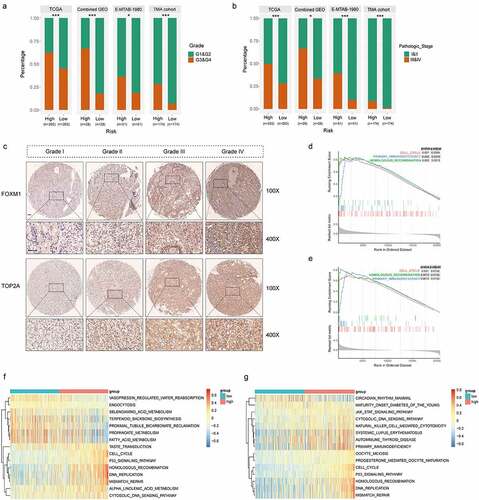
Relationships between clinicopathologic features and TOP2A/FOXM1 expressions were also investigated respectively in the TMA cohort. The results indicated that expression of FOXM1 was correlated with age (P = .012), AJCC stage (P = .015), grade (P < .001), tumor size (P < .001) and necrosis (P = .003), expression of TOP2A was correlated with grade (P < .001), tumor size (P = .002) and necrosis (P < .001) (). Representative pictures depicted correlations between TOP2A/FOXM1 expressions and tumor grade is shown in , the staining intensities of TOP2A and FOXM1 gradually increased with advancing tumor grade. These results indicate these two genes may be closely related to cell cycle process.
Table 2. Association of TOP2A and FOXM1 expression with clinicopathologic factors of ccRCC patients in TMA cohort
GSEA and GSVA confirm the high correlation between signature genes and cell cycle procession in ccRCC
To reveal the underlying mechanism of TOP2A and FOXM1 in ccRCC progression, we performed GSEA and GSVA on RNA-seq data of TCGA cohort. Top three significantly enriched pathways are demonstrated in . Genes in high expression groups of TOP2A and FOXM1 were all enriched in “Cell cycle” and “Homologous recombination”. GSVA confirmed that gene sets of “Cell cycle”, “Homologous recombination”, “DNA replication” and “Mismatch repair” were significantly upregulated in the high expression group of signature genes (). Moreover, high-risk group has significant upregulation of cell cycle pathways, for example, “G2M checkpoint”, “E2F targets”, “Mitotic spindle” and “MYC targets” (Figure S6). Thus, ccRCC in high-risk group presents upregulated cell cycle procession which might contribute to the hyperproliferation of tumor cells and dismal outcomes.
Immune landscape between high- and low-risk ccRCC
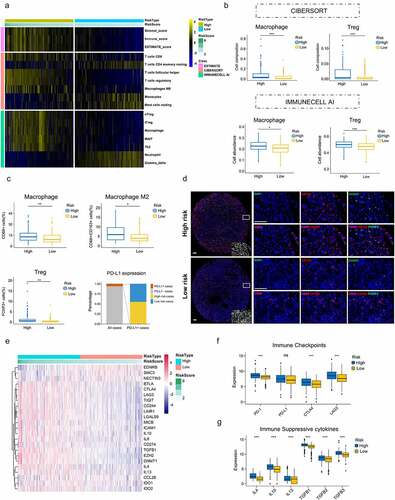
To evaluated whether this cell cycle-related signature could reflect the tumor immune microenvironment, we estimated the infiltration of immune cells in ccRCC through ESTIMATE, CIBERSORT and IMMUNECELL AI, three independent algorithms. ESTIMATE score and immune cell types which were differentially infiltrated between low- and high-risk groups were presented in . High-risk group with significantly higher immune_score indicated more immune cells infiltration (P < .001). Moreover, high-risk tumors contained higher level of immune suppressive cells (T follicular helper cells, regulatory T cells (Tregs), Macrophages, ect). By comparing the results of CIBERSORT and IMMUNECELL AI, regulatory T cells (Tregs) and Macrophages were both significantly upregulated in high-risk group (), which indicated an immunosuppressive phenotype might exist in those tumors.
Figure 6. Immunosuppressive phenotype exists in high-risk tumors. (a) Results of ESTIMATE score and differentially infiltrated immune cells evaluated by CIBERSORT and IMMUNECELL AI between high- and low-risk group in TCGA. (b) Relative cell abundance of Macrophage and Treg calculated by CIBERSORT and IMMUNECELL AI between two groups in TCGA. (c) Cell percentage of CD68+ Macrophage, CD68+ CD163+ Macrophage M2, FOXP3+ Treg and PD-L1 expression in tumors detected by mIHC in the TMA cohort. (d) Representative immunofluorescence staining pictures of high- and low-risk tumors. DAPI (blue), CD68 (purple), CD163 (red), FOXP3 (green). (e) Differentially expressed genes profile involved in the negative regulation of the Cancer-Immunity Cycle between high- and low-risk group. (f) Expression of the common immune checkpoints between high- and low-risk group. (g) Expression of the immune suppressive cytokines between high- and low-risk group. *P < .05.**P < .01.***P < .001
High-risk tumors show immunosuppressive phenotype
To confirm the immune cell abundance inferred by two algorithms, we performed mIHC on TMA to identify infiltrations of Macrophages and Tregs in ccRCC. In accordance with the immune infiltration analysis, proportions of Macrophages (CD68+) infiltrated in high-risk tumors were significantly higher than those in low-risk group (P = .0035). FOXP3+ Tregs also presented the same trend (P = .005). Moreover, M2 Macrophages (CD68+ CD163+) were also markedly increased in high-risk group (P = .015)(). Representative immunofluorescence staining pictures of high- and low-risk tumors were showed in . These results further validated more immune suppressive cells infiltrated in high-risk tumors. In addition, PD-L1 expression was also detected in the TMA. PD-L1 positive tumors (PD-L1 positive cell >1%) accounted for 5.9% of all tumors and there was no difference in PD-L1 expression between high- and low-risk tumors (11 positive tumors vs. 9 positive tumors) ().
To further validate the immunosuppressive phenotype, we investigated immune molecules which negatively regulated the anti-tumor immune response. Expression data of genes negatively regulating The Cancer-Immunity Cycle were download from Tracking Tumor Immunophenotype website (http://biocc.hrbmu.edu.cn/) and analyzed between high- and low-risk groups.Citation31,Citation32 The results showed that genes involved in the negative regulation of the Cancer-Immunity Cycle were essentially upregulated in high-risk group, indicating high-risk patients have low activities of antitumor immune processes (). Common immune checkpoints, such as PD-1, PD-L1, CTLA-4 and LAG3, were compared between two groups. The results showed that PD-1, CTLA-4 and LAG3 were significantly overexpressed in high-risk group compared to the counterpart (P < .001)(). Chemokines involved in immunosuppressive process induced by Macrophages and Tregs (IL-4, IL-10, IL-13, TGF-β) were also significantly upregulated in high-risk group (P < .001)().Citation33–35 These data suggest high-risk patients exhibit inertia in antitumor immunities, which might contribute to their poor prognosis.
Low-risk patients are associated with increased response to anti-PD-1 immunotherapy
In light of the correlation between our signature and immunologic activity in ccRCC, we next investigated whether there was a correlation between the signature and immunotherapy response. 156 advanced ccRCC patients treated with nivolumab (anti-PD-1 agent) were retrieved for analysis.Citation28 Patients classified into clinical benefit (CB), intermediate clinical benefit (ICB) and no clinical benefit (NCB) groups were 53, 44 and 59, respectively. Distribution of high- and low-risk patients among three groups was shown in . ICB patients were included into the CB group for subsequent analysis. The results showed low-risk patients were enriched in CB versus NCB group (57.7% vs. 37.3%, P = .013, ). Meanwhile, significantly prolonged progression-free survival (PFS) was observed in low-risk patients compared to high-risk ones (P = .0031, ).
Figure 7. Increased response to anti-PD-1 immunotherapy exists in low-risk tumors. (a) Risk group and response to anti-PD-1 therapy by sample. (b) Proportion of low-risk tumors in CB versus NCB group. Error bars are standard errors, which were calculated as follows: p(1 − p)/n, where p is the proportion in the population and n is the sample size. (c) PFS in high- and low-risk patients with advanced ccRCC. (d) PD-L1 expression between CB and NCB group (e) Proportion of PBRM1 LOF tumors in CB versus NCB group (f) Tumor mutation burden between CB and NCB group. χ2 test and independent t-test were used for statistical analysis
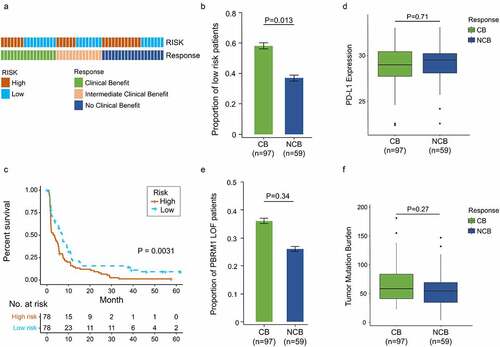
To compare the predictive value of this gene signature and other biomarkers of immunotherapy response, PD-L1, tumor mutation burden (TMB) and PBRM1 (Polybromo 1) mutations were also involved in analysis.Citation28,Citation36–38 There were no differences in PD-L1 expression level and TMB between CB and NCB group (P = .71, ; P = .27, ). PBRM1 mutations were more likely to cluster in CB versus NCB group, but significance was not detected (35.5% vs. 26.3%, P = .34, ). These results indicate our signature has a potent predictive ability in immunotherapy response and better than other recognized biomarkers.
Analysis of somatic variants
Somatic mutations in high- and low-risk ccRCC tumors were also investigated. Differences of mutation landscapes between two groups were depicted in . VHL, PBRM1, TTN, and SETD2 were the most commonly mutated genes (>10% mutation rate) both in high- and low-risk tumors. The mutation rate of BAP1 (BRCA1 associated protein 1) was significantly higher in high-risk group (17% vs. 5%, P < .001)().
Figure 8. Somatic variants between high- and low-risk tumors in TCGA. Top 15 gene mutations in high-risk (a) and low-risk tumors (b). (c) Top 5 differentially mutated genes between high- and low-risk tumors. (d) Proportion of PBRM1 LOF in high- and low-risk tumors. (e) OS of ccRCC patients with PBRM1 LOF and PBRM1 intact. (f) Multivariate analysis of the gene signature and mutation status of PBRM1 (g) OS of ccRCC patients sorted by combined score: PBRM1 LOF and low-risk, 1; PBRM1 LOF and high-risk, PBRM1 intact and low-risk, 2; PBRM1 intact and high-risk, 3. χ2 test was used to test difference in proportions of gene mutation
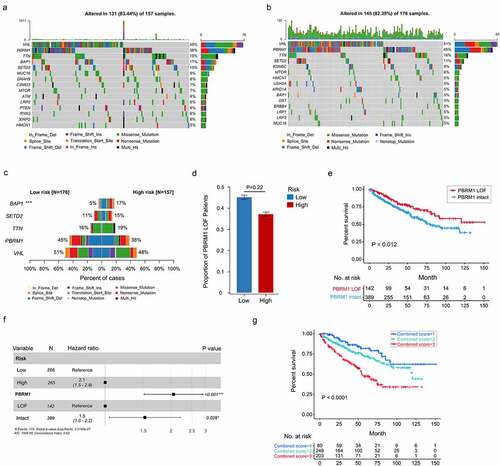
Since PBRM1 loss of function (missense mutation, frameshift deletion, nonsense mutation, splice-site, etc.) was previously reported to correlate with ccRCC survival and response to ICIs,Citation36,Citation39 the correlation between PBRM1 LOF (loss of function) and this cell cycle-related signature was explored. The result showed percentage of PBRM1 LOF was higher in low-risk group, while difference was not significant in statistic (45% vs. 38%, P = .22, ). Patients with PBRM1 LOF were found to have significantly prolonged OS compared to PBRM1 intact ones (P = .012, ). Multivariate Cox regression analysis demonstrated both the cell cycle-related signature and PBRM1 mutation status were independent risk factors of ccRCC survival (). Moreover, combination of PBRM1 mutation status and our signature had an improved risk stratification ability ().
Construction of nomogram predicting OS based on the cell cycle-related signature
According to the rank in descending of risk scores, patients in TMA cohort were identically classified into three groups: high-risk, moderate-risk and low-risk. Kaplan–Meier survival analysis proved that patients at different risks presented distinct prognosis (Figure S7A). Patients were further stratified into subgroups of male and female, age ≤ 65 and ag e> 65 years old, grade I/II and grade III/IV, stage I/II and stage III/IV. Except for the subgroup of stage III/IV (P = .24) and grade III/IV (P = .061), patients in high-risk group showed a better prognosis than those in moderate- and low-risk groups (Figure S7B-I).
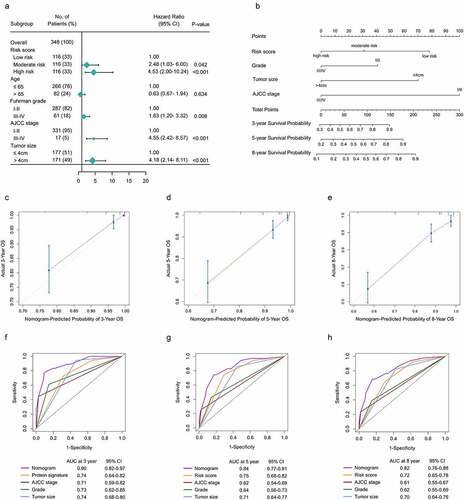
The univariate and multivariate analysis were performed on the signature and clinicopathological factors to construct nomogram. In multivariate analysis, patients at higher risk according to the signature showed significantly shortened OS (moderate-risk: HR = 2.48, P = .042; high-risk: HR = 4.53, P < .001) compared to those at low risk (). The independent prognostic factors: AJCC stage, tumor size and Fuhrman grade were also incorporated into nomogram. A nomogram capable of predicting survival probabilities of ccRCC at 3, 5 and 8 years was finally built (). The C-index of nomogram was 0.81. The calibration curves at 3, 5 and 8 years showed good consistency between actual observation and the prediction by nomogram (). Time-dependent ROC showed that AUC of protein signature was 0.74, 0.75 and 0.72 at 3, 5 and 8 years. All AUCs of the gene signature were better at predicting survival probabilities than clinicopathological factors at each time point. Furthermore, nomogram had an obviously improved predictive accuracy of 0.89, 0.84 and 0.82 at 3, 5 and 8 years ().
Figure 9. Construction f a nomogram predicting OS based on the gene signature in ccRCC. (a) Multivariate analysis in the TMA. (b) Nomogram integrated the gene signature, AJCC stage, grade and tumor size (c-e) Calibration curve for predicting OS at 3, 5 and 8 years. (f-h) Time dependent ROC curves of nomogram, cell cycle-related signature, AJCC stage, grade and tumor size at 3, 5 and 8 years
Discussion
Cell cycle progress plays a crucial role in cell proliferation, the alteration of which has been recognized as the hallmark of oncogenesis.Citation40 Recent studies indicate that cell cycle gene signatures show strong capacities of prognostication in many malignancies and have the potential of evaluating immunogenicity of tumors and their responses to ICIs.Citation41–43 However, such relationship between cell cycle signatures and tumor immune microenvironment (TIME) in ccRCC was not reported before. In present study, we built a gene signature included two cell cycle genes (FOXM1&TOP2A) adopting DEGs from GEO database. The prognostic value of this signature was validated in three ccRCC cohorts: TCGA (n = 531), E-MTAB-1980 (n = 101) and TMA (n = 348) from our institution. Based on the signature, high-risk tumors present more aggressive biological behavior due to the high correlations with higher tumor grade and advanced pathologic stage. Furthermore, an immunosuppressive phenotype exits in high-risk tumors with more infiltrations of Tregs and tumor-associated macrophages (TAMs) accompany by high expressions of genes negatively regulating anti-tumor immune processes. In addition, we found low-risk tumors have an better response to nivolumab (anti-PD-1 agent) and compared to PD-L1, tumor mutation burden (TMB) and PBRM1 mutation, the cell cycle-related signature shows better ability in predicting response to immunotherapy.
In recent years, several gene signatures have been developed to evaluate the prognosis for ccRCC. These signatures containing multiple genes established from RNA-seq or RT-PCR data showed satisfactory predictive abilities, while none of them could utilized in clinical practice due to the high-condition analysis environment or lack of further validations.Citation11,Citation12,Citation44 Detecting protein levels on TMA by IHC is a well-mastered and efficient method which is suitable for all tumor patients undergoing surgical resection. For the purpose of promotion in clinic, we constructed this cell cycle-related signature with good performance both in RNA-seq data (TCGA and E-MTAB-1980) and TMA cohort. Our signature was proved to be the independent risk factor of ccRCC prognosis and a nomogram comprising this signature and clinicopathologic factors showed high AUCs (0.90 and 0.84 at 3 and 5 years) in predicting ccRCC survival outcomes.
Further investigation revealed the association between the cell cycle-related signature and TIME. In accordance with the theory tumor cells confer protection from immune surveillance by hyperactivation of cell cycle,Citation45 high-risk tumors demonstrated a more suppressive immune phenotype due to higher cell abundance of infiltrate Tregs and TAMs. Regulatory T cells (Tregs) are immunosuppressive cells characterized by the expression of the FOXP3.Citation46 Tregs can suppress immune activation via secreting immune suppressive cytokines (IL-10, IL-35, TGF-β), or expressing co-inhibitory molecules such as CTLA-4, PD-1, LAG-3 and TIGIT.Citation47–49 Tumor-associated macrophages (TAMs), presenting an M2-like polarization(anti-inflammatory), are the most abundant leucocyte subset in cancers.Citation50 They are shaped by chemokines such as IL-4, IL10 and IL-13 to impede anti-tumor immunity.Citation33,Citation34 In the present study, CIBERSORT and IMMUNECELL AI were used to infer immune cell infiltrations in ccRCC, Tregs and TAMs are both upregulated in high-risk tumors deduced by two algorithms. We further proved this result by mIHC detection of FOXP3+ Tregs and CD68+ CD163+ Macrophages in the TMA. In addition, cytokines (IL-4, IL-10, IL-13, TGF-β) participating in immunosuppressive process and co-inhibitory checkpoints (CTLA-4, PD-1 and LAG-3) were all upregulated in high-risk group, which validated the immunosuppression induced by Tregs/TAMs exists in high-risk tumors. Our findings show the great potential of our signature in predicting TIME of ccRCC, which might benefit the immunotherapy of such malignancy.
Nowadays, a substantial amount of clinical trials for immunotherapy are conducted across the world, which promotes the utilization of ICIs in ccRCC. Previous studies demonstrated that ccRCC patients could benefit from inhibition of immune checkpoints, such as CTLA-4 and PD-1/PD-L1. However, the response rates (5–12.5% to CTLA-4 inhibitor; 20–27% to PD-1 inhibitor) were relatively lower compared to other solid tumors (lung cancer, melanoma, ect).
Reliable biomarkers for immunotherapy response are desperately needed. Although PD-L1 has been the most promising biomarker of response to ICIs in most malignancies, its predictive value in ccRCC is controversial. Mori et al. reported that patients with PD-L1+ ccRCC tumors derived higher benefit from ICI combinations compared to PD-L1- ones.Citation38 While results from the CHEKMATE-025 trial of nivolumab versus everolimus in refractory mRCC demonstrate improvement in overall survival are consistent regardless of PD-L1 expression.Citation5 TMB also serves as a potent predictor of ICIs response, while ccRCC generally carries low to moderate mutation load, the efficacy of this biomarker in ccRCC need more investigation.Citation51 PBRM1 mutation is the second most common mutation in ccRCC according to TCGA database. PBRM1 LOF (loss of function), the specific biomarker in ccRCC, shows a strong correlation with improved survival in anti-PD-1 therapy. Thus, in present study, we tested the predictive value of PD-L1, TMB, PBRM1 LOF and the cell cycle-related signature in immunotherapy. The results show low-risk tumors according to the signature have improved responses to anti-PD-1 therapy (P = .013). PD-L1 expression and TMB are not associated with the efficacy of immunotherapy. PBRM1 LOF were more likely to cluster in CB than NCB group (35.5% vs. 26.3%, P = .34). Meanwhile, PBRM1 LOF is a protective factor for ccRCC survival. Incorporating PBRM1 LOF could enhance the abilities of risk stratification of our signature. Our study demonstrate this cell cycle-related signature is a promising and potent predictors of immunotherapy response in ccRCC.
Forkhead box M1 (FOXM1) is a transcriptional activator involved in cell proliferation and tumorigenesis. The encoded protein regulates the expression of several cell cycle genes, such as cyclin B1 and cyclin D1.Citation52 Its overexpression has been reported in a diverse range of tumors.Citation53,Citation54 FOXM1 combined with CENPF can synergistically promote the malignant transformation of prostate cells and indicate poor prognosis of prostate cancer.Citation55 TOP2A encodes topoisomerase IIα, a nuclear enzyme that controls DNA topological structure and promotes gene transcription during mitosis.Citation56 Plenty of researches based on GEO or TCGA datasets have proved TOP2A is correlated with tumor progression and poor survival in ccRCC.Citation57–59 Our research confirms the overexpression of TOP2A is associated with shortened OS and higher tumor grade in the TMA for the first time.
There are still some limitations in our research. Firstly, the TMA cohort only contains few patients with higher tumor grade (G3&G4) and pathologic stages (III&IV), which cause the failure in predicting ccRCC prognosis in those subgroups. Thus, data from multicentric cohorts with comprehensive clinical information are needed to confirm our findings. Secondly, although tissues in the TMA were selected from the area of tumor with the highest grade, which might represent the most aggressive subclones, the known intratumor heterogeneity in RCC couldn’t be fully addressed.Citation60 Thirdly, We only selected patients with RNA-seq data to analyze immunotherapy response in ccRCC, this selection bias might cause the inconsistence of PBRM1 LOF predicting abilities.
Overall, we developed a robust gene signature which could predict the prognosis of ccRCC. This signature reveals the close relationship between hyperactivation of cell cycle procession and immunosuppression in ccRCC for the first time. It also demonstrates a strong ability in predicting response to PD-1 blockade. Moreover, a nomogram developed based on the signature with a strong capacity of predicting ccRCC outcomes deserves promotion in clinical practice.
Disclosure of potential conflicts of interest
No potential conflict of interest was reported by the author(s).
Ethics approval and consent to participate
Our study was approved by the Ethics and Research Committees of Renji Hospital, Shanghai Jiao Tong University School of Medicine.
Supplemental Material
Download ()Supplementary material
Supplemental data for this article can be accessed on the publisher’s website.
Additional information
Funding
References
- Hsieh JJ, Purdue MP, Signoretti S, Swanton C, Albiges L, Schmidinger M, Heng DY, Larkin J, Ficarra V. Renal cell carcinoma. Nat Rev Dis Primers. 2017;3(1):17009. doi:10.1038/nrdp.2017.9.
- Ljungberg B, Bensalah K, Canfield S, Dabestani S, Hofmann F, Hora M, Kuczyk MA, Lam T, Marconi L, Merseburger AS, et al. EAU guidelines on renal cell carcinoma: 2014 update. Eur Urol. 2015;67(5):913–16. doi:10.1016/j.eururo.2015.01.005.
- MacLennan S, Imamura M, Lapitan MC, Omar MI, Lam TBL, Hilvano-Cabungcal AM, Royle P, Stewart F, MacLennan G, MacLennan SJ, et al. Systematic review of oncological outcomes following surgical management of localised renal cancer. Eur Urol. 2012;61(5):972–993. doi:10.1016/j.eururo.2012.02.039.
- Speed JM, Trinh QD, Choueiri TK, Sun M. Recurrence in localized renal cell carcinoma: a systematic review of contemporary data. Curr Urol Rep. 2017;18(2):15. doi:10.1007/s11934-017-0661-3.
- Motzer RJ, Escudier B, McDermott DF, George S, Hammers HJ, Srinivas S, Tykodi SS, Sosman JA, Procopio G, Plimack ER, et al. Nivolumab versus everolimus in advanced renal-cell carcinoma. N Engl J Med. 2015;373(19):1803–1813. doi:10.1056/NEJMoa1510665.
- Rini BI, Plimack ER, Stus V, Gafanov R, Hawkins R, Nosov D, Pouliot F, Alekseev B, Soulières D, Melichar B, et al. Pembrolizumab plus Axitinib versus sunitinib for advanced renal-cell carcinoma. N Engl J Med. 2019;380(12):1116–1127. doi:10.1056/NEJMoa1816714.
- Motzer RJ, Penkov K, Haanen J, Rini B, Albiges L, Campbell MT, Venugopal B, Kollmannsberger C, Negrier S, Uemura M, et al. Avelumab plus Axitinib versus sunitinib for advanced renal-cell carcinoma. N Engl J Med. 2019;380(12):1103–1115. doi:10.1056/NEJMoa1816047.
- Simonaggio A, Epaillard N, Pobel C, Moreira M, Oudard S, Vano YA. Tumor microenvironment features as predictive biomarkers of response to immune checkpoint inhibitors (ICI) in metastatic clear cell renal cell carcinoma (mccRCC). Cancers (Basel). 2021;13(2):231. doi:10.3390/cancers13020231.
- Zhu N, Hou J. Assessing immune infiltration and the tumor microenvironment for the diagnosis and prognosis of sarcoma. Cancer Cell Int. 2020;20(1):577. doi:10.1186/s12935-020-01672-3.
- Miller TJ, Anyaegbu CC, Lee-Pullen TF, Spalding LJ, Platell CF, McCoy MJ. PD-L1+ dendritic cells in the tumor microenvironment correlate with good prognosis and CD8+ T cell infiltration in colon cancer. Cancer Sci. 2021;112(3):1173–1183. doi:10.1111/cas.14781.
- Brooks SA, Brannon AR, Parker JS, Fisher JC, Sen O, Kattan MW, Hakimi AA, Hsieh JJ, Choueiri TK, Tamboli P, et al. ClearCode34: a prognostic risk predictor for localized clear cell renal cell carcinoma. Eur Urol. 2014;66(1):77–84. doi:10.1016/j.eururo.2014.02.035.
- Rini B, Goddard A, Knezevic D, Maddala T, Zhou M, Aydin H, Campbell S, Elson P, Koscielny S, Lopatin M, et al. A 16-gene assay to predict recurrence after surgery in localised renal cell carcinoma: development and validation studies. Lancet Oncol. 2015;16(6):676–685. doi:10.1016/S1470-2045(15)70167-1.
- Helmink BA, Reddy SM, Gao J, Zhang S, Basar R, Thakur R, Yizhak K, Sade-Feldman M, Blando J, Han G, et al. B cells and tertiary lymphoid structures promote immunotherapy response. Nature. 2020;577(7791):549–555. doi:10.1038/s41586-019-1922-8.
- Gautier L, Cope L, Bolstad BM, Irizarry RA. affy - analysis of Affymetrix GeneChip data at the probe level. Bioinformatics. 2004;20(3):307–315. doi:10.1093/bioinformatics/btg405.
- Carvalho BS, Irizarry RA. A framework for oligonucleotide microarray preprocessing. Bioinformatics. 2010;26(19):2363–2367. doi:10.1093/bioinformatics/btq431.
- Ritchie ME, Phipson B, Wu D, Hu Y, Law CW, Shi W, Smyth GK. limma powers differential expression analyses for RNA-sequencing and microarray studies. Nucleic Acids Res. 2015;43(7):e47. doi:10.1093/nar/gkv007.
- Kolde R, Laur S, Adler P, Vilo J. Robust rank aggregation for gene list integration and meta-analysis. Bioinformatics. 2012;28(4):573–580. doi:10.1093/bioinformatics/btr709.
- Zhang B, Horvath S. A general framework for weighted gene co-expression network analysis. Stat Appl Genet Mol Biol. 2005;4(1). doi:10.2202/1544-6115.1128.
- Yin X, Wang J, Zhang J. Identification of biomarkers of chromophobe renal cell carcinoma by weighted gene co-expression network analysis. Cancer Cell Int. 2018;18(1):206. doi:10.1186/s12935-018-0703-z.
- Gui J, Li H. Penalized Cox regression analysis in the high-dimensional and low-sample size settings, with applications to microarray gene expression data. Bioinformatics. 2005;21(13):3001–3008. doi:10.1093/bioinformatics/bti422.
- Yu GC, Wang LG, Han YY, He QY. clusterProfiler: an R package for comparing biological themes among gene clusters. OMICS. 2012;16(5):284–287. doi:10.1089/omi.2011.0118.
- Hanzelmann S, Castelo R, Guinney J. GSVA: gene set variation analysis for microarray and RNA-seq data. BMC Bioinform. 2013;14(1):7. doi:10.1186/1471-2105-14-7.
- Newman AM, Liu CL, Green MR, Gentles AJ, Feng W, Xu Y, Hoang CD, Diehn M, Alizadeh AA. Robust enumeration of cell subsets from tissue expression profiles. Nat Methods. 2015;12(5):453-+. doi:10.1038/nmeth.3337.
- Miao YR, Zhang Q, Lei Q, Luo M, Xie G-Y, Wang H, Guo A-Y. ImmuCellAI: a unique method for comprehensive T-cell subsets abundance prediction and its application in cancer immunotherapy. Adv Sci (Weinh). 2020;7(7):1902880. doi:10.1002/advs.201902880.
- Yoshihara K, Shahmoradgoli M, Martinez E, Vegesna R, Kim H, Torres-Garcia W, Treviño V, Shen H, Laird PW, Levine DA, et al. Inferring tumour purity and stromal and immune cell admixture from expression data. Nat Commun. 2013;4(1):2612. doi:10.1038/ncomms3612.
- Schreiber RD, Old LJ, Smyth MJ. Cancer immunoediting: integrating immunity’s roles in cancer suppression and promotion. Science. 2011;331(6024):1565–1570. doi:10.1126/science.1203486.
- Charoentong P, Finotello F, Angelova M, Mayer C, Efremova M, Rieder D, Hackl H, Trajanoski Z. Pan-cancer immunogenomic analyses reveal genotype-immunophenotype relationships and predictors of response to checkpoint blockade. Cell Rep. 2017;18(1):248–262. doi:10.1016/j.celrep.2016.12.019.
- Braun DA, Hou Y, Bakouny Z, Ficial M, Sant’ Angelo M, Forman J, Ross-Macdonald P, Berger AC, Jegede OA, Elagina L, et al. Interplay of somatic alterations and immune infiltration modulates response to PD-1 blockade in advanced clear cell renal cell carcinoma. Nat Med. 2020;26(6):909–918. doi:10.1038/s41591-020-0839-y.
- Motzer RJ, Rini BI, McDermott DF, Redman BG, Kuzel TM, Harrison MR, Vaishampayan UN, Drabkin HA, George S, Logan TF, et al. Nivolumab for metastatic renal cell carcinoma: results of a randomized Phase II trial. J Clin Oncol. 2015;33(13):1430–1437. doi:10.1200/JCO.2014.59.0703.
- Yuan L, Zeng G, Chen L, Wang G, Wang X, Cao X, Lu M, Liu X, Qian G, Xiao Y, et al. Identification of key genes and pathways in human clear cell renal cell carcinoma (ccRCC) by co-expression analysis. Int J Biol Sci. 2018;14(3):266–279. doi:10.7150/ijbs.23574.
- Chen DS, Mellman I. Oncology meets immunology: the cancer-immunity cycle. Immunity. 2013;39(1):1–10. doi:10.1016/j.immuni.2013.07.012.
- Xu L, Deng CY, Pang B, Zhang X, Liu W, Liao G, Yuan H, Cheng P, Li F, Long Z, et al. TIP: a web server for resolving tumor immunophenotype profiling. Cancer Res. 2018;78(23):6575–6580. doi:10.1158/0008-5472.CAN-18-0689.
- Zhu ZY, Zhang HB, Chen BD, Liu X, Zhang S, Zong Z, Gao M. PD-L1-mediated immunosuppression in glioblastoma is associated with the infiltration and M2-polarization of tumor-associated macrophages. Front Immunol. 2020;11. doi:10.3389/fimmu.2020.588552.
- Cheng H, Wang Z, Fu L, Xu T. Macrophage polarization in the development and progression of ovarian cancers: an overview. Front Oncol. 2019;9:421. doi:10.3389/fonc.2019.00421.
- Carambia A, Freund B, Schwinge D, Heine M, Laschtowitz A, Huber S, Wraith DC, Korn T, Schramm C, Lohse AW, et al. TGF-β-dependent induction of CD4+CD25+Foxp3+ Tregs by liver sinusoidal endothelial cells. J Hepatol. 2014;61(3):594–599. doi:10.1016/j.jhep.2014.04.027.
- Miao D, Margolis CA, Gao W, Voss MH, Li W, Martini DJ, Norton C, Bossé D, Wankowicz SM, Cullen D, et al. Genomic correlates of response to immune checkpoint therapies in clear cell renal cell carcinoma. Science. 2018;359(6377):801–806. doi:10.1126/science.aan5951.
- Zhang C, Li Z, Qi F, Hu X, Luo J. Exploration of the relationships between tumor mutation burden with immune infiltrates in clear cell renal cell carcinoma. Ann Transl Med. 2019;7(22):648. doi:10.21037/atm.2019.10.84.
- Mori K, Abufaraj M, Mostafaei H, Quhal F, Fajkovic H, Remzi M, Karakiewicz PI, Egawa S, Schmidinger M, Shariat SF, et al. The predictive value of programmed death ligand 1 in patients with metastatic renal cell carcinoma treated with immune-checkpoint inhibitors: a systematic review and meta-analysis. Eur Urol. 2021;79(6):783–792. doi:10.1016/j.eururo.2020.10.006
- Braun DA, Ishii Y, Walsh AM, Van Allen EM, Wu CJ, Shukla SA, Choueiri TK. Clinical validation of PBRM1 alterations as a marker of immune checkpoint inhibitor response in renal cell carcinoma. Jama Oncol. 2019;5(11):1631–1633. doi:10.1001/jamaoncol.2019.3158.
- Hanahan D, Weinberg RA. The hallmarks of cancer. Cell. 2000;100(1):57–70. doi:10.1016/S0092-8674(00)81683-9.
- Shi R, Bao X, Rogowski P, Schäfer C, Schmidt-Hegemann N-S, Unger K, Lu S, Sun J, Buchner A, Stief C, et al. Establishment and validation of an individualized cell cycle process-related gene signature to predict cancer-specific survival in patients with bladder cancer. Cancers (Basel). 2020;12(5):1146. doi:10.3390/cancers12051146.
- Oshi M, Takahashi H, Tokumaru Y, Yan L, Rashid OM, Matsuyama R, Endo I, Takabe K. G2M cell cycle pathway score as a prognostic biomarker of metastasis in Estrogen Receptor (ER)-positive breast cancer. Int J Mol Sci. 2020;21(8):2921. doi:10.3390/ijms21082921
- Petroni G, Formenti SC, Chen-Kiang S, Galluzzi L. Immunomodulation by anticancer cell cycle inhibitors. Nat Rev Immunol. 2020;20(11):669–679. doi:10.1038/s41577-020-0300-y.
- Chen L, Luo Y, Wang G, Qian K, Qian G, Wu C-L, Dan HC, Wang X, Xiao Y. Prognostic value of a gene signature in clear cell renal cell carcinoma. J Cell Physiol. 2019;234(7):10324–10335. doi:10.1002/jcp.27700.
- Li J, Stanger BZ. Cell cycle regulation meets tumor immunosuppression. Trends Immunol. 2020;41(10):859–863. doi:10.1016/j.it.2020.07.010.
- Cheng H, Wang L, Yang B, Li D, Wang X, Liu X, Tian N, Huang Q, Feng R, Wang Z, et al. Cutting edge: inhibition of glycogen synthase kinase 3 activity induces the generation and enhanced suppressive function of human IL-10+FOXP3+ –induced regulatory T Cells. J Immunol. 2020;205(6):1497–1502. doi:10.4049/jimmunol.2000136.
- Josefowicz SZ, Lu LF, Rudensky AY. Regulatory T cells: mechanisms of differentiation and function. Annu Rev Immunol. 2012;30(1):531–564. doi:10.1146/annurev.immunol.25.022106.141623.
- Kumar P, Bhattacharya P, Prabhakar BS. A comprehensive review on the role of co-signaling receptors and Treg homeostasis in autoimmunity and tumor immunity. J Autoimmun. 2018;95:77–99.
- Schmidt A, Oberle N, Krammer PH. Molecular mechanisms of treg-mediated T cell suppression. Front Immunol. 2012;3:51. doi:10.3389/fimmu.2012.00051.
- Belgiovine C, Digifico E, Anfray C, Ummarino A, Andon FT. Targeting tumor-associated macrophages in anti-cancer therapies: convincing the traitors to do the right thing. J Clin Med. 2020;9(10):3226. doi:10.3390/jcm9103226.
- Alexandrov LB, Nik-Zainal S, Wedge DC, Aparicio SAJR, Behjati S, Biankin AV, Bignell GR, Bolli N, Borg A, Børresen-Dale A-L, et al. Signatures of mutational processes in human cancer. Nature. 2013;500(7463):415–421. doi:10.1038/nature12477.
- Bella L, Zona S, Nestal De Moraes G, Lam EW. FOXM1: a key oncofoetal transcription factor in health and disease. Semin Cancer Biol. 2014;29:32–39. doi:10.1016/j.semcancer.2014.07.008.
- Lam EW, Brosens JJ, Gomes AR, Koo CY. Forkhead box proteins: tuning forks for transcriptional harmony. Nat Rev Cancer. 2013;13(7):482–495. doi:10.1038/nrc3539.
- Barger CJ, Branick C, Chee L, Karpf AR. Pan-cancer analyses reveal genomic features of FOXM1 overexpression in cancer. Cancers (Basel). 2019;11(2):251. doi:10.3390/cancers11020251.
- Aytes A, Mitrofanova A, Lefebvre C, Alvarez M, Castillo-Martin M, Zheng T, Eastham J, Gopalan A, Pienta K, Shen M, et al. Cross-species regulatory network analysis identifies a synergistic interaction between FOXM1 and CENPF that drives prostate cancer malignancy. Cancer Cell. 2014;25(5):638–651. doi:10.1016/j.ccr.2014.03.017.
- Wu KZL, Wang GN, Fitzgerald J, Quachthithu H, Rainey MD, Cattaneo A, Bachi A, Santocanale C. DDK dependent regulation of TOP2A at centromeres revealed by a chemical genetics approach. Nucleic Acids Res. 2016;44(18):8786–8798. doi:10.1093/nar/gkw626.
- Luo YW, Shen DX, Chen L, Wang G, Liu X, Qian K, Xiao Y, Wang X, Ju L. Identification of 9 key genes and small molecule drugs in clear cell renal cell carcinoma. Aging (Albany NY). 2019;11(16):6029–6052. doi:10.18632/aging.102161.
- Chen L, Yuan L, Qian K, Qian G, Zhu Y, Wu C-L, Dan HC, Xiao Y, Wang X. Identification of biomarkers associated with pathological stage and prognosis of clear cell renal cell carcinoma by co-expression network analysis. Front Physiol. 2018;9:399. doi:10.3389/fphys.2018.00399.
- Yuan LS, Chen L, Qian KY, Qian G, Wu C-L, Wang X, Xiao Y. Co-expression network analysis identified six hub genes in association with progression and prognosis in human clear cell renal cell carcinoma (ccRCC). Genomics Data. 2017;14:132–140. doi:10.1016/j.gdata.2017.10.006.
- Gerlinger M, Rowan AJ, Horswell S, Larkin J, Endesfelder D, Gronroos E, Martinez P, Matthews N, Stewart A, Tarpey P, et al. Intratumor heterogeneity and branched evolution revealed by multiregion sequencing. New Engl J Med. 2012;366(10):883–892. doi:10.1056/NEJMoa1113205.