
ABSTRACT
Metastasis and immune suppression account for the poor prognosis of oral squamous cell carcinoma (OSCC). YKT6 is a member of the soluble NSF attachment protein receptor (SNARE) family, and the effect of YKT6 in OSCC remains elusive. The purpose of this study was to explore promising prognostic and immune therapeutic candidate biomarkers for OSCC and to understand the expression pattern, prognostic value, immune effects, and biological functions of YKT6. Genes correlated with tumor metastasis and CD8 + T cell levels were identified by weighted gene coexpression network analysis (WGCNA). Next, YKT6 was analyzed through differential expression, prognostic and machine learning analyses. The molecular and immune characteristics of YKT6 were analyzed in independent cohorts, clinical specimens, and in vitro. In addition, we investigated the role of YKT6 at the pan-cancer level. The results suggested that the red module in WGCNA, as a hub module, was associated with lymph node (LN) metastasis and CD8 + T cell infiltration. Upregulation of YKT6 was found in OSCC and linked to adverse prognosis. A nomogram model containing YKT6 expression and tumor stage was constructed for clinical practice. The aggressive and immune-inhibitory phenotypes showed YKT6 overexpression, and the effect of YKT6 on OSCC cell invasion and metastasis in vitro was observed. Moreover, the low expression of YKT6 was correlated with high CD8 + T cell levels and potential immunotherapy response in OSCC. Similar results were found at the pan-cancer level. In total, YKT6 is a promising candidate biomarker for prognosis, molecular, and immune characteristics in OSCC.
Introduction
Head and neck squamous cell carcinoma (HNSCC) is one of the most fatal cancers worldwide. OSCC is the most common subtype of HNSCC and is characterized by high rates of metastasis and recurrence and resistance to traditional chemotherapy; in addition, there are more than 350,000 cases and 170,000 deaths from OSCC per year.Citation1,Citation2 Although comprehensive and multidisciplinary therapeutic approaches have been developed, the long-term survival rate of patients with OSCC, especially of those with lymph node metastasis, is still dismal.Citation3 It is essential to determine the etiology and mechanisms of OSCC malignant progression and explore more effective treatment strategies.
Tumor immunotherapy is viewed as a promising cancer therapeutic modality for recurrent or metastatic cancer. The immune checkpoint blockade (ICB) has shown durable responses and improved clinical outcomes for patients across a broad range of solid tumor types.Citation4 In 2016, the anti-PD-1 antibodies pembrolizumab and nivolumab were approved by the FDA to treat metastatic and recurrent HNSCC.Citation5,Citation6 However, the objective response rate to and survival benefit from ICBs remain low,Citation7 and OSCC generally has the lowest immune cell infiltration level in HNSCC.Citation8 CD8 + T cells, a main subpopulation of cytotoxic T lymphocytes, are primarily responsible for the elimination of tumor cells.Citation9 The infiltration density and activity of CD8 + T cells have been demonstrated to be not only predictive of the response to ICBs,Citation10 but also independent prognostic markers for OSCC.Citation11 In different stages and subtypes of HNSCC/OSCC, the quantity and functional characteristics of CD8 + T cells may vary strikingly.Citation12–14 Disruption of the antigen-presenting process, complex interactions between components in the tumor microenvironment (TME), alteration of tumor cell phenotypes due to epithelial-to-mesenchymal transition (EMT), and exploitation of immunosuppressive factors such as immune checkpoints account for the decreased infiltration and dysfunction of CD8 + T cells in OSCC, which results in immune evasion and poor prognosis of patients.Citation8 Papers have reported biomarkers regarding immunotherapy and prognosis in OSCC,Citation15–18 but only a few biomarkers have been validated and supported by adequate data. Moreover, little is known about the link between intrinsic cancer-related molecular elements and the extrinsic landscape involving the TME.
In this study, we aimed to explore the underlying prognostic and immunotherapeutic biomarkers and their biological functions in OSCC. YKT6 (YKT6 V-SNARE Homolog) was identified and determined to be a gene of interest. As a protein highly conserved from yeast to humans, YKT6 has been found to be implicated in membrane fusion and vesicular transport both inside and outside the Golgi.Citation19 YKT6 has also been reported to be required for exosome secretion and to have an adverse impact on survival for patients with non-small-cell lung cancer.Citation20,Citation21 In addition, the function of YKT6 in the fusion of autophagosomes with lysosomes has received substantial attention.Citation22 Breast cancer studies have suggested that YKT6 is overexpressed in samples with an invasive phenotype and promotes leucine uptake and cell proliferation, conferring resistance to drugs.Citation23–25 Our present study sheds light on the critical role of YKT6 in promoting invasion and metastasis in vitro and reflecting aberrant immune status, including dysfunction and exclusion of CD8 + T cells, in OSCC. Therefore, YKT6 could serve as a new therapeutic target and a potential immune therapeutic and prognostic biomarker for OSCC.
Materials and methods
Clinical specimens and ethics statement
Twenty-eight OSCC tissues, including the corresponding adjacent non-tumor tissues, LN tissues with/without tumor metastasis, and two identical sets of tissue microarray chips (defined as tissue microarray chip 1; each chip contained 55 OSCC tissue dots, 48 of which could be used for further analysis) were collected from Stomatological Hospital of Shandong University (Table S1). Another two identical sets of tissue microarray chips (defined as tissue microarray chip 2) were obtained from Shanghai Qutdo Biotech Company, and each chip comprised 47 OSCC tissue dots, 35 of which could be utilized for further analysis. These samples were collected from Taizhou Hospital (Table S1). The study protocol was approved by the Shandong University Research Ethics Committee and Taizhou Hospital Ethics Committee/Shanghai Qutdo Biotech Company Ethics Committee. All experiments were performed in compliance with the relevant regulations, and all patients provided written informed consent.
HNSCC/OSCC data collection, preprocessing, and differentially expressed gene (DEG) analysis
Gene expression and clinical annotation data from GSE78060, GSE13601, GSE41613, GSE42743, and GSE30784 of the Gene-Expression Omnibus (GEO) database were downloaded. The data preprocessing methods were previously reported.Citation3 HNSCC single-cell RNA-sequence data of GSE103322 was obtained from the Tumor Immune Single-cell Hub (TISCH) database. As for data in The Cancer Genome Atlas (TCGA), RNA-sequence (level 3), clinical profiles and DNA methylation data were downloaded from UCSC Xena browser, UALCAN, TIMER2, and MEXPRESS databases. Somatic mutation and copy number variation (CNV) data of patients in the TCGA-HNSCC cohort were obtained from the GDC portal and cBioPortal pan-cancer atlas. The gene expression data (FPKM normalized) were transformed into log2 (TPM) values. Tumor mutation burden (TMB) was estimated as previously described.Citation26 Because the tumor and normal sample sizes in GSE13601 were similar, the upregulated DEGs were analyzed by means of the R package “limma” when the criteria log2 fold change (FC) > 1 and false discovery rate (FDR) < .01 were met.
Determination of the TME cell infiltration level and immune-related functional enrichment scores
We evaluated the immune score, tumor purity, and stromal score for tumor samples using the R package “ESTIMATE.” The levels of 37 immune and tumor-related signatures (Table S2) in each sample were quantified by single-sample gene set enrichment analysis (ssGSEA) with the R package “GSVA,” and cytolytic activity (CYT) was calculated using previously described computational methods.Citation27 Through CIBERSORT and EPIC databases, we obtained the infiltration levels of 22 immune cell types and 6 cell types individually. TIMER2 database allowed us to visualize the correlation of YKT6 expression or CNV with the immune infiltration level in HNSCC.
WGCNA construction, biological function, pathway annotation and gene set variation analysis (GSVA)
The GSE78060, including 26 OSCC samples with detailed pathological tumor T (pT) and N (pN) stage information, was suitable for constructing a coexpression network. The detailed processes were carried out as previously described.Citation3 Intramodular connectivity was determined to measure the importance of genes, and we selected the top 100 hub genes as candidate genes for further analysis.
Genes clustered within the same module were chosen for gene ontology (GO) and Kyoto Encyclopedia of Genes and Genomes (KEGG) pathway analyses via the R package “clusterprofiler,” with a cutoff value of FDR < .05. To investigate the difference in biological process terms between the YKT6 high and YKT6 low groups, GSVA was applied using the R package “GSVA.” The gene sets of “h.all.v7.2.symbols” and “c2.cp.kegg.v7.2.symbols” were downloaded from MSigDB for GSVA.
Ranger and sliding window sequential forward feature selection (SWSFS)
Ranger, a weighted version of the random forest algorithm, was leveraged to evaluate the impact of the expression of select genes on patient overall survival (OS) with the R package “ranger,” and to provide variable importance score (VIS) for each gene. SWSFS was used to identify the top important genes. The approaches were carried out as described previously.Citation28 The genes in the set with the lowest out-of-bagging (OOB) error were selected as candidate prognostic factors for further analysis.
Western blotting and immunohistochemistry (IHC) staining
We performed the same methods as previous study to conduct western blotting, IHC staining, and obtain IHC score.Citation3 Primary antibodies against β-ACTIN (A1978, Sigma-Aldrich, AB_476692), GAPDH (Santa Cruz Biotechnology, sc-47,724), YKT6 (Abcam, ab236583), MMP9 (Abcam, ab38898) were utilized for western blotting and YKT6 (1:500 for collected OSCC samples, 1:2000 for microarray chips, Abcam, ab236583), CD8 (1:200 for microarray chips, Abcarta, PA067) were used for IHC staining.
Cell culture, transient transfection, RNA extraction, and quantitative real-time PCR (qRT-PCR)
A total of three cell lines including human OSCC CAL-27 (American Type Culture Collection (ATCC), Zhong Qiao Xin Zhou Biotechnology, Shanghai, China), CAL-33 (Jilin Provincial Key Laboratory of Tooth Development and Bone Remodeling, Changchun, China) and UM-SCC-1 (ATCC, Cellcook Biotechnology, Guangzhou, China) were used in current research. CAL-27 and CAL-33 were cultured in DMEM (Gibco, Carlsbad, CA, USA) containing 10% fetal bovine serum (Gibco, Carlsbad, CA, USA). UM-SCC-1 was cultured in RPMI-1640 (Gibco, Carlsbad, CA, USA) containing 10% fetal bovine serum (Gibco, Carlsbad, CA, USA). The culture was maintained in a humidified incubator with 37°C, 5% CO2. Lipofectamine 2000 (Invitrogen, Carlsbad, CA, USA) was used to transfect Negative Control (NC) and YKT6 siRNAs (RiboBio, Guangzhou, China) into OSCC cells according to the manufacturer’s instruction. Target sequences for YKT6 siRNAs were GAACTAGATGAGACCAAAA (YKT6 si1) and GGATGGTCACCTCAGTAGA (YKT6 si2).
The primer sequences for qRT-PCR were listed as follows: hβ-ACTIN, Forward (F): 5′-AGTTGCGTTACACCCTTTCTTG-3′, Reverse (R): 5′-CACCTTCACCGTTCCAGTTTT-3′; hYKT6, Forward (F): 5′-CAGCGTCCTCTACAAAGGCG-3′, Reverse (R): 5′-ACAATCAGTTGACTCGTGAAGG-3′.
Wound healing and transwell assay
The migration and invasive abilities of OSCC cells were determined by wound healing and transwell assays after transfection with siRNAs. We referred to a previous study protocolCitation29 and cells (1.5 × 10⁵) were seeded into the chamber and cultured for 48 hours.
Enzyme linked immunosorbent assay (ELISA)
The cell culture supernatants were collected for ELISA after cell transfection with siRNAs. The concentration of TGF-β1 was measured using the ELISA kit (MultiSciences (Lianke) Biotech Co., Ltd., Shenzhen, Hangzhou, China), following the manufacturer’s instructions.
Immunotherapeutic response prediction and drug sensitivity exploration
The tumor immune dysfunction and exclusion (TIDE) algorithm, subclass mapping, and immunophenoscore (IPS) calculation were leveraged to predict responses to ICB as previously described.Citation30–32 We utilized RNAactDrug to investigate responses to drugs of YKT6 in cancers.
Gene expression and clinical datasets for ICB and TCGA pan-cancer analyses
To analyze the efficacy of immunotherapy, the data of patients with metastatic melanoma treated with MAGE-A3 immunotherapy (GSE35640, n = 56) and patients with melanoma prior to anti-PD-1 (Nivolumab) and anti-CTLA-4 (Ipilimumab) therapy (GSE91061, n = 49) were obtained. The RNA sequencing data (level 3) and clinicopathological characteristics of TCGA pan-cancer were obtained from the UCSC Xena browser. The data preprocessing methods were conducted as described above.
Statistical analysis
In this study, on the basis of the correlation between genes’ expression and patients’ survival in the GSE42743 (the training set), the optimal cutoff point of each gene’s expression (z score-normalized data) was determined using the R package “survminer.” Then, the cutoff values determined in the training set were applied in other datasets for categorizing groups. Analyses of OS and progress-free survival (PFS) were performed using Kaplan–Meier (K-M) analyses and log-rank tests. Univariate and multivariate analyses were employed to establish a Cox proportional hazard regression model and a nomogram model. To clarify the comprehensive prognostic value of YKT6 in different groups, a prognostic meta-analysis was conducted using R package “meta.” Then, a fixed effects model was used to calculate the pooled hazard ratio (HR) value. We generated time-dependent receiver operating characteristic (ROC) curves to compare different survival factors. The area under the curve (AUC) was acquired using the R package “pROC.” For comparisons of the two groups, the statistical significance for normally distributed variables was determined by unpaired Student’s t-tests, and nonnormally distributed variables were evaluated by Mann–Whitney U tests. For comparisons of more than two groups, one-way ANOVA tests and Kruskal–Wallis tests were utilized as parametric and nonparametric methods, respectively. The Pearson’s or Spearman’s correlation analysis was adopted to determine the linear relationship between two groups depending on data normality, and Chi-square and Fisher’s exact tests were used to analyze correlations between the YKT6 expression subgroups and the HNSCC subtypes and somatic mutation frequency. The R package “RCircos” was used to plot the CNV landscape of YKT6. All statistical analyses were conducted using R software (version 3.6.3) or SPSS software (version 26.0). Each experiment was repeated three times or more, and all data are presented as the mean ± standard deviation (SD). Statistical significance was described as follows: ns, not significant; *p < .05; **p ≤ .01; ***p ≤ .001.
Results
The red module was identified as the key module by WGCNA, and genes in the red module were functionally characterized
Considering the significance of the CD8 + T cell infiltration level in determining the prognosis of OSCC patients, we combined the level of CD8 + T cells estimated by the CIBERSORT with clinical characteristics and removed outlier samples to perform WGCNA (Figure S1a). In our study, a power of β = 7 (scale free R2 = 0.80) as the soft threshold was adopted to achieve a scale-free network (Figure S1b-c). As the results showed, 27 gene coexpression modules were identified using the dynamic tree cut method (Figure S1d). The heatmap of module trait correlations showed that the red module was highly correlated with pN stage and infiltration of CD8+ T cells in OSCC (), which meant that genes in the red module (807 genes, Table S3) could be responsible for OSCC malignancy and prognosis. Scatter plots of module membership vs. gene significance showed identical results (Figure S1e-f). Therefore, the red module was identified as the key module.
Figure 1. WGCNA construction and biological function and pathway annotation. (a) Left: Correlation of module eigengenes to clinical and pathological traits. The values in the cells are presented as “Pearson r (p-value)”. P-values were obtained by Pearson’s correlation analyses; Right: The number of genes in each module. The red arrow represents the red module. (b) Gene ontology analysis of genes in the red module. (c) KEGG pathway enrichment analysis of genes in the red module
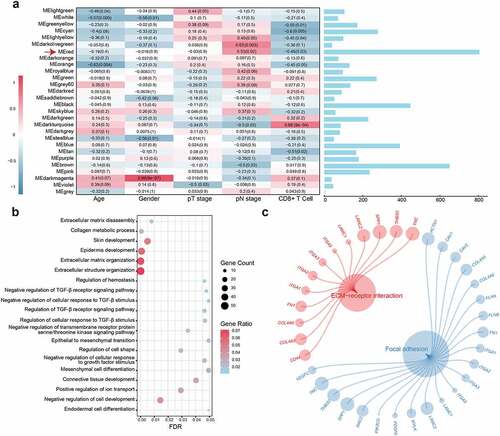
The biological process analysis showed that the genes in the red module were enriched in processes, such as extracellular matrix organization, regulation of TGF-β receptor signaling pathway, and EMT. The KEGG pathway analysis demonstrated that the genes were associated with ECM–receptor interactions and focal adhesion (; Table S4). These results indicate that the genes may mediate the TME in OSCC.
YKT6 was selected as a hub gene affecting the prognosis of OSCC patients
Most DEGs were up‐regulated in cancer hallmarks for OSCC patients.Citation33 Gene expression profiles from GSE13601 identified 946 upregulated DEGs in OSCC samples compared with normal control tissues (Table S5). In this study, the top 100 genes with the highest connectivity in the red module were intersected with the 946 DEGs, yielding 29 candidate genes (). To validate the effects of the 29 candidate genes on prognosis, the patients in GSE42743 cohort (the training set) were assigned to groups based on high or low expression of the 29 genes using the cutoff values obtained with the “survminer” package, and conducted K-M survival analyses and log-rank tests. Twenty-four genes were found to exhibit statistically significant impact on OS of patients. Following the above screening steps in GSE41613 and TCGA cohorts (validation sets), we used the same cutoff values from the training set and ended up with six genes (YKT6, PLAU, BASP1, ANXA5, LGALS1, and TGFBI) which may influence the OS and PFS outcome (; Table S6). In the TCGA dataset, the SWSFS algorithm identified a model combining two genes (YKT6, PLAU; ). One gene (YKT6) that has rarely been reported among most cancers ranked at the top of the list according to the prognostic importance (). Using the cutoff value (= −0.036) of YKT6, KM survival curves in the GSE41613, GSE42743, and TCGA were established. The results showed that the high expression of YKT6 was associated with worse OS/PFS probability than the low expression (Figure S2a-d). In the univariate Cox regression analysis, YKT6 expression with statistical significance was observed. Furthermore, YKT6 expression was deemed as an independent prognostic biomarker in the multivariate Cox proportional hazards regression model using GSE41613, GSE42743, and TCGA data (for OS, HR = 1.92, 2.11, and 1.68, 95% confidence interval (CI) = 1.03–3.60, 1.17–3.80, and 1.26–2.24, p = .041, 0.013, and <0.001, respectively; for PFS, HR = 1.40, 95% CI = 1.04–1.89, p = .028; ). To investigate the comprehensive prognostic value across all three cohorts (n = 689), a prognostic meta-analysis was performed. Results displayed that high YKT6 expression was a significant risk factor for OS of patients (for univariate analysis, combined HR = 1.87, 95% CI = 1.49–2.39, p < .001; for multivariate analysis, combined HR = 1.78, 95% CI = 1.40–2.26, p < .001; ). YKT6 has been confirmed to play crucial roles in multiple membrane transport steps in the secretory pathway, and its dysfunction may contribute to malignant progression in tumors. Of note, YKT6 expression and function, including involvement in immune-related processes, in cancers remain largely unknown. Therefore, YKT6 was selected as a candidate gene for further investigation.
Figure 2. Identification of YKT6 as a hub gene and construction of a YKT6-based prognostic prediction model. (a) Venn plot of intersection of up-regulated differentially expressed genes (DEGs) and selected genes from WGCNA. (b) Circos plot shows 29 common genes from WGCNA and differential expressed analysis in OSCC samples. Up-regulations of six genes are also associated with OS/PFS reduction in TCGA-HNSCC cohort. (c-d) Ranger provided VIS for two genes for TCGA-HNSCC patients only. OOB error rate of these genes in the model, when genes were included one by one based on their VIS ranks. The gene (red lollipop) that ranked in the top list according to the prognostic importance was chosen for further analyses. (e) Univariate and multivariate Cox regression analyses of YKT6 level with age, gender, tumour stage and HPV status in the GSE41613, GSE42743 and TCGA cohorts. HR and p-values were displayed. (f) Meta‐analysis of prognostic values of YKT6 for patients across three cohorts. A fixed effects model was used to calculate pooled HR value. (g) Nomogram by multivariate Cox regression analysis for predicting the proportion of patients with OS. (h) Plots depict the calibration of model in terms of agreement between predicted and observed OS. Model performance is shown by the plot, relative to the 45-degree line, which represents perfect prediction. (i-k) AUC plotted for different durations of OS for nomogram-based signature, YKT6 expression, and tumour stage in the TCGA, GSE41613 and GSE42743 datasets
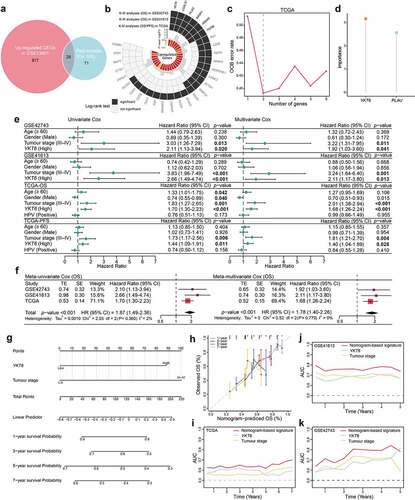
To better predict the prognosis of OSCC patients in the clinic, a prognostic nomogram was developed by integrating two independent predictors of mortality from the above analyses, YKT6 expression and tumor stage, into a multivariate Cox regression model, which was evaluated and validated using the TCGA, GSE41613, and GSE42743 data. A score based on the nomogram developed in the current study was calculated to predict the 1-, 3-, 5-, and 7-year OS for individual patients (). The calibration plot showed that the nomogram performed well in predicting patient OS according to an ideal model (). As expected, the concordance indices of the nomogram model for predicting OS were 0.612, 0.705, and 0.631 in the TCGA, GSE41613, and GSE42743 cohorts, respectively. Additionally, the AUC values showed that YKT6 expression along with tumor stage was best at predicting the OS among the factors analyzed ().
YKT6 expression was elevated in aggressive HNSCC/OSCC
First, the role of YKT6 in HNSCC malignancy was assessed. In groups from MEXPRESS categorized according to different clinical factors, including anatomic neoplasm subdivision, disease recurrence after curative treatment, EGFR status, HPV status, neoplasm histologic grade, new tumor occurrence, presence of perineural invasion, and tobacco smoking history, YKT6 displayed a differential expression pattern (). In previous studies, HNSCC was categorized into distinct subtypes based on molecular and immune features, and these subtypes were related to the survival of patients.Citation13,Citation14,Citation34,Citation35 The results of Chi-square and Fisher’s exact tests revealed YKT6 expression was statistically associated with the subtypes (; Table S7). The UALCAN results indicated that YKT6 mRNA expression was increased in patients with a high pathological grade, human papillomavirus (HPV)-negative status and TP53 mutant status (p < .001, respectively; ). YKT6 was also observed to be significantly upregulated in the mesenchymal, nonimmune, immune-type 3, and wound healing subtypes compared to the atypical, active-immune, immune-type 4, and IFN-gamma dominant subtypes, which reflected that YKT6 could participate in metastasis and invasion and be enriched in the immune-cold phenotype (p < .001, p < .001, p < .001, and p = .032, respectively; ). Furthermore, YKT6 presented higher expression in tumor tissues than in normal tissues based on a large-scale OSCC dataset containing 167 tumor samples and 45 normal samples (GSE30784) (p < .001; ). A similar result was obtained in the metastatic LN group from GSE78060 (p = .008; ). Through ESTIMATE analysis, we found that YKT6 was positively correlated with tumor purity (p < .001, r = 0.378; p < .001, r = 0.357) and negatively correlated with immune score (p < .001, r = −0.468; p < .001, r = −0.366; ) in the GSE30784 and GSE41613 datasets, respectively. Taken together, these results showed that YKT6 overexpression was implicated in the progression, recurrence, immune dysfunction, and poor prognosis of HNSCC/OSCC.
Figure 3. YKT6 expression is elevated in HNSCC/OSCC samples from publicly available datasets.(a-b) Correlations between YKT6 level and clinicopathological characteristics (including HNSCC subtypes). (c-e) Boxplot indicating YKT6 expression in different grades, HPV infection condition, TP53 mutation status of HNSCC samples from the UALCAN database. (f-i) Analysis of YKT6 mRNA expression in different subtypes of HNSCC tissues from TCGA database. (j) Analysis of mRNA expression of YKT6 in OSCC and normal control tissues from GSE30784 dataset. (k) Quantification of YKT6 mRNA in metastatic lymph nodes and normal oral tissues from GSE78060. (l-m) The correlation between YKT6 mRNA expression with immune score and tumour purity in the GSE30784 and GSE41613 datasets. (n) Deletion, diploid, copy number gain and amplification are involved in the deregulation of YKT6 expression as analyzed by cBioPortal using TCGA-HNSCC data. (o) Correlation between YKT6 CNV and mRNA expression. (p) The location of CNV of YKT6 on 23 chromosomes using TCGA-HNSCC cohort. (q) DNA methylation value differences in normal control and tumour tissues from UALCAN-HNSCC cohort. (r) The correlation of YKT6 expression and DNA methylation level in MEXPRESS-HNSCC cohort; *p < 0.05, **p ≤ 0.01, and ***p ≤ 0.001
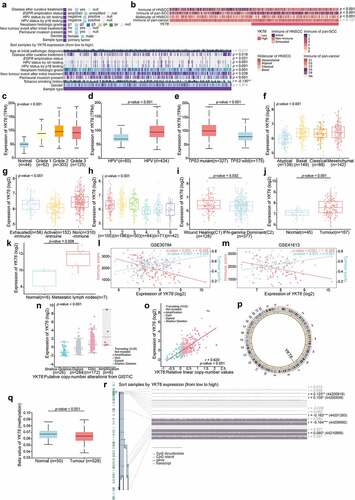
By analyzing YKT6 expression in different cell types in HNSCC from a published single-cell RNA sequencing dataset,Citation36 we observed that YKT6 predominantly expressed in malignant HNSCC cells rather than in other infiltrating cell types (Figure S2e). In addition, genomic alteration analysis for YKT6 revealed that there were deep deletion, shallow deletion, diploid, copy number gain, and amplification. Notably, copy number gain and amplification of YKT6 were frequently found in TCGA-HNSCC tissues (p < .001; ), and the copy number of YKT6 was significantly correlated with the mRNA expression level (p < .001, r = 0.620; ). The location of CNVs of YKT6 on chromosomes is shown in . We also found a decrease in the DNA methylation level of YKT6 in tumor samples (p < .001, ), and YKT6 mRNA expression was weakly negatively associated with the methylation levels of the cg44201263 and cg44209692 probes (p < .001, r = −0.163; p < .001, r = −0.164; respectively; ). Moreover, the number of YKT6 somatic mutations was low (Figure S2f). These results suggested that alterations in the copy number and DNA methylation levels could be the underlying mechanisms responsible for YKT6 upregulation.
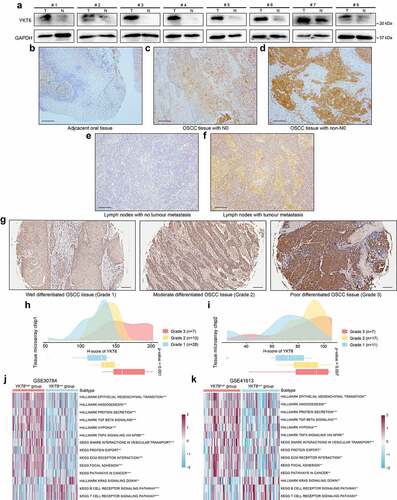
The western blotting and IHC staining protein level results were consistent with the changes in the mRNA level of YKT6. Western blotting revealed YKT6 had a higher expression level in OSCC tissues than in adjacent non-tumor tissues (). In IHC staining, YKT6 protein expression increased with increasing pN stage, with lower expression of YKT6 found in paired adjacent non-tumor tissues than in OSCC tissues. In addition, LN samples with metastatic deposits had higher YKT6 protein levels than the adjacent normal LN samples without metastatic tumors (). A high tumor grade often portends a worse prognosis, and YKT6 protein expression grew along with the malignant progression of OSCC (indicated by changes in histologic grades) in two tissue microarray chips ().
Figure 4. YKT6 expression is upregulated in clinical OSCC samples. (a) The protein levels of YKT6 in eight pairs of OSCC tissues (T) and adjacent non-tumour tissues (N) measured by western blot. (b-f) Images of IHC staining for YKT6 in adjacent non-tumour tissues, different pN stage of OSCC tissues, and LN tissues with/without tumour metastasis. Scale bars: 100 μm. (g) Representative images of IHC staining for YKT6 in different histologic grades of OSCC tissues. Scale bars: 100 μm. (h-i) Quantification of YKT6 IHC staining in different histologic grades of OSCC tissues. (j-k) GSVA analysis of hallmark and KEGG pathway gene sets in YKT6 high and low expression samples from GSE30784 and GSE41613 datasets; *p < 0.05, **p ≤ 0.01, and ***p ≤ 0.001
YKT6 was identified to be involved in cancer-related signaling pathways in OSCC
To explore the relationship between biological functions and YKT6, GSVA was conducted using the GSE30784 and GSE41613 data. The YKT6 high group showed a marked enrichment of EMT, TGF-β signaling, hypoxia, pathways in cancer, protein secretion and export, and TNF-α signaling via NF-κB. The YKT6 low group was prominently related to the T and B cell receptor signaling pathways (). These findings paralleled the above results, which are also shown in . Based on these findings, we concluded that YKT6 plays an important role during malignant progression in OSCC.
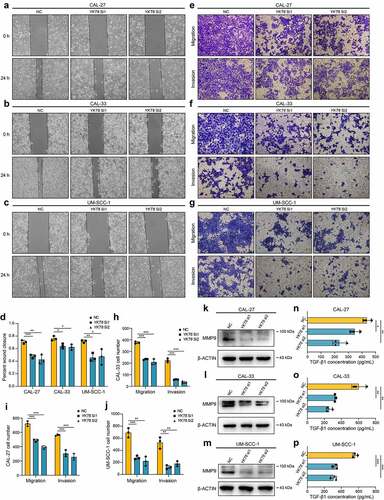
YKT6 promoted the migration and invasion of OSCC cells in vitro
In vitro, YKT6 was knocked down in CAL-27 CAL-33 and UM-SCC-1 cells (Figure S3a-b). A wound healing assay showed that the knockdown of YKT6 repressed the cell migratory ability (). Transwell assays, including migration and invasion assays, indicated that the migratory ability and invasive ability were reduced when YKT6 was depleted (). Several studies have reported that the matrix metalloproteinases (MMPs) facilitated cancer cell migration and invasion in OSCC, including MMP9.Citation37,Citation38 As displayed in , the protein expression of MMP9 in OSCC cells was decreased followed by YKT6 knockdown. YKT6 expression was found to be closely related to the TGF-β signaling pathway through the above bioinformatic analyses, and TGF-β1 has been regarded as a key initiator of the migration and invasion in OSCC.Citation38,Citation39 Interestingly, when YKT6 was downregulated, TGF-β1 secretion was decreased (). These results corroborated that YKT6 was likely to be essential for OSCC migration and invasion in vitro.
Figure 5. YKT6 promotes OSCC cells migration and invasion in vitro.(a-c) Images of wound healing assay in NC and YKT6 knockdown group. (d) Quantitative analysis of wound closure. (e-g) Images of transwell assay for migration and invasion in NC and YKT6 knockdown group. (h-j) Quantitative analysis of migration and invasion OSCC cell number. (k-m) Verification of MMP9 expression by Western blotting assay in OSCC cells transfected with siRNA. (n-p) TGF-β1 concentration in cell culture supernatants measured by ELISA in OSCC cells transfected with siRNA; *p < 0.05, **p ≤ 0.01, and ***p ≤ 0.001
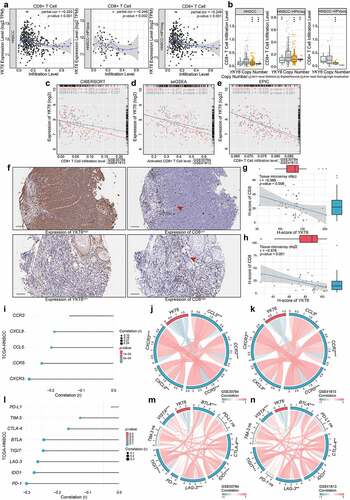
High expression of YKT6 was associated with low CD8 + T cell levels
On the basis of the above results, we investigated the relationship between YKT6 and CD8 + T cells. The results from TIMER2 showed that high YKT6 mRNA expression had significant negative correlations with CD8 + T cell levels in HNSCC (r = −0.320, p < .001), HPV-positive (r = −0.346, p = .002) and HPV-negative patients (r = −0.249, p < .001) (). In addition, the level of CD8 + T cells was altered by changes in YKT6 CNV (). Also, we evaluated the association between YKT6 mRNA expression/CNV and the infiltration levels of other five immune cells in the TCGA-HNSCC cohort. The connection between YKT6 expression and B cell level is worthy of attention (Figure S4a-b). Next, we used several algorithms to conduct subsequent studies in OSCC, and the expression of YKT6 was negatively related to the CD8 + T cell levels in the GSE30784 and GSE41613 datasets (). As shown in Figure S4c-e, high expression of YKT6 was related to low B cell and plasma cell levels. In addition to the findings at the transcription level, IHC staining confirmed that as the protein expression of YKT6 increased, the protein level of CD8 (representing tumor-infiltrating CD8 + T cells) decreased (for tissue microarray chip 1, r = −0.398, p = .006, n = 48, Spearman’s correlation analysis; for tissue microarray chip 2, r = −0.576, p < .001, n = 35, Spearman’s correlation analysis; ; the corresponding IHC score was displayed in Table S1). Since chemokines and chemokine receptors mediate the movement of immune cells in the TME, including the recruitment of CD8 + T cells into tumors,Citation40 we found that YKT6 was highly negatively correlated with CCL5, CCR5, CCR2, CXCR3, and CXCL9 expression in HNSCC and OSCC samples (). Overall, these results revealed that YKT6 could be a potential biomarker for alterations of the tumor immune microenvironment, especially alterations related to CD8 + T cells.
Figure 6. High expression of YKT6 correlates with low CD8+T cell infiltration level. (a) The mRNA expression of YKT6 is negatively correlated with CD8+T cell infiltration level in HNSCC, HNSCC HPV-positive and HNSCC HPV-negative in TIMER2 database. Each dot represents each sample. (b) The CNV of YKT6 is negatively correlated with the level of CD8+T cell in HNSCC, HNSCC HPV-positive and HNSCC HPV-negative databases in TIMER2 database. (c-e) The mRNA expression of YKT6 is negatively correlated with CD8 +T cell infiltration level in GSE30784 and GSE41613 with CIBERSORT, ssGSEA and EPIC algorism. (f) IHC images of high and low protein expression of YKT6 and CD8. Scale bars: 100 μm. The red arrow represents CD8+ T cells infiltrating into the tumours. (g-h) Quantifications of YKT6 and CD8 IHC staining in OSCC tissue microarray chip1 (n = 48) and chip2 (n = 35) show the negative association between YKT6 and CD8. (i-k) In TIMER2-HNSCC, GSE30784 and GSE41613, YKT6 expression is negatively associated with chemokines and chemokine receptors expression. (l-n) The mRNA expression of YKT6 is negatively correlated with immune checkpoint molecules expression level in TIMER2- HNSCC, GSE30784 and GSE41613; ns, not significant, *p < 0.05, **p ≤ 0.01, and ***p ≤ 0.001
YKT6 expression could predict the clinical benefit of ICB
To further elucidate the effects of YKT6 in the context of immunotherapy (represented by ICBs), we extended our analysis to associations between YKT6 and several well-known immune checkpoint genes. In the TCGA-HNSCC cohort, YKT6 expression was found to be negatively correlated with PD-1, CTLA-4, IDO1, BTLA, LAG-3, TIM-3, TIGIT, and VISTA expression (). There was strong agreement in GSE30784 and GSE41613 ().
Recently, TMB was proven to be an underlying determinant of response and resistance to ICBs in HNSCC.Citation41 Thus, we analyzed whether there was an association between TMB and YKT6 expression, and a negative but weak correlation was revealed (r = −0.100, p = .045; Figure S5a). Though differences between the two groups with low and high expression of YKT6 in TCGA-HNSCC were not statistically significant, patients with low expression of YKT6 showed a higher TMB than those with high expression (p = .055; Figure S5b). As displayed in Figure S5c, the overall mutation number presented was low and most genomic variants were missense mutations. In addition, the top 25 driver genes with the highest alteration frequencies were determined in the two cohorts (Figure S5d-e). The alteration frequencies of TP53 and PIK3CA were statistically associated with YKT6 expression (p < .001 and p = .043, respectively, Chi-square tests; Table S8), implying potential mechanisms by which YKT6 functions in tumor progression and ICB therapy.
Next, we analyzed the clinical response to ICBs in OSCC. The CYT, antigen presentation, and expanded immune level have been reported to be dramatically elevated upon CD8 + T cell activation and during the responses to anti-PD-L1 and anti-CTLA-4 immunotherapies.Citation27,Citation42,Citation43 We found that as YKT6 expression increased, the CYT, proportion of tumor-infiltrating lymphocytes (TILs), checkpoint level, human leukocyte antigen (HLA) abundance, expanded immune, antigen-presenting cell (APC) co-stimulation, and T-cell co-stimulation level declined in the GSE30784 and GSE41613 cohorts (). High TIDE scores significantly correlated with the increased YKT6 expression (), and the expression of YKT6 in OSCC tissues from patients who responded to immunotherapy was lower than that in tissues from patients who did not respond (). We delved further into the relationship between YKT6 expression and IPS, a superior predictor to identify determinants of immunogenicity and characterize the intratumoral immunologic landscape. In the GSE30784 and GSE41613, the YKT6 expression was negatively associated with the major histocompatibility complex (MHC) scores, effector cell (EC) score, and IPS score. With regard to the suppressor cell (SC) score, the opposite result was obtained (). In addition, we explored the response to immunotherapy specifically targeting CTLA-4 and PD-1 in OSCC patients with high and low expression of YKT6 through a subclass mapping approach. Interestingly, patients with low expression of YKT6 showed promising responses to anti-PD-1 therapy, while patients with high expression of YKT6 showed no responses to anti-PD-1 therapy (). The above analyses suggested that patients with low expression of YKT6 may be more sensitive to the ICB therapy than patients with high expression of YKT6. To gain further clinical insight into different immune factors related to the prognosis of patients, we determined the accuracy of YKT6 expression in the prediction of OS by comparing its time-dependent AUC value with those of the TIDE and IPS scores. These analyses in the two cohorts revealed that YKT6 performed better in predicting the survival of OSCC patients than the TIDE and IPS scores ().
Figure 7. YKT6 expression could predict the clinical benefit of ICB. (a) The negative correlation between YKT6 expression and immune signatures in GSE30784, GSE41613 cohorts. (b) The mRNA expression of YKT6 is correlated with TIDE score in GSE30784 and GSE41613. (c) BoxViolinplot representation of YKT6 expression in the putative immunotherapeutic response versus non-response group from TIDE in GSE30784 and GSE41613 cohorts. (d-e) The correlation between YKT6 and MHC, EC, SC, IPS score in GSE30784 and GSE41613. (f-g) Submap analysis manifested that YKT6 low group could be more sensitive to the anti-PD-1 treatment in GSE30784 and GSE41613. P-values were obtained after being adjusted. (h-i) The comparison of AUC of YKT6, TIDE Response and IPS score for OS in GSE41613 and GSE42743. (j-k) BoxViolinplot illustrates the distribution of YKT6 for patients with different immunotherapeutic response in GSE35640 and GSE91061 cohorts. (l-m) ROC curves measuring the predictive value about objective response to ICB in GSE35640 and GSE91061 cohorts; *p < 0.05, **p ≤ 0.01, and ***p ≤ 0.001
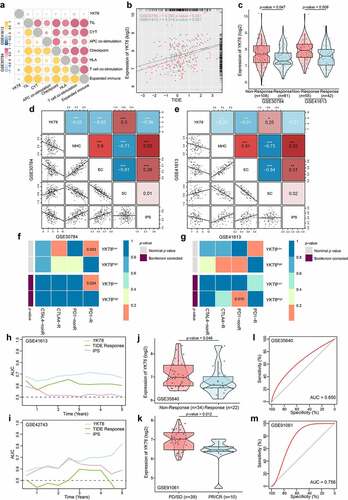
In the GSE35640 and GSE91061 datasets, we investigated whether YKT6 could predict patient response to the ICB therapy. As expected, patients with higher YKT6 expression were less likely to benefit from immune checkpoint therapy than those with lower YKT6 expression (), and the AUC values (>0.600) to evaluate the sensitivity and specificity for the prediction of objective response were also determined ().
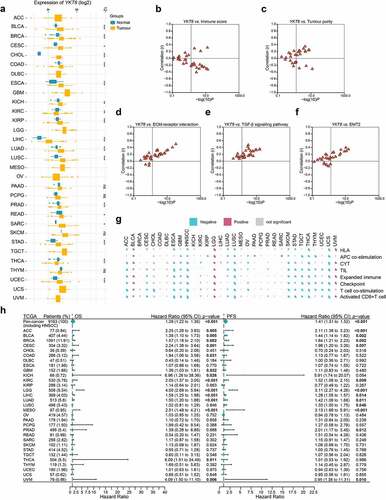
Overview of YKT6 in human cancers
Considering the lack of YKT6-related cancer research, especially in solid tumors, we assessed the expression of YKT6 in 31 solid tumors other than HNSCC. Collectively, YKT6 was overexpressed across a number of cancer types. Differential expression of YKT6 was not observed in some cancers, such as melanoma and glioblastoma, due to sample size limitations (). To characterize the associations between YKT6 expression and intratumoral immune states, the YKT6 expression in six immune subtypes was analyzed.Citation35 In most cancers, YKT6 was enriched in the C1 (wound-healing) and C4 (lymphocyte-depleted) subtypes and showed low expression in the C2 (IFN-γ-dominant) and C3 (inflammatory) subtypes, which was indicative of its role in shaping the TME (Figure S6a). As shown in Figure S6b, the “amplification” type of CNV of YKT6 was the primary type in most cancer cases. The types, sites, and case number of the YKT6 genetic alteration were further illustrated in Figure S6c. In addition, upregulated YKT6 was found to be associated with low immune score, activated CD8 + T cell level, activated B cell level, effector memory CD8 + T cell level, eosinophil level, CYT, immune signature scores, high tumor purity, ECM–receptor interaction level, TGF-β signaling pathway level, and EMT2 level in the majority of cancers, including HNSCC (; Figure S6d; Table S9). Concurrently, the prognostic value of YKT6 expression for OS and PFS was also validated in the independent TCGA cancer cohorts containing 9,163 tumor samples using univariate Cox regression analysis. The expression of YKT6 was supported as a prognostic biomarker in several independent TCGA cohorts, some of which contained tumors with high immunogenicity, TMB, and immune infiltration, such as breast cancer, lung cancer, kidney cancer, liver cancer, urothelial cancer, and cervical cancer (including head and neck cancer; ). Finally, the role of YKT6 expression in drug sensitivity was examined. The IC50 values of numerous chemotherapeutic drugs were significantly correlated with YKT6 at multiple levels (Table S10). The expression of YKT6 could be used as a biomarker of 5-fluorouracil and sorafenib resistance.
Figure 8. Role of YKT6 in pan-cancer. (a) The mRNA expression of YKT6 between tumour and normal control tissues was assessed from TCGA database. (b-f) Association of YKT6 with immune score and tumour purity level and some cancer-related signatures in human solid cancers from TCGA database. (g) Correlation of YKT6 with activated CD8+ T cell level and immune-related scores in human solid cancers from TCGA database. The size of pie is proportional to the correlation. (h) Univariate Cox regression analyses estimating prognostic value (OS/PFS) of YKT6 in different cancer types from TCGA database. The length of horizontal line represents the 95% CI for each group. The vertical dotted line represents HR = 1. HR > 1.0 indicates overexpression YKT6 is an unfavourable prognostic biomarker. Number of patients is displayed; ns, not significant, *p < 0.05, **p ≤ 0.01, and ***p ≤ 0.001
Discussion
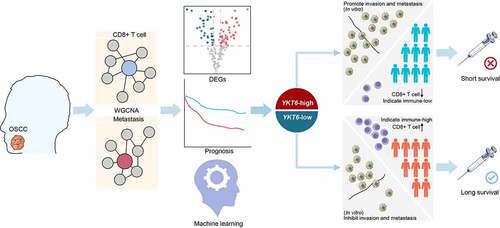
Immunotherapy, in which CD8 + T cells play a crucial role, provides a new strategy for the treatment of HNSCC/OSCC.Citation8,Citation44–46 Though the ICB has been approved for patients with recurrent and/or metastatic carcinomas, it has limited benefits.Citation5–7,Citation47 The genomic transcriptome reflects the heterogeneity of tumors and holds great promise for personalized therapeutics.Citation8 To gain insights into the mechanisms of OSCC progression and response to immunotherapy, WGCNA was conducted to explore key modules related to tumor metastasis and CD8 + T cell infiltration, followed by hub gene selection and survival analysis. Our results showed the potential value of YKT6 as a biomarker of survival and an indicator of immunotherapy for OSCC ().
Figure 9. Graphical abstract for workflow and comprehensive characterization of YKT6 in OSCC
Comprehensive evaluation on multiple independent cohorts of HNSCC/OSCC showed that the high expression group of YKT6 predicted shorter survival than the low expression group, consistent with the study of non-small-cell lung cancer.Citation20 The nomogram including YKT6 and tumor stage also showed good prognostic predictive performance. To further clarify the role of YKT6 in cancer prognosis prediction, we conducted a pan-cancer study including 9,163 patients from the TCGA cohorts and revealed that high expression of YKT6 was correlated with adverse prognosis at the pan-cancer level, especially in tumors with high immunogenicity, TMB, and immune infiltration.
The imbalance of the TME may partly contribute to the poor prognosis associated with YKT6 in cancers. The YKT6-relevant regulatory network has been reported to change the proportion of memory CD4 + T cells in gemcitabine-resistant pancreatic cancer.Citation48 Our research suggested that YKT6 was significantly negatively correlated with tumor CD8 + T cell infiltration. Moreover, YKT6 was also enriched in the C1 (wound-healing) and C4 (lymphocyte-depleted) subtypes and associated with CYT, infiltration of B cells, checkpoint score, proportion of TILs, and HLA abundance, indicating that YKT6 may be involved in remodeling of the TME. In addition to classic ICB response indicators such as TMB and PD-L1 IHC staining,Citation46,Citation49 our study showed that patients with low expression of YKT6 accompanied by the upregulation of immune checkpoints and increased CD8 + T cell infiltration were most likely to benefit from immunotherapy. Although more studies are needed to further confirm the above findings, YKT6 may be related to the immune microenvironment and the immunotherapy response of HNSCC/OSCC.
The association between YKT6 and antitumour immunity may be related to multiple mechanisms. Exosomes regulate the tumor microenvironment, antigen presentation, immune activation, and immune surveillance.Citation50 Poggio et al. found that the suppression of exosomal PD-L1 induces systemic antitumor immunity.Citation51 YKT6 was reported to be involved in the production and release of exosomes, and the depletion of YKT6 reduced the release of exosomes.Citation20,Citation21 Therefore, YKT6 may participate in the antitumor immunity by regulating the production and release of exosomes. Autophagy activation in tumor cells is the main hijacker of the antitumor immune response, and reinforcing the inhibition of autophagy is a new approach in the field of cancer immunotherapy.Citation52–54 For example, autophagy promotes the immune escape from pancreatic cancer and weakens the immunotherapy response by degrading MHC-I in PDAC.Citation54 YKT6 was reported to mediate the fusion of autophagosomes and lysosomes.Citation22 Our results also revealed that YKT6 was negatively associated with MHC-related molecule scores. Hence, YKT6-mediated autophagy-related factors could also be responsible for tumor immune regulation. Chemokines regulate immune cell trafficking in tumors and are implicated in tumor development and the recruitment of multiple immune cells.Citation40 The secretion and transport of chemokines require SNARE proteins.Citation55 YKT6 was reported to be involved in many transport steps in the secretory pathway.Citation19,Citation56 Our study showed that YKT6 expression was correlated with the protein secretion process and the expression of CCL5, CCR5, CXCL9, and CXCR3. Thus, we deduced that YKT6 could contribute to the regulation of chemokine secretion. Finally, we found that YKT6 was linked to the expression of several immune checkpoints, such as PD-1, CTLA-4, IDO1, and LAG-3, which may indicate its roles in the development and application of certain drugs in the future. Although more in-depth studies are needed, we propose some ideas about the influence of YKT6 on the antitumor immune response.
The regulation of YKT6 on cell invasion and metastasis is also an important factor affecting prognosis. YKT6 has been proven to regulate vesicle trafficking and epithelial cell migration, but its role in tumor development remains to be determined.Citation57 Our results found that increased YKT6 promoted OSCC invasion and metastasis. Since vesicle trafficking regulates epithelial cells by remodeling matrix adhesion and delivering signaling molecules to the migration frontier,Citation57,Citation58 YKT6 could participate in the regulation of membrane dynamics during cell adhesion and migration, resulting in accelerated movement of cancer cells and promotion of metastasis. In addition, the Wnt signaling pathway is involved in the regulation of cell adhesion and migration, and the secretion of Wnt-containing exosomes requires YKT621. Matrix metalloproteinases (MMPs) are also important regulatory factors for cancer cell invasion/metastasis.Citation59 Both ours and a recent study by Lee et al. have found that repressing YKT6 expression could downregulate the expression of MMP9,Citation60 and inhibiting MMP9 could modulate tumor immune surveillance by regulating PD-L1.Citation47 These results indicate that the overexpression of YKT6 may promote the invasion/metastasis and affect tumor immunity by regulating MMP9. In our study, the YKT6 high group showed a marked enrichment of the TGF-β signaling pathway, and the expression of YKT6 was positively correlated with the TGF-β signaling pathway score at the pan-cancer level. We found that the knockdown of YKT6 reduced the secretion of TGF-β1. The TGF-β signaling pathway not only enables cancer cell invasion and dissemination but also promotes cancer progression by shaping the architecture of tumors and by suppressing the antitumor activities of immune cells, thereby generating an immunosuppressive environment that prevents or attenuates the efficacy of anti-cancer immunotherapies.Citation61 In summary, YKT6 promotes the invasion and metastasis of OSCC through multiple mechanisms, which may also be responsible for tumor immune escape.
Although YKT6 has been reported to rescue nutritional stress by inducing leucine uptake and cell proliferation in ER+ breast cancer and is upregulated in TP53-mutant breast cancer (which is related to the low response rate to docetaxelCitation24,Citation25), its role in tumorigenesis is still ambiguous. HPV infection in HNSCC, as a favorable prognostic indicator, may enhance antitumor immunity.Citation14,Citation62 We found that YKT6 was upregulated during HNSCC/OSCC tumorigenesis and further elevated in aggressive tumors and patients with HPV negativity and TP53 mutation. In the atypical subtype, which has a strong HPV-positive signature, YKT6 displayed low expression. In addition, pan-cancer studies have shown that YKT6 upregulation is a general molecular event during tumorigenesis. The function of YKT6 is posttranslationally regulated, and its expression may be targeted by certain posttranscriptional factors, such as miR-134 and miR-135b.Citation19,Citation20 We found that the YKT6 gene is rarely mutated in HNSCC/OSCC patients, but YKT6 expression is closely related to its gene copy number and methylation status, suggesting that it may be regulated by both genetic and epigenetic mechanisms. In addition, patients with YKT6 gene copy number amplification had lower CD8 + T cell, CD4 + T cell, and B cell infiltration (this was especially true for HPV-positive patients), reflecting that the amplification of YKT6 may be involved in the remodeling of the immune microenvironment as a genetic event in HNSCC/OSCC.
While a comprehensive analysis of the multi-omics data from independent cohorts was conducted and some conclusions with clinical translation prospects were obtained, the cutoff established in the paper and the role of YKT6 in the prognosis and immunotherapy of OSCC should be further validated in a prospective cohort of patients containing follow-up data and receiving immunotherapy for clinical practice. Our study also revealed a close connection between YKT6 and cell migration/invasion in vitro and immune microenvironment remodeling in OSCC, and reflected the effects of YKT6 on the pathogenesis and prognosis of cancers. However, the in vivo verification needs to be addressed in our future studies. Also, more in-depth molecular mechanisms to explain these observations should be systematically elucidated in vitro and in vivo to optimize treatment, which may include strategies such as the combination of YKT6-specific inhibitors with ICBs for OSCC patients.
Disclosure of potential conflicts of interest
No potential conflict of interest was reported by the author(s).
Supplemental Material
Download ()Acknowledgments
We thank Professor Jihui Jia (Department of Microbiology/Key Laboratory for Experimental Teratology of the Chinese Ministry of Education, School of Basic Medical Science, Shandong University, Jinan, Shandong, People’s Republic of China) and Professor Chunyan Chen (School of Medicine, Shandong University, Jinan, Shandong, People’s Republic of China) for offering expert advice concerning this study. We also thank Professor Jun Ma (Sun Yat-sen University Cancer, People’s Republic of China) and Professor Vonn Andrew Walter (Lineberger Comprehensive Center, University of North Carolina, USA) for supplying the data of HNSCC subtypes. We are grateful to Guimiao Xing (School and Hospital of Stomatology, Cheeloo College of Medicine, Shandong University, Jinan, Shandong, People’s Republic of China), Caijiao Wang (School and Hospital of Stomatology, Cheeloo College of Medicine, Shandong University, Jinan, Shandong, People’s Republic of China), Wenqian Yu (Department of Implantology, School and Hospital of Stomatology, Cheeloo College of Medicine, Shandong University, Jinan, Shandong, People’s Republic of China), and Jiajia Zhang (Department of Implantology, School and Hospital of Stomatology, Cheeloo College of Medicine, Shandong University, Jinan, Shandong, People’s Republic of China) for collecting OSCC tissues. Finally, we appreciate the kind encouragement and support from Shutong Li (School and Hospital of Stomatology, Cheeloo College of Medicine, Shandong University, Jinan, Shandong, People’s Republic of China) and Yang Bai (Department of Architecture and Art, Hefei University of Technology, Hefei, Anhui, People’s Repubic of China).
Supplementary materials
Supplemental data for this article can be accessed on the publisher’s website.
Additional information
Funding
References
- Tang Q, Xie M, Yu S, Zhou X, Xie Y, Chen G, Guo F, Chen L. Periodic oxaliplatin administration in synergy with PER2-Mediated PCNA transcription repression promotes chronochemotherapeutic efficacy of OSCC. Adv Sci (Weinh). 2019;6(21):1900667. doi:10.1002/advs.201900667.
- Bray F, Ferlay J, Soerjomataram I, Siegel RL, Torre LA, Jemal A. Global cancer statistics 2018: GLOBOCAN estimates of incidence and mortality worldwide for 36 cancers in 185 countries. CA Cancer J Clin. 2018;68(6):394–18. doi:10.3322/caac.21492.
- Yang Z, Liang X, Fu Y, Liu Y, Zheng L, Liu F, Li T, Yin X, Qiao X, Xu X. Identification of AUNIP as a candidate diagnostic and prognostic biomarker for oral squamous cell carcinoma. EBioMedicine. 2019;47:44–57. doi:10.1016/j.ebiom.2019.08.013.
- Colli ML, Hill JLE, Marroqui L, Chaffey J, Dos Santos RS, Leete P, Coomans De Brachene A, Paula FMM, Op De Beeck A, Castela A, et al. PDL1 is expressed in the islets of people with type 1 diabetes and is up-regulated by interferons-α and-γ via IRF1 induction. EBioMedicine. 2018;36:367–375. doi:10.1016/j.ebiom.2018.09.040.
- Ferris RL, Blumenschein G Jr., Fayette J, Guigay J, Colevas AD, Licitra L, Harrington K, Kasper S, Vokes EE, Even C, et al. Nivolumab for recurrent squamous-cell carcinoma of the head and neck. N Engl J Med. 2016;375(19):1856–1867. doi:10.1056/NEJMoa1602252.
- Seiwert TY, Burtness B, Mehra R, Weiss J, Berger R, Eder JP, Heath K, McClanahan T, Lunceford J, Gause C, et al. Safety and clinical activity of pembrolizumab for treatment of recurrent or metastatic squamous cell carcinoma of the head and neck (KEYNOTE-012): an open-label, multicentre, phase 1b trial. Lancet Oncol. 2016;17(7):956–965. doi:10.1016/S1470-2045(16)30066-3.
- Chen Y, Li ZY, Zhou GQ, Sun Y. An immune-related gene prognostic index for head and neck squamous cell carcinoma. Clin Cancer Res. 2020. doi:10.1158/1078-0432.CCR-20-2166.
- Chai AWY, Lim KP, Cheong SC. Translational genomics and recent advances in oral squamous cell carcinoma. Semin Cancer Biol. 2020;61:71–83. doi:10.1016/j.semcancer.2019.09.011.
- Menares E, Galvez-Cancino F, Caceres-Morgado P, Ghorani E, Lopez E, Diaz X, Saavedra-Almarza J, Figueroa DA, Roa E, Quezada SA, et al. Tissue-resident memory CD8+ T cells amplify anti-tumor immunity by triggering antigen spreading through dendritic cells. Nat Commun. 2019;10(1):4401. doi:10.1038/s41467-019-12319-x.
- Ock CY, Keam B, Kim S, Lee JS, Kim M, Kim TM, Jeon YK, Kim DW, Chung DH, Heo DS. Pan-cancer immunogenomic perspective on the tumor microenvironment based on PD-L1 and CD8 T-cell infiltration. Clin Cancer Res. 2016;22(9):2261–2270. doi:10.1158/1078-0432.CCR-15-2834.
- Shimizu S, Hiratsuka H, Koike K, Tsuchihashi K, Sonoda T, Ogi K, Miyakawa A, Kobayashi J, Kaneko T, Igarashi T, et al. Tumor-infiltrating CD8(+) T-cell density is an independent prognostic marker for oral squamous cell carcinoma. Cancer Med. 2019;8(1):80–93. doi:10.1002/cam4.1889.
- Terry S, Savagner P, Ortiz-Cuaran S, Mahjoubi L, Saintigny P, Thiery JP, Chouaib S. New insights into the role of EMT in tumor immune escape. Mol Oncol. 2017;11(7):824–846. doi:10.1002/1878-0261.12093.
- Li B, Cui Y, Nambiar DK, Sunwoo JB, Li R. The immune subtypes and landscape of squamous cell carcinoma. Clin Cancer Res. 2019;25(12):3528–3537. doi:10.1158/1078-0432.CCR-18-4085.
- Chen YP, Wang YQ, Lv JW, Li YQ, Chua MLK, Le QT, Lee N, Colevas AD, Seiwert T, Hayes DN, et al. Identification and validation of novel microenvironment-based immune molecular subgroups of head and neck squamous cell carcinoma: implications for immunotherapy. Ann Oncol. 2019;30(1):68–75. doi:10.1093/annonc/mdy470.
- Wu L, Deng WW, Huang CF, Bu LL, Yu GT, Mao L, Zhang WF, Liu B, Sun ZJ. Expression of VISTA correlated with immunosuppression and synergized with CD8 to predict survival in human oral squamous cell carcinoma. Cancer Immunol Immunother. 2017;66(5):627–636. doi:10.1007/s00262-017-1968-0.
- Wu L, Deng WW, Yu GT, Mao L, Bu LL, Ma SR, Liu B, Zhang WF, Sun ZJ. B7-H4 expression indicates poor prognosis of oral squamous cell carcinoma. Cancer Immunol Immunother. 2016;65(9):1035–1045. doi:10.1007/s00262-016-1867-9.
- Das D, Ghosh S, Maitra A, Biswas NK, Panda CK, Roy B, Sarin R, Majumder PP. Epigenomic dysregulation-mediated alterations of key biological pathways and tumor immune evasion are hallmarks of gingivo-buccal oral cancer. Clin Epigenetics. 2019;11(1):178. doi:10.1186/s13148-019-0782-2.
- Cho YA, Yoon HJ, Lee JI, Hong SP, Hong SD. Relationship between the expressions of PD-L1 and tumor-infiltrating lymphocytes in oral squamous cell carcinoma. Oral Oncol. 2011;47(12):1148–1153. doi:10.1016/j.oraloncology.2011.08.007.
- Fukasawa M, Varlamov O, Eng WS, Sollner TH, Rothman JE. Localization and activity of the SNARE Ykt6 determined by its regulatory domain and palmitoylation. Proc Natl Acad Sci U S A. 2004;101(14):4815–4820. doi:10.1073/pnas.0401183101.
- Ruiz-Martinez M, Navarro A, Marrades RM, Vinolas N, Santasusagna S, Munoz C, Ramirez J, Molins L, Monzo M. YKT6 expression, exosome release, and survival in non-small cell lung cancer. Oncotarget. 2016;7(32):51515–51524. doi:10.18632/oncotarget.9862.
- Gross JC, Chaudhary V, Bartscherer K, Boutros M. Active Wnt proteins are secreted on exosomes. Nat Cell Biol. 2012;14(10):1036–1045. doi:10.1038/ncb2574.
- Mizushima N, Matsui T, Yamamoto H. YKT6 as a second SNARE protein of mammalian autophagosomes. Autophagy. 2019;15(1):176–177. doi:10.1080/15548627.2018.1532262.
- Kluger HM, Kluger Y, Gilmore-Hebert M, DiVito K, Chang JT, Rodov S, Mironenko O, Kacinski BM, Perkins AS, Sapi E. cDNA microarray analysis of invasive and tumorigenic phenotypes in a breast cancer model. Lab Invest. 2004;84(3):320–331. doi:10.1038/labinvest.3700044.
- Ooe A, Kato K, Noguchi S. Possible involvement of CCT5, RGS3, and YKT6 genes up-regulated in p53-mutated tumors in resistance to docetaxel in human breast cancers. Breast Cancer Res Treat. 2007;101(3):305–315. doi:10.1007/s10549-006-9293-x.
- Saito Y, Li L, Coyaud E, Luna A, Sander C, Raught B, Asara JM, Brown M, Muthuswamy SK. LLGL2 rescues nutrient stress by promoting leucine uptake in ER+ breast cancer. Nature. 2019;569(7755):275–279. doi:10.1038/s41586-019-1126-2.
- Hellmann MD, Nathanson T, Rizvi H, Creelan BC, Sanchez-Vega F, Ahuja A, Ni A, Novik JB, Mangarin LMB, Abu-Akeel M, et al. Genomic features of response to combination immunotherapy in patients with advanced non-small-cell lung cancer. Cancer Cell. 2018;33(5):843–52 e4. doi:10.1016/j.ccell.2018.03.018.
- Rooney MS, Shukla SA, Wu CJ, Getz G, Hacohen N. Molecular and genetic properties of tumors associated with local immune cytolytic activity. Cell. 2015;160(1–2):48–61. doi:10.1016/j.cell.2014.12.033.
- Zhang R, Lai L, He J, Chen C, You D, Duan W, Dong X, Zhu Y, Lin L, Shen S, et al. EGLN2 DNA methylation and expression interact with HIF1A to affect survival of early-stage NSCLC. Epigenetics. 2019;14(2):118–129. doi:10.1080/15592294.2019.1573066.
- Zhao W, Cui Y, Liu L, Qi X, Liu J, Ma S, Hu X, Zhang Z, Wang Y, Li H, et al. Correction to: splicing factor derived circular RNA circUHRF1 accelerates oral squamous cell carcinoma tumorigenesis via feedback loop. Cell Death Differ. 2020;27(6):2033–2034. doi:10.1038/s41418-019-0477-4.
- Lu X, Jiang L, Zhang L, Zhu Y, Hu W, Wang J, Ruan X, Xu Z, Meng X, Gao J, et al. Immune signature-based subtypes of cervical squamous cell carcinoma tightly associated with human papillomavirus type 16 expression, molecular features, and clinical outcome. Neoplasia. 2019;21(6):591–601. doi:10.1016/j.neo.2019.04.003.
- Jiang P, Gu S, Pan D, Fu J, Sahu A, Hu X, Li Z, Traugh N, Bu X, Li B, et al. Signatures of T cell dysfunction and exclusion predict cancer immunotherapy response. Nat Med. 2018;24(10):1550–1558. doi:10.1038/s41591-018-0136-1.
- Charoentong P, Finotello F, Angelova M, Mayer C, Efremova M, Rieder D, Hackl H, Trajanoski Z. Pan-cancer immunogenomic analyses reveal genotype-immunophenotype relationships and predictors of response to checkpoint blockade. Cell Rep. 2017;18(1):248–262. doi:10.1016/j.celrep.2016.12.019.
- Lin K, Song LJ, Ma J, Zhang TS, You DY, He YW. Identification of cancer hallmark-associated gene and lncRNA cooperative regulation pairs and dictate lncRNA roles in oral squamous cell carcinoma. J Cell Mol Med. 2020;24(9):5213–5223. doi:10.1111/jcmm.15174.
- Cancer Genome Atlas N. Comprehensive genomic characterization of head and neck squamous cell carcinomas. Nature. 2015;517(7536):576–582. doi:10.1038/nature14129.
- Thorsson V, Gibbs DL, Brown SD, Wolf D, Bortone DS, Ou Yang TH, Porta-Pardo E, Gao GF, Plaisier CL, Eddy JA, et al. The Immune Landscape of Cancer. Immunity. 2019;51(2):411–412. doi:10.1016/j.immuni.2019.08.004.
- Sun D, Wang J, Han Y, Dong X, Ge J, Zheng R, Shi X, Wang B, Li Z, Ren P, et al. TISCH: a comprehensive web resource enabling interactive single-cell transcriptome visualization of tumor microenvironment. Nucleic Acids Res. 2021;49(D1):D1420–D30. doi:10.1093/nar/gkaa1020.
- Yu T, Wu Y, Helman JI, Wen Y, Wang C, Li L. CXCR4 promotes oral squamous cell carcinoma migration and invasion through inducing expression of MMP-9 and MMP-13 via the ERK signaling pathway. Mol Cancer Res. 2011;9(2):161–172. doi:10.1158/1541-7786.MCR-10-0386.
- Qiao B, Johnson NW, Gao J. Epithelial-mesenchymal transition in oral squamous cell carcinoma triggered by transforming growth factor-beta1 is Snail family-dependent and correlates with matrix metalloproteinase-2 and −9 expressions. Int J Oncol. 2010;37(3):663–668. doi:10.3892/ijo_00000715.
- Dasgupta S, Bhattacharya-Chatterjee M, O’Malley BW Jr., Chatterjee SK. Tumor metastasis in an orthotopic murine model of head and neck cancer: possible role of TGF-beta 1 secreted by the tumor cells. J Cell Biochem. 2006;97(5):1036–1051. doi:10.1002/jcb.20647.
- Dangaj D, Bruand M, Grimm AJ, Ronet C, Barras D, Duttagupta PA, Lanitis E, Duraiswamy J, Tanyi JL, Benencia F, et al. Cooperation between constitutive and inducible chemokines enables T cell engraftment and immune attack in solid tumors. Cancer Cell. 2019;35(6):885–900 e10. doi:10.1016/j.ccell.2019.05.004.
- Zhang X, Shi M, Chen T, Zhang B. Characterization of the immune cell infiltration landscape in head and neck squamous cell carcinoma to aid immunotherapy. Mol Ther Nucleic Acids. 2020;22:298–309. doi:10.1016/j.omtn.2020.08.030.
- Ayers M, Lunceford J, Nebozhyn M, Murphy E, Loboda A, Kaufman DR, Albright A, Cheng JD, Kang SP, Shankaran V, et al. IFN-γ–related mRNA profile predicts clinical response to PD-1 blockade. J Clin Invest. 2017;127(8):2930–2940. doi:10.1172/JCI91190.
- Wang S, He Z, Wang X, Li H, Liu XS. Antigen presentation and tumor immunogenicity in cancer immunotherapy response prediction. Elife. 2019:8. doi:10.7554/eLife.49020.
- Carlisle JW, Steuer CE, Owonikoko TK, Saba NF. An update on the immune landscape in lung and head and neck cancers. CA Cancer J Clin. 2020;70(6):505–517. doi:10.3322/caac.21630.
- Tang H, Wang Y, Chlewicki LK, Zhang Y, Guo J, Liang W, Wang J, Wang X, Fu YX. Facilitating T cell infiltration in tumor microenvironment overcomes resistance to PD-L1 Blockade. Cancer Cell. 2016;30(3):500. doi:10.1016/j.ccell.2016.08.011.
- Burtness B, Harrington KJ, Greil R, Soulieres D, Tahara M, De Castro G Jr., Psyrri A, Baste N, Neupane P, Bratland A, et al. Pembrolizumab alone or with chemotherapy versus cetuximab with chemotherapy for recurrent or metastatic squamous cell carcinoma of the head and neck (KEYNOTE-048): a randomised, open-label, phase 3 study. Lancet. 2019;394(10212):1915–1928. doi:10.1016/S0140-6736(19)32591-7.
- Ye Y, Kuang X, Xie Z, Liang L, Zhang Z, Zhang Y, Ma F, Gao Q, Chang R, Lee HH, et al. Small-molecule MMP2/MMP9 inhibitor SB-3CT modulates tumor immune surveillance by regulating PD-L1. Genome Med. 2020;12(1):83. doi:10.1186/s13073-020-00780-z.
- Gu J, Zhang J, Huang W, Tao T, Huang Y, Yang L, Yang J, Fan Y, Wang H. Activating miRNA-mRNA network in gemcitabine-resistant pancreatic cancer cell associates with alteration of memory CD4+ T cells. Ann Transl Med. 2020;8(6):279. doi:10.21037/atm.2020.03.53.
- McBride S, Sherman E, Tsai CJ, Baxi S, Aghalar J, Eng J, Zhi WI, McFarland D, Michel LS, Young R, et al. Randomized phase II trial of nivolumab with stereotactic body radiotherapy versus nivolumab alone in metastatic head and neck squamous cell carcinoma. J Clin Oncol. 2021;39(1):30–37. doi:10.1200/JCO.20.00290.
- Xiao C, Song F, Zheng YL, Lv J, Wang QF, Xu N. Exosomes in head and neck squamous cell carcinoma. Front Oncol. 2019;9:894. doi:10.3389/fonc.2019.00894.
- Poggio M, Hu T, Pai CC, Chu B, Belair CD, Chang A, Montabana E, Lang UE, Fu Q, Fong L, et al. Suppression of Exosomal PD-L1 induces systemic anti-tumor immunity and memory. Cell. 2019;177(2):414–27 e13. doi:10.1016/j.cell.2019.02.016.
- Noman MZ, Parpal S, Van Moer K, Xiao M, Yu Y, Viklund J, De Milito A, Andersson M, Andersson M, Amaravadi RK, et al. Inhibition of Vps34 reprograms cold into hot inflamed tumors and improves anti–PD-1/PD-L1 immunotherapy. Sci Adv. 2020;6(18):eaax7881. doi:10.1126/sciadv.aax7881.
- Lawson KA, Sousa CM, Zhang X, Kim E, Akthar R, Caumanns JJ, Yao Y, Mikolajewicz N, Ross C, Brown KR, et al. Functional genomic landscape of cancer-intrinsic evasion of killing by T cells. Nature. 2020;586(7827):120–126. doi:10.1038/s41586-020-2746-2.
- Yamamoto K, Venida A, Yano J, Biancur DE, Kakiuchi M, Gupta S, Sohn ASW, Mukhopadhyay S, Lin EY, Parker SJ, et al. Autophagy promotes immune evasion of pancreatic cancer by degrading MHC-I. Nature. 2020;581(7806):100–105. doi:10.1038/s41586-020-2229-5.
- Han C, Chen T, Yang M, Li N, Liu H, Cao X. Human SCAMP5, a novel secretory carrier membrane protein, facilitates calcium-triggered cytokine secretion by interaction with SNARE machinery. J Immunol. 2009;182(5):2986–2996. doi:10.4049/jimmunol.0802002.
- Kweon Y, Rothe A, Conibear E, Stevens TH. Ykt6p is a multifunctional yeast R-SNARE that is required for multiple membrane transport pathways to the vacuole. Mol Biol Cell. 2003;14(5):1868–1881. doi:10.1091/mbc.e02-10-0687.
- Naydenov NG, Joshi S, Feygin A, Saini S, Litovchick L, Ivanov AI. A membrane fusion protein, Ykt6, regulates epithelial cell migration via microRNA-mediated suppression of junctional adhesion molecule A. Cell Cycle. 2018;17(14):1812–1831. doi:10.1080/15384101.2018.1496755.
- Fletcher SJ, Rappoport JZ. The role of vesicle trafficking in epithelial cell motility. Biochem Soc Trans. 2009;37(5):1072–1076. doi:10.1042/BST0371072.
- Kessenbrock K, Plaks V, Werb Z. Matrix metalloproteinases: regulators of the tumor microenvironment. Cell. 2010;141(1):52–67. doi:10.1016/j.cell.2010.03.015.
- Lee SB, Park YS, Sung JS, Lee JW, Kim B, Kim YH. Tumor suppressor miR-584-5p inhibits migration and invasion in smoking related non-small cell lung cancer cells by targeting YKT6. Cancers (Basel). 2021;13(5). doi:10.3390/cancers13051159.
- Derynck R, Turley SJ, Akhurst RJ. TGFbeta biology in cancer progression and immunotherapy. Nat Rev Clin Oncol. 2021;18(1):9–34. doi:10.1038/s41571-020-0403-1.
- Cillo AR, Kurten CHL, Tabib T, Qi Z, Onkar S, Wang T, Liu A, Duvvuri U, Kim S, Soose RJ, et al. Immune landscape of viral- and carcinogen-driven head and neck cancer. Immunity. 2020;52(1):183–99 e9. doi:10.1016/j.immuni.2019.11.014.