
 ?Mathematical formulae have been encoded as MathML and are displayed in this HTML version using MathJax in order to improve their display. Uncheck the box to turn MathJax off. This feature requires Javascript. Click on a formula to zoom.
ABSTRACT
γδ T lymphocytes diverge from conventional T CD8 lymphocytes for ontogeny, homing, and antigen specificity, but whether their differentiation in tumors also deviates was unknown. Using innovative analyses of our original and ~150 published single-cell RNA sequencing datasets validated by phenotyping of human tumors and murine models, here we present the first high-resolution view of human γδ T cell differentiation in cancer. While γδ T lymphocytes prominently encompass TCRVγ9 cells more differentiated than T CD8 in healthy donor’s blood, a different scenario is unveiled in tumors. Solid tumors and lymphomas are infiltrated by a majority of TCRVγnon9 γδ T cells which are quantitatively correlated and remarkably aligned with T CD8 for differentiation, exhaustion, gene expression profile, and response to immune checkpoint therapy. This cancer-wide association is critical for developing cancer immunotherapies.
Introduction
The presence and functional differentiation of cytotoxic tumor-infiltrating lymphocytes (TILs) is critical for the clinical outcome of cancer patients. Although T CD8 TILs are associated with favorable prognosis in all types of cancers, little is known about other cytotoxic TILs of γδ T lineage. Human γδ T cells are CD4−CD8− T lymphocytes expressing either TCRVδ2 or TCRVδ1/3 chains prominently paired with TCRVγ9 or TCRVγ2/3/4/5/8 (TCRVγnon9), respectively. On the one hand like T CD8 cells, circulating γδ T lymphocytes differentiate into naïve (Tn), central memory (Tcm), effector memory (Tem), and terminally differentiated effector memory CD45Ra+ (Temra) cells.Citation1 Similarly, both can infiltrate tumors and mediate cytotoxic functions important for antitumor immunity. On the other hand, γδ T lymphocytes differ from conventional T CD8 by tissue distribution, relative abundance, and a more pleiotropic immunobiology.Citation2 Unlike T CD8, γδ T cells react to TCR-independent and TCR-dependent stimuli that differ notably from major histocompatibility complex (MHC)-restricted peptides. Peripheral TCRVγ9 γδ T lymphocytes are specific for phosphoantigen-sensing butyrophilins, while tissular TCRVγnon9 γδ T cells recognize more diversified antigens.
Whether T CD8 and γδ T lymphocytes infiltrating tumors are somehow associated remains unclear, but it is important to develop and monitor γδ-targeted cancer immunotherapy.Citation3 By deconvoluting 10,000 tumors from 55 cancer types, we and others have previously found that the abundance of TCRVγ9 TILs is unrelated to that of TCRαβ TILs, varies considerably across individuals and cancers, and is associated with better outcomes in cancers.Citation4–6 Likewise, the presence, function, and potential of TCRVγnon9 cells which represent another prominent subset of γδ TILs are demonstrated in different human tumors.Citation7–9 So far, however, neither the general landscape of both subsets of cytolytic γδ TILs nor their putative link with the T CD8 had been characterized both at the single cell level and at a cancer-wide scale.
To address this issue, the characterization of single-cell transcriptomes from γδ TILs requires to identify exhaustively and selectively these cells in multiple scRNAseq datasets from different human tumors. Although theoretically only the γδ T lymphocytes express a cell surface γδTCR, other cell subsets do actually express some level of TCRγ or TCRδ mRNAs. Both TCRαβ T CD8 lymphocytes and NK cells also express either of the TRDC, TRGC1, or TRGC2 genes, imposing the use of a multigene signature rather than single genes to reliably identify γδ T lymphocytes only.Citation10 Here, we incepted a ‘score and gate’ strategy that significantly improves the digital purification of γδ T lymphocytes from scRNAseq datasets, and developed a cell pseudotime-based visualization of differentiation trajectories. With the γδ T and the T CD8 lymphocytes extracted from ~150 human samples of PBMC and tumor biopsies, the pseudotimed differentiation trajectories of these lineages revealed their strikingly contrasting hallmarks in blood and cancer.
Results
Circulating γδ T are more differentiated than T CD8 lymphocytes in healthy individual’s blood
From seven scRNAseq datasets of healthy donor’s PBMC and γδ T lymphocytes cell-sorted from PBMC,Citation10 (n = 6,122) γδ T lymphocytes were digitally extracted by ‘score and gate’ (Supplemental Data Figure S1) (Methods). Then, a differentiation trajectory of these extracted cells was computed, and the trajectory’s principal components were projected onto the linearized pseudotime axis to visualize a pseudotimed trajectory (Methods). The pseudotimed differentiation trajectory of peripheral blood γδ T lymphocytes comprised 14 milestones () in which TCRVγ9 were prominent over TCRVγnon9 cells, as expected (not shown). This trajectory was anchored by expression of Tn genes including the lymph node homing receptor CCR7Citation11 and the TCF1 differentiation transcription factor-encoding gene TCF7,Citation12 which peaked in the M1, M2 milestones. Further M3-M7 displayed intermediate levels of Tn and Tem gene expression, a defining hallmark of Tcm lymphocytes.Citation13,Citation14 The Tcm M6 and M7 upregulated both Tn (CD27, CD28, SELL, IL7R) and tissue migration genes (CD44, CXCR3, CXCR4). The Tem milestones M10-M11 included activated cells (IFNG, CCL5), and cytotoxic Tem cells (NKG7, PRF1, GZMA, GZMB, GZMM, FASLG) in M10-M13. The maximal expression of FCGR3A (CD16 marker), PRF1, and GZM genes defined the Temra cells,Citation15 in M14. The exhaustion transcription factor TOXCitation16 and immune checkpoint genes LAG3, TIGIT, and PDCD1 were weakly expressed in control γδ T cells (). When projected onto the trajectory, the scores for naïve (Tn) and effector (Teff) gene signatures evolved smoothly and inversely, reflecting the transcriptional progression along aging from naïve to Temra cells (). Projecting on this trajectory, several published T CD8 differentiation signatures (Table S1) confirmed the differentiation stage of each milestone (Supplemental Data Figure S2), whose ontogeny was validated by the dendrogram of milestones ().
Figure 1. Circulating γδ T are more differentiated than T CD8 lymphocytes in most healthy individual’s blood. a, pseudotimed trajectory of PBMC-derived γδ T cells. Cell color key: pseudotime-ordered milestones. b, mean of gene expression per milestone. Genes shown blue and red: naïve (Tn) and effector (Teff) signatures, respectively. c, Single cell scores for Tn and Teff signatures across the trajectory. d, dendrogram of milestones (centroids, same color key as a) overlaid to the pseudotimed trajectory showing all γδ T cells (gray dots), marker genes, trajectory (dark line), and differentiation direction (lines). e-h, same as a-d for T CD8 cells extracted from the same PBMC. i, rates of γδ T and T CD8 cells at each differentiation stage. Abbreviations: Tn: naïve T, Tcm: central memory T, Teff: T effector, Tcm-mig: migration-prone central memory T, Tem: effector memory T, Tem-act: activated effector memory T, Tem-cyto: cytotoxic effector memory T, Temra: effector memory CD45RA T, Tscm: stem-like central memory T, Tpex: progenitor exhausted-like T
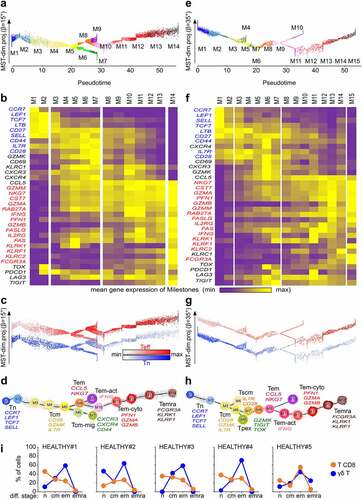
With 15 milestones, the pseudotimed trajectory of the (n = 3,680) PBMC-derived T CD8 lymphocytes approximated that of γδ T cells (), showing cells of stem central memory profile (IL7R, CD28)Citation17 in Tcm M4, and cells with progenitor exhausted-like (Tpex) profile (CD95, GZMK, TOX, TIGIT)Citation18 in M6. The activated Tem cells (IFNG) up-regulated PDCD1 and LAG3 in M11, while the T CD8 Temra (FCGR3A) cells peaked at final M15 instead of final M14 in PBMC (). These identifications were supported by projecting the above Tn, Teff, and other published signatures (, Supplemental Data Figure S3) and by the dendrogram of T CD8 milestones ().
Furthermore, (n = 137) γδ T and (n = 725) T CD8 lymphocytes were extracted from our CITEseq dataset of healthy donor’s PBMC immunostained for differentiation markers,Citation19 and were mapped onto the above trajectories. Their differentiation stages determined by the cell surface CD45RA and CD62L immunophenotypes were consistent with those assigned by gene signatures (Supplemental Data Figure S4). Reflecting distinct biologies and antigen specificities, however, the proportions of cells at each differentiation stage differed between the lineages and across individuals: γδ T were prominently Tem, while Tn predominated more often among T CD8 (, Supplemental Data Figure 4c). Therefore, in healthy adults PBMC, the γδ T are generally more advanced than T CD8 lymphocytes on their respective differentiation trajectories.
Convergent differentiations of γδ T and T CD8 lymphocytes infiltrating tumors
Then, to compare the differentiation hallmarks of γδ T and T CD8 lymphocytes infiltrating tumors (TILs), we performed 3ʹ chemistry scRNAseq of malignant lesions from (n = 3) splenic marginal zone lymphoma (SMZL) (GSE175785), and (n = 4) ovarian carcinoma (OVCAR) (GSE148162) cancer patients. Additional scRNAseq datasets from (n = 129) additional human tumors of various cancer types were also downloaded (summarized in Table S2), normalized, and integrated for comparison (Methods). Altogether, a total of (n = 4,648) γδ T and (n = 45,174) T CD8 TILs were extracted from a total of 136 tumors (Tables S3–S6), and analyzed as above (Supplemental data).
The tumors richest in γδ T TILs corresponded to the richest in T CD8 TILs (Fischer Exact p = .002), and the richest in TCRVγ9 were also the richest in TCRVγnon9 cells (Fischer Exact p = .0001). The trajectories of each lineage of TILs superimposed to those of PBMC (), but some milestones enriched in cancer revealed that both lineages of TILs () were more differentiated than the PBMC (). The cell counts of γδ T and T CD8 TILs were strongly correlated (Pearson r = 0.7–0.99) in most cancer types except in lung carcinoma (LUAD) and melanoma (MEL). In Hodgkin’s lymphoma (HL) and head and neck carcinoma (HNSCC), the viral status of patients unveiled a higher correlation of the γδ T and T CD8 TILs counts in the EBV-positive and HPV-positive, respectively, than in their negative counterparts (Supplemental Data Figure 5).
Figure 2. Memory γδ T and CD8 T cells are enriched in 136 human tumors from 11 cancer types. a, pseudotimed trajectories of TILs (red) of the (n = 4,648) γδ T and (n = 45,174) T CD8 cells featuring their dendrogram of milestones, overlaid to their PBMC-derived counterpart (green) shown on their respective trajectory. b, Rates of γδ T (blue) and T CD8 (orange) TILs with the specified differentiation stage in representative tumor samples. c, TIL cell counts and rates in each tumor sample (colored by cancer type). d, bubble plot of Tex and Ttrm cell counts per tumor sample, showing cancer type (color key as c), and infiltration pattern. e, representative example of trajectory maps of TILs from the inflamed tumor HNSCC#26, overlaid on the PBMC-derived cells (gray). Color key: TCRVγ9 cells (light blue), Tex TCRVγ9 cells (dark blue), TCRVγnon9 cells (orange), Tex TCRVγnon9 cells (dark red), T CD8 (yellow), Tex T CD8 (black). f, rates of Tex cells per differentiation stage and T cell lineage. Cell counts are indicated. g, violin plots and single cell scores of glycolytic gene enrichment in exhausted and non-exhausted cells from the specified group (Mann–Whitney P values). h, association of exhaustion with tissue residency in the Tcm and Tem stages of T γδ and T CD8 TILs (χ2 P values), absolute counts are specified. Abbreviations: Tn: naïve T, Tcm: central memory T, Tem: effector memory T, Temra: effector memory CD45RA T, Tex: exhausted T, Ttrm: tissue-resident memory
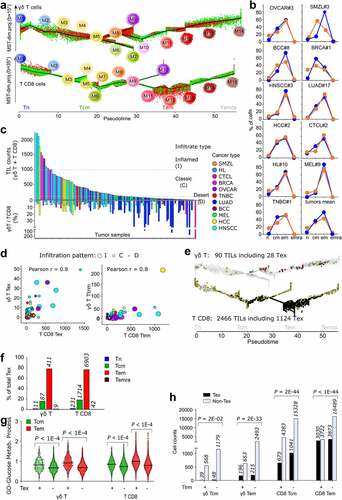
Classifying the tumor infiltration extents by TIL cell counts (Methods) indicated that the OVCAR and HNSCC were frequently inflamed (I) while the SMZL and hepatosplenic carcinoma (HCC) had classic (C) infiltrates, contrasting with the immune deserts (D) more frequent in many solid tumors (e.g. LUAD, MEL). The γδ T/T CD8 TIL ratio decreased from desert to inflamed infiltrates (mean D: 24%, C:10%, I: 5%) (, Table S2b). Identifying the Tex and Ttrm cells in all tumors (Methods) showed their respective rates were correlated between the two lineages (Pearson r = 0.8 in both cases) (). Confirming recent reports,Citation7–9 the majority of γδ TILs cancer-wide was of TCRVγnon-9 subtype, reflecting the extra-lymphoid tropism of this subset (, Table S2b). Combining trajectory and signature analyses revealed that, like Tex T CD8 TILs, all the Tex γδ TILs displayed Tem or Tcm differentiation stages (, f). Comparatively to their non-exhausted counterparts, these γδ T and T CD8 Tex cells shared a signature of 14 up-regulated genes involved in T cell exhaustion (Supplemental Data Figure 6a, b). These lymphocytes were also more glycolytic and more abundant among, but not restricted to, the Ttrm cells (, h, Supplemental Data Fig.6 c). In the non-exhausted compartment, the few Tn and early Tcm γδ TILs presented gene signatures of resting unexpanded T CD8 TIL clones (tumor singletons),Citation20 and the most mature Tem γδ T TILs had signatures of peripherally expanded large T CD8 clonesCitation21 associated with response to immune checkpoint blockade (ICB) therapyCitation20,Citation22 (Supplemental Data Figure 6c, d). As a result, the single-cell composition of all cancer samples showed that the differentiated states of γδ T and T CD8 were far more coherent in TILs than in PBMC.
Ex vivo immunophenotypes of γδ T and T CD8 TILs are correlated
To validate these conclusions, we obtained tumor biopsies from five patients with untreated ovarian cancer (OVCAR, n = 2), head and neck squamous cell carcinoma (HNSCC, n = 1) and cervical cancer (CC, n = 2), isolated their TILs, and immunostained the cell surface markers of γδ T and T CD8 lymphocytes for flow cytometry analysis.
Consistent with the scRNAseq data, both lineages of TILs from these lesions were prominently CCR7−CD45RA− Tem cells (). In these epithelial cancers, the tumor antigen-specific Tex CD8 TILs associated with response to ICB are highly cytotoxic PD-1hiTIM-3+ cells co-expressing CD39 and Ttrm markers.Citation23 So, we analyzed these features at the cell surface of the γδ T and T CD8 TILs from the above biopsies, and found sizable fractions of PD-1hiTIM-3+ cells and of PD-1hiCD39+ cells among both lineages (). Despite the previously depicted variability of TILs across tumors (), the samples with high Tex rates in T CD8 TILs had also high Tex rates in γδ T TILs (Methods) and the same applied for samples with low Tex rates (). In all biopsies, both the CD8 T and γδ T lymphocytes encompassed PD-1hiTIM-3+ and PD-1hiCD39+ cells, and across these samples, their respective rates of T CD8 and γδ T TILs were correlated ().
Figure 3. The ex vivo phenotype of tumor-infiltrating γδ T and CD8 T lymphocytes consists of similarly differentiated cells a, right: Cell surface CCR7 and CD45RA phenotype of the γδ T and T CD8 TILs from a freshly biopsied HNSCC tumor, and differentiation stages in this tumor. Left: Rates of Tn, Tcm, Tem, and Temra cells in γδ T and T CD8 lineages from the five freshly biopsied tumors (means from two independent experiments). b, cell surface phenotype of PD-1 versus TIM-3 (left) and PD-1 versus CD39 (right) in γδ T and T CD8 TILs from the specified patients. Right: composite of results for rates of PD-1hiTIM-3+ and PD-1hiCD39+ cells among the γδ T and in T CD8 TILs (shown are results from three independent experiments from the five biopsies). c, Pearson correlation between the specified cells (same patients as above). d, e, single cell suspensions from TC1-engrafted murine HNSCC tumors (n = 12) were stained ex vivo for murine CD3, CD4, CD8, pan-TCRγδ, CD45.2, PD-1, TIGIT, CTLA-4 and TIM-3 and analyzed by flow cytometry. d, PD-1 versus TIM-3 expression in γδ T (top) and T CD8 (bottom) TILs from one mouse (representative result). e, proportions of subpopulations expressing the 16 possible combinations of PD-1, TIGIT, CTLA-4 and TIM-3 immune checkpoints in γδ T (top) and T CD8 (bottom) TIL. The five higher median proportions of TIL subpopulations are represented for γδ T (blue) and T CD8 TIL (orange). Composite of results means and sd. Abbreviations: Tn: naïve T, Tcm: central memory T, Tem: effector memory T, Temra: effector memory CD45RA T, Tex: exhausted T, Ttrm: tissue-resident memory
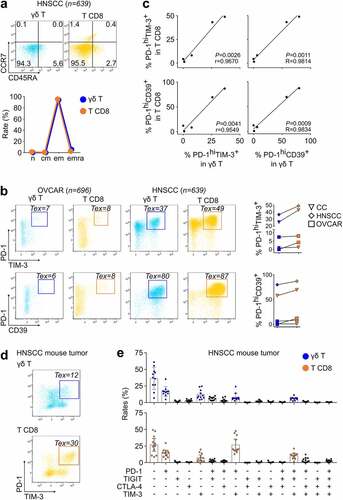
We further analyzed (n = 12) mice from a syngeneic murine model of HNSCC obtained by orthotopically implanting the lung carcinoma TC1 cells retrovirally transduced to express HPV16 E6/E7 antigens.Citation23 The TILs were isolated from established tumors for immunostaining and flow cytometry analyses. These assays showed the emergence of Tex γδ T and T CD8 TILs at the same time points of growth development, and the rates of PD-1hiTIM-3+ Tex cells in these γδ T and in T CD8 TILs were correlated (). In these mice, of the 16 possible co-expression patterns of the PD-1, TIGIT, CTLA-4, and TIM-3 immune checkpoints,Citation23 the same 5 phenotypic patterns predominated among both γδ T and T CD8 TILs (). Collectively, these ex vivo data confirmed the correlated differentiation patterns of γδ T and T CD8 TILs.
Both T CD8 and γδ T TILs are impacted by ICB therapy
The convergent differentiation of intratumoral γδ T and T CD8 lymphocytes reported above prompted us to investigate whether γδ T TILs are as affected as T CD8 TILs to immune checkpoint blocking (ICB) therapy. We downloaded two published scRNAseq datasets of 21 tumors from (n = 11) BCCCitation22 and (n = 10) MELCitation24 patients-derived tumor biopsies sampled before and after ICB treatment. Their γδ T and T CD8 TILs were extracted as above, mapped on their respective differentiation trajectory, and analyzed with regard to patient’s clinical response, tumor infiltration pattern, and infiltrate’s reactivity to treatment (post-treatment TIL counts increase) (Methods).
In all samples, the T CD8 outnumbered the γδ T cells (). The pre-treated BCC lesions were more infiltrated than those of MEL (mean: 295 versus 86 TILs, respectively), and were more reactive to treatment (BCC: 8/11 reactive, mean counts: 306 (pre)/785 (post), MEL: 4/10 reactive, mean counts: 73 (pre)/149 (post)) (). In most BCC, the treatment increased the cell counts for both lineages and differentiation stages, including Tex, without affecting their relative rates of Tn, Tcm, Tem, and Temra cells (, c). Although the prominently desert infiltrates of MEL hampered further conclusions, the BCC results showed that ICB therapy strengthens the association of tumor infiltrating T CD8 and γδ T lymphocytes (Pearson r = 0.77 pre-Tt, 0.95 post-Tt). Among these latter, however, although similar counts of TCRVγ9 and TCRVγnon9 γδ cells infiltrated the pretreated BCC and MEL (on average 2.5 cells/pre-Tt sample), the TCRVγnon9 subset increased more significantly after therapy (on average: 5.3 TCRVγnon9 and 3.6 TCRVγ9 cells/post-Tt sample, Student p = .04).
Figure 4. Both γδ T and CD8 T TILs respond to anti-PD1 therapy in patients with cutaneous cancers. a, summary of characteristics and TIL counts extracted from the specified BCC and MEL samples. Inflamed (dark red), classic (pink), desert infiltrates (white). b, representative examples of inflamed (BCC#009), classic (BCC#001), and desert (MEL#008) pre-treatment infiltrate patterns. The T TILs extracted from each specified tumor are overlaid on their respective pseudotimed trajectory (gray: control blood cells of the corresponding lineage; TCRVγ9 cells (light blue), Tex TCRVγ9 cells (dark blue), TCRVγnon9 cells (orange), Tex TCRVγnon9 cells (dark red), T CD8 (yellow), Tex T CD8 (black). Comparison of BCC samples before and after ICB treatment for: c, correlation of T CD8 and γδ T cell counts, d, distribution of differentiation stages in T CD8 and γδ T TILs. Abbreviations: Tn: naïve T, Tcm: central memory T, Teff: T effector, Tcm-mig: migration-prone central memory T, Tem: effector memory T, Tem-act: activated effector memory T, Tem-cyto: cytotoxic effector memory T, Temra: effector memory CD45RA T, Tscm: stem-like central memory T, Tpex: progenitor exhausted-like T
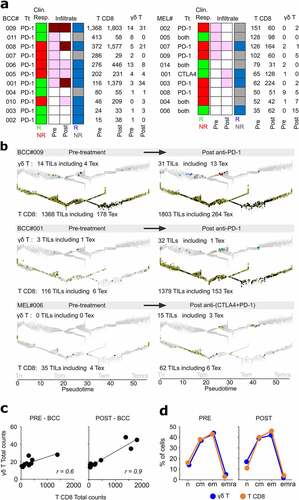
Finally, the patient’s clinical responses did not correlate to either of i) γδ T and/or T CD8 TIL counts alone or together, ii) TIL counts per milestone, iii) pre-treatment infiltration pattern, or iv) infiltrate reactivity to treatment, taken alone. Thus, beyond confirming that ICB therapy increases the tumor-infiltrating T CD8 and Tex regardless of clinical outcome,Citation22 our results demonstrated that such treatments affected the γδ T as well as T CD8 TILs.
Discussion
Understanding whether the functional differentiation of tumor-infiltrated γδ T lymphocytes is similar or unrelated to that of the T CD8 compartment is critical to implement γδ T cell-targeted cancer therapies. Here, we provided the most comprehensive cancer-wide atlas of these lymphocytes visualized in their continuous dynamics of differentiation. Thanks to the high resolution of pseudotimed trajectories, our study refined more and subtler transitions than the former four Tn-to-Temra stages of differentiationCitation15,Citation25 in γδ T lymphocyte and T CD8 lymphocytes. By quantifying each cell’s progression along a continuous series of differentiation states, pseudotime represents a transform of true chronological time albeit through non-constant scales.Citation26–28 How explicit time is quantitatively converted into T cell pseudotime remains to be determined, but the related sizes of the γδ T and T CD8 trajectories suggests both lineages display the same time transform. Nonetheless, the ‘public’ trajectory paved here by γδ T lymphocytes from ~150 healthy and diseased individuals (Tables S3, S5) constitutes a reference roadmap of γδ T cell differentiation. Upon direct integrationCitation29 of newer γδ T cells from any other scRNAseq dataset, each single cell coordinates on this trajectory will define its differentiation hallmarks, allowing automated characterizations based on this resource.
Although well characterized in the mouse,Citation30 the differentiation of peripheral human γδ T cell has remained less investigated over the last decade. A linear sequence of four successive and non-overlapping Tn to Temra stages initially established for TCRVγ9 cellsCitation1 was assumed to also apply for TCRVγnon9 cells. This model was validated recently at the single cell level,Citation10 but neither its pseudotime scale nor milestones were known. Here, these features were defined for both subsets, and enlighted several subtle molecular transitions among Tcm and Tem toward stem-like, migration-prone, and exhausted cells, which so far were only characterized in the T CD8 lineage. Hence, most if not all T CD8 differentiation stages also exist in the TCRVγ9 and TCRVγnon9 subsets of γδ T lymphocytes. These subsets indeed have different tropisms at the steady state, with the predominance of TCRVγ9 cells in the blood and TCRVγnon9 cells in extra-lymphoid tissues.Citation31 This repartition disappears in tumors, however, where the TCRVγnon9 γδ TILs predominate in all (non-)hematopoietic cancer types.Citation7–9 Viral infections are major drivers of peripheral differentiation of T CD8 and γδ T lymphocytes. Thus, the locally phased differentiation of both γδ T and T CD8 lymphocytes strongly suggests a functional convergence toward effective antitumor immunity.Citation4,Citation7,Citation32 Substantiating this view, the highest correlation of γδ T and T CD8 TILs cell counts and differentiation observed in virus-positive patients is consistent with the repertoire of T CD8 TILs specificities prominently directed to viral antigens.Citation33 It is tempting to speculate that this functional convergence scenario underlies the better outcome of HPV+ over HPV− HNSCC patients,Citation34 the Sars-CoV2-induced remission in EBV+ HL,Citation35 and the generally lower risk of cancer in CMV+ than CMV− kidney transplant recipients.Citation36
Since previous transcriptomic deconvolutions of human cancers showed a dissociation of γδ T and αβ T TILs,Citation4–6 the tight association of γδ T and T CD8 TILS unveiled here was unexpected. This discrepancy reflects not only the better resolution of scRNAseq transcriptomics than artificial intelligence-driven inferences from bulk microarray deconvolutions, but also the difference between T CD8 alone and the total αβ T compartment. Nevertheless, the coordination of γδ T and T CD8 TILs reported here might also reflect a broader orchestration, possibly involving a BTN3A1-mediated mechanism.Citation37 Furthermore, since T cell differentiation ensues antigenic activation, the advanced differentiation of TCRVγ9 and TCRVγnon9 γδ TILs questions the nature of their driving stimuli in tumor. Whether these are metabolites like bacterial phosphoantigens,Citation38 viral ligands,Citation39 stress-induced antigens,Citation40 or even HLA-restricted mutational peptide neoantigens remains to be determined more systematically.
The correlated exhaustions of intratumoral γδ T and T CD8 lymphocytes reflect a sustained activation and microenvironmental pressure in both cases. As a consequence of this coherence, the tumor infiltration by both cell types was affected by checkpoint blockade therapies. Although these are critical determinants of outcome, neither T CD8 TILs pre- or post-treatmentCitation41 nor their exhaustion statusCitation42–44 suffice to robustly predict the clinical responses of cancer patients. Hence, it is not surprising that the treatment-induced changes of γδ T and T CD8 TIL cell counts, alone or together, did not correlate either. In addition to immunotherapy-induced changes in the functional state of TILs,Citation45 the anatomical location of metastases, and tumor mutation of the IFNγ signaling or antigen-presentation pathwaysCitation46 are among the other determinants of therapeutic responses. Nevertheless, our recurrent detection of post-treatment TCRVγ9 γδ TILs in tumors without such cells before treatment suggests that ICB therapy harnesses a circulating γδ T cell contingent to the cancer immunity cycle.Citation47 Since therapeutic antibodies refuel tumor lesions with fresh, functional, and expanded lymphocytes from peripheral blood,Citation20 it is conceivable that the recruitment of any circulating subset of expanded γδ T lymphocytes allows intratumoral collaborations of synchronous γδ T and T CD8 effectors.Citation32
Overall, our study builds a fundamental framework to characterize γδ T lymphocyte differentiation in human cancers, and represents an invaluable resource for the emerging cancer immunotherapies targeting γδ T lymphocytes.
Materials and Methods
Clinical patient sample collection
The SMZL samples were collected at the Institut Universitaire du Cancer de Toulouse-Oncopole (IUCT-O) and processed at the CRB Cancer from Hôpitaux de Toulouse, following the standard ethical procedures (Declaration of Helsinki), after obtaining written informed consent from all patients and upon approval by the Institutional Review Board (nDC-2009-989). The carcinoma samples were collected from patients with head and neck squamous cell carcinoma, ovarian cancer, and cervical cancer at the time of surgery at the Institut Universitaire du Cancer de Toulouse-Oncopole (IUCT-O) in accordance with the Declaration of Helsinki, upon approval by the Institutional Review Board (nDC-2016-2656 and DECIdE protocol, NCT03958240) and signed informed consent.
Mouse models
Female C57BL/6 mice, 7 weeks old, were purchased from Janvier Laboratory (Le Genest-Saint-Isle, France) and then maintained in pathogen-free facilities for experiments and for the specified analyses. Experimental protocols were approved by the Regional Ethic Committee of Toulouse Biological Research Federation (ref C2EA-01, FRBT) and by the French Ministry for Higher Education and Research. The European directive 2010/63/EU was followed for guidelines on animal welfare.
Cells and flow cytometry
Healthy donors PBMC were obtained after Ficoll-Hypaque (GE Healthcare) density centrifugation and cultured in RPMI 1640 medium (Dutscher) supplemented with 10% fetal bovine serum (ThermoFisher Scientific). Human tumor biopsy specimens were weighed, washed with PBS and mechanically disrupted. These preparations were centrifuged on a Ficoll gradient and frozen. When specified in text, T cells were isolated by negative selection using the Human T Lymphocytes Enrichment Set-DM (BD Biosciences) according to the manufacturer’s instructions. TC1 cells expressing the HPV 16 E6 and E7 proteins were developed in the laboratory of T.C. Wu (Johns Hopkins University). Resting PBMC control was processed for immunostaining with the specified antibodies or ADT (Biolegend) for 20 min at room temperature. For intracellular stainings, cells were fixed and permeabilized using the transcription factor staining buffer set (eBioscience) before staining with the proper antibodies or reagent. Used antibodies are listed on the Key Resource Table. Flow cytometry acquisitions were performed on a BD LSR II cytometer (BD Biosciences) and data were analyzed with Cytobank (http://www.cytobank.org).
Single cell RNA sequencing
The Chromium Controller Single-Cell Instrument and Chromium Single Cell 3′ Library & Gel Bead Kit (V3) were used to prepare individually barcoded single-cell RNA-Seq libraries, following manufacturer’s instruction (10x Genomics). Briefly, cells were thawed and viability was improved by using Dead Cell Removal Kit (Miltenyi Biotec). Then, cells were washed twice with calcium and magnesium-free phosphate buffered saline containing 0.04% bovine serum albumin, and re-suspended at a concentration comprised between 700 and 1200 cells/µL (viability>90%) in the same buffer. In the experiment, 10 000 cells of each sample were loaded to obtain a yield comprised between 2000 and 7000 sequenced cells. Reverse transcription was performed on the C1000 Touch Thermal Cycler, and cDNA was amplified for 12 cycles. cDNA quality control and dosage were performed on Fragment Analyzer, and then by PCR. Double-sided size selection of PCR products was performed with SPRIselect Reagent Kit (Beckman Coulter). The sequencing-ready library was cleaned up with SPRIselect beads (Beckman Coulter) and the sequencing was performed on a HiSeq 3000 instrument (Illumina) with a sequencing depth of at least 50,000 reads per cell.
scRNA-seq data pre-processing and QC
The sequencing output bcl2 files were converted to FASTQ format by using cellranger-mkfastq™ algorithm (10x Genomics), and cellranger-count was applied to align to the GRCh38 reference transcriptome and build the (cell, UMI) expression matrix for each sample. Preprocessing, normalization of UMI, and QC were assessed using the R package Seurat.Citation29,Citation48 First, genes that correspond to human leukocyte antigens (HLA) and genes located in chromosome X and Y were removed, and the quality of cells was then determined by the number of detected genes per cell, and the proportion of mitochondrial genes. Additional datasets downloaded from 10x Genomics website, Gene Expression Omnibus (GEO), European Genome-phenome Archive (EGA), and ArrayExpress followed the same preprocessing and QC analyses.
Gene annotations
All gene symbols and protein annotations were from public databases (Uniprot, Genecards, and The Human Protein Atlas for humans) and transcription factors genes were defined as such from the GO annotations.
Integration of PBMC scRNAseq datasets
Here, seven different scRNAseq datasets were assembled to digitally extract control γδ T lymphocytes from PBMC of several healthy individuals. This comprised (n = 8,202) pure γδ T lymphocytes cell-sorted by cell surface TCRVδ1 or TCRVδ2 from the PBMC of n = 3 healthy donorsCitation10 and (n = 25,736) PBMC from four other healthy donors (4k +8k from 10XGenomics-3ʹplatform V2, and 10k +1k from 10XGenomics-3ʹplatform V3 downloaded from 10xGenomics resource). After pre-processing and QC discarding of cell doublets and dying cells, the seven datasets were integrated using Seurat 3.0.Citation29 Briefly, the datasets were normalized together and variable features from each dataset were identified by FinVariable-Data before identification of anchors correspondences across all the datasets, to yield an integrated PBMC dataset containing 26,313 features across n = 25,252 control cells (n = 17,803 PBMC plus n = 7,449 purified γδ T lymphocytes). Principal component analysis (PCA) was performed on this integrated dataset and used to calculate uniform manifold approximation and projection (UMAP), as well as t-distributed Stochastic Neighbor Embedding (t-SNE)Citation49 coordinates. When visualized in UMAP space,Citation50 its main cell types were annotated by expression of the CD14, CD19, CD3D, and NCAM marker genes (Supplemental Data Figure 1a).
Single cell signatures and scores
Integrated and normalized scRNAseq datasets were then scored for the multigene signatures specified in text (Table S1) which were downloaded from the MSigDB (https://www.gsea-msigdb.org/gsea/msigdb/collections.jsp) unless specified otherwise. Each single cell score for each geneset was computed as described.Citation51 Briefly, Single-Cell Signature Scorer computes the score of cell Cj for gene set GSx as the sum of all UMI for all the GSx genes expressed by Cj divided by the sum of all UMI expressed by Cj:
Score of cell Cj for geneset GSx = (∑(UMI)GSx)/(∑(UMI)Cj)Citation1
For further visualization, all cell signatures scores are merged with each cell’s UMAP coordinates using Single-Cell Signature Merger.Citation51
Score and Gate of γδ T and T CD8 cells from PBMC
Based on using single-cell signature scores to identify cells, this procedure allows the selective and exhaustive digital isolation from any scRNAseq dataset of any subset of cells specified by characteristic single-cell scores. The γδ T cell detection, which previously relied on a single-gene signature,Citation10 was improved here by implementing a sequence of positive and negative cell selections from several gene signatures, called ‘Score and Gate.’ The above (n = 25,252) PBMC-extracted cells were scored for the specified gene signatures (Table S1) using Single-Cell Signature ExplorerCitation51 and scores were sequentially visualized on scatterplots by Single-Cell Virtual Cytometer.Citation19 The Score and Gate procedure comprises five sequential gating steps, here applied starting from the (n = 17,803) PBMC sub-dataset alone:
1. Positive selection of double negative cells [= T and NK lineages (n = 11,768)] from the scatterplot of ‘B cell’ and ‘Myeloid cell’ signatures.
2. Scatterplot of ‘B cell’ signature against the addition of ‘CD8AB’ and ‘TCRγδ’ signatures to positively select the double positive cells [= non-CD4 T cells (n = 6,162)].
3. Scatterplot of ‘CD8ab’ signature against ‘TCRα constant gene TRAC’ signature to digitally extract double-positive cells [= αβ T CD8 lymphocytes (n = 3,680)], on the one hand, and negative cells [= γδ T (n = 2,161) plus CD4CD8-double negative αβ T cells], on the other hand.
4. Scatterplot of the addition of ‘CD3 complex’ and ‘TCRα constant gene TRAC’ signatures against the addition of ‘CD3 complex’ and ‘TCRγδ’ signatures to extract the ‘CD3 complex’-‘TCRγδ’ double-positive cells [=γδ T lymphocytes (n = 580, 3% of initial PBMC)].
TCRVγ9 and TCRVγnon9 cell subtyping by compensated scores
Since γδ T lymphocytes express either the TRGC1-encoded TCRVγ9 or the TRGC2-encoded TCRVγnon9 in a mutually exclusive fashion, the extracted γδ T lymphocytes were classified on ‘TRDC, TRGC1ʹ positive cells [=TCRVγ9 cells (n = 312)] or ‘TRDC, TRGC2ʹ positive cells [=TCRVγnon9 cells (n = 268)] using a compensated version of these two signatures. Compensated scores are obtained by multiplying the score of the geneset of interest, here GSSTCRVγ9, by its difference to its complementary geneset (GSSTCRVγ9 minus GSSTCRVγnon9):
GSSTCRVγ9comp = GSSTCRVγ9 * (GSSTCRVγ9 − GSSTCRVγnon9)Citation1
Scatterplots of compensated scores for the two complementary genesets GSSTCRVγ9 and GSS TCRVγnon9 unambiguously identify the TCRVγ9 or TCRVγnon9 subset of each γδ T lymphocyte (Supplemental Data Figure 1b).
Validation of the Score and Gate method of digital extraction
The method was validated on two different scRNAseq datasets: our formely depicted dataset of purified γδ T lymphocytes from three healthy donorsCitation10 and a CITEseq dataset of PBMC from another healthy donor.Citation19 When applied to the (n = 7,449) purified γδ T cell sub-dataset, this same score and gate strategy extracted (n = 5,542) γδ T cells (74% sensitivity). Given their already known TCRVδ1/TCRVδ2 subtype, the TCRVγ9/non9 subdivision delineated (n = 2,328) TCRVγ9Vδ2, (n = 1,993) TCRVγnon9Vδ1, (n = 817) TCRVγnon9Vδ2, and (n = 404) TCRVγ9Vδ1 cells. Notwithstanding the equal rates of annotated TCRVδ1 and TCRVδ2 cells deliberately composing this sub-dataset,Citation10 such results confirmed the prominence of TCRVγ9Vδ2 cells over all the other TCR subsets of blood γδ T, and the preferential pairings of TCRVγ9 (85%) with TCRVδ2, and of TCRVγnon9 (71%) with TCRVγ1 (Supplemental Data Figure 1c). In the UMAP, (n = 5,537 out of the 5,542) extracted γδ T cells are embedded in the T cell clusters (Supplemental Data Figure 1d) showing the γδ T cell detection specificity by score and gate had improved (99.9 vs 95%) over earlier method,Citation10 and successfully extracted those γδ T cells embedded in CD4 and CD8 T cells clusters. Since CITEseq datasets provide both transcriptomes and immune phenotypes of single cells,Citation52 the same score and gate sequence was also applied to our CITEseq dataset of 3k PBMC from a healthy donor (GSE144434).Citation19 This extracted (n = 137) γδ T cells (4.7% of PBMC, encompassing n = 81 TCRVγ9 plus n = 56 TCRVγnon9 cells) of cell surface CD3+CD4−CD8− phenotype, and embedded with T CD8 and NK cells in UMAP (Supplemental Data Figure 7), as expected. These results validated the score and gate method, and the lymphocytes extracted from the CITEseq dataset were integrated into the control datasets. The integrated (cell x gene) matrices of PBMC-derived γδ T and T CD8 single cells are provided in Tables S3, S4, respectively, together with their annotations for pseudotime and differentiation hallmarks in Tables S5, S6.
Extraction of TILs from scRNAseq datasets of tumor samples
The scRNA-seq of tumor lesions from three patients with splenic marginal zone lymphoma (SMZL) were produced for this study, and additional datasets of tumors from other cancers were downloaded from public resources (GEO, EGA, and AE). These encompassed tumor samples from cutaneous T cell lymphoma (CTCL),Citation53 Hodgkin lymphoma (HL),Citation54 lung adenocarcinoma (LUAD)Citation55,Citation56, breast carcinoma (BRCA),Citation57 triple negative breast cancers (TNBC),Citation32 head and neck squamous cell carcinoma (HNSCC),Citation58 hepatocellular carcinoma (HCC),Citation59 basal cell carcinoma (BCC),Citation22 and melanoma (MEL)Citation24 (Table S2). The same score and gate procedure was applied to the pre-processed and quality controlled datasets for digital extraction of (n = 4,648) γδ T and (n = 45,174) T CD8 cells, referred to as TILs. From the CTCL samples, the malignant T lymphocytes were filtered out from TILs by gating out those cells overexpressing the marker gene TOX and the CTCL-specific 17 gene signature.Citation53 The integrated (cell and gene) matrices of both PBMC- and TILs-derived γδ T and T CD8 single cells are, respectively, provided in Tables S3, S4 with their respective annotations in Tables S5, S6.
Trajectory Inference After the digital extraction of γδ T and T CD8 lymphocytes from normal and cancer samples, both control and TILs were integrated, independently for each lineage (γδ T and T CD8), by using Seurat (R package),Citation29 as described above. Next, the γδ T and T CD8 integrated matrices were independently used for maturation trajectory inference using dynverse (collection of R packages), which provides more than 45 different methods for trajectory inference (TI). The TI was calculated following the recommended workflow.Citation60 Briefly, the normalized (log2) of raw expression data, and UMAP coordinates were used as an input. The most suitable and rapid method for our datasets determined by applying ‘guidelines’ function (dynverse on R) was Minimum Spanning Tree (MST) to infer the maturation trajectories of the γδ T and T CD8, independently (‘ti_mst’ function, dynverse on R), with default settings. Additional signatures (‘Tn’ and ‘Teff’) were scored, as described above, and together with the obtained MST attributes: dimension reduction coordinates 1 and 2 (MST1 and MST2), milestones and pseudotime, were used to define the root of the trajectory (‘add_root’ function) of the γδ T and T CD8 lymphocytes. The MST attributes allow multiple visualizations, so the data were visualized through pseudotimed trajectories.
Pseudotimed trajectories
The pseudotimed trajectory is a bidimensional representation of the trajectory inferred for any single cell (p) in which (x,y,z) are the MST coordinates for pseudotime, MST1, and MST2, respectively. The dim_proj method takes each cell’s (x,y,z) from this 3-dimension space (X: pseudotime, Y: MST1, Z: MST2) and projects them in a 2-dimensional plane where pseudotime is one of these dimensions (XoY’). Between the three orthonormal dimensions (XYZ) and the projection plane (XoY’), there is a rotation angle (ZoY’) called β (Supplemental Data Figure 8a). The new projected coordinates (x,y’) of the cell p are calculated as follows:
o’p2 = y2+ z2 (1)
cos(α+β) = o’y’/o’p (2)
So the new Y coordinate y’ of p projection in the plane is:
o’y’ = * cos(α+β) (3)
o’y’ = * cos(arctan(
)+β) (4)
To avoid negative values, the whole trajectory was translated by adding the minimal coordinates (ymin, zmin) of the trajectory cells to the initial (y, z) coordinates:
o’y’ = * cos(arctan((
)+α) (5)
The resulting trajectory using only cell’s coordinates (x, y’) is called pseudotimed trajectory. Of note, although the trajectory itself is independent of the rotation angle β, selecting this latter allows us to optimize visualization of the same trajectory and its eventual branches (Supplemental Data Figure 8b).
Heatmaps
Heatmaps of gene expression level (UMI mean) per milestone were generated with color scale based on the z-score distribution per row, and shown from row min to row max. Heatmaps of multigene signature score per milestone (milestone mean) were generated by computing scores with Single-Cell Signature ExplorerCitation51 and shown by color scale from the z-score distribution per row. Heatmaps of cell counts per milestone were generated as fractions of the row total.
Classifications
The cell classifications Ttrm and Tex were performed by ‘at least one binary’ as follows. The specified single cells were scored for several reference gene signatures (Table S1). For Tex classification, the reference Tex signatures were five published and partially overlapping Tex genesets.Citation16,Citation23,Citation61–63 For each signature, a cutoff was defined as the maximal score of the (n = 3,680) control γδ T CD8 lymphocytes extracted from healthy adults PBMC. This threshold defined the cell’s binary (1: cell score > threshold, 0: otherwise). The Tex cutoffs were: 3.9 for ‘Chihara_IL27_Coinhib_module’;Citation61 0.52 for ‘Alfei_d20_tox’;Citation62 0.22 for ‘Khan_Tox_OverExpressed_genes’;Citation16 0.5 for ‘Tosolini_ NHL_IEGS33ʹ;Citation63 and 0.16 for ‘Balanca_QP_genes’.Citation23 For each TIL, the five Tex binaries were summed, and any TIL with a non-zero sum of binaries was classified Tex. The Ttrm classification was applied likewise using six reference and partially overlapping Ttrm signatures from the literature.Citation20,Citation64 The binarizing cutoffs established with the control T CD8 lymphocytes were: 0.46 for ‘Kumar_13g_Ttrm’; 0.3 for ‘Kumar_3g_Ttrm’;Citation64 3.72 for ‘Wu_Tcellcluster4.1_trm’; 2.6 for ‘Wu_Tcellcluster8.3_trm’; 2.8 for ‘Wu_Tcellcluster8.3b_trm’; 4.2 for ‘Wu_Tcellcluster8.3c_trm’.Citation20 These Ttrm binaries were summed, and any TIL with a non-zero sum of Ttrm binaries was classified Ttrm. The cytolytic T cell infiltrates of tumors were arbitrarily classified by total cytolytic (T CD8 + γδ T) TIL counts as deserts (D, <100 TILs), classic (C, 100–1000 TILs), or inflamed (I, >1000 TILs). The Tex classification from the flow cytometry data was based on both median (PD-1hiTIM-3+)>8% and median (PD-1hiCD39+)>12%. The reactivity of tumor infiltrates (TI) from ICB-treated MEL and BCC patients was classified as TI-R (reactive)/TI-NR (non-reactive) based on the difference of total TIL counts (post–pre-ICB therapy) by TI-R: ∆>0, else TI-NR.
Data visualization
Single-cell Multilayer Viewer, was developed as a serverless software for the visualization of up to 5 layers of information. It is available on GitHub repository: https://github.com/MarionPerrier/scMLV. Single-cell Multilayer Viewer allows us to merge and visualize up to 5 layers of quantitative and qualitative variables, alone and in combination.
Abbreviations
BCC: basal cell carcinoma, BRCA:Breast carcinoma, CC: cervical cancer, CITEseq: cellular indexing of transcriptomes and epitopes by sequencing, CMV: cytomegalovirus, CTCL: cutaneous T cell lymphoma, EBV: Epstein-Barr virus, HCC: hepatocellular carcinoma, HL: Hodgkin’s lymphoma, HNSCC: head and neck squamous cell carcinoma, HPV: human papilloma virus, ICB: immune checkpoint blockade, LUAD: lung adenocarcinoma, MEL: melanoma, OVCAR: ovarian carcinoma, scRNAseq: single-cell RNA sequencing, SMZL: splenic marginal zone lymphoma, Tcm: central memory T, Teff: T effector, Tem: effector memory T, Temra: effector memory CD45RA T, Tpex: progenitor exhausted-like, Tex: exhausted T, TIL: tumor-infiltrated lymphocyte, Tn: naïve T, TNBC: triple-negative breast carcinoma, TnEnCD8: naive-enriched T CD8, Ttrm: tissue-resident memory T.
Competing interests statement
Authors declare no relevant conflict of interest.
Data and code availability
Lead contact Further information and requests for resources and reagents should be directed to and will be fulfilled upon reasonable requests by the lead contact, Jean-Jacques Fournie Email [email protected].
Materials availability This study did not generate new unique reagents.
Data availability The raw data produced in this study are available at Gene Expression Omnibus (GEO) as dataset GSE175785. Published scRNAseq datasets used in this study are available at GEO with the accession numbers: GSE110686, GSE114724, GSE120575, GSE123813, GSE128531, GSE139324, GSE140228; at the European Genome-phenome Archive (EGA) with the accession number: EGAS00001004085; and at the Array Express Archive (AE) with the accession number: E-MTAB-6149. The integrated (cell, UMI) matrices of extracted γδ T and T CD8 are provided as Tables S3, S4 and the corresponding cell annotations are available in Tables S5, S6.
Code and software availability Single-cell Multilayer Viewer (scMLV) developed for this study is available on GitHub repository: https://github.com/MarionPerrier/scMLV
Single-Cell Signature Scorer and Single-Cell Virtual Cytometer are available at: https://sites.google.com/site/fredsoftwares/products. Seurat v3.2.2 is available from the Comprehensive R Archive Network (CRAN) and further details in the installation could be found on https://satijalab.org/seurat/. The collection of R packages (dyno v0.1.2 and tidyverse v1.3.0) is available from Github via devtools, with details for the installation from: https://dynverse.org/.
Author contributions
J.J.F. conceived and designed the study, J.P.C. conceived methods, processed and performed bioinformatic data analyses, generated figures, and wrote the manuscript. M.P and F.P. conceived algorithms. P.G., C.C.B., A.Q.M., and C.V. produced original scRNAseq data, C.C.B., P.G., and D.M.F. performed flow cytometry analyses. C.D. and V.F. generated and analyzed murine models. M.T and F.L. supervised scRNAseq analyses and provided valuable methodological discussions. L.Y., A.M., J.P.D., and C.L. prepared and annotated clinical samples. C.L., M.A., and J.J.F. supervised the study and wrote the paper.
Source data
The raw data produced in this study are available at Gene Expression Omnibus (GEO) with accession number GSE175785, and GSE. The integrated (cell, UMI) matrices of all extracted γδ T and T CD8 are provided as Tables S3, S4, and their corresponding cell annotations are in Tables S5, S6.
Supplemental Material
Download ()12_Table_S4
Download ()11_Table_S4
Download ()10_Table_S4
Download ()9_Table_S4
Download ()8_Table_S4
Download ()7_Table_S4
Download ()6_Table_S4
Download ()5_Table_S4
Download ()4_Table_S4
Download ()3_Table_S4
Download ()2_Table_S4
Download ()1_Table_S4
Download ()1_Table_S3
Download ()2_Table_S3
Download ()3_Table_S3
Download ()4_Table_S3
Download ()Table_S6
Download ()Table_S1.xlsx
Download ()Table_S5
Download ()Table_S2.xlsx
Download ()Acknowledgments
We acknowledge F. Dieli and S. Coffelt for suggestions and critical comments on the manuscript, C Steidl for facilitating access to HL datasets, and CRCT colleagues for helpful discussions.
Supplementary material
Supplemental data for this article can be accessed on the publisher’s website
Additional information
Funding
References
- Dieli F, Poccia F, Lipp M, Sireci G, Caccamo N, Di Sano C, Salerno A. Differentiation of effector/memory Vdelta2 T cells and migratory routes in lymph nodes or inflammatory sites. J Exp Med. 2003;198(3):391–14. doi:10.1084/jem.20030235.
- Hayday AC, Vantourout P. The innate biologies of adaptive antigen receptors. Annu Rev Immunol. 2020;38(1):487–510. doi:10.1146/annurev-immunol-102819-023144.
- Sebestyen Z, Prinz I, Dechanet-Merville J, Silva-Santos B, Kuball J. Translating gammadelta (gammadelta) T cells and their receptors into cancer cell therapies. Nat Rev Drug Discov. 2020;19(3):169–184. doi:10.1038/s41573-019-0038-z.
- Tosolini M, Pont F, Poupot M, Vergez F, Nicolau-Travers ML, Vermijlen D, Sarry JE, Dieli F, Fournie JJ. Assessment of tumor-infiltrating TCRVγ9Vδ2γδlymphocyte abundance by deconvolution of human cancers microarrays. Oncoimmunology. 2017;6(3):e1284723. doi:10.1080/2162402X.2017.1284723.
- Meraviglia S, Lo Presti E, Tosolini M, La Mendola C, Orlando V, Todaro M, Catalano V, Stassi G, Cicero G, Vieni S, et al. Distinctive features of tumor-infiltrating gammadelta T lymphocytes in human colorectal cancer. Oncoimmunology. 2017;6(10):e1347742. doi:10.1080/2162402X.2017.1347742.
- Gentles AJ, Newman AM, Liu CL, Bratman SV, Feng W, Kim D, Nair VS, Xu Y, Khuong A, Hoang CD, et al. The prognostic landscape of genes and infiltrating immune cells across human cancers. Nat Med. 2015;21(8):938–945. doi:10.1038/nm.3909.
- Wu Y, Kyle-Cezar F, Woolf RT, Naceur-Lombardelli C, Owen J, Biswas D, Lorenc A, Vantourout P, Gazinska P, Grigoriadis A, et al. An innate-like Vδ1+γδ T cell compartment in the human breast is associated with remission in triple-negative breast cancer. Sci Transl Med. 2019;11(513):eaax9364. doi:10.1126/scitranslmed.aax9364.
- Mikulak J, Oriolo F, Bruni E, Roberto A, Colombo FS, Villa A, Bosticardo M, Bortolomai I, Lo Presti E, Meraviglia S, et al. NKp46-expressing human gut-resident intraepithelial Vdelta1 T cell subpopulation exhibits high antitumor activity against colorectal cancer. JCI Insight. 2019;4(24). doi:10.1172/jci.insight.125884.
- Foord E, Arruda LCM, Gaballa A, Klynning C, Uhlin M. Characterization of ascites- and tumor-infiltrating gammadelta T cells reveals distinct repertoires and a beneficial role in ovarian cancer. Sci Transl Med. 2021;13(577):eabb0192. doi:10.1126/scitranslmed.abb0192.
- Pizzolato G, Kaminski H, Tosolini M, Franchini DM, Pont F, Martins F, Valle C, Labourdette D, Cadot S, Quillet-Mary A, et al. Single-cell RNA sequencing unveils the shared and the distinct cytotoxic hallmarks of human TCRVdelta1 and TCRVdelta2 gammadelta T lymphocytes. Proc Natl Acad Sci U S A. 2019;116(24):11906–11915. doi:10.1073/pnas.1818488116.
- Girard JP, Moussion C, Forster R. HEVs, lymphatics and homeostatic immune cell trafficking in lymph nodes. Nat Rev Immunol. 2012;12(11):762–773. doi:10.1038/nri3298.
- Zhou X, Yu S, Zhao DM, Harty JT, Badovinac VP, Xue HH. Differentiation and persistence of memory CD8(+) T cells depend on T cell factor 1. Immunity. 2010;33(2):229–240. doi:10.1016/j.immuni.2010.08.002.
- Sallusto F, Geginat J, Lanzavecchia A. Central memory and effector memory T cell subsets: function, generation, and maintenance. Annu Rev Immunol. 2004;22(1):745–763. doi:10.1146/annurev.immunol.22.012703.104702.
- Restifo NP, Gattinoni L. Lineage relationship of effector and memory T cells. Curr Opin Immunol. 2013;25(5):556–563. doi:10.1016/j.coi.2013.09.003.
- Angelini DF, Borsellino G, Poupot M, Diamantini A, Poupot R, Bernardi G, Poccia F, Fournie JJ, Battistini L. FcgammaRIII discriminates between two subsets of Vgamma9Vdelta2 effector cells with different responses and activation pathways. Blood. 2004;104(6):1801–1807. doi:10.1182/blood-2004-01-0331.
- Khan O, Giles JR, McDonald S, Manne S, Ngiow SF, Patel KP, Werner MT, Huang AC, Alexander KA, Wu JE, et al. TOX transcriptionally and epigenetically programs CD8(+) T cell exhaustion. Nature. 2019;571(7764):211–218. doi:10.1038/s41586-019-1325-x.
- Gattinoni L, Speiser DE, Lichterfeld M, Bonini C. T memory stem cells in health and disease. Nat Med. 2017;23(1):18–27. doi:10.1038/nm.4241.
- Galletti G, De Simone G, Mazza EMC, Puccio S, Mezzanotte C, Bi TM, Davydov AN, Metsger M, Scamardella E, Alvisi G, et al. Two subsets of stem-like CD8(+) memory T cell progenitors with distinct fate commitments in humans. Nat Immunol. 2020;21(12):1552–1562. doi:10.1038/s41590-020-0791-5.
- Pont F, Tosolini M, Gao Q, Perrier M, Madrid-Mencia M, Huang TS, Neuvial P, Ayyoub M, Nazor K, Fournie JJ. Single-cell virtual cytometer allows user-friendly and versatile analysis and visualization of multimodal single cell RNAseq datasets. NAR Genom Bioinform. 2020;2(2):lqaa025. doi:10.1093/nargab/lqaa025.
- Wu TD, Madireddi S, De Almeida PE, Banchereau R, Chen YJ, Chitre AS, Chiang EY, Iftikhar H, O’Gorman WE, Au-Yeung A, et al. Peripheral T cell expansion predicts tumour infiltration and clinical response. Nature. 2020;579(7798):274–278. doi:10.1038/s41586-020-2056-8.
- Fairfax BP, Taylor CA, Watson RA, Nassiri I, Danielli S, Fang H, Mahe EA, Cooper R, Woodcock V, Traill Z, et al. Peripheral CD8(+) T cell characteristics associated with durable responses to immune checkpoint blockade in patients with metastatic melanoma. Nat Med. 2020;26(2):193–199. doi:10.1038/s41591-019-0734-6.
- Yost KE, Satpathy AT, Wells DK, Qi Y, Wang C, Kageyama R, McNamara KL, Granja JM, Sarin KY, Brown RA, et al. Clonal replacement of tumor-specific T cells following PD-1 blockade. Nat Med. 2019;25(8):1251–1259. doi:10.1038/s41591-019-0522-3.
- Balanca CC, Scarlata CM, Michelas M, Devaud C, Sarradin V, Franchet C, Martinez Gomez C, Gomez-Roca C, Tosolini M, Heaugwane D, et al. Dual relief of T-lymphocyte proliferation and effector function underlies response to PD-1 blockade in epithelial malignancies. Cancer Immunol Res. 2020;8(7):869–882. doi:10.1158/2326-6066.CIR-19-0855.
- Sade-Feldman M, Yizhak K, Bjorgaard SL, Ray JP, De Boer CG, Jenkins RW, Lieb DJ, Chen JH, Frederick DT, Barzily-Rokni M, et al. Defining T cell states associated with response to checkpoint immunotherapy in melanoma. Cell. 2018;175(4):998–1013e1020. doi:10.1016/j.cell.2018.10.038.
- Caccamo N, Meraviglia S, Ferlazzo V, Angelini D, Borsellino G, Poccia F, Battistini L, Dieli F, Salerno A. Differential requirements for antigen or homeostatic cytokines for proliferation and differentiation of human Vgamma9Vdelta2 naive, memory and effector T cell subsets. Eur J Immunol. 2005;35(6):1764–1772. doi:10.1002/eji.200525983.
- Alpert A, Moore LS, Dubovik T, Shen-Orr SS. Alignment of single-cell trajectories to compare cellular expression dynamics. Nat Methods. 2018;15(4):267–270. doi:10.1038/nmeth.4628.
- Trapnell C, Cacchiarelli D, Grimsby J, Pokharel P, Li S, Morse M, Lennon NJ, Livak KJ, Mikkelsen TS, Rinn JL. The dynamics and regulators of cell fate decisions are revealed by pseudotemporal ordering of single cells. Nat Biotechnol. 2014;32(4):381–386. doi:10.1038/nbt.2859.
- Van Den Berge K, Roux De Bézieux H, Street K, Saelens W, Cannoodt R, Saeys Y, Dudoit S, Clement L. Trajectory-based differential expression analysis for single-cell sequencing data. Nat Commun. 2020;11(1):1201. doi:10.1038/s41467-020-14766-3.
- Stuart T, Butler A, Hoffman P, Hafemeister C, Papalexi E, Mauck WM 3rd, Hao Y, Stoeckius M, Smibert P, Satija R. Comprehensive integration of single-cell data. Cell. 2019;177(7):1888–1902e1821. doi:10.1016/j.cell.2019.05.031.
- Fiala GJ, Gomes AQ, Silva-Santos B. From thymus to periphery: molecular basis of effector gammadelta-T cell differentiation. Immunol Rev. 2020;298(1):47–60. doi:10.1111/imr.12918.
- Di Marco R, Roberts NA, Dart RJ, Vantourout P, Jandke A, Nussbaumer O, Deban L, Cipolat S, Hart R, Iannitto ML. Epithelia use butyrophilin-like molecules to shape organ-specific gammadelta T cell compartments. Cell. 2016;167(1):203–218 e217. doi:10.1016/j.cell.2016.08.030.
- Savas P, Virassamy B, Ye C, Salim A, Mintoff CP, Caramia F, Salgado R, Byrne DJ, Teo ZL, Dushyanthen S, et al. Single-cell profiling of breast cancer T cells reveals a tissue-resident memory subset associated with improved prognosis. Nat Med. 2018;24(7):986–993. doi:10.1038/s41591-018-0078-7.
- Simoni Y, Becht E, Fehlings M, Loh CY, Koo SL, Teng KWW, Yeong JPS, Nahar R, Zhang T, Kared H, et al. Bystander CD8(+) T cells are abundant and phenotypically distinct in human tumour infiltrates. Nature. 2018;557(7706):575–579. doi:10.1038/s41586-018-0130-2.
- Hewavisenti R, Ferguson A, Wang K, Jones D, Gebhardt T, Edwards J, Zhang M, Britton W, Yang J, Hong A, et al. CD103+ tumor-resident CD8+ T cell numbers underlie improved patient survival in oropharyngeal squamous cell carcinoma. J Immunother Cancer. 2020;8(1):e000452. doi:10.1136/jitc-2019-000452.
- Challenor S, Tucker D. SARS-CoV-2-induced remission of Hodgkin lymphoma. Br J Haematol. 2021;192(3):415. doi:10.1111/bjh.17116.
- Couzi L, Levaillant Y, Jamai A, Pitard V, Lassalle R, Martin K, Garrigue I, Hawchar O, Siberchicot F, Moore N, et al. Cytomegalovirus-induced gammadelta T cells associate with reduced cancer risk after kidney transplantation. J Am Soc Nephrol. 2010;21(1):181–188. doi:10.1681/ASN.2008101072.
- Payne KK, Mine JA, Biswas S, Chaurio RA, Perales-Puchalt A, Anadon CM, Costich TL, Harro CM, Walrath J, Ming Q, et al. BTN3A1 governs antitumor responses by coordinating alphabeta and gammadelta T cells. Science. 2020;369(6506):942–949. doi:10.1126/science.aay2767.
- Fournie JJ, Bonneville M. Stimulation of gamma delta T cells by phosphoantigens. Res Immunol. 1996;147(5):338–347. doi:10.1016/0923-2494(96)89648-9.
- Dechanet J, Merville P, Lim A, Retiere C, Pitard V, Lafarge X, Michelson S, Meric C, Hallet MM, Kourilsky P, et al. Implication of gammadelta T cells in the human immune response to cytomegalovirus. J Clin Invest. 1999;103(10):1437–1449. doi:10.1172/JCI5409.
- Marlin R, Pappalardo A, Kaminski H, Willcox CR, Pitard V, Netzer S, Khairallah C, Lomenech AM, Harly C, Bonneville M, et al. Sensing of cell stress by human gammadelta TCR-dependent recognition of annexin A2. Proc Natl Acad Sci U S A. 2017;114(12):3163–3168. doi:10.1073/pnas.1621052114.
- Tumeh PC, Harview CL, Yearley JH, Shintaku IP, Taylor EJ, Robert L, Chmielowski B, Spasic M, Henry G, Ciobanu V, et al. PD-1 blockade induces responses by inhibiting adaptive immune resistance. Nature. 2014;515(7528):568–571. doi:10.1038/nature13954.
- Daud AI, Loo K, Pauli ML, Sanchez-Rodriguez R, Sandoval PM, Taravati K, Tsai K, Nosrati A, Nardo L, Alvarado MD, et al. Tumor immune profiling predicts response to anti-PD-1 therapy in human melanoma. J Clin Invest. 2016;126(9):3447–3452. doi:10.1172/JCI87324.
- Riaz N, Havel JJ, Makarov V, Desrichard A, Urba WJ, Sims JS, Hodi FS, Martin-Algarra S, Mandal R, Sharfman WH, et al. Tumor and microenvironment evolution during immunotherapy with nivolumab. Cell. 2017;171(4):934–949e916. doi:10.1016/j.cell.2017.09.028.
- Prat A, Navarro A, Pare L, Reguart N, Galvan P, Pascual T, Martinez A, Nuciforo P, Comerma L, Alos L, et al. Immune-related gene expression profiling after PD-1 blockade in non-small cell lung carcinoma, head and neck squamous cell carcinoma, and melanoma. Cancer Res. 2017;77(13):3540–3550. doi:10.1158/0008-5472.CAN-16-3556.
- Efremova M, Rieder D, Klepsch V, Charoentong P, Finotello F, Hackl H, Hermann-Kleiter N, Lower M, Baier G, Krogsdam A, et al. Targeting immune checkpoints potentiates immunoediting and changes the dynamics of tumor evolution. Nat Commun. 2018;9(1):32. doi:10.1038/s41467-017-02424-0.
- Patel SJ, Sanjana NE, Kishton RJ, Eidizadeh A, Vodnala SK, Cam M, Gartner JJ, Jia L, Steinberg SM, Yamamoto TN, et al. Identification of essential genes for cancer immunotherapy. Nature. 2017;548(7669):537–542. doi:10.1038/nature23477.
- Chen DS, Mellman I. Elements of cancer immunity and the cancer-immune set point. Nature. 2017;541(7637):321–330. doi:10.1038/nature21349.
- Butler A, Hoffman P, Smibert P, Papalexi E, Satija R. Integrating single-cell transcriptomic data across different conditions, technologies, and species. Nat Biotechnol. 2018;36(5):411–420. doi:10.1038/nbt.4096.
- Van Der Maaten LJP, Hinton GE. Visualizing high-dimensional data using t-SNE. J Mach Learn Res. 2008;9:2579–2605.
- McInnes L, Healy J, Melville J. Umap: Uniform manifold approximation and projection for dimension reduction. ArXiv. 2018. arXiv:1802.03426.
- Pont F, Tosolini M, Fournie JJ. Single-cell signature explorer for comprehensive visualization of single cell signatures across scRNA-seq datasets. Nucleic Acids Res. 2019;47(21):e133. doi:10.1093/nar/gkz601.
- Stoeckius M, Hafemeister C, Stephenson W, Houck-Loomis B, Chattopadhyay PK, Swerdlow H, Satija R, Smibert P. Simultaneous epitope and transcriptome measurement in single cells. Nat Methods. 2017;14(9):865–868. doi:10.1038/nmeth.4380.
- Gaydosik AM, Tabib T, Geskin LJ, Bayan CA, Conway JF, Lafyatis R, Fuschiotti P. Single-cell lymphocyte heterogeneity in advanced cutaneous T-cell lymphoma skin tumors. Clin Cancer Res. 2019;25(14):4443–4454. doi:10.1158/1078-0432.CCR-19-0148.
- Aoki T, Chong LC, Takata K, Milne K, Hav M, Colombo A, Chavez EA, Nissen M, Wang X, Miyata-Takata T, et al. Single-cell transcriptome analysis reveals disease-defining T-cell subsets in the tumor microenvironment of classic Hodgkin lymphoma. Cancer Discov. 2020;10(3):406–421. doi:10.1158/2159-8290.CD-19-0680.
- Lambrechts D, Wauters E, Boeckx B, Aibar S, Nittner D, Burton O, Bassez A, Decaluwe H, Pircher A, Van Den Eynde K, et al. Phenotype molding of stromal cells in the lung tumor microenvironment. Nat Med. 2018;24(8):1277–1289. doi:10.1038/s41591-018-0096-5.
- Kim N, Kim HK, Lee K, Hong Y, Cho JH, Choi JW, Lee JI, Suh YL, Ku BM, Eum HH, et al. Single-cell RNA sequencing demonstrates the molecular and cellular reprogramming of metastatic lung adenocarcinoma. Nat Commun. 2020;11(1):2285. doi:10.1038/s41467-020-16164-1.
- Azizi E, Carr AJ, Plitas G, Cornish AE, Konopacki C, Prabhakaran S, Nainys J, Wu K, Kiseliovas V, Setty M, et al. Single-cell map of diverse immune phenotypes in the breast tumor microenvironment. Cell. 2018;174(5):1293–1308e1236. doi:10.1016/j.cell.2018.05.060.
- Cillo AR, Kurten CHL, Tabib T, Qi Z, Onkar S, Wang T, Liu A, Duvvuri U, Kim S, Soose RJ, et al. Immune landscape of viral- and carcinogen-driven head and neck cancer. Immunity. 2020;52(1):183–199e189. doi:10.1016/j.immuni.2019.11.014.
- Zheng C, Zheng L, Yoo JK, Guo H, Zhang Y, Guo X, Kang B, Hu R, Huang JY, Zhang Q, et al. Landscape of infiltrating T cells in liver cancer revealed by single-cell sequencing. Cell. 2017;169(7):1342–1356e1316. doi:10.1016/j.cell.2017.05.035.
- Saelens W, Cannoodt R, Todorov H, Saeys Y. A comparison of single-cell trajectory inference methods. Nat Biotechnol. 2019;37(5):547–554. doi:10.1038/s41587-019-0071-9.
- Chihara N, Madi A, Kondo T, Zhang H, Acharya N, Singer M, Nyman J, Marjanovic ND, Kowalczyk MS, Wang C, et al. Induction and transcriptional regulation of the co-inhibitory gene module in T cells. Nature. 2018;558(7710):454–459. doi:10.1038/s41586-018-0206-z.
- Alfei F, Kanev K, Hofmann M, Wu M, Ghoneim HE, Roelli P, Utzschneider DT, Von Hoesslin M, Cullen JG, Fan Y, et al. TOX reinforces the phenotype and longevity of exhausted T cells in chronic viral infection. Nature. 2019;571(7764):265–269. doi:10.1038/s41586-019-1326-9.
- Tosolini M, Algans C, Pont F, Ycart B, Fournie JJ. Large-scale microarray profiling reveals four stages of immune escape in non-Hodgkin lymphomas. Oncoimmunology. 2016;5(7):e1188246. doi:10.1080/2162402X.2016.1188246.
- Kumar BV, Ma W, Miron M, Granot T, Guyer RS, Carpenter DJ, Senda T, Sun X, Ho S-H, Lerner H, et al. Human tissue-resident memory T cells are defined by core transcriptional and functional signatures in lymphoid and mucosal sites. Cell Rep. 2017;20(12):2921–2934. doi:10.1016/j.celrep.2017.08.078.