
ABSTRACT
The CMS4 mesenchymal subtype of colorectal cancer (CRC) is associated with poor prognosis and resistance to treatment. The cellular prion protein PrPC is overexpressed in CMS4 tumors and controls the expression of a panel of CMS4-specific genes in CRC cell lines. Here, we sought to investigate PrPC downstream pathways that may underlie its role in CMS4 CRC. By combining gene set enrichment analyses and gain and loss of function approaches in CRC cell lines, we identify the integrin-linked kinase ILK as a proximal effector of PrPC that mediates its control on the CMS4 phenotype. We further leveraged three independent large CRC cohorts to assess correlations in gene expression pattern with patient outcomes and found that ILK is overexpressed in CMS4 mesenchymal tumors and confers a poor prognosis, especially when combined with high expression of the PrPC encoding gene PRNP. Of note, we discovered that the PrPC-ILK signaling axis controls the expression and activity of the tryptophan metabolizing enzyme indoleamine 2,3 dioxygenase IDO1, a key player in immune tolerance. In addition, we monitored alterations in the levels of tryptophan and its metabolites of the kynurenine pathway in the plasma of metastatic CRC patients (n = 325) and we highlight their prognostic value in combination with plasma PrPC levels. Thus, the PrPC-ILK-IDO1 axis plays a key role in the mesenchymal subtype of CRC. PrPC and IDO1-targeted strategies may represent new avenues for patient stratification and treatment in CRC.
1. Introduction
Colorectal tumors can be divided according to molecular signatures into four distinct CMS (consensus molecular subgroup), which now represents the gold standard for colorectal cancer (CRC) classification.Citation1 CMS subtypes differ in prognosis, tumor microenvironment (TME) characteristics, and response to treatments.Citation2 Among those, the CMS4 subgroup, typically characterized by mesenchymal features, is the most aggressive and is associated with worse outcomes.Citation2 This subtype is more prevalent in advanced stages of CRC and is associated with increased progression rates to more advanced stages.Citation3 Besides, CMS4 tumors display an immunosuppressive phenotype.Citation4 Elucidating the actors sustaining the CMS4 subtype may help unravel the pathways that orchestrate the various biological processes specifically related to this subgroup. We recently documented that the cellular prion protein PrPC is enriched in CMS4 tumors and we showed through gain and loss of function studies in vitro that it controls the expression of a set of genes that specify the CMS4 subgroup.Citation5 Notably, PrPC operates through the mobilization of the YAP/TAZ and TGFß pathways,Citation5 the latter being actively scrutinized for its contribution to CRC metastasis.Citation6,Citation7 In the present study, we aimed at further investigating the molecular pathways downstream from PrPC in CMS4 CRC. We identify the Integrin Linked Kinase (ILK) as a proximal effector of PrPC that relays its control on a panel of CMS4 genes. We show that high ILK expression is associated with poor prognosis, including within the worst outcome CMS4 subgroup. Furthermore, we provide evidence that the PrPC-ILK signaling axis controls the expression and activity of indoleamine 2,3 dioxygenase (IDO1). IDO1, which catalyses the conversion of tryptophan (Trp) into Kynurenine (Kyn), represents a major driver of immune-tolerance in cancer.Citation8 By exploiting a large cohort of metastatic CRC patients, we substantiate that circulating levels of PrPC correlate with increased ratios of plasma Kyn to Trp, mirroring increased IDO1 activity. Finally, we establish that combined measurements of PrPC and Tryptophan metabolites in the plasma of mCRC patients can together predict disease control and survival.
2. Materials and methods
2.1 Reagents
All tissue culture reagents were from Invitrogen (Carlsbad, CA, USA). GSK3ß inhibitor IX ((2ʹZ,3ʹE)-6-Bromoindirubin-3ʹ-oxime, BIO) and mouse monoclonal antibody against α-tubulin (T9026) were from Sigma-Aldrich (St. Louis, MO, USA). Polyclonal rabbit antibodies against phosphoYAP (S127) (#4911) and phosphoNF2 (S518) (#13281) were from Cell Signaling Technology (Danvers, MA, USA). Mouse monoclonal antibodies against PrPC (Sha31) were from SPI-Bio (Montigny Le Bretonneux, France). Mouse monoclonal antibodies against YAP (sc-101199) were from Santa Cruz (Santa Cruz, CA, USA). Rabbit antibodies against ILK (ab76468) and mouse antibodies against NF2 (ab88957) were from Abcam. Mouse antibodies against Actin (ACTN05) were from Novus. QLT0267 was provided by Dr. Shoukat Dedhar. The appropriate QLT concentration was determined through dose-response analyses.
2.2 Cell culture
The human CRC MDST8 and LoVo cell lines were purchased from Sigma in 2019, which provided cell authentication. MDST8 cells were grown in DMEM with 10% fetal bovine serum (FBS). LoVo cells were grown in F-12 K medium supplemented with 10% FBS. All cell lines were grown at 37°C and 5% CO2 in a humidified incubator and regularly tested for mycoplasma contamination. For transient siRNA-mediated silencing, cells were transfected with siRNA sequences (30 nM) as in.Citation5 For PrP overexpression, LoVo cells were transfected with 2.5 µg of the pcDNA3-prnp plasmid that expresses mouse Prnp (kind gift of Pr. Sylvain Lehmann) using the Lipofectamine 3000 reagent according to the manufacturer’s instructions (Invitrogen). The corresponding empty vector was used as control.
2.3 Preparation of cell supernatants, protein extracts and western blot analyses
The cells supernatants were collected, centrifuged for 5 min at 1,500 g and immediately frozen at −80°C. Cells were washed in PBS and incubated for 30 minutes at 4°C in NaDOC lysis buffer [50 mM Tris·HCl (pH 7.4)/150 mM NaCl/5 mM EDTA/0.5% Triton X-100/0.5% sodium deoxycholate] and a mixture of phosphatase (Thermo-Scientific, Waltham, MA, USA) and protease (Roche, Mannheim, Germany) inhibitors. Extracts were centrifuged at 14,000 x g for 15 minutes. Protein concentrations in the supernatant were measured by using the bicinchoninic acid method (Pierce, Rockford, IL, USA). Protein extracts (15 µg) were resolved by 4–12% SDS-PAGE (Invitrogen) and transferred to nitrocellulose membranes (iBlot, Invitrogen). Membranes were blocked with SEABLOCK blocking buffer (Thermo-Scientific) for 1 hour at room temperature and then incubated overnight at 4°C with primary antibody. Bound antibody was revealed by infrared detection using a secondary antibody coupled to IRDye fluorophores (Li-Cor biosciences, Lincoln, NE, USA). Western blot read out was performed with the Odyssey Infrared Imaging System (Li-Cor biosciences).
2.4 Isolation of total RNA and RT-PCR analysis
RNA was isolated by using the RNeasy extraction kit (Qiagen, Limburg, Netherlands), as recommended by the manufacturer’s instructions. For reverse transcriptase-polymerase chain reaction (RT-PCR) analysis, first-strand cDNA was synthesized with oligo(dT) primer and random 6 mers, using the High-capacity cDNA Reverse Transcription kit (Applied Biosystems) according to the manufacturer’s protocol. Real-time PCR was performed using Absolute QPCR SYBR Green ROX Mix (Thermo-Scientific, Waltham, MA, USA) on a ABI PRISM 7900HT (Applied Biosystems, Life Technologies Corporation, Carlsbad, CA, USA). Real-time PCR analyzes was performed with the SDS software 2.3 (Applied biosystems). Primers used for the PCR reactions are shown on Table S7. Results are expressed as a relative quantification of a target gene transcript normalized to the RPL13A housekeeping gene using the ∆∆Ct method.
2.5 Real-time cell proliferation, migration and invasion
MDST8 cells were seeded at a density of 10,000 cells/ well into E-plate 16 (ACEA Biosciences, Inc, San Diego, CA) and monitored on the xCELLigence Real-Time Cell Analyzer (RTCA) Dual Plate instrument (ACEA Biosciences, Inc) according to the manufacturer’s instructions. Cell proliferation was assessed by electrodes in chambers and impedance differences within an electrical circuit were monitored by the RTCA system every 10 minutes for the first 48 h and then every 15 minutes up to 72 hours. Migration and invasion assays were performed using CIM-Plate 16. MDST8 cells were seeded at a density of 20,000 cells/ well in 3% FBS in the upper chamber and forced to move toward the lower chamber containing 10% FBS. For invasion, the upper chamber was pre-coated with 30 µl of Cultrex (1:15 in medium, Biotechne, Minneapolis, Mn, USA). The impedance was recorded every 15 min for up to 96 hours. In all experiments, siRNA against PRNP or QLT0267 were added at t = 0. The experiments were performed in quadruplicate and repeated twice.
2.6 Gene expression analyses
The following datasets were retrieved from public sources: GSE39582 (“CIT cohort”, n = 566), GSE13294, GSE18088, GSE14333, GSE13067, GSE17536, GSE17537, GSE33113, GSE26682, TCGA, altogether forming the “validation cohort” (n = 1647). Gene expression analysis for the PETACC8 cohort was performed through 3ʹRNA sequencing. Samples were selected so as to yield a near even distribution among CMS subgroups. Data were normalized as transcript per million reads. Subtype classification systems assignments were performed using original published predictor methods as described in.Citation2
Kaplan-Meier plots were generated using the “survival” (Cancer Genome Atlas Network, 2012) R package.
2.7 Gene Set Enrichment Analysis (GSEA)
GSEACitation9 was performed on the GSE39582 dataset.Citation10 This cohort is composed of n = 91 CMS1, n = 232 CMS2, n = 69 CMS3, n = 127 CMS4 n = 47 unclassified and n = 19 non tumor samples (NT). The GSEA was performed using the Broad Institute platform (http://www.broadinstitute.org/gsea/index.jsp; Version 2.0.14).
2.8 Analysis of plasma samples
Characteristics of plasma samples from the PRODIGE9 trial have been described in.Citation5 Collection of material was approved by the Committee for the Protection of Persons Ile de France VIII. The patients and methods for the PRODIGE9 trial have been described previously (trial registration number NCT00952029).Citation11 Blood samples of 275 healthy individuals without any indication of malignancy were collected as a control group. We verified that control values did not differ according to age groups (>65 and ≤65 years). Experiments were all carried out under blinded conditions.
2.9 Quantifications of Tryptophan and its metabolites
L-Trp, L-Kyn and AA were measured in cells conditioned medium or patients plasma through LC/MS-MS as in.Citation12 Quantifications were performed by referencing calibration curves obtained with internal standards.
2.10 Statistical analysis
The results are reported as the means ± standard errors of the means (s.e.m.). The unpaired Student’s t-test, the ANOVA variance analysis with Tukey post hoc test or the Wilcoxon rank-sum test were used for group comparisons. Survival curves were obtained using Kaplan-Meier estimates and differences between groups of patients were assessed using the log-rank test for univariate analyses or Cox models for multivariate analyses. A p-value < 0.05 was considered significant.
3. Results
3.1 Integrin-linked kinase correlates with PrPC expression and is enriched in mesenchymal colorectal tumors.
We employed gene set enrichment analyses (GSEA) to get further insight into the pathways enriched among the genes whose expression is correlated to that of PRNP in colorectal patients (“CIT cohort”, GSE39582). We found that the expression of PRNP was highly associated with integrin binding, cell-substrate adhesion and cell-substrate junction (). Using leading-edge analysis to identify overlapping genes in these 3 gene sets, we derived a short list of highly correlated genes, most of which encode integrin subunits (). Because distinct integrins may share common partners and functionally compensate for each other,Citation13,Citation14 we chose to focus on one of their proximal effector, namely ILK,Citation15 which features in the leading edge-derived list of overlapping genes (). When assessing the distribution of ILK transcripts according to the consensus molecular subgroups (CMS) in colorectal patients, we found that ILK expression was significantly higher in the CMS4 subgroup in two large CRC cohorts (“CIT cohort”, n = 566, “validation cohort” see Materials and Methods, n = 943 patients with CMS) (). ILK transcripts were also elevated in CMS4 tumors in a sample (n = 195) of the large PETACC8 cohort (, bottom panel), solely composed of stage III CRC.Citation16 We extended these analyses to in vitro transcriptomicCitation17 and proteomicCitation18 data on a panel of CRC cell lines, whose CMS has been established recently.Citation19 In accordance with the above observations in CRC patients, ILK mRNA and protein levels were increased in CMS4 cell lines vs other subgroups (Fig. S1a and b).
Figure 1. ILK expression correlates with PRNP and is enriched in CMS4 CRC. a GSEA analysis showing enrichment of the Integrin binding, Cell substrate junction and Cell substrate adhesion signatures in the genes most correlated with PRNP expression in the CIT cohort. b Leading edge analysis highlighting ILK as an overlapping core gene in the three gene sets enriched in high PRNP expressing tumors of the CIT cohort. c Relative ILK gene expression in patients from the CIT cohort (top panel), validation cohort (middle panel) or PETACC8 cohort sample (bottom panel) within the 4 molecular subgroups according to the consensus classification.Citation2 NT indicates non-tumors controls. p < 2e-16 for CIT and validation cohorts and p = .0033 for PETACC8 cohort, respectively (ANOVA variance analysis). p < .0001 for CMS4 vs each other CMS for CIT and validation cohorts, p = .18, p = .002 and p = .067 for CMS4 vs CMS1, CMS2 and CMS3, respectively for PETACC8 cohort sample (Tukey post hoc test). d-e Analysis of ILK gene expression in the CIT cohort (top panels), validation cohort (middle panels) or PETACC8 cohort sample (bottom panels) demonstrates significant correlations (all p < . 00001) with mRNA expression of PRNP d or with the PRNP score e, defined as the sum of the expression of the 13 PrPC-dependent genes reported in.Citation5
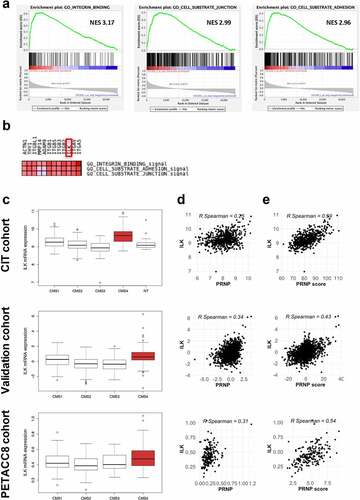
Next, when we plotted ILK mRNA levels as a function of PRNP mRNA levels, we obtained significant correlations in the three cohorts (). Since PrPC controls the expression of a panel of genes that specifies the mesenchymal subtype of CRC,Citation5 we further calculated a PRNP-score by summing the expression of these 13 PrPC-dependent genes. Of note, high correlations were found between ILK expression and the PRNP-score in the three cohorts (). Finally, we found high correlations between ILK and PRNP gene expression in the whole Cancer Cell Line Encyclopedia (CCLE) and in the large intestine cells of this panel (Fig. S1c and d). Altogether, these results define ILK as a CMS4-enriched gene and allow to hypothesize that ILK may be a downstream effector of PrPC relaying its control on a subset of CMS4-associated genes.
3.2 ILK expression is associated with poor prognosis
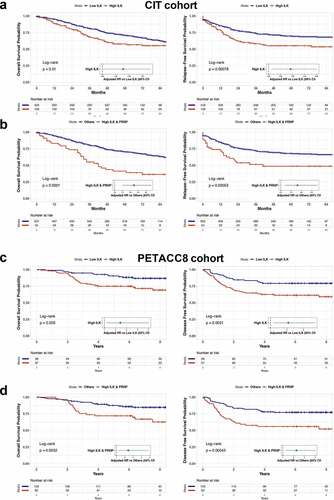
In line with the enrichment of ILK transcripts in the poor-prognosis CMS4 subgroup, we found that samples with high ILK levels were associated with a worse outcome in terms of overall survival (OS) and relapse-free survival (RFS) in the CIT cohort (). Multivariate COX regression analysis confirmed that ILK was an independent predictor of OS and RFS when adjusted for sex, age at diagnosis, TNM stage and tumor location. Of note, when considering the poor-prognosis CMS4 subgroup only (n = 127), patients with high ILK expression had a significantly poorer OS (HR = 1.78, 95%CI = 1.02 to 3.11, p = .042) and a tendency toward reduced RFS (HR = 1.71, 95%CI = 0.99 to 2.97, p = .055) than those with low ILK expression. Next, we compared patients combining high ILK and PRNP mRNA levels to others, which represent 55 out of the 139 patients with high ILK levels. We found that high ILK and PRNP expressing patients had a much worse OS and RFS probability in the CIT cohort with hazard ratios of 2.23 (95%CI = 1.51 to 3.31, p = 6e-05) and 1.81 (95%CI = 1.19 to 2.76, p = .0055), respectively (). Similar observations were obtained with the validation cohort. We used an optimal cut off value to divide patients into 2 groups according to ILK expression and found that high ILK expression was associated with worse OS (HR = 1.53, 95%CI = 1.11 to 2.1, p = .0086) (Fig. S2a). This was even exacerbated when considering patients with both high ILK and high PRNP expression (HR = 1.77, 95%CI = 1.26 to 2.48, p = .001) (Fig. S2c). Finally, these overall results were corroborated in the PETACC8 cohort. Indeed, patients exhibiting high levels of ILK transcripts had poorer OS and disease free survival (DFS) with hazard ratios of 2.44 (95%CI = 1.19 to 5.01, p = .01532) and 2.09 (95%CI = 1.18 to 3.71, p = .012), respectively (). As for the CIT and validation cohorts, we found that combined high expression levels of both ILK and PRNP (n = 62 out of 97 patients with high ILK) was associated with reduced OS (HR = 2.42, 95%CI = 1.19 to 4.91, p = .015) and DFS (HR = 2.26, 95%CI = 1.27 to 4.02, p = .005) in the PETACC8 cohort sample ().
Figure 2. Prognostic impact of high ILK expression in CRC. a Kaplan-Meier overall survival (OS) (left panel) and relapse free survival (RFS) (right panel) according to high and low ILK gene expression was determined in the CIT cohort. b Kaplan-Meier OS (left panel) and RFS (right panel) comparing patients with high ILK and PRNP gene expression to other patients of the CIT cohort. Samples were grouped according to ILK and PRNP gene expression with a threshold corresponding to the 90th percentile of non-tumors samples. Hazard ratios in a and b were adjusted for sex, age at diagnosis, TNM stage and tumor location. c Kaplan-Meier OS (left panel) and disease free survival (DFS) (right panel) according to high and low ILK gene expression was determined in the PETACC8 cohort sample. d Kaplan-Meier OS (left panel) and DFS (right panel) comparing patients with high ILK and PRNP gene expression to other patients of the PETACC8 cohort sample. Median values of ILK and PRNP gene expression were used as thresholds. Hazard ratios in c and d were adjusted for age, sex, grade, TNM stage, MMR status, RAS mutation status and WHO performance
3.3 PrPC and ILK form a feed-forward loop in cancer cells
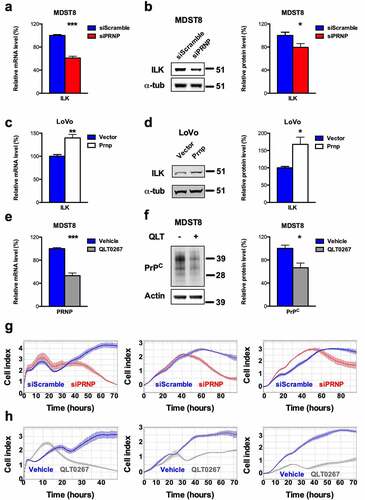
We next employed cell-based assays in order to assess whether PrPC would control the expression of ILK. First, we found that siRNA-mediated silencing of PrPC in the MDST8 CRC cell line, which belongs to the CMS4 subgroup, promoted significant reductions in the mRNA and protein levels of ILK (, b). Conversely, overexpression of PrPC in the CMS1 LoVo CRC cell line was associated with significantly increased ILK mRNA and protein levels (, d). We then asked the question as to whether ILK may in turn regulate PRNP gene expression. For this purpose, MDST8 cells were exposed for 24 h to 25 µM QLT0267, a specific inhibitor of ILK.Citation20 QLT0267-treated cells exhibited a two-fold reduction in PRNP mRNA and a 33% reduction in PrPC protein levels as compared to control MDST8 cells (, f). To assess the functional relevance of the PrPC-ILK connection, we examined the behavior of MDST8 cells submitted to PrPC depletion or ILK inhibition using the xCELLigence technology. This noninvasive methodology allows the real-time measurement of electrical impedance, which reflects the number of cells, cell size and morphology and cell attachment quality (E-plate), or is an indicator of cell migration or invasion (CIMP-plate). As shown in , h, PrPC silencing and QLT0267 treatment in MDST8 cells promoted highly similar changes in cell index, a parameter reflecting the impedance of the plate-cells system. With E-plates (left panels), after the first phase of cell attachment and proliferation recovery, cell indexes of both PrPC-silenced and QLT0267-exposed cells decreased, indicating that both treatments interfere with cell proliferation and/or adhesion. This is in line with our previous observation that PrPC silencing in MDST8 causes a nearly 50% reduction in cell number within 72 h while having a modest impact on cell viability (10% reduction).Citation5 PrPC silencing and exposure to QLT0267 were also both associated with reduced migration and invasion capacities of MDST8 cells, as assessed with CIM-plates (middle panels for migration, right panels for invasion, see Materials and Methods). We may further note that the shorter time-window of effects with QLT0267 is compatible with a prompt inhibition of ILK, as compared with a longer time-delay to reach effective depletion of PrPC (min 40 h). Overall, we conclude that PrPC and ILK are linked within a positive feedback loop and that the PrPC-ILK axis sustains cell proliferation and/or adhesion as well as migration and invasion of cancer cells.
Figure 3. ILK is a target of PrPC in CRC cell lines and positively controls PrPC in a feedforward loop. a qRT-PCR analysis showing reduced expression of ILK in PRNP-silenced vs. control MDST8 cells. b Western blot analysis showing decreased expression of ILK in PRNP-silenced vs. control MDST8 cells. c qRT-PCR analysis showing increased expression of ILK in PrPC-overexpressing vs. control LoVo cells. d Western blot analysis showing increased expression of ILK in PrPC-overexpressing vs. control LoVo cells. e qRT-PCR analysis showing reduced expression of PRNP in QLT0267-treated (25 µM, 24 h) vs. control (DMSO-treated) MDST8 cells. f Western blot analysis showing decreased expression of PrPC in QLT0267-treated vs. control MDST8 cells. g Cell index measurements of PRNP-silenced vs. control MDST8 cells in proliferation/adhesion assay (E-plate, left panel), migration assay (CIMP-plate, middle panel) or invasion assay (Cultrex-coated CIMP-plate, right panel). h Cell index measurements of QLT0267-treated vs. control MDST8 cells in proliferation/adhesion assay (E-plate, left panel), migration assay (CIMP-plate, middle panel) or invasion assay (Cultrex-coated CIMP-plate, right panel). a-f Results are expressed as means of n = 2 independent triplicates of cell preparations ± s.e.m. (* p < .05, ** p < .01 and *** p < .001, two-tailed t test). g-h Graphs represent means of n = 4 replicates and are representative of n = 2 independent experiments
3.4 ILK contributes to the PrPC-dependent activation of YAP/TAZ and expression of their downstream targets
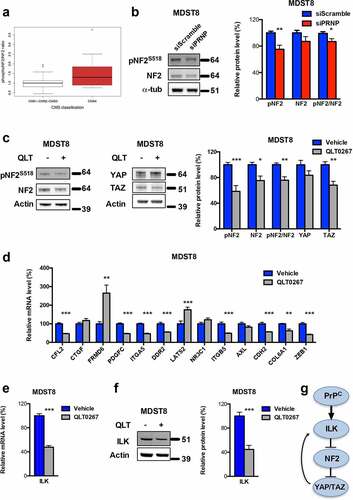
We previously documented a PrPC-YAP/TAZ axis in CRC.Citation5 Since ILK has been reported as a potential upstream regulator of YAP/TAZ acting at the level of neurofibromatosis type 2 protein (NF2)/Merlin,Citation21 we hypothesized that the PrPC-dependent control over YAP/TAZ may involve an activation of ILK and subsequent phosphorylation on Ser518 of NF2, itself resulting in NF2 inactivation. In support of this hypothesis, we found that CMS4 cell lines of the proteomic CRC panel exhibit higher ratios of phosphoS518-NF2 to total NF2 as compared to other cell lines (). Furthermore, phosphoS518-NF2 levels and the ratio phosphoS518-NF2 to total NF2 were reduced after PrPC depletion in MDST8 cells (). This hypothesis could be firmly substantiated by the significant reductions in the levels of phosphoS518-NF2, total NF2, phosphoS518-NF2/total NF2 and TAZ monitored in QLT0267-treated MDST8 cells as compared to control cells (). We went on to examine the impact of QLT0267 on the panel of PrPC-dependent genes associated with the mesenchymal subtype of CRC that we recently characterized.Citation5 As shown in , 8 out of 13 genes of the panel exhibited reduced expression in response to QLT0267, while 3 of them were unchanged and two (FRMD6, LATS2) were upregulated after treatment. These observations suggest that the PrPC-ILK signaling module may mobilize additional pathways beyond YAP/TAZ and that one of those may negatively regulate FRMD6 and LATS2 expression, to the opposite of YAP/TAZ. One candidate is the GSK3ß kinase, one of the best characterized effector of ILK.Citation22 In support of this hypothesis, we found that PrPC-ILK negatively regulates GSK3ß activity, as inferred by the reduced expression of the ß-catenin target gene AXIN2 in MDST8 cells exposed to QLT0267 (Fig. S3a), and that GSK3ß inhibition with BIO causes a reduction in FRMD6 and LATS2 transcripts (Fig. S3b). Finally, we monitored reduced levels of ILK mRNA and protein in MDST8 submitted to ILK inhibition (, f) and ILK mRNA were reduced after YAP and/or TAZ silencing (Fig. S3c), arguing that one transcriptional target of the PrPC-ILK-YAP/TAZ cascade is ILK itself. As a whole these data define ILK as a proximal effector of PrPC upstream of YAP/TAZ ().
Figure 4. ILK is a major relay of PrPC downstream signaling. a Relative phosphoS518-NF2 to total NF2 protein ratio in a panel of CRC cell linesCitation18 as a function of their CMS classification,Citation19 p = .141 (Wilcoxon rank-sum test). b Western blot analysis showing reduced phosphoS518-NF2 protein expression and phosphoS518-NF2 to total NF2 ratio in PRNP-silenced vs. control MDST8 cells. c Western blot analysis showing reduced phosphoS518-NF2, total NF2, phosphoS518-NF2 to total NF2 and TAZ protein expression in QLT0267-treated vs. control MDST8 cells. d qRT-PCR analysis of PrPC-dependent genes in QLT0267-treated vs. control MDST8 cells showing reduced expression of CFL2, PDGFC, ITGA5, DDR2, ITGB5, CDH2, COL6A1 and ZEB1. e qRT-PCR analysis showing reduced expression of ILK in QLT0267-treated vs. control MDST8 cells. f Western blot analysis showing decreased expression of ILK in QLT0267-treated vs. control MDST8 cells. g Schematic diagram of the cascade linking PrPC, ILK and YAP/TAZ. b-f Results are expressed as means of n = 2 independent triplicates of cell preparations ± s.e.m. (* p < .05, ** p < .01 and *** p < .001, two-tailed t test)
3.5 The PrPC-ILK axis controls the expression of IDO1
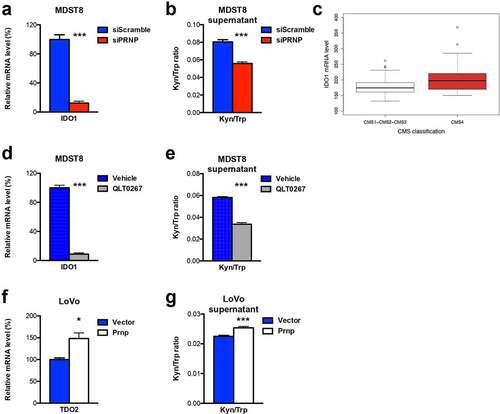
When analyzing the common impact of PrPC-silencing and ILK inhibition in MDST8 cells, we found that one of the most decreased gene is IDO1, encoding indoleamine 2,3 dioxygenase, an enzyme highly associated with immune tolerance.Citation8 Indeed, PrPC-silenced and QLT0267-treated MDST8 cells expressed only 12% of IDO1 as compared with control cells (, d). IDO1 is one of the rate-limiting enzyme of the Kynurenine Pathway, together with the TDO2 (tryptophan 2,3 dioxygenase) enzyme, and both IDO1 and TDO2 catalyze the conversion of Trp into Kyn.Citation23 As observed with IDO1, TDO2 expression was reduced in PrPC-silenced and QLT0267-treated MDST8 cells, although the reduction was milder than that obtained for IDO1 (Fig. S4). Interestingly, IDO1 mRNA – but not TDO2 mRNA (data not shown) – expression appears to be significantly higher in CRC cell lines of the CMS4 subtype as assessed in the panel of the Medico studyCitation17 (). Mechanistically, we found that IDO1 mRNAs were strongly upregulated after GSK3ß pharmacological inhibition (Fig. S5a). Thus, PrPC appears to regulate IDO1 expression via ILK-GSK3ß, most likely via the activation of ß-catenin, in line with the reported identification of LEF1 binding sites in the promoter of the IDO1 geneCitation24 (Fig. S5b). We went on to evaluate IDO1/TDO2 activity by measuring the ration of Kyn to Trp. In line with the RT-qPCR data, we found significantly lower levels of Kyn/Trp in the supernatant of PrPC-depleted and QLT0267-treated MDST8 cells (, e). Finally, we sought to assess the impact of PrPC overexpression in the CMS1 LoVo cells line. IDO1 transcripts were detected neither in control cells nor in Prnp-expressing LoVo. However, LoVo cells expressed basal levels of TDO2 transcripts, and these were significantly increased upon PrPC-overexpression (). Accordingly, we measured significantly higher levels of Kyn/Trp in the supernatant of PrPC-overexpressing LoVo cells versus control cells (). Thus, these data indicate that the PrPC-ILK axis controls IDO1/TDO2 expression and activity in CRC cells.
Figure 5. IDO1 is a downstream target of the PrPC-ILK axis. a qRT-PCR analysis showing reduced expression of IDO1 in PRNP-silenced vs. control MDST8 cells. b Reduced Kyn/Trp ratios in the supernatants of PRNP-silenced vs. control MDST8 cells. c Relative IDO1 mRNA expression in a panel of CRC cell linesCitation17 as a function of their CMS classification,Citation19 p < .0028 (Wilcoxon rank-sum test). d qRT-PCR analysis showing reduced expression of IDO1 in QLT0267-treated vs. control MDST8 cells. e Reduced Kyn/Trp ratios in the supernatants of QLT0267-treated vs. control MDST8 cells. f qRT-PCR analysis showing increased expression of TDO2 in PrPC-overexpressing vs. control LoVo cells. g Increased Kyn/Trp ratios in the supernatants of PrPC-overexpressing vs. control LoVo cells Results are expressed as means of n = 2 independent triplicates of cell preparations ± s.e.m. (* p < .05 and *** p < .001, two-tailed t test)
3.6 IDO1 activity is elevated in the plasma of metastatic CRC patients and correlates with circulating PrPC levels
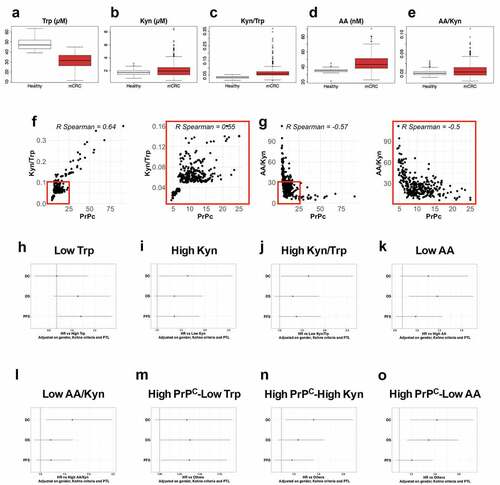
We previously documented high levels of circulating PrPC in the plasma of patients with metastatic colorectal cancer (mCRC) as compared with healthy subjects and that high plasma levels of PrPC are correlated with poor disease control in the PRODIGE9 study.Citation5 Having shown a control of PrPC on the expression and activity of IDO1 in the MDST8 CRC cell line, we went on to evaluate whether plasma levels of Trp and its metabolite Kyn may relate to circulating PrPC levels in the PRODIGE9 cohort. In line with what we had observed with plasma PrPC,Citation5 mCRC patients had significantly lower levels of Trp (31.29 ± 7.23 µM vs. 47.89 ± 5.96, p < 2e-16) () and higher levels of Kyn (2.19 ± 1.24 µM vs 1.75 ± 0.39, p < 2e-8) (). Kyn to Trp ratios, which may be considered as a proxy of IDO activity, were also higher in mCRC patients than healthy subjects (0.0731 ± 0.050 vs 0.0367 ± 0.0079, p < 2e-16, with values ranging from 0.0153 to 0.368) (). Going one step further in the Kynurenine pathway, we went on to measure the levels of Anthranilic Acid (AA), which is produced from Kyn by the Kynureninase enzyme (Fig. S6a). We found higher levels of AA (44.80 ± 10.56 nM vs 34.81 ± 2.59, p < 2e-16) and AA to Kyn ratios, a proxy of Kynureninase activity, (0.0266 ± 0.0157 vs 0.0210 ± 0.0054, p = .0063) in mCRC patients (, e). In agreement, Kynureninase (KYNU) transcript and protein levels were increased in CRC cell lines of the CMS4 subtype according to the MedicoCitation17 and RoumeliotisCitation18 studies (Fig. S6b and c). Interestingly, we further found that circulating PrPC levels were positively correlated with plasma Kyn/Trp ratios (), in line with the data obtained in vitro, and inversely correlated with those of plasma AA/Kyn ratios ().
Figure 6. Trp metabolism is elevated in the plasma of mCRC patients, correlates with PrPC levels and has prognostic value. a-e Plasma levels of Trp a, Kyn b, Kyn/Trp ratios c, AA d and AA/Kyn ratios e measured in n = 275 healthy subjects and n = 325 patients with mCRC. p < 2e-16 for Trp, Kyn/Trp and AA and p = .0001 and p = . 0.0004 for Kyn and AA/Kyn, respectively (Wilcoxon rank-sum test). f-g Kyn/Trp ratios f and AA/Kyn ratios g plotted as a function of plasma PrPC levels in mCRC (n = 325 patients). Inserts show analysis restricted to samples with PrPC levels lower than 25 ng/mL. p < .0001 for all panels. h-o Forest-plots summarizing cox multivariate analyses of Trp low vs high samples h, Kyn high vs low samples i, Kyn/Trp high vs low samples j, AA low vs high samples k, AA/Kyn low vs high samples l, high PrPC-low Trp samples vs other samples m high PrPC-high Kyn samples vs other samples n and high PrPC-low AA samples vs other samples o. Dichotomization of patients by Trp, Kyn, Kyn/Trp, AA and AA/Kyn were at 28.1 µM, 1.24 µM, 0.0429, 47.6 nM and 0.03213, respectively. The threshold level for PrPC was 8.7 ng/mL, as in.Citation5 Analyses were carried out on all patients (n = 325) and adjusted on gender, Köhne criteria and primary tumor location
3.7 Plasma levels of Trp and its metabolites Kyn and AA, in combination with circulating PrPC levels, have prognostic value in metastatic CRC
Next, we analyzed the association of Trp levels with clinical parameters. The cut off value chosen for stratification was the lowest tertile value of patients Trp levels (28.1 µM). Trp-low patients did not differ from Trp-high patients except that they were significantly older (Table S1). Interestingly, multivariate analysis revealed that Trp-low patients had a tendency toward worse OS and significantly poorer progression-free survival (PFS) rates (HR = 1.32, 95%CI = 1.01 to 1.73, p = .041), while Trp levels had no impact on disease control (DC) probability ( and Fig. S7). We then restricted our analyses on patients with low and medium Köhne criteria, who have similar DC, significantly better than that of patients with high Köhne criteria.Citation5 For this subset of patients, both OS (HR = 1.45, 95%CI = 1.06 to 1.98, p = .020) and PFS (HR = 1.34, 95%CI = 1.00 to 1.79, p = .047) were significantly reduced in Trp-low patients (Fig. S7 and 15).
We went on to analyze the association of Kyn levels with clinical parameters. The 80% of patients with highest Kyn levels were not different from those with low Kyn levels (Table S2). However, in multivariate analysis, high Kyn levels were associated with poor disease control (DC), which is the primary endpoint of the PRODIGE9 studyCitation11 (HR = 1.64, 95%CI = 1.04 to 2.57, p = .032, and Fig. S8). A tendency toward poor OS and PFS was also observed, although not reaching significance. Similar observations were obtained when restricting analyses to patients with low and medium Köhne criteria, for which high Kyn levels were associated with worse DC (HR = 1.76, 95%CI = 1.04 to 2.99, p = .035) and PFS (HR = 1.50, 95%CI = 1.05 to 2.15, p = .027) (Fig. S8 and 15).
We further pursued our analyses with Kyn/Trp ratios. Patients were dichotomized according to the distribution of Kyn/Trp ratios in plasmas (0.0429) (Fig. S9a). There was no correlation between Kyn/Trp ratios and clinical parameters (Table S3). However, patients with high Kyn/Trp ratios had dismal prognosis, most notably poor DC, (HR = 1.64, 95%CI = 1.03 to 2.62, p = .038, and Fig. S9). We confirmed the significant worse outcome of high Kyn/Trp ratios in patients with low and medium Köhne criteria in terms of DC (HR = 1.74, 95%CI = 1.01 to 3.00, p = .046) as well as PFS (HR = 1.51, 95%CI = 1.04 to 2.17, p = .029) (Fig. S9 and 15).
Next, we examined the prognostic value of AA levels and AA/Kyn ratios. Strikingly, patients with low AA levels (threshold 47.6 µM, corresponding to the highest tertile value in patients) had a significantly worse OS (HR = 1.47, 95%CI = 1.09 to 1.96, p = .010) and a tendency toward worse DC (), which was also true when considering patients with low and medium Köhne criteria only (HR = 1.44, 95%CI = 1.05 to 1.99, p = .025 for OS) (Fig. S10 and 15). We also found that patients with a low AA/Kyn ratio (threshold 32.13 corresponding to the highest quartile value in patients) had a significantly worse DC (HR = 1.66, 95%CI = 1.12 to 2.48, p = .013) (), which was also observed in the subgroup of patients with low and medium Köhne criteria (HR = 1.70, 95%CI = 1.09 to 2.65, p = .019 for DC) (Fig. S11 and 15). No other clinical differences were found between AA-low and AA-high patients or between AA/Kyn-low and AA/Kyn-high patients (Tables S4 and 5).
We next asked whether combining one of these parameters with high PrPC levels as inCitation5 would define a group of patients with particularly unfavorable prognostic. Interestingly, Trp-low (<28.1 µM) PrPC-high (≥ 8.7 ng/mL) patients had a significantly poorer OS (HR = 1.38, 95%CI = 1.01 to 1.88, p = .043) and PFS (HR = 1.37, 95%CI = 1.02 to 1.84, p = .035) and a tendency toward worse DC (HR = 1.34, 95%CI = 0.94 to 1.91, p = .109) ( and Fig. S12). Comparable results were obtained when considering patients with low and medium Köhne criteria: Trp-low PrPC-high patients had a significantly poorer OS (HR = 1.41, 95%CI = 1.01 to 1.98, p = .045) and a tendency toward worse PFS and DC (Fig. S12 and 15). Trp-low PrPC-high patients, were comparable to other patients in terms of gender, WHO performance status, Köhne criteria, number of metastatic sites or primary tumor location, but were significantly older (Table S6).
We then considered patients combining high Kyn (≥ 1.24 µM) and high PrPC levels (≥ 8.7 ng/mL), which were comparable to other patients in terms of age, gender, WHO performance status, Köhne criteria, number of metastatic sites or primary tumor location (Table S7). While this subgroup of patients had a significantly poorer DC than other patients (HR = 1.52, 95%CI = 1.07 to 2.15, p = .019) ( and Fig. S13), including when restricting these analyses to patients with low and medium Köhne criteria (HR = 1.61, 95%CI = 1.09 to 2.39, p = .016) (Fig. S13 and 15), combining Kyn and PrPC levels did not appear to outcompete Kyn or PrPC levels alone in terms of prognosis value (see and Fig. S15 andCitation5).
Finally, we found that the combination of AA-low (<47.6 nM) and PrPC-high (≥ 8.7 ng/mL) criteria defined a group of patients with worse DC (HR = 1.63, 95%CI = 1.18 to 2.24, p = .003) and OS (HR = 1.49, 95%CI = 1.13 to 1.98, p = .005) and a tendency toward worse PFS (HR = 1.21, 95%CI = 0.94 to 1.56, p = .137) ( and Fig. S14). These conclusions also hold true when restricting analyses to low and medium Köhne criteria patients (HR = 1.77, p = .002 for DC, HR = 1.48, p = .013 for OS and HR = 1.29, p = .074 for PFS) (Fig. S14 and 15). As for other clinical parameters, AA-low PrPC-high patients did not differ from other patients (Table S8).
Overall, these data corroborate the link between PrPC and IDO activity in patients and indicate that measuring plasma levels of Trp and its metabolites in addition to PrPC may help stratify patients in mCRC.
4. Discussion
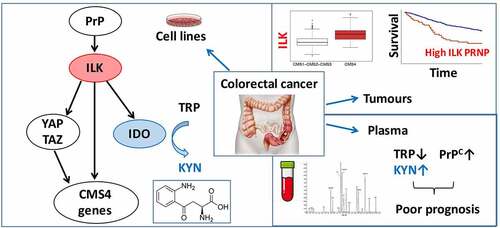
The cellular and molecular mechanisms sustaining the mesenchymal CMS4 phenotype in CRC remain poorly understood. Building upon our recent identification of PrPC as a candidate driver of this subtype, operating via YAP/TAZ and TGFß,Citation5 we here bring to light a novel PrPC-ILK cascade that sustains the expression of genes associated with the mesenchymal phenotype. We further provide evidence that IDO1, the rate-limiting enzyme in the Kynurenine pathway, is a downstream target of the PrPC-ILK axis, and that combined measurement of PrPC and Trp metabolites in the plasma of metastatic CRC patients has clinical impact ().
Figure 7. Schematic diagram. Molecular cascade linking PrPC with ILK and IDO1 and translational implications
ILK is a pleiotropic serine/threonine kinase that interacts with both ß1 and ß3 integrins and acts as a key component in multiple signaling cascades.Citation25,Citation26 It is overexpressed in various types of cancers and favors tumor progression by sustaining proliferation, migration and invasion.Citation25,Citation26 In CRC, ILK was shown to promote epithelial to mesenchymal transition (EMT), cancer stem cell (CSC) features and chemoresistance.Citation27 In addition, conditional deletion of Ilk in the mouse intestine was shown to protect against colitis-induced carcinogenesis.Citation28 Our rationale for studying ILK in the present context was based on (1) the reported activation of YAP/TAZ downstream from ILK in cancer cellsCitation21 and (2) the connection of PrPC with integrins described in various studies (see forCitation29 review) and highlighted here with our GSEA analyses (see ). Our in vitro data unambiguously posit ILK as a central effector mobilized by PrPC and relaying its action on YAP/TAZ and more largely on a panel of genes specifying the CMS4 phenotype. They also indicate that ILK activation controls the transcription of its own gene as well as that of PRNP, thereby highlighting the occurrence of a self-sustaining feedforward loop. Hence, induction of ILK expression in colonic cells in response to inflammation, as reported,Citation30 could be a primary event leading to PrPC overexpression and subsequent acquisition and maintenance of mesenchymal characteristics. From a translational point of view, another important observation is that ILK transcripts are overexpressed in CMS4 tumors and that high ILK expression is associated with poor OS and RFS, including within CMS4 patients. Of note, we also found that combined high ILK and PRNP expression defines a subgroup of patients with a particularly poor prognosis, again arguing that the PrPC-ILK axis has a very detrimental impact in CRC.
A second major finding of our study is the identification of IDO1 as a target of the PrPC-ILK axis in CRC. IDO1, the rate-limiting enzyme of the Kynurenine pathway, is frequently overexpressed in cancer and favors tumor progression by suppressing anti-tumor immune responses.Citation23 In the context of CRC, the seminal study by Brandacher and colleagues depicted an increased expression of IDO1 in tumoral versus normal adjacent tissue in a large panel of CRC cases.Citation31 Importantly, the authors noted that high IDO1 expression was associated with lower CD3+ cells and significantly correlated with the frequency of metastases.Citation31 More recently, tumoral IDO1 expression at the invasive front was shown to be significantly associated with worse OS as well as with the development of metachronous metastases.Citation32 Animal models have further allowed to incriminate tumor cell-derived, rather than tumor microenvironment-derived, IDO1 has an important contributor of tumor growth. Indeed, the growth of Ido1-expressing CT26 murine CRC cells in Ido1-deficient mice was shown to be significantly reduced upon administration of Ido1-targeting compounds.Citation33 Furthermore, mice with a specific deletion of Ido1 in colonic epithelial cells developed fewer and smaller tumors than their wild-type counterparts upon induction of colon tumorigenesis with an azoxymethane/dextran sodium sulfate (AOM/DSS) protocol.Citation34 In line with this, we provide evidence for strong IDO1 expression and activity in CMS4-type CRC cells and we show that these are under the control of PrPC and ILK, thereby bringing to light a new pathway for IDO1 induction. Our data further point to GSK3ß as a relay in the PrPC-ILK-dependent regulation of IDO1. From a functional standpoint, the IDO1-dependent production of Kynurenine metabolites is likely to exert both autocrine as well as paracrine effects in tumors. Among cell-autonomous impacts, Kyn, the proximal metabolite of the pathway, was shown to protect CRC cells from apoptosisCitation34 and to foster their proliferation via activation of the Aryl Hydrocarbon Receptor (AhR).Citation35 Hence, IDO1 activation could contribute to the PrPC-dependent resistance to 5-FU and to the PrPC and ILK-dependent regulation of proliferation, invasion and migration,Citation5and and h. We may further surmise that elevated IDO1 activity in CMS4 tumors contributes to set up an immune-tolerant microenvironment,Citation8 a major hallmark of this subtype.Citation4
Our data finally provide strong support for the translational relevance of our in vitro findings with the observation that Kyn/Trp ratios are elevated in the plasma of metastatic CRC patients and correlate with those of soluble PrPC. Of note, we discovered that the combined measurement of plasmatic Trp, Kyn, AA and PrPC concentrations has strong prognostic value. Indeed, we found that low Trp levels strongly correlate with worse PFS, as well as worse OS in the case of patients with low or medium Köhne criteria. A complementary observation is that both high Kyn levels and high Kyn/Trp ratios are associated with poor DC and PFS (although the latter correlations do not reach significance when considering all patients: HR = 1.36, 95%CI = 0.98 to 1.88, p = .065 and HR = 1.37, 95%CI = 0.98 to 1.91, p = .064, respectively), recalling the conclusions we obtained with soluble PrPC levels.Citation5 Our data fit in with the reported reduced serum Trp levels in CRC patients, correlating with impaired quality of life,Citation36 as well as with the increase in plasmatic Kyn levels in CRC patients, associated with poor OS.Citation37 This is however, to our knowledge, the first extensive analysis of both Trp and Kyn levels in the plasma of mCRC patients. Another novel observation is that low AA levels and low AA/Kyn ratios have a negative prognostic value, arguing that monitoring AA levels may be of interest, in particular when combined with PrPC (see ). Whether our findings may extend to non-metastatic CRC deserves further investigation. Undoubtedly, should Trp, Kyn, AA and PrPC circulating levels have prognostic impact in non-metastatic CRC, this would represent an important advance for patient stratification. In such a context, targeting IDO1 in combination with standard chemotherapyCitation38 would represent a valuable treatment option. Alternatively, combined IDO1 inhibition and immune checkpoint blockade therapy, the efficiency of which was recently demonstrated in syngeneic mice models,Citation39 may be envisioned. Altogether, our data warrant evaluating the therapeutic benefit of IDO1 targeting drugs in CRC of the CMS4 subtype.
Disclosure of potential conflicts of interest
The authors declare no competing interests in the present study.
Author contributions
A.G. and D.L-C.: collection and assembly of data, data analysis and interpretation and final approval of the manuscript; J.T., T.A., A.D., C.M. and K.L.M.: data collection and final approval of the manuscript; S.D.: material support; C.P., F.D. and A.D-R.: data analysis and interpretation and final approval of the manuscript; J-M.L.: conception and design, data analysis and interpretation and final approval of the manuscript. P.L-P.: conception and design, financial support, data analysis and interpretation and final approval of the manuscript. S.M-R.: conception and design, financial support, collection and assembly of data, data analysis and interpretation, manuscript writing and final approval of the manuscript.
Supplemental Material
Download ()Acknowledgments
We thank M. Bühler and G. Zürcher for expert methodological assistance and S. Lehmann for the pcDNA3-Prnp plasmid. We are grateful to Dr N. Vodovar for fruitful discussions and critical reading of our manuscript.
Supplementary material
Supplemental data for this article can be accessed on the publisher’s website.
Additional information
Funding
References
- Dienstmann R, Vermeulen L, Guinney J, Kopetz S, Tejpar S, Tabernero J. Consensus molecular subtypes and the evolution of precision medicine in colorectal cancer. Nat. Rev. Cancer. 2017;17(4):268. doi:10.1038/nrc.2017.24.
- Guinney J, Dienstmann R, Wang X, de Reyniès A, Schlicker A, Soneson C, Marisa L, Roepman P, Nyamundanda G, Angelino P, et al. The consensus molecular subtypes of colorectal cancer. Nat. Med. Nature Medicine. 2015;21(11):1350–14. doi:10.1038/nm.3967.
- Coebergh van den Braak RRJ, Ten HS, Sieuwerts AM, Tuynman JB, Smid M, Wilting SM, Martens JWM, Punt CJA, Foekens JA, Medema JP, et al. Interconnectivity between molecular subtypes and tumor stage in colorectal cancer. BMC Cancer. 2020;20(1):850. doi:10.1186/s12885-020-07316-z.
- Becht E, de Reyniès A, Giraldo NA, Pilati C, Buttard B, Lacroix L, Selves J, Sautès-Fridman C, Laurent-Puig P, Fridman WH. Immune and Stromal Classification of Colorectal Cancer Is Associated with Molecular Subtypes and Relevant for Precision Immunotherapy. Clinical Cancer Research. 2016;22(16):4057–4066. doi:10.1158/1078-0432.CCR-15-2879.
- Le Corre D, Ghazi A, Balogoun R, Pilati C, Aparicio T, Martin-Lannerée S, Marisa L, Djouadi F, Poindessous V, Crozet C, et al. The cellular prion protein controls the mesenchymal-like molecular subtype and predicts disease outcome in colorectal cancer. EBioMedicine. 2019;46:94–104. doi:10.1016/j.ebiom.2019.07.036.
- Calon A, Espinet E, Palomo-Ponce S, Tauriello DF, Iglesias M, Céspedes MV, Sevillano M, Nadal C, Jung P, Zhang X-F, et al. Dependency of colorectal cancer on a TGF-β-driven program in stromal cells for metastasis initiation. Cancer Cell. 2012;22(5):571–584. doi:10.1016/j.ccr.2012.08.013.
- Tauriello DVF, Palomo-Ponce S, Stork D, Berenguer-Llergo A, Badia-Ramentol J, Iglesias M, Sevillano M, Ibiza S, Cañellas A, Hernando-Momblona X, et al. TGFβ drives immune evasion in genetically reconstituted colon cancer metastasis. Nature. 2018;554(7693):538–543. doi:10.1038/nature25492.
- Munn DH, Mellor AL. IDO in the Tumor Microenvironment: inflammation, Counter-Regulation, and Tolerance. Trends Immunol. 2016;37(3):193–207. doi:10.1016/j.it.2016.01.002.
- Subramanian A, Tamayo P, Mootha VK, Mukherjee S, Ebert BL, Gillette MA, Paulovich A, Pomeroy SL, Golub TR, Lander ES, et al. Gene set enrichment analysis: a knowledge-based approach for interpreting genome-wide expression profiles. Proceedings of the National Academy of Sciences. 2005;102(43):15545–15550. doi:10.1073/pnas.0506580102.
- Marisa L, de Reynies A, Duval A, Selves J, Gaub MP, Vescovo L, Etienne-Grimaldi MC, Schiappa R, Guenot D, Ayadi M, et al. Gene expression classification of colon cancer into molecular subtypes: characterization, validation, and prognostic value. PLoS Med. 2013;10(5):e1001453. doi:10.1371/journal.pmed.1001453.
- Aparicio T, Ghiringhelli F, Boige V, Le Malicot K, Taieb J, Bouché O, Phelip J-M, François E, Borel C, Faroux R, et al. Bevacizumab Maintenance Versus No Maintenance During Chemotherapy-Free Intervals in Metastatic Colorectal Cancer: a Randomized Phase III Trial (PRODIGE 9). Journal of Clinical Oncology. 2018;36(7):674–681. doi:10.1200/JCO.2017.75.2931.
- Boulet L, Faure P, Flore P, Montérémal J, Ducros V. Simultaneous determination of tryptophan and 8 metabolites in human plasma by liquid chromatography/tandem mass spectrometry. Journal of Chromatography B. 2017;1054:36–43. doi:10.1016/j.jchromb.2017.04.010.
- Bui T, Rennhack J, Mok S, Ling C, Perez M, Roccamo J, Andrechek ER, Moraes C, Muller WJ. Functional Redundancy between β1 and β3 Integrin in Activating the IR/Akt/mTORC1 Signaling Axis to Promote ErbB2-Driven Breast Cancer. Cell Rep. 2019;29(3):589–602.e6. doi:10.1016/j.celrep.2019.09.004.
- Parvani JG, Galliher-Beckley AJ, Schiemann BJ, Schiemann WP, Luo K. Targeted inactivation of β1 integrin induces β3 integrin switching, which drives breast cancer metastasis by TGF-β. . Molecular Biology of the Cell. 2013;24(21):3449–3459. doi:10.1091/mbc.E12-10-0776.
- Legate KR, Montañez E, Kudlacek O, Füssler FR. ILK, PINCH and parvin: the tIPP of integrin signalling. . Nature Reviews Molecular Cell Biology. 2006;7(1):20–31. doi:10.1038/nrm1789.
- Taieb J, Balogoun R, Le Malicot K, Tabernero J, Mini E, Folprecht G, Van Laethem J-L, Emile J-F, Mulot C, Fratté S, et al. Adjuvant FOLFOX +/− cetuximab in fullRAS andBRAF wildtype stage III colon cancer patients. . Annals of Oncology. 2017;28(4):824–830. doi:10.1093/annonc/mdw687.
- Medico E, Russo M, Picco G, Cancelliere C, Valtorta E, Corti G, Buscarino M, Isella C, Lamba S, Martinoglio B, et al. The molecular landscape of colorectal cancer cell lines unveils clinically actionable kinase targets. Nature Communications. 2015;6(1):7002. doi:10.1038/ncomms8002.
- Roumeliotis TI, Williams SP, Gonçalves E, Alsinet C, Del Castillo Velasco-Herrera M, Aben N, Ghavidel FZ, Michaut M, Schubert M, Price S, et al. Genomic Determinants of Protein Abundance Variation in Colorectal Cancer Cells. Cell Rep. 2017;20(9):2201–2214. doi:10.1016/j.celrep.2017.08.010.
- Sveen A, Bruun J, Eide PW, Eilertsen IA, Ramirez L, Murumägi A, Arjama M, Danielsen SA, Kryeziu K, Elez E, et al. Colorectal Cancer Consensus Molecular Subtypes Translated to Preclinical Models Uncover Potentially Targetable Cancer Cell Dependencies. Clinical Cancer Research. 2018;24(4):794–806. doi:10.1158/1078-0432.CCR-17-1234.
- Troussard AA, McDonald PC, Wederell ED, Mawji NM, Filipenko NR, Gelmon KA, Kucab JE, Dunn SE, Emerman JT, Bally MB, et al. Preferential dependence of breast cancer cells versus normal cells on integrin-linked kinase for protein kinase B/Akt activation and cell survival. Cancer Res. 2006;66(1):393–403. doi:10.1158/0008-5472.CAN-05-2304.
- Serrano I, McDonald PC, Lock F, Muller WJ, Dedhar S. Inactivation of the Hippo tumour suppressor pathway by integrin-linked kinase. Nature Communications. 2013;4(1):2976. doi:10.1038/ncomms3976.
- Oloumi A, Syam S, Dedhar S. Modulation of Wnt3a-mediated nuclear β-catenin accumulation and activation by integrin-linked kinase in mammalian cells. Oncogene. 2006;25(59):7747–7757. doi:10.1038/sj.onc.1209752.
- Opitz CA, Somarribas Patterson LF, Mohapatra SR, Dewi DL, Sadik A, Platten M, Trump S. The therapeutic potential of targeting tryptophan catabolism in cancer. British Journal of Cancer. 2020;122(1):30–44. doi:10.1038/s41416-019-0664-6.
- Soichot M, Hennart B, Al Saabi A, Leloire A, Froguel P, Levy-Marchal C, Poulain-Godefroy O, Allorge D, Chadwick BP. Identification of a variable number of tandem repeats polymorphism and characterization of LEF-1 response elements in the promoter of the IDO1 gene. PloS One. 2011;6(9):e25470. doi:10.1371/journal.pone.0025470.
- McDonald PC, Fielding AB, Dedhar S. Integrin-linked kinase – essential roles in physiology and cancer biology. Journal of Cell Science. 2008;121(19):3121–3132. doi:10.1242/jcs.017996.
- Zheng -C-C, Hu H-F, Hong P, Zhang Q-H, Xu WW, He Q-Y, Li B. Significance of integrin-linked kinase (ILK) in tumorigenesis and its potential implication as a biomarker and therapeutic target for human cancer. American Journal of Cancer Research. 2019;9:186–197.
- Tsoumas D, Nikou S, Giannopoulou E, Champeris Tsaniras S, Sirinian C, Maroulis I, Taraviras S, Zolota V, Kalofonos HP, Bravou V. ILK Expression in Colorectal Cancer Is Associated with EMT, Cancer Stem Cell Markers and Chemoresistance. Cancer Genomics Proteomics. 2018;15(2):127–141. doi:10.21873/cgp.20071.
- Assi K, Mills J, Owen D, Ong C, St Arnaud R, Dedhar S, Salh B. Integrin-linked kinase regulates cell proliferation and tumour growth in murine colitis-associated carcinogenesis. Gut. 2008;57(7):931–940. doi:10.1136/gut.2007.142778.
- Hirsch TZ, Martin-Lannerée S, Mouillet-Richard S. Functions of the Prion Protein. Prog. Mol. Biol. Transl. Sci 2017;150:1–34. doi:10.1016/bs.pmbts.2017.06.001.
- Assi K, Patterson S, Dedhar S, Owen D, Levings M, Salh B. Role of epithelial integrin-linked kinase in promoting intestinal inflammation: effects on CCL2, fibronectin and the T cell repertoire. BMC Immunol. 2011;12(1):42. doi:10.1186/1471-2172-12-42.
- Brandacher G, Perathoner A, Ladurner R, Schneeberger S, Obrist P, Winkler C, Werner ER, Werner-Felmayer G, Weiss HG, G√∂bel G, et al. Prognostic value of indoleamine 2,3-dioxygenase expression in colorectal cancer: effect on tumor-infiltrating T cells. Clinical Cancer Research. 2006;12(4):1144–1151. doi:10.1158/1078-0432.CCR-05-1966.
- Ferdinande L, Decaestecker C, Verset L, Mathieu A, Moles Lopez X, Negulescu A-M, Van Maerken T, Salmon I, Cuvelier CA, Demetter P. Clinicopathological significance of indoleamine 2,3-dioxygenase 1 expression in colorectal cancer. British Journal of Cancer. 2012;106(1):141–147. doi:10.1038/bjc.2011.513.
- Koblish HK, Hansbury MJ, Bowman KJ, Yang G, Neilan CL, Haley PJ, Burn TC, Waeltz P, Sparks RB, Yue EW, et al. Hydroxyamidine inhibitors of indoleamine-2,3-dioxygenase potently suppress systemic tryptophan catabolism and the growth of IDO-expressing tumors. Molecular Cancer Therapeutics. 2010;9(2):489–498. doi:10.1158/1535-7163.MCT-09-0628.
- Bishnupuri KS, Alvarado DM, Khouri AN, Shabsovich M, Chen B, Dieckgraefe BK, Ciorba MA. IDO1 and Kynurenine Pathway Metabolites Activate PI3K-Akt Signaling in the Neoplastic Colon Epithelium to Promote Cancer Cell Proliferation and Inhibit Apoptosis. Cancer Res. 2019;79(6):1138–1150. doi:10.1158/0008-5472.CAN-18-0668.
- Venkateswaran N, Lafita-Navarro MC, Hao Y-H, Kilgore JA, Perez-Castro L, Braverman J, Borenstein-Auerbach N, Kim M, Lesner NP, Mishra P, et al. MYC promotes tryptophan uptake and metabolism by the kynurenine pathway in colon cancer. Genes Dev. 2019;33(17–18):1236–1251. doi:10.1101/gad.327056.119.
- Huang A, Fuchs D, Widner B, Glover C, Henderson DC, Allen-Mersh TG. Serum tryptophan decrease correlates with immune activation and impaired quality of life in colorectal cancer. British Journal of Cancer. 2002;86(11):1691–1696. doi:10.1038/sj.bjc.6600336.
- Cavia-Saiz M, Muñiz Rodríguez P, Llorente Ayala B, García-González M, Coma-Del Corral MJ, García Girón C. The role of plasma IDO activity as a diagnostic marker of patients with colorectal cancer. Molecular Biology Reports. 2014;41(4):2275–2279. doi:10.1007/s11033-014-3080-2.
- Vacchelli E, Aranda F, Eggermont A, Sautès-Fridman C, Tartour E, Kennedy EP, Platten M, Zitvogel L, Kroemer G, Galluzzi L. Trial watch: IDO inhibitors in cancer therapy. Oncoimmunology 2014;3(10):e957994. doi:10.4161/21624011.2014.957994.
- Gomes B, Driessens G, Bartlett D, Cai D, Cauwenberghs S, Crosignani S, Dalvie D, Denies S, Dillon CP, Fantin VR, et al. Characterization of the Selective Indoleamine 2,3-Dioxygenase-1 (IDO1) Catalytic Inhibitor EOS200271/PF-06840003 Supports IDO1 as a Critical Resistance Mechanism to PD-(L)1 Blockade Therapy. Molecular Cancer Therapeutics. 2018;17(12):2530–2542. doi:10.1158/1535-7163.MCT-17-1104.