
ABSTRACT
PD-L2 expression is an important predictor of anti-PD-1 therapy efficacy in patients with head and neck squamous cell carcinoma (HNSCC). However, whether the PD-L2-based immune signature can serve as a prognostic biomarker for patients with HNSCC remains unclear. Here, we reported that PD-L2 was positively stained in 62.7% of tumors, which was more than twice as that of PD-L1, and in 61.4% of patients with PD-L1-negative tumors. Survival tree analysis (STA) revealed that PD-L2high was an independent predictor of poor overall survival (OS). Six patterns were generated from STA, demonstrating that patients with PD-L2lowCD3high were associated with an improved median OS of 72 months and prognostic index (PI) of −3.95 (95% CI, −5.14 to −2.76), whereas patients with PD-L2highCD3lowCD8low to a median OS of 10 months and PI of 1.43 (95% CI, 0.56 to 2.30). Analysis of single-cell RNA sequencing showed that PD-L2 expression was associated with IL-6 expression. We confirmed that IL-6 augments PD-L2 expression in HNSCC cell lines. The PD-L2-based immune signature can serve as an effective biomarker for anti-PD-1 therapy. In addition, PD-L2 may serve as a potential immunotherapeutic target, and we propose anti-IL6 therapy in the adjuvant setting for patients with HNSCC with high PD-L2 expression.
Introduction
More than 800,000 new cases of head and neck tumors have been reported in 2018 worldwide. More than 400,000 patients die from the disease every year, of which approximately 90% had head and neck squamous cell carcinoma (HNSCC) subtype.Citation1,Citation2 Approximately 19–46% of patients with HNSCC are diagnosed with lymph node metastasis, and 15–50% of patients develop tumor recurrence after standard care therapies.Citation3–5 Although progress has recently been made in understanding the immune and genomic landscape of HNSCC, few effective therapeutic options are present for recurrent or metastatic (R/M) HNSCC.
Accumulating evidence indicates immune dysregulation within the tumor microenvironment in human cancers, including advanced HNSCC.Citation6–8 PD-1, also known as CD279, is an important immunosuppression checkpoint molecule, which is mainly expressed in activated B cells, NK cells, T cells and APCs.Citation9 Blocking immune checkpoint by targeting the PD-1/PD-L1 axis improves the survival of patients with recurrent/metastatic (R/M) HNSCC.Citation10,Citation11 For instance, PD-1 or PD-L1 monoclonal antibodies (mAbs) improve the overall survival (OS) of patients with melanoma, hepatocellular carcinoma, gastric cancer and lung cancer.Citation12–16 However, patients with HNSCC harboring PD-L1-expressing tumors responded poorly to anti-PD-1 blockade treatment in several clinical trials.Citation17,Citation18 Additionally, the clinical benefits of PD-1 mAb were also seen in PD-L1-negative patients in some cancer types, such as in patients with lung squamous cell carcinoma (LUSC) and renal cell carcinoma (RCC), suggesting that only evaluating PD-L1 was not sufficient for patient selection.Citation19 These findings highlight the urgent need to explore more effective immune signature biomarkers in HNSCC.
PD-L2 is another ligand of PD-1, which is similar to PD-L1 in some functions and mainly affects the regulatory T cells.Citation20 PD-L2 is reported to be important for the response of patients who are PD-L1-negative to PD-1 inhibitors.Citation21 The PD-1 binding affinity of PD-L2 is approximately 2-6-fold higher compared to PD-L1.Citation22 PD-L2 was originally found to be expressed in dendritic and macrophages cells.Citation23 However, recent studies demonstrated that PD-L2 is overexpressed in many solid malignancies, including HNSCC,Citation21,Citation24 suggesting that abnormal intratumoural PD-L2 expression promotes immunosuppression. In certain cancers including colorectal, esophageal, pancreatic and renal cell carcinomas, PD-L2 expression has been reported as an independent marker for poor outcomes.Citation24–27 High PD-L2 expression on PD-1+ tumor infiltrating lymphocytes (TILs) was detected, suggesting its immunosuppressive role.Citation28,Citation29 PD-L2 expression was detected in HNSCC and prostate cancer, which are typically PD-L1-negative.Citation21,Citation30 These studies indicated that intratumoural PD-L2 level may serve as a predictive marker or target for anti-PD-1 therapy response evaluation in HNSCC.
However, the significance of PD-L2 in immunosuppression and its therapeutic potential in HNSCC is still obscure. Therefore, we aimed to establish the value of PD-L2-based immune signature for predicting and monitoring the responses of patients with HNSCC to PD-1 inhibitor by evaluating the levels of immune checkpoint protein and T cell markers, including PD-1, CD3, CD8, and FOXP3.
Materials and methods
Clinical features of patients with HNSCC
Fifty-nine patients with HNSCC were included in the study. All patients were admitted to the Department of Maxillofacial and Otorhinolaryngological Oncology of Tianjin Medical University Cancer Institute and Hospital and underwent surgery. Retrospective analysis of clinical characteristics including age, sex, tobacco use, alcohol intake, tumor size and primary site was conducted. All patients involved in this article have signed the informed consent form and have been completely anonymous in this article. This study was approved by the Ethics Committee of Tianjin Medical University Cancer Institute and Hospital (Ek2019179).
Sample Deglycosylation in immunohistochemistry
Formalin-fixed paraffin-embedded specimens were used for immunohistochemistry (IHC) analysis. Tissue slides were incubated with PNGase F overnight at 37°C to remove glycosylation. The tissue slides were incubated with primary antibodies against FOXP3 (Abcam 236A/E7, 1:100 dilution), CD3 (Abcam SP162, 1:150 dilution), CD8 (Invitrogen SP16, 1:100 dilution), PD1 (Abcam NAT105, 1:50 dilution), PD-L1 (Invitrogen MIH1, 1:50 dilution) and PD-L2 (R&D Systems 176611, 1:200 dilution). The sections were PD-L1-positive if ≥1% of tumor cells were stained in the cell membrane.Citation31 The sections were PD-L2-positive if ≥5% of tumor cells had immunoreactivity.Citation32 The sections were PD-1-positive if ≥1% of tumor cells had immunoreactivity.Citation33 The cell densities were measured with Cellsens standard software (Olympus, Japan) at 200× and defined as the number of cells positive for each marker (for example, CD3, CD8 and FOXP3) per field. The upper quartile was defined as the T cell density cutoff point. The cutoff values for intratumoural counts of CD3+, CD8+ and FOXP3+ T cells were 47, 74 and 27, respectively, while those of stromal CD3+, CD8+ and FOXP3+ T cells were 286, 261 and 88, respectively. All scores were independently assessed by two experienced pathologists.
Survival tree analysis model
A survival tree analysis (STA) model was established using minimal depth and variable importance (VIMP). The threshold of VIMP was set to evaluate the predicted value of the included variables, which were then sorted into the STA model based on their importance. The minimum depth negatively correlated with the predicted value of the variable. The nodes were evaluated using the Kaplan-Meier analysis.
In vivo xenograft tumor mode
For in vivo experiments, approximately 5 × 10⁵ murine HNSCC SCC7 cells, were subcutaneously injected into 5-week-old female C3H immunocompetent mice (n = 28). Mice were injected with anti-PD-1 mAb (Bio X Cell, BE0146), anti-PD-L1 mAb (Bio X Cell, BE0112) or anti-PD-L2 mAb (Bio X Cell, BE0101) every 2 days (150 μg/mouse). The animal study was approved by the Animal Care and Use Committee of Tianjin Medical University Cancer Institute and Hospital (TMUaMEC 2017016).
Circulating Tumor Cell isolation
Whole blood samples were incubated with biotin-labeled CD45 antibody (Abcam ab40763, 1:100 dilution) and then exposed to streptavidin-labeled dynabeads to deplete white blood cells. Primary antibodies against EpCAM (Cell Signaling Technology VU1D9, 1:800) were added to the cell suspension for 1 h and then stained with Alexa Fluor® 488 (Abcam) to identify circulating tumor cells (CTCs). Enriched cells were washed with PBS and centrifuged at 800 g for 5 min. The sample was then detected using a BD FACSARIA III cell sorter (BD biosciences, USA).
TILs isolation and analysis
Fresh tumor tissues from mice were cut into pieces (≤5 mm3) and treated with collagenase for 1.5 h at 37°C. Then, tissue homogenates were filtered through 70-μm cell strainer. Density centrifugation was separated by Ficoll-Paque TM PLUS gradients and removed the supernatant. After centrifugation, plasma portion was discarded, and lymphocytes monocytes platelets was collected. And TIL cells were recovered and stained using CD3-FITC ((BioLegend 100203, 1:50 dilution)), NK1.1-APC-Cy7 (BioLegend 108723, 1:20 dilution), CD8-PE (BioLegend 344705, 1:20 dilution), CD45-PerCP (BioLegend 368505, 1:20 dilution), and IFNγ-APC (BioLegend 502529,1:20 dilution). BD FACS Canto II (BD Biosciences) cytometer was used to analyze.
Single-cell sequencing
Sample preparation, single cell capture, reverse transcription, cDNA amplification, library construction, RNA sequence and data analysis were performed by the Gene Denovo Company (Guangzhou, China). Briefly, we obtained fresh HNSCC primary tumor tissues from two treatment-naive patients admitted to the Department of Maxillofacial and Otorhinolaryngological Oncology of Tianjin Medical University Cancer Institute and Hospital. The samples were immediately dissociated with the Gentle MACS Dissociator (Miltenyi Biotec). Due to the two samples had identical AJCC stage, primary site, pathological type and differentiation status, we mixed the single cell suspension of two samples with same label in order to obtain enough cell, and generate the single-cell libraries. Next, count single cells with Countess® II Automated Cell Counter and adjusted cell concentration to 1000 cells/μL approximately. We collected 20,000 cells and actually 14,343 cells were input to Chromium Controller that generates single-cell Gel Bead-In- Emulsions (GEMs). Then, lyse cells to extract RNA, and the RNAs were reverse-transcribed into cDNA, followed by PCR amplification (53°C, 10 min; 85°C, 5 min and 4°C hold). Libraries were constructed with Chromium Next GEM Single Cell 3ʹ Reagent Kits v3.1 and were sequenced using Nova 6000 sequencing system (Illumina). Using the CellRanger and quality control criteria (number of uniquely detected genes: 100–6000/cell, number of unique molecular identifier (UMI) < approximately 35,000/cell and mitochondrial gene expression <10%), we handled dropouts and doublets briefly, finally obtained single-cell transcriptomes for approximately 13,903 cells. Single cell RNA sequencing (scRNA-seq) data analysis, including standardization, cell subpopulation, differential expression analysis and marker gene screening, were performed using the Seurat software which was the main R package used in scRNA-seq data analysis to perform quality control,Citation34,Citation35 principal component analysis (PCoA), the uniform manifold approximation and projection for dimension reduction (UMAP) analysis. To overcome the extensive technical noise, PCoA was performed based on highly variable genes. Then, UMAP was used to further summarize the result of principal components. Raw scRNA-seq data were uploaded to the GEO database (GSE163872).
Pathway Profiling and Gene Set Enrichment Analysis
Gene set enrichment analysis (GSEA) was used to analyze scRNA-seq data. We first generated a list of all differentially expressed genes among every cluster, then used Hallmark gene sets from the Molecular Signatures database (MSigDB v7.2) to analyze every cluster and compared the target cluster with other clusters to find associated signatures or pathways. The gene sets from the GSEA were significant if nominal p-value was ≤.05 normalized enrichment score (NES) was ≥1, and false discovery rate (FDR) q-value was ≤.25. The gene set variation analysis (GSVA) algorithm was further implemented to estimate and compare the cancer hallmark-associated statuses between clusters. GSVA scores using the Wilcoxon rank-sum test were used to calculate statistical significance.
Statistical analysis
Experimental results were analyzed using Mann-Whitney U test or Wilcoxon paired t-test, McNemar’s or chi-squared test and ANOVA test. Multivariate Cox regression models and Kaplan-Meier analysis were used to assess survival. Statistical analyses were conducted using SAS version 9.4 (SAS Institute Inc., North Carolina, USA) and Prism version 8 (GraphPad Software, California, USA). Statistical significance was defined as p < .05.
Results
Patient characteristics
In the study, a total of 59 patients with HNSCC aged 28–77 years (median, 58 years) were included. Majority of the patients were male (69.49%) and smokers (61.02%), with 28 cases of primary tumors in the oral cavity. Forty-eight (81.4%) deaths were recorded, with a median follow-up time of 45 months. All patients whose tumor specimens were used to analyze PD-L2 and PD-L1 expression underwent surgery at the time of diagnosis and did not receive any neoadjuvant therapy, including chemotherapy or radiotherapy. The clinical and pathological features of the patients are detailed in .
Table 1. Clinico-pathological characteristics of 59 HNSCC patients and association with PD-L2 expression
PD-L2 is expressed in the majority of patients with HNSCC
IHC staining revealed PD-L2 expression in the majority of tumors (37/59, 62.71%, ). Moreover, PD-L2 levels were strongly correlated with AJCC staging (p = .0327, , ). Compared to that in non-metastatic tumors, the density of intratumoural PD-L2+ cells were significantly higher in samples of lymph node metastatic tumors (p = .0006; ). The expression of PD-L1 was detected in 15 of 59 specimens (25.42%), and the staining density and intensity of PD-L1-positive tumor cells were significantly weaker than those of PD-L2-positive tumor cells (Supp. ). The expression of PD-L1 and PD-L2 was strongly correlated (p < .0001; Supp. ) in the tumors. Moreover, 61.36% of the tumor specimens were PD-L2-positive in PD-L1-negative samples (). Compared to specimens expressing only PD-L1, specimens expressing both PD-L2 and PD-L1 and those expressing only PD-L2 were more common. These results show that the intratumoural PD-L2 level was higher than that of PD-L1 in HNSCC specimens, suggesting that PD-L2 plays a compensatory role in immunosuppression in the absence of PD-L1.
Figure 1. Expression and distribution of PD-L2 in HNSCC specimens. (a) Representative immunohistochemistry (IHC) staining of PD-L2 in human HNSCC tumors. PD-L2 staining is negative if value is 0, weak if value is 1+, moderate if value is 2+, and strong if value is 3 + . Scale bar: 20 μm. (b) Comparing PD-L2 expression in different AJCC stages by Box plots. (c) Comparing PD-L2 expression in tumors with or without lymph node metastasis by Dot plots. (d) Correlation between the expression of intratumoural PD-L2 and PD-L1 using McNemar’s test. (e) Representative IHC staining of PD-L2 level in stromal cells. Comparison of PD-L2+ cells in intratumoural and stromal density using paired t tests. (f) Representative IHC staining of PD-L2 on a commercially purchased tissue microarray (HN803f, US Biomax) containing 61 primary and 8 metastatic HNSCC samples and 11 adjacent normal tongue specimens. (g) Differential expression of PD-L2 in normal tongue tissues, primary HNSCC specimens and metastatic HNSCC samples
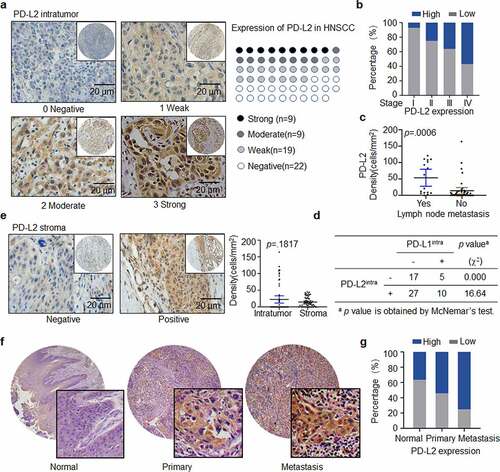
Forty-three HNSCC specimens were PD-L2-positive in the stroma. The density of PD-L2-positive cells in tumors was higher than that in stroma, although the difference was not statistically significant (p = .1817; ). Also, PD-L1 expression in the stroma was not statistically significant (p = .1516; Supp. ). There was no association between the expression intensity of tumors expressing PD-L1 and PD-L2 in the stroma (p = .0737; Supp. ).
We further validated PD-L2 expression in HNSCC specimens obtained from a commercially available tissue microarray (TMA HN803f, Biomax US) (, Supp. ), which included 61 primary HNSCC tissues, eight metastatic HNSCC tissues and 11 normal tongue tissues. We confirmed that 86.96% of tumor specimens were PD-L2-positive and metastatic tumors exhibited a higher level of PD-L2 compared to primary tumors and non-tumor tissues ().
Figure 2. Heterogeneity of PD-1, PD-L1, and PD-L2 expression in HNSCC. (a) Correlation between cell density of PD-1-positive lymphocytes and TILs identified by CD8+ staining in HNSCC specimens. (b) Relation among cell density of PD-1+ TILs based on PD-L2 expression level. (c) Based on differential expression of PD-1, PD-L1 and PD-L2, the tumor microenvironment can be divided into four different types. (d) Representative immunohistochemical patterns of adaptive immune resistance with PD-1+, PD-L2+, CD8+, and PD-L1− cells
PD-L2 expression and clinicopathological features of HNSCC specimens
PD-L2 expression had a positive relation with lymph node metastasis, AJCC staging and differentiation grade (p = .0011, .0327 and .0371, respectively; ). In univariate analysis, primary site, lymph node metastasis, differentiation grade and clinical stage (AJCC 2018), intratumoural PD-L2, CD3, CD8, and stromal CD3 were associated with poor prognosis (). Notably, 62.5% (10/16) of the tumors displayed moderate or high PD-L2 staining in patients with lymph node metastasis. The status of PD-L2 (HR, 11; 95% CI, 3.424–34.821; p < .0001) and CD8 (HR, 0.14; 95% CI, 0.05–0.399; p = .0002) were independent prognostic factors for tumors ().
Table 2. Univariate analysis of overall survival factors
Table 3. Multivariate analysis of overall survival factors
PD-1 expression is associated with PD-L2 expression
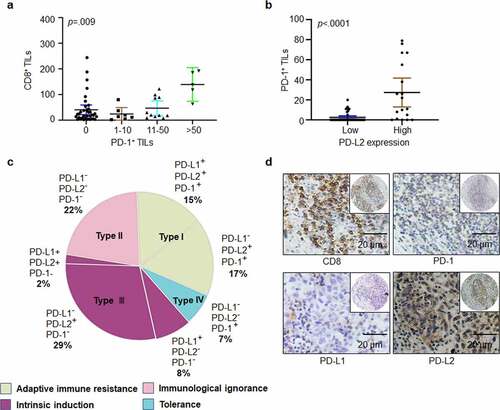
PD-L2 plays a significant role in immune escape in HNSCC by binding to PD-1-positive TILs. In total, 38.98% (23/59) of tumor specimens were positive for PD-1-positive TILs. PD-1-positive cells showed higher levels of CD8 expression, and PD-1+ TILs had a positive correlation with CD8+ TILs (p = .009; ). PD-1 positive TILs were detected in 4 out of 22 (median, 9.5 counts; range, 5–11) PD-L2-negative specimens and in 19 out of 37 (median, 20 counts; range, 1–79) PD-L2-positive samples. Notably, the median counts of PD-1+ TILs were positively correlated with PD-L2 expression intensity (p < .0001, ).
Four different tumor microenvironments were observed: type I, adaptive immune resistance, was observed in 32% of cases with TIL and PD-L1 expression; type II, immunologic ignorance, was observed in 22% of cases with lack of both TIL, PD-L1 or PD-L2; type III, intrinsic induction, as observed in 39% of cases with PD-L1 and PD-L2 expression and TIL deficiency; and type IV, tolerance, was observed in 7% of cases with TILs and lack of PD-L1 expression (). In addition, the presence of PD-L2 and PD-1 with the absence of PD-L1 were frequently observed ().
PD-L2 plays a critical role in immune suppression in a mouse xenograft tumor model
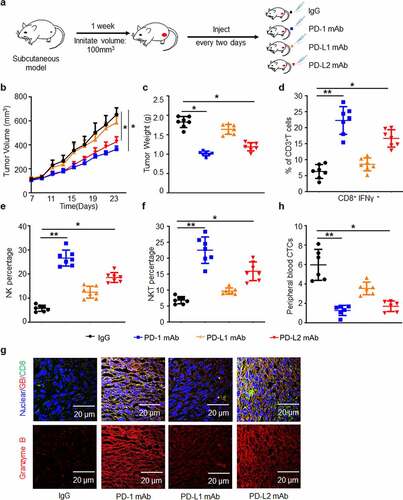
Next, we established a C3H immunocompetent mouse model and examined the potential role of PD-L2 in the presence of PD-L1 (). MAb of PD-1 or PD-L2 displayed significant anti-tumor effects, whereas PD-L1 mAb exhibited limited inhibitory effect on tumor growth (, c). We showed that the number of activated CD8+IFN-γ+ T cells in TILs of the PD-L2 mAb group was twice as that of the PD-L1 mAb group ( and Supp. ). Similar patterns were found in CD335+ NK and NK1.1+ NKT cell counts (, f and Supp. , c). In contrast to the PD-L1 mAb group, cytotoxic T cell activity was elevated in the PD-L2 mAb group, as indicated by immunostaining of granzyme B (). These results demonstrated that treatment with the mAb of PD-1 or PD-L2 could dramatically induce immune cell infiltration in tumors. In addition, CTCs, representing a high capacity of tumor metastasis, were significantly reduced in both PD-1 mAb and PD-L2 mAb groups ( and Supp. ). Taken together, in comparison with PD-L1, PD-L2 played a major immunosuppressive role in our in vivo model.
Figure 3. PD-L2 plays a determined role in immunosuppression in vivo. (a) Efficacies of various monoclonal antibodies (mAbs) against murine HNSCC SCC7 cell xenograft tumors in vivo. SCC7 cells (approximately 5.0 × 10⁵) were injected subcutaneously on day 0, and treated with mAb on days 7, 9, 11 and 13. (b) Tumor growth was monitored twice a week (n = 7 per group). (c) Tumor weight was decreased in mice treated with PD-L2 mAb but not PD-L1 mAb. (d) Quantification of CD8+ IFN-γ+ in CD3+ T cell populations from isolated TILs using flow cytometry. (e) CD335+ NK cells detected by CD45 were examined. (f) CD3+ NKT cells detected by NK1.1 were examined. (g) Immunofluorescence staining showed the protein levels of CD8 and Granzyme B (GB) in SCC7 tumor masses. Scale bar: 20 µm. (h) Circulating tumor cell (CTC) enumeration in the peripheral blood of mice was determined by flow cytometry. The higher number of CTC was detected in PD-L1 mAb-treated mice than in the PD-L2 mAb group. *p < .05, **p < .01
PD-L2 correlates with immune-related protein expression in HNSCC
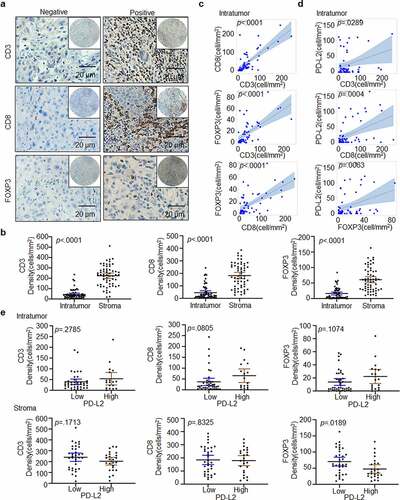
With the above demonstration of PD-L2 in anti-tumor immunity in HNSCC, we further studied the correlation between the expression of immune-related genes and PD-L2 (). We found that in the tumor bulk, the density of CD8+ T cells, CD3+ T cells and FOXP3+ Tregs was dramatically lower than that in the stroma (p < .0001; ). In both intratumoural and stromal regions, the number of CD8+ or CD3+ T cells was significantly higher than the number of FOXP3+ Tregs (). The number of FOXP3+ Tregs, CD3+ T cells and CD8+ T cells were positively correlated in the tumor bulk (p < .0001, ). In the tumor bulk, a positive correlation was found among the density of, PD-L2+ tumor cells and CD3+ T cells (p = .0289), CD8+ T cells (p = .0004), FOXP3+ Tregs (p = .0063; ). However, there was no significant association between stromal PD-L2 and CD3, CD8 and FOXP3 (Supp. ). Therefore, PD-L2 is strongly associated with the expression of immune-related genes in tumor cells.
Figure 4. Immune marker expression in HNSCC. (a) Representative IHC staining of CD3, CD8 and FOXP3 in HNSCC specimens. Scale bar: 20 μm. (b) Paired t-test was used to compare the density of intratumoural CD3+, CD8+ and FOXP3+ cells in HNSCC. (c) Scatter plots with linear regression for intratumoural CD3, CD8 and FOXP3 levels using ANOVA test. (d) Scatter plots for intratumoural PD-L2 with CD3, CD8 and FOXP3 levels respectively using ANOVA test. (e) Relationship between CD3+, CD8+ and FOXP3+ TILs cell densities based on PD-L2 expression levels in tumor and stroma using the Kruskal–Wallis test
Prognostic model for predicting OS in HNSCC
We validated that high expression of intratumoural PD-L2 indicates a shorter OS (median OS, 25 months vs. 60 months; p < .001; ). The expression of CD3 (p = .2785, ), CD8 (p = .0805, ) and FOXP3 (p = .1074, ) was divided into two groups without a direct relationship with OS. Therefore, we assumed that immune cells might affect OS differently due to tumoral and stromal expression. This notion was supported by our data showing that the expression of CD3, PD-1 and CD8 was at least partially involved in OS (). More importantly, evaluation of T cell subpopulations with different biomarker expression may be a more accurate prognostic signature for predicting OS in HNSCC. To select survival-related variables, expression of intratumoural PD-L2 and intratumoural/stromal CD3, PD-1, FOXP3 and CD8 was included in our STA model.
Figure 5. PD-L2-based immune signature correlates with survival of patients with HNSCC. (a) Kaplan-Meier method for overall survival (OS) based on intratumoural and stromal levels of PD-L2 and other immune markers. (b) Random survival tree analysis (STA) model using the variable of importance (VIMP) and minimal depth of prognostic variables in predicting OS. Longer VIMP bars with shorter minimal depth bars indicate a greater influence of the variable. (c) The variables selected by the STA model were used to generate a survival tree. (d) Waterfall plot of each prognostic index was drawn from the six nodes
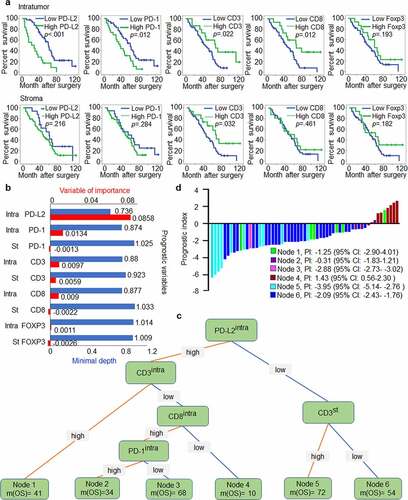
We found that intratumoural CD3, CD8, and PD-1 levels significantly influenced OS. PD-L2 was the most influential variable in importance analysis. While stromal PD-1, stromal CD8, and intratumoural and stromal FOXP3 levels had VIMP scores of −0.0013, −0.0022, 0.0011 and −0.0026, they all had the maximal values with a minimal depth higher than the cutoff value of minimal depth (0.9308); thus, they were excluded from the STA model ().
Our study identified six nodes that could characterize the prognostic signature in HNSCC or in the current cohort. The prognostic marker for patients harboring intratumouralPD-L2low stromalCD3high was related to the best median OS of 72 months, while the worst survival occurred in node 4 with a median OS of 10 months (intratumouralPD-L2high intratumouralCD3low intratumouralCD8low) (). These findings verified our hypothesis that multiple immune marker signature models can differentiate OS in relation to stromal and intratumoural immune signatures in HNSCC to better predict therapeutic outcomes and prognosis, with advantages over single marker models. Of note, compared to patients with intratumouralPD-L2high intratumouralCD3low intratumouralCD8low signature, the prognostic index for patients with intratumouralPD-L2low stromalCD3high signature predicted a longer OS ().
PD-L2 is associated with cytokine IL-6
To study the association between PD-L2 and other factors, scRNA-seq was used to analyze the expression of PD-L2 derived from two patients with HNSCC (, Table S1). Dimensional reduction analysis using the UMAP method revealed a diversity in tumor and nonmalignant cell types (Supp. ). We partitioned cells into preliminary clusters based on their global expression patterns and annotated clusters as cancer cells, myocytes, cancer-associated fibroblasts, normal fibroblasts, endothelial cells and immune cells by specific marker genes (Supp. ). To better analyze the heterogeneity of cancer cells, we further identified subclusters of cancer cell clusters and the cancer cells were further partitioned into six clusters (Supp. ), and we found that cells expressing high expression of PD-L2 was enriched in cluster 2 ().
Figure 6. PD-L2 expression is associated with cytokine IL-6 expression. (a) Workflow shows collection and processing of fresh biopsy samples of primary tongue tumors for scRNA-seq. (b) Uniform manifold approximation and projection (UMAP) plot showing the distribution of expression of PD-L2 in cancer cells. (c) The status characterization of cluster 2. Boxplots showing the gene set variation analysis (GSVA) scores of each cell cluster for “HALLMARK_EPITHELIAL_MESENCHYMAL_TRANSITION”, “HALLMARK_ HYPOXIA” and “HALLMARK_ INFLAMMATORY_ RESPONSE”. P value was obtained by Wilcoxon rank-sum test. (d) IL-6 was overlapped in multiple PD-L2 related signaling pathways. (e) Representative IHC staining of IL-6 expression. Scale bar: 20 μm. (f) Kaplan-Meier curves for OS based on IL-6 expression. (g) Scatter plots for IL-6 and intratumoural PD-L2 and CD8 levels using ANOVA test. (h) Effect of IL-6 on intratumoural mRNA expression levels of PD-L2 in HNSCC cells as analyzed by RT-qPCR. (i) Flow cytometry analyses using PD-L2 mAb were performed to detect cell-surface PD-L2 expression in numerous human HNSCC cell lines
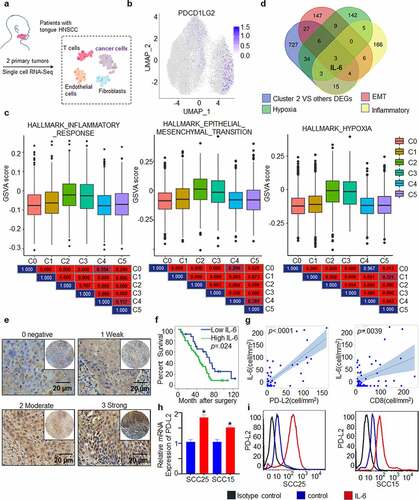
To gain further insight into the role of PD-L2 expression in the clinical setting, we first used the likelihood-ratio test to identify differentially expressed genes (DEGs) in PD-L2-enriched cluster 2, compared to other clusters. We identified 819 upregulated DEGs (Supp. Figure 7a, p ≤ .01, fold change ≥ 1.5, and gene expression ≥ .05). We found that several poor prognosis-related genes were included in the 819 DEGs (Supp. Figure 7b). Based on GSEA analysis, the high PD-L2 expression associated signatures were enriched in “HALLMARK_HYPOXIA”, “HALLMARK_INFLAMMATORY_RESPONSE”, and “HALLMARK_TNFA_SIGNALING_VIA_NFKB” groups, with normalized enrichment scores and p < .002 (Supp. Figure 7 c). To confirm this result, GSVA analysis was performed to estimate and compare the cancer hallmark-associated status of each cluster. Compared to other clusters, cluster 2 showed higher expression of genes belonging to “HALLMARK_EPITHELIAL_MESENCHYMAL_TRANSITION”, “HALLMARK_HYPOXIA” and “HALLMARK_ INFLAMMATORY_ RESPONSE” groups (). In particular, IL-6, which is associated with the Th2 cytokine response, was recognized as an overlapping gene, suggesting that it is associated with high PD-L2 expression (, Supp. Figure 7d, e).
To further verify the potential interaction between PD-L2 and IL-6, we performed IHC of 59 human HNSCC samples. A total of 59.32% (35/59) of the HNSCC specimens were IL-6-positive, including 27.12% of weak staining, 20.34% of moderate staining and 11.86% of strong staining (). Patients with high expression of IL-6 had poorer OS (p = .024; ) and IL-6 levels were positively correlated with PD-L2 levels (p < .0001; ).
As an inflammatory gene, IL-6 is involved in the suppression of activated T cells.Citation36 We further investigated its correlation with FOXP3, CD8 and CD3, and found that IL-6 expression was positively correlated with CD8 cells in tumors (p = .0039; and Supp. Figure 8a, b, Table S2), suggesting that the poor survival of patients with high PD-L2 levels is caused by higher IL-6 secretion. To further validate this hypothesis, we evaluated PD-L2 expression in response to IL-6 stimulation in vitro. Both mRNA and protein levels of PD-L2 were significantly elevated by IL-6 treatment (, i). These results suggest that the TH2-related cytokine IL-6 contributes to abnormal PD-L2 expression in HNSCC.
Discussion
In this study, the clinical significance of PD-L2 status in HNSCC was systematically analyzed for the first time. We highlighted that PD-L2 is a promising immune checkpoint target for immunotherapy and demonstrated its prognostic value in HNSCC. This study uncovered immune heterogeneity in patients with HNSCC. We also provided an immune signature based on PD-L2 to improve the accuracy of postoperative survival prediction in patients with HNSCC, instead of a single immune marker, thereby overcoming the therapeutic obstacle in PD-1-and PD-L1-based therapies.
Our research indicates that PD-L1 is expressed in tumor cells in approximately 25.42% of HNSCC specimens, compared to the previously reported 46–52% in HNSCC.Citation37 One previous study showed that immunomodulatory cell-surface glycoprotein is heavily glycosylated, which leads to inaccurate antibody binding and weak signal intensity.Citation38 Therefore, we removed PD-L1/PD-L2 glycosylation in tissue samples by enzymatic digestion, resulting in a more accurate antibody-based PD-L1/PD-L2 evaluation. Different research groups have shown intratumoural PD-L1 expression having variable relationship with clinicopathological features and prognosis.Citation39–41 Moreover, the objective response rate (ORR) of PD-L1 mAb monotherapy is often less than 20% without significant survival benefits in several human tumors, including HNSCC.Citation10,Citation42
The significance and predictive role of PD-L2 in immunotherapy for HNSCC remains unknown. We found that 62.71% of patients with HNSCC were PD-L2-positive. Consistently, PD-L2 overexpression was dramatically more prevalent than PD-L1 expression in prostate cancer adenoid cystic carcinoma.Citation28,Citation30 The median OS of patients with high levels of PD-L2-expressing tumors was shorter than that of patients with low levels of PD-L2-expressing tumors. Consistent with the IHC staining data, tumor growth in murine tumor models further confirmed that striking tumor shrinkage was found in mice treated with mAb of PD-L2 or PD-1, whereas PD-L1 mAb exhibited limited tumor growth inhibition, suggesting a key role of PD-L2 in immunosuppression or tumorigenesis in HNSCC. Similar results were also reported for RCC and LUSC animal models.Citation19 These findings suggest that the PD-1/PD-L2 signaling axis plays a more significant role in cancer immune evasion than the PD-1/PD-L1 axis in human epithelial cancers, including HNSCC.
Based on the expression of PD-L1, PD-L2 and PD-1 in tumor microenvironment, HNSCC was categorized into four subtypes.Citation29 Our results showed that 61.36% of patients were PD-L2-positive and PD-L1-negative. IFN-γ signaling triggers PD-1 ligand expression via targeting STAT3, c-FOS and STAT1.Citation43,Citation44 IFN-β regulates the PD-L2 status at the transcriptional level through RF1 and STAT3, which can weakly bind to the PD-L1 promoter.Citation43 During Th2 response, PD-L2, rather than PD-L1, is the predominant ligand for PD-1.Citation45 Moreover, PD-L2 transcription is related to IL4/IL13/STAT6 pathways and Th2 cytokines.Citation44 In addition, post-translational modification may inhibit PD-L1 expression in response to IL-6 or EGF stimulation, and PD-L2 may compensate for the immunosuppressive role independent of PD-L1.Citation46,Citation47 Notably, HNSCC develops in the background of chronic inflammation with documented Th2-skewed inflammatory state. Th2 bias has been confirmed by the plasma cytokine profile in samples of patients with HNSCC which displayed increased IL-4/6/10 levels and decreased Th1 cytokine IFN-γ levels compared to age-matched controls.Citation48,Citation49 Patients with advanced HNSCC often have elevated levels of secreted IL-4/6.Citation50 Therefore, PD-L1 expression is influenced by activating L858R or T790M mutations, exon-19 deletions of the EGFR gene, whereas none of these mutations were present in HNSCC, partially explaining the above question.Citation51–53 Moreover, specific PD-L2 expression patterns suggest that PD-L2 serves as an important downstream effector molecule in chronic inflammation-induced tumor cell survival.
In our study, single cell sequencing analysis combined with GSEA and GSVA analysis revealed that IL-6 was one of the overlapping genes in PD-L2-enriched cluster 2 compared to the other clusters. IL-6 exerts inhibitory activity on Th1 and Treg differentiation or function and induction of Th2 differentiation in HNSCC.Citation49,Citation50,Citation54 IL-6 stimulation increases PD-L2 mRNA and protein levels in SCC15 and SCC-25 cells. We further explored its correlation with immune-related genes and found that IL-6 was positively correlated with intratumoural CD8 levels. Patients with high PD-L2 levels displayed a shorter OS due to the immunoregulatory function of IL-6 in human cancers. Blocking IL-6 using a mAb, tocilizumab, as a monotherapy, has been shown to decrease tumor growth of HNSCC in pre-clinical models.Citation55 Tocilizumab has been proven to overcome resistance to erlotinib and induce cell death in HNSCC.Citation56 These studies show that immune checkpoint inhibitors in combination with IL-6 antibody may benefit patients with intratumouralPD-L2high intratumouralCD3low intratumouralCD8low.
Previous studies have found that PD-L2 is closely related to immune-related pathways,Citation30 especially regulation of T cell proliferation function.Citation57,Citation58 In our study, most specimens expressed TILs; however, not all TILs were directly related to prognosis. Stromal PD-L2 levels were also evaluated to explore its possible relationship with TILs in HNSCC. Nevertheless, we excluded stromal PD-L2 levels for further analysis due to a lack of association with OS. STA is a more precise method than a single clinical parameter-based signature. Thus, the STA analysis suggested synergetic evaluation of PD-1, CD3, CD8 and PD-L2 levels, which provides a more effective and accurate molecular subtyping model than using a single molecule-based model for outcome prediction for patients with HNSCC.
In conclusion, we defined a PD-L2-based immune signature that could distinguish between different subtypes of HNSCC with respect to survival outcomes in a cohort of patients with HNSCC. We highlighted that PD-L2 is a promising immune checkpoint target for immunotherapy and demonstrated its prognostic value in HNSCC. Our study also provides a rationale for the use of anti-IL6 therapy in adjuvant settings to improve immunotherapeutic approaches for patients with HNSCC with high PD-L2 levels.
Supplemental Material
Download ()Acknowledgments
We are grateful to Guangzhou Gene Denovo Biotechnology Co., Ltd for assistance with sequencing and/or bioinformatics analysis.
Disclosure statement
No potential conflict of interest was reported by the author(s).
Supplementary material
Supplemental data for this article can be accessed on the publisher’s website
Additional information
Funding
References
- AC C, TA D, BW N. Oral cavity and oropharyngeal squamous cell carcinoma--an update. CA Cancer J Clin. 2015;65(5):401–14. doi:10.3322/caac.21293.
- Bray F, Ferlay J, Soerjomataram I, Siegel RL, Torre LA, Jemal A. Global cancer statistics 2018: GLOBOCAN estimates of incidence and mortality worldwide for 36 cancers in 185 countries. CA Cancer J Clin. 2018;68(6):394–424. doi:10.3322/caac.21492.
- Li Y, Liu K, Ke Y, Zeng Y, Chen M, Li W, Liu W, Hua X, Li Z, Zhong Y, et al. Risk factors analysis of pathologically confirmed cervical lymph nodes metastasis in oral squamous cell carcinoma patients with clinically negative cervical lymph node: results from a cancer center of central China. J Cancer. 2019;10(13):3062–3069. doi:10.7150/jca.30502.
- Ho AS, Kim S, Tighiouart M, Gudino C, Mita A, Scher KS, Laury A, Prasad R, Shiao SL, Van Eyk JE, et al. Metastatic lymph node burden and survival in oral cavity cancer. J Clin Oncol. 2017;35(31):3601–3609. doi:10.1200/JCO.2016.71.1176.
- Leeman JE, Li JG, Pei X, Venigalla P, Zumsteg ZS, Katsoulakis E, Lupovitch E, McBride SM, Tsai CJ, Boyle JO, et al. Patterns of treatment failure and postrecurrence outcomes among patients with locally advanced head and neck squamous cell carcinoma after chemoradiotherapy using modern radiation techniques. JAMA Oncol. 2017;3(11):1487–1494. doi:10.1001/jamaoncol.2017.0973.
- Krishna S, Ulrich P, Wilson E, Parikh F, Narang P, Yang S, Read AK, Kim-Schulze S, Park JG, Posner M, et al. Human papilloma virus specific immunogenicity and dysfunction of cd8(+) t cells in head and neck cancer. Cancer Res. 2018;78(21):6159–6170. doi:10.1158/0008-5472.CAN-18-0163.
- Bhatia S, Oweida A, Lennon S, Darragh LB, Milner D, Phan AV, Mueller AC, Van Court B, Raben D, Serkova NJ, et al. Inhibition of EphB4-Ephrin-B2 signaling reprograms the tumor immune microenvironment in head and neck cancers. Cancer Res. 2019;79(10):2722–2735. doi:10.1158/0008-5472.CAN-18-3257.
- Quan H, Shan Z, Liu Z, Liu S, Yang L, Fang X, Li K, Wang B, Deng Z, Hu Y, et al. The repertoire of tumor-infiltrating lymphocytes within the microenvironment of oral squamous cell carcinoma reveals immune dysfunction. Cancer Immunol Immunother. 2020;69(3):465–476. doi:10.1007/s00262-020-02479-x.
- Ishida Y, Agata Y, Shibahara K, Honjo T. Induced expression of PD-1, a novel member of the immunoglobulin gene superfamily, upon programmed cell death. EMBO J. 1992;11(11):3887–3895. doi:10.1002/j.1460-2075.1992.tb05481.x.
- Siu LL, Even C, Mesia R, Remenar E, Daste A, Delord JP, Krauss J, Saba NF, Nabell L, Ready NE, et al. Safety and efficacy of durvalumab with or without tremelimumab in patients with PD-L1-low/negative recurrent or metastatic HNSCC: the Phase 2 CONDOR randomized clinical trial. JAMA Oncol. 2019;5(2):195–203. doi:10.1001/jamaoncol.2018.4628.
- Powell SF, Gold KA, Gitau MM, Sumey CJ, Lohr MM, McGraw SC, Nowak RK, Jensen AW, Blanchard MJ, Fischer CD, et al. Safety and efficacy of pembrolizumab with chemoradiotherapy in locally advanced head and neck squamous cell carcinoma: a phase IB study. J Clin Oncol. 2020;38(21):2427–2437. doi:10.1200/JCO.19.03156.
- Ribas A, Hamid O, Daud A, Hodi FS, Wolchok JD, Kefford R, Joshua AM, Patnaik A, Hwu WJ, Weber JS, et al. Association of pembrolizumab with tumor response and survival among patients with advanced melanoma. JAMA. 2016;315(15):1600–1609. doi:10.1001/jama.2016.4059.
- Horn L, Mansfield AS, Szczesna A, Havel L, Krzakowski M, Hochmair MJ, Huemer F, Losonczy G, Johnson ML, Nishio M, et al. First-line atezolizumab plus chemotherapy in extensive-stage small-cell lung cancer. N Engl J Med. 2018;379(23):2220–2229. doi:10.1056/NEJMoa1809064.
- Kang YK, Boku N, Satoh T, Ryu MH, Chao Y, Kato K, Chung HC, Chen JS, Muro K, Kang WK, et al. Nivolumab in patients with advanced gastric or gastro-oesophageal junction cancer refractory to, or intolerant of, at least two previous chemotherapy regimens (ONO-4538-12, ATTRACTION-2): a randomised, double-blind, placebo-controlled, phase 3 trial. Lancet. 2017;390(10111):2461–2471. doi:10.1016/S0140-6736(17)31827-5.
- Herbst RS, Baas P, Kim DW, Felip E, Perez-Gracia JL, Han JY, Molina J, Kim JH, Arvis CD, Ahn MJ, et al. Pembrolizumab versus docetaxel for previously treated, PD-L1-positive, advanced non-small-cell lung cancer (KEYNOTE-010): a randomised controlled trial. Lancet. 2016;387(10027):1540–1550. doi:10.1016/S0140-6736(15)01281-7.
- El-Khoueiry AB, Sangro B, Yau T, Crocenzi TS, Kudo M, Hsu C, Kim TY, Choo SP, Trojan J, Welling THR, et al. Nivolumab in patients with advanced hepatocellular carcinoma (CheckMate 040): an open-label, non-comparative, phase 1/2 dose escalation and expansion trial. Lancet. 2017;389(10088):2492–2502. doi:10.1016/S0140-6736(17)31046-2..
- Burtness B, Harrington KJ, Greil R, Soulieres D, Tahara M, de Castro G Jr., Psyrri A, Baste N, Neupane P, Bratland A, et al. Pembrolizumab alone or with chemotherapy versus cetuximab with chemotherapy for recurrent or metastatic squamous cell carcinoma of the head and neck (KEYNOTE-048): a randomised, open-label, phase 3 study. Lancet. 2019;394(10212):1915–1928. doi:10.1016/S0140-6736(19)32591-7.
- Ferris RL, Blumenschein G Jr., Fayette J, Guigay J, Colevas AD, Licitra L, Harrington K, Kasper S, Vokes EE, Even C, et al. Nivolumab for recurrent squamous-cell carcinoma of the head and neck. N Engl J Med. 2016;375(19):1856–1867. doi:10.1056/NEJMoa1602252.
- Tanegashima T, Togashi Y, Azuma K, Kawahara A, Ideguchi K, Sugiyama D, Kinoshita F, Akiba J, Kashiwagi E, Takeuchi A, et al. Immune suppression by PD-L2 against spontaneous and treatment-related antitumor immunity. Clin Cancer Res. 2019;25(15):4808–4819. doi:10.1158/1078-0432.CCR-18-3991.
- Latchman Y, Wood CR, Chernova T, Chaudhary D, Borde M, Chernova I, Iwai Y, Long AJ, Brown JA, Nunes R, et al. PD-L2 is a second ligand for PD-1 and inhibits T cell activation. Nat Immunol. 2001;2(3):261–268. doi:10.1038/85330.
- Yearley JH, Gibson C, Yu N, Moon C, Murphy E, Juco J, Lunceford J, Cheng J, Chow LQM, Seiwert TY, et al. PD-L2 expression in human tumors: relevance to anti-PD-1 therapy in cancer. Clin Cancer Res. 2017;23(12):3158–3167. doi:10.1158/1078-0432.CCR-16-1761.
- Youngnak P, Kozono Y, Kozono H, Iwai H, Otsuki N, Jin H, Omura K, Yagita H, Pardoll DM, Chen L, et al. Differential binding properties of B7-H1 and B7-DC to programmed death-1. Biochem Biophys Res Commun. 2003;307(3):672–677. doi:10.1016/s0006-291x(03)01257-9.
- Sharpe AH, Pauken KE. The diverse functions of the PD1 inhibitory pathway. Nat Rev Immunol. 2018;18(3):153–167. doi:10.1038/nri.2017.108.
- Zhang Y, Xu J, Hua J, Liu J, Liang C, Meng Q, Wei M, Zhang B, Yu X, Shi S, et al. immune marker signature helps to predict survival in resected pancreatic ductal adenocarcinoma. J Immunother Cancer. 2019;7(1):233. doi:10.1186/s40425-019-0703-0.
- Wang H, Yao H, Li C, Liang L, Zhang Y, Shi H, Zhou C, Chen Y, Fang JY, Xu J. PD-L2 expression in colorectal cancer: independent prognostic effect and targetability by deglycosylation. Oncoimmunology. 2017;6(7):e1327494. doi:10.1080/2162402X.2017.1327494.
- Okadome K, Baba Y, Nomoto D, Yagi T, Kalikawe R, Harada K, Hiyoshi Y, Nagai Y, Ishimoto T, Iwatsuki M, et al. Prognostic and clinical impact of PD-L2 and PD-L1 expression in a cohort of 437 oesophageal cancers. Br J Cancer. 2020;122(10):1535–1543. doi:10.1038/s41416-020-0811-0.
- Shin SJ, Jeon YK, Kim PJ, Cho YM, Koh J, Chung DH, Go H. Clinicopathologic analysis of PD-L1 and PD-L2 expression in renal cell carcinoma: association with oncogenic proteins status. Ann Surg Oncol. 2016;23(2):694–702. doi:10.1245/s10434-015-4903-7.
- Sridharan V, Gjini E, Liao X, Chau NG, Haddad RI, Severgnini M, Hammerman P, El-Naggar A, Freeman GJ, Hodi FS, et al. Immune profiling of adenoid cystic carcinoma: PD-L2 expression and associations with tumor-infiltrating lymphocytes. Cancer Immunol Res. 2016;4(8):679–687. doi:10.1158/2326-6066.CIR-16-0031.
- Calles A, Liao X, Sholl LM, Rodig SJ, Freeman GJ, Butaney M, Lydon C, Dahlberg SE, Hodi FS, Oxnard GR, et al. Expression of PD-1 and Its Ligands, PD-L1 and PD-L2, in smokers and never smokers with kras-mutant lung cancer. J Thorac Oncol. 2015;10(12):1726–1735. doi:10.1097/JTO.0000000000000687.
- Zhao SG, Lehrer J, Chang SL, Das R, Erho N, Liu Y, Sjostrom M, Den RB, Freedland SJ, Klein EA, et al. The immune landscape of prostate cancer and nomination of pd-l2 as a potential therapeutic Target. J Natl Cancer Inst. 2019;111(3):301–310. doi:10.1093/jnci/djy141.
- Chow LQM, Haddad R, Gupta S, Mahipal A, Mehra R, Tahara M, Berger R, Eder JP, Burtness B, Lee SH, et al. Antitumor activity of pembrolizumab in biomarker-unselected patients with recurrent and/or metastatic head and neck squamous cell carcinoma: results from the phase Ib KEYNOTE-012 expansion cohort. J Clin Oncol. 2016;34(32):3838–3845. doi:10.1200/JCO.2016.68.1478.
- Lesokhin AM, Ansell SM, Armand P, Scott EC, Halwani A, Gutierrez M, Millenson MM, Cohen AD, Schuster SJ, Lebovic D, et al. Nivolumab in patients with relapsed or refractory hematologic malignancy: preliminary results of a phase Ib study. J Clin Oncol. 2016;34(23):2698–2704. doi:10.1200/JCO.2015.65.9789.
- Huang M, He M, Guo Y, Li H, Shen S, Xie Y, Li X, Xiao H, Fang L, Li D, et al. The influence of immune heterogeneity on the effectiveness of immune checkpoint inhibitors in multifocal hepatocellular carcinomas. Clin Cancer Res. 2020;26(18):4947–4957. doi:10.1158/1078-0432.CCR-19-3840.
- Butler A, Hoffman P, Smibert P, Papalexi E, Satija R. Integrating single-cell transcriptomic data across different conditions, technologies, and species. Nat Biotechnol. 2018;36(5):411–420. doi:10.1038/nbt.4096.
- Satija R, Farrell JA, Gennert D, Schier AF, Regev A. Spatial reconstruction of single-cell gene expression data. Nat Biotechnol. 2015;33(5):495–502. doi:10.1038/nbt.3192.
- Chen YQ, Li PC, Pan N, Gao R, Wen ZF, Zhang TY, Huang F, Wu FY, Ou XL, Zhang JP, et al. Tumor-released autophagosomes induces CD4(+) T cell-mediated immunosuppression via a TLR2-IL-6 cascade. J Immunother Cancer. 2019;7(1):178. doi:10.1186/s40425-019-0646-5.
- Outh-Gauer S, Alt M, Le Tourneau C, Augustin J, Broudin C, Gasne C, Denize T, Mirghani H, Fabre E, Menard M, et al. Immunotherapy in head and neck cancers: a new challenge for immunologists, pathologists and clinicians. Cancer Treat Rev. 2018;65:54–64. doi:10.1016/j.ctrv.2018.02.008.
- Lee HH, Wang YN, Xia W, Chen CH, Rau KM, Ye L, Wei Y, Chou CK, Wang SC, Yan M, et al. Removal of N-linked glycosylation enhances PD-L1 detection and predicts anti-PD-1/PD-L1 therapeutic efficacy. Cancer Cell. 2019;36(2):168–178. e164. doi:10.1016/j.ccell.2019.06.008.
- Zhou QH, Li KW, Chen X, He HX, Peng SM, Peng SR, Wang Q, Li ZA, Tao YR, Cai WL, et al. HHLA2 and PD-L1 co-expression predicts poor prognosis in patients with clear cell renal cell carcinoma. J Immunother Cancer. 2020;8(1):1. doi:10.1136/jitc-2019-000157.
- Choi YY, Kim H, Shin SJ, Kim HY, Lee J, Yang HK, Kim WH, Kim YW, Kook MC, Park YK, et al. Microsatellite instability and programmed cell death-ligand 1 expression in stage II/III gastric cancer: post hoc analysis of the CLASSIC randomized controlled study. Ann Surg. 2019;270(2):309–316. doi:10.1097/SLA.0000000000002803.
- Lin C, Cao W, Ren Z, Tang Y, Zhang C, Yang R, Chen Y, Liu Z, Peng C, Wang L, et al. GDNF secreted by nerves enhances PD-L1 expression via JAK2-STAT1 signaling activation in HNSCC. Oncoimmunology. 2017;6(11):e1353860. doi:10.1080/2162402X.2017.1353860.
- Colevas AD, Bahleda R, Braiteh F, Balmanoukian A, Brana I, Chau NG, Sarkar I, Molinero L, Grossman W, Kabbinavar F, et al. Safety and clinical activity of atezolizumab in head and neck cancer: results from a phase I trial. Ann Oncol. 2018;29(11):2247–2253. doi:10.1093/annonc/mdy411.
- Garcia-Diaz A, Shin DS, Moreno BH, Saco J, Escuin-Ordinas H, Rodriguez GA, Zaretsky JM, Sun L, Hugo W, Wang X, et al. Interferon receptor signaling pathways regulating PD-L1 and PD-L2 Expression. Cell Rep. 2017;19(6):1189–1201. doi:10.1016/j.celrep.2017.04.031.
- Loke P, Allison JP. PD-L1 and PD-L2 are differentially regulated by Th1 and Th2 cells. Proc Natl Acad Sci U S A. 2003;100(9):5336–5341. doi:10.1073/pnas.0931259100.
- Ghiotto M, Gauthier L, Serriari N, Pastor S, Truneh A, Nunes JA, Olive D. PD-L1 and PD-L2 differ in their molecular mechanisms of interaction with PD-1. Int Immunol. 2010;22(8):651–660. doi:10.1093/intimm/dxq049.
- Li CW, Lim SO, Xia W, Lee HH, Chan LC, Kuo CW, Khoo KH, Chang SS, Cha JH, Kim T, et al. Glycosylation and stabilization of programmed death ligand-1 suppresses T-cell activity. Nat Commun. 2016;7(1):12632. doi:10.1038/ncomms12632.
- Chan LC, Li CW, Xia W, Hsu JM, Lee HH, Cha JH, Wang HL, Yang WH, Yen EY, Chang WC, et al. IL-6/JAK1 pathway drives PD-L1 Y112 phosphorylation to promote cancer immune evasion. J Clin Invest. 2019;129(8):3324–3338. doi:10.1172/JCI126022.
- Woods KV, El-Naggar A, Clayman GL, Grimm EA. Variable expression of cytokines in human head and neck squamous cell carcinoma cell lines and consistent expression in surgical specimens. Cancer Res. 1998;58:3132–3141.
- Lathers DM. Increased aberrance of cytokine expression in plasma of patients with more advanced squamous cell carcinoma of the head and neck. Cytokine. 2004;25(5):220–228. doi:10.1016/j.cyto.2003.11.005.
- Lathers DM, Achille NJ, Young MR. Incomplete Th2 skewing of cytokines in plasma of patients with squamous cell carcinoma of the head and neck. Hum Immunol. 2003;64(12):1160–1166. doi:10.1016/j.humimm.2003.08.024.
- Chen N, Fang W, Zhan J, Hong S, Tang Y, Kang S, Zhang Y, He X, Zhou T, Qin T, et al. Upregulation of PD-L1 by EGFR Activation Mediates the immune escape in EGFR-Driven NSCLC: implication for optional immune targeted therapy for NSCLC patients with EGFR mutation. J Thorac Oncol. 2015;10(6):910–923. doi:10.1097/JTO.0000000000000500.
- Akbay EA, Koyama S, Carretero J, Altabef A, Tchaicha JH, Christensen CL, Mikse OR, Cherniack AD, Beauchamp EM, Pugh TJ, et al. Activation of the PD-1 pathway contributes to immune escape in EGFR-driven lung tumors. Cancer Discov. 2013;3(12):1355–1363. doi:10.1158/2159-8290.CD-13-0310.
- Azuma K, Ota K, Kawahara A, Hattori S, Iwama E, Harada T, Matsumoto K, Takayama K, Takamori S, Kage M, et al. Association of PD-L1 overexpression with activating EGFR mutations in surgically resected nonsmall-cell lung cancer. Ann Oncol. 2014;25(10):1935–1940. doi:10.1093/annonc/mdu242.
- Dienz O, Rincon M. The effects of IL-6 on CD4 T cell responses. Clin Immunol. 2009;130(1):27–33. doi:10.1016/j.clim.2008.08.018.
- Karakasheva TA, Lin EW, Tang Q, Qiao E, Waldron TJ, Soni M, Klein-Szanto AJ, Sahu V, Basu D, Ohashi S, et al. IL-6 mediates cross-talk between tumor cells and activated fibroblasts in the tumor microenvironment. Cancer Res. 2018;78(17):4957–4970. doi:10.1158/0008-5472.CAN-17-2268.
- Stanam A, Love-Homan L, Joseph TS, Espinosa-Cotton M, Simons AL. Upregulated interleukin-6 expression contributes to erlotinib resistance in head and neck squamous cell carcinoma. Mol Oncol. 2015;9(7):1371–1383. doi:10.1016/j.molonc.2015.03.008.
- Ohigashi Y, Sho M, Yamada Y, Tsurui Y, Hamada K, Ikeda N, Mizuno T, Yoriki R, Kashizuka H, Yane K, et al. Clinical significance of programmed death-1 ligand-1 and programmed death-1 ligand-2 expression in human esophageal cancer. Clin Cancer Res. 2005;11(8):2947–2953. doi:10.1158/1078-0432.CCR-04-1469.
- Wang ZL, Li GZ, Wang QW, Bao ZS, Wang Z, Zhang CB, Jiang T. PD-L2 expression is correlated with the molecular and clinical features of glioma, and acts as an unfavorable prognostic factor. Oncoimmunology. 2019;8(2):e1541535. doi:10.1080/2162402X.2018.1541535.