
ABSTRACT
Pulmonary sarcomatoid carcinoma (PSC) is an uncommon subtype of lung cancer, and immune checkpoint blockade promises in clinical benefit. However, virtually nothing is known about the expression of common immune checkpoints in PSC. Here, we performed immunohistochemistry (IHC) to detect nine immune-related proteins in 97 PSC patients. Based on the univariable Cox regression, random forests were used to establish risk models for OS and DFS. Moreover, we used the GSEA, CIBERSORT, and ImmuCellAI to analyze the enriched pathways and microenvironment. Univariable analysis revealed that CD4 (P = 0.008), programmed cell death protein 1 (PD-1; P = 0.003), galectin-9 (Gal-9) on tumor cells (TCs; P = 0.021) were independent for DFS, while CD4 (P = 0.020), PD-1 (P = 0.004), Gal-9 (P = 0.033), and HLA on TILs (P = 0.031) were significant for OS. Meanwhile, the expression level of CD8 played a marginable role in DFS (P = 0.061), limited by the number of patients. The combination of Gal-9 on TC with CD4 and PD-1 on TILs demonstrated the most accurate prediction for DFS (AUC: 0.636-0.791, F1-score: 0.635–0.799), and a dramatic improvement to TNM-stage (P < 0.001 for F1-score of 1-y, 3-y, and 5-yDFS). A similar finding was also observed in the predictive ability of CD4 for OS (AUC: 0.602-0.678, F1-score: 0.635–0.679). CD4 was negatively associated with the infiltration of neutrophils (P = 0.015). PDCD1 (coding gene of PD-1) was positively correlated to the number of exhausted T cells (Texs; P = 0.020) and induced regulatory T cells (iTregs; P = 0.021), and LGALS9 (coding gene of Gal-9) was positively related to the level of dendritic cells (DCs; P = 0.021). Further, a higher combinational level of CD4, PDCD1 on TILs, and LAGLS9 on TCs were proved to be infiltrated with more M1-type macrophages (P < 0.05). We confirmed the expression status of nine immune-related proteins and established a TNM-Immune system for OS and DFS in PSC to assist clinical risk-stratification.
Introduction
Pulmonary sarcomatoid carcinoma (PSC) is an uncommon non-small cell lung cancer (NSCLC), with a proportion of 0.1%-0.4% among all lung cancersCitation1 World Health Organization (WHO) classified PSC into pleomorphic, spindle cell, giant cell carcinoma, carcinosarcoma, and pulmonary blastomaCitation.2 The 5-ysurvival rate of PSC is limited to 15–25%Citation3–6, due to the highly heterogeneous and aggressive clinical course.
The adoptation of immune checkpoint blockades, for instance, the inhibitor of programmed death-1 (PD-1)/ programmed death-ligand 1 (PD-L1), has reformed the remedial scenery and clinical outcome of NSCLC patientsCitation7. Our previous work has revealed that a series of immune checkpoints, such as PD-1, PD-L1, PD-L2Citation8, human leukocyte antigen (HLA)Citation9, tumor necrosis factor superfamily member 4 (OX40), tumor necrosis factor ligand superfamily member 4 (OX40L)Citation10, galectin-9 (Gal-9)Citation11, played significant implications on the prognosis of squamous cell carcinoma (LUSC) and adenocarcinoma (LUAD). Previously, PD-L1 was proved to be highly expressed on PSC tissues, which was correlated to the poor prognosis of PSCCitation12-14. However, virtually nothing is known about the expression level of the rest immune checkpoints and their effect on survival in PSC patients.
Moreover, the benefit of regular chemotherapy and radiotherapy to PSC is controversial, resulting in a high rate of recurrence.Citation15,Citation16 In this context, PD-L1 inhibitors have offered the promise of clinical benefit for PSC, with an overall response rate (ORR) of 40%.Citation17,Citation18 Existing evidence indicates that combinational immune checkpoint inhibitors, for instance, the combinational blockades of PD-1 and cytotoxic T-lymphocyte-associated protein 4 (CTLA-4), present a more robust efficacy than single-agent treatmentsCitation.19 Therefore, delineating the expression or co-expression status of other novel immune checkpoints in PSC, besides PD-1/PD-L1, is the foundation of developing combinational immunotherapy, which could further improve the therapeutic efficacy.
Thus, we explored the expression status of nine immune proteins in PSC tissue by immunohistochemistry (IHC) and unearthed the relation of these proteins to survival outcomes. Further, we conducted a risk-stratification system based on these proteins and the tumor, nodes, and metastasis (TNM) stage to assist the decision-making of clinicians. Finally, bioinformatics was performed to analyze these immune-related proteins’ effects on components and functions of PSC microenvironments.
Materials and methods
Patient population and clinical outcome
Ninety-seven PSC patients who received a surgical resection between 2013 and 2017 at Shanghai Pulmonary Hospital were enrolled, with a follow-up deadline of January 2021. All patients were diagnosed with PSC and had never received any treatment before the surgery. The patients who did not meet the diagnosis or lacked complete follow-up information were excluded. We measured overall survival (OS) and disease-free survival (DFS) as clinical outcomes. The OS time was the time length from the surgery to death, while the DFS time was the time length that the patient survives without any signs or symptoms of PSC.
The TNM stage of all patients was in terms of the eighth edition of the TNM classification. Shanghai Pulmonary Hospital Ethics Committee approved this study (approval number: K18-203Y), and all patients signed the written informed consent.
IHC and scoring
We performed the IHC staining on three duplicate slides of each marker in each patient. The expression level of each marker was calculated as the average value of three slides, and all evaluation was performed within the PSC areas by two independent pathologists.
IHC experiments were performed as previously described. The primary antibodies for cluster of differentiation 3 (CD3; 1:100, Dako, #A0452); CD4 (1:80, Dako, #M7310); CD8 (1:100, Dako, #M7103); PD-1 (1:100, Golden bridge zhongshan, Beijing, #ZM-0381), PD-L1 (1: 300, Cell Signaling Technology, #13684S); PD-L2 (1: 200, Cell Signaling Technology, #82723S); Gal-9 (1:150, Novusbio, #NBP2-45619); HLA DP DQ DR (1:100, Abcam, #ab7856); OX40L (1:500, Abcam, #ab203220) were incubated at 4°C overnight, and secondary antibodies (goat-anti-rabbit or mouse IgG) were incubated for 1 hour at room temperature. Further, two independent pathologists reviewed all slides and scored the percentages of each marker on tumor cells (TCs) or tumor-infiltrating lymphocyte (TILs). The distinguishment of TCs and TILs was based on cell morphology by two independent pathologists.
Cutoff values of continuous variables
X-tile is a software to select the best cutoff point of biomarkers for survival analysis without validated normal ranges, based on the minimum P-value or maximum chi-square valueCitation.20 Here, we introduced the X-tile software (Yale University; V.3.6.1) to determine the cutoff points of all continuous variables and multiple categorical variables, which were included in Cox regressions, Kaplan–Meier curves, and random forests. All the cutoff point values are presented in and Table S1.
Table 1. Univariable and multivariable Cox regression for DFS
Random forest for risk-stratification
Random forest is a classic machine learning algorithm used in computational biology,Citation21 which could construct a predictive model with a supervised learning approach and rank the predictive ability of each variable. Thus, the scikit-learn Python implementation of the random forest was applied to establish a risk model for DFS and OS. The number of trees (n_estimators) was set to 50, and the max number of levels in each decision tree (max_depth) was set to 5, while the random generator (random_state) was set to 2021.
It is worth mentioning that the censored data for each measured timepoint were deleted to ensure the reliability of the random forest. Sixty-nine, 80, and 68 patients were remained for 1-y, 3-y, and 5-y OS, while 65, 79, and 73 patients were selected for 1-y, 3-y, and 5-y DFS, respectively. However, the ratio of events to nonevents of OS or DFS is ~2, which could dramatically weaken the performance of machine learning. Hence, the scikit-learn Python implementation of the synthetic minority oversampling technology (SMOTE)Citation22 with default parameters was performed, which could randomly generate new synthetic points from the existing minority samples in imbalanced data. With the introduction of SMOTE, 11,24, and 44 samples were generated for 1-y, 3-y, and 5-y OS, while 21, 31, and 35 records were created for 1-y, 3-y, and 5-y DFS. Moreover, the whole cohort was randomly split into a training group (80% of all records) and a testing group (20% of all records), with 100 bootstrap resampling.
Further, the performance of risk models was assessed by the mean areas under time-dependent receiver-operating characteristic (ROC) curves (AUCs) and the F1-score of 100 testing groups. The code of the whole process for this section is available on Github (https://github.com/phil329/PSC.git).
Public validation from the Gene Expression Omnibus (GEO) database
To explore the molecular mechanisms of different expressions of the combinational immune-related proteins, we applied a sole RNA sequencing result of PSC (GSE110205) from the GEO Database, including 14 PSC samples and 3 normal lung parenchyma samples. Further, “limma” package of R software was applied to screen differentially expressed genes (DEGs).
Gene Set Enrichment Analysis (GSEA)
To analyze the biological pathways enriched in a higher expression of the combination of CD4, PD-1, and Gal-9, we applied the GSEA softwareCitation23 with default parameters. The cutoff points of a single gene, CD4, PDCD1 (encoding gene of PD-1), and LGALS9 (encoding gene of Gal-9) were determined as the median value, and the high level of the combination of CD4, PDCD1, and LGALS9 was defined as two or three high among three genes. Also, the network among the most enriched pathways in patients with a high level of the combination of CD4, PDCD1, and LGALS9 (P < 0.0001, FDR < 0.01) was visualized by Cytoscape software (V.3.4.0; https:// cytoscape.org)Citation.24
The landscape of immune cells infiltration
To elucidate each sample’s immune cell infiltration, we introduced the Immune Cell Abundance Identifier (ImmuCellAI; http://bioinfo.life.hust.edu.cn/web/ImmuCellAI)Citation25 and CIBERSORT (https://cibersort.stanford.edu)Citation26, which were two online tools for clarifying immune infiltration components from RNA sequencings. The difference of immune infiltration landscapes between different levels of a single gene, CD4, PDCD1, and LGALS9, was analyzed by ImmuCellAI, while CIBERSORT revealed the association of the combinational level of CD4, PDCD1, and LGALS9 with immune infiltration.
Statistical analysis
Kaplan–Meier survival curves with log-rank tests were exerted to contrast the survival rate or time. The features whose P value is less than 0.05 in the univariable Cox proportional hazard regression were inputted into the multivariable Cox regression, which was performed by the method of backward LR. The Fisher exact test and analysis of variance (ANOVA) was applied to compare rates between two and multiple groups, respectively. The t-test was exerted to detect the difference of the mean or median values between groups. Two-sided tests were used for all statistical analysis, and the statistical significance was defined with a P < 0.05. R packages of “corrplot” and “volcano” were used to generate matrix correlations and volcano plots, respectively. All analysis was performed by SPSS (V.23.0, SPSS Inc), Graphpad software (V.8.0, GraphPad Prism), and R software (V.4.0.4, R Core Team).
Results
The characteristics of the cohort
We included 97 patients diagnosed with PSC in this study (), whose mean age was 63 y. The vast majority (91.8%; 89/97) of patients were pure PSC, while four patients (4.12%) were mixed with adenocarcinoma (LUAD), three patients (3.09%) were mixed with squamous cell carcinoma (LUSC), and one patient (1.03%) was mixed with large cell neuroendocrine carcinoma (LCNEC). And 84.5% (82/97) of the patients were male, and over 50% of the cohort (53.6%; 52/97) had a history of smoking. The TNM-stage of 33.0% (32/97), 29.9% (29/97), 32.0% (31/97), and 5.15% (5/97) of patients were I, II, III, and IV, respectively.
Moreover, all these patients received a surgical resection between March 2013 and May 2017 in Shanghai Pulmonary Hospital. In this study, 52.6% (51/97) of patients received postoperative adjuvant chemotherapy, one patient (1.03%) received radiotherapy, and three patients (3.09%) received both chemotherapy and radiotherapy.
Expressions of immune-related proteins varied in PSC
CD3, CD4, and CD8 were unique to TILs, while PD-L1, Gal-9, OX40L, and HLA were expressed both on TCs and TILs. Since PD-1 was mostly expressed on TILs,Citation27 we only analyzed the PD-1 expression on TILs in this study. It is worth mentioning that PD-L2+ TILs were only presented in one patient’s PSC tissue, with a proportion of 1% among TILs. The representative IHC images of CD4, PD-1, Gal-9, and HLA were shown in –e) and the rest of the immune-related proteins were shown in Fig. S1.
Figure 1. The expression status of nine detected immune-related proteins and their correlation
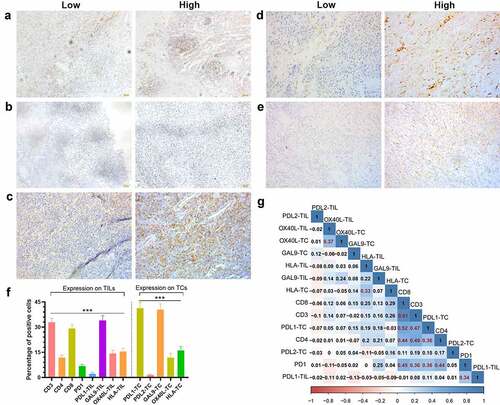
Gal-9 [mean ± standard error of mean (SEM); 342.901%] displayed the highest positive cell proportion of TILs (P < 0.001; ), followed by CD3 (32.91 ± 2.285%), CD8 (29.202.504%), HLA (15.491.951%), OX40L (14.281.931%), CD4 (11.951.276%), and PD-L1 (2.1650.9295%). As for the expression on TCs, PD-L1 (41.35 ± 3.308%) and Gal-9 (34.002.901%) were significantly ahead of HLA (16.04 ± 2.287%), OX40L (11.962.546%), PD-1 (6.7531.001%), and PD-L2 (1.505 ± 0.6226%; P < 0.001; ). Meanwhile, there existed a considerable correlation among CD3, CD4, CD8, PD-1, and PD-L1 (). The expression on TCs and TILs of OX40L and HLA also demonstrated a moderate correlation ().
To explore what caused the difference among the above meaningful proteins, we compared the patients’ clinicopathological features with different statuses of these proteins (Table S2). According to Fisher’s exact test, patients with a high expression of CD4 consisted of more stage I-II disease (55.6% vs. 76.5%, P = 0.0459). Those with a high expression of the combination of Gal-9 on TC with CD4 and PD-1 on TILs consisted of more female (13.0% vs. 25.0%, P = 0.0071), while those with a low combinational expression of CD4, PD-1, Gal-9 on TILs, and HLA on TILs presented a higher frequency of metastasis (11.1% vs. 0%, P = 0.0190). The factors such as advanced age, male, metastasis, and advanced TNM-stage were concentrated in the high-risk populations we screened, which also partially revealed the mechanism why these immune-related proteins were related to OS or DFS.
Immune-related proteins presented dependent prognostic values
According to the univariable analysis, the expression level of CD4 (P=0.020), PD-1 on TILs (P = 0.004), Gal-9 on TILs (P = 0.033), and HLA on TILs (P = 0.031), along with age (P = 0.015), T stage (P = 0.002), M stage (P = 0.024), and TNM-stage (P = 0.011), were independently associated with OS (Table S1). Meanwhile, the expression level of CD4 (P = 0.008), PD-1 on TILs (P = 0.003), Gal-9 on TCs (P = 0.021), along with T stage (P = 0.002) and TNM-stage (P < 0.0001), were significant for DFS (). Moreover, the expression level of CD8 played a marginable significant role in DFS (P = 0.061). When exerting multivariable analysis, T stage (P = 0.005), CD4 (P = 0.028), and PD-1 on TILs (P < 0.0001) were an independent predictive factor for OS (Table S1). As for DFS, we separately included T-stage and TNM-stage into two multivariable regression to avoid interference (). Although all variables included in two multivariable models presented dependent significance for DFS, we chose the multivariable regression including TNM-stage for further analysis. In this model, the expression of CD4 (P = 0.012) and Gal-9 on TC (P = 0.021), PD-1 on TILs (P < 0.0001), and TNM-stage (P = 0.008) were significantly related to DFS ().
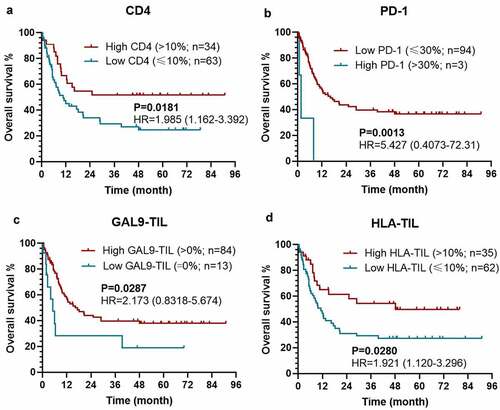
As expected, patients with a higher level of CD4 expression [P = 0.0077; hazard ratio (HR)=1.997 (1.227-3.250)], a lower level of PD-1 expression on TILs [P = 0.0007; HR = 106.4 (7.155–1583)], and a higher Gal-9 expression on TC [P = 0.0206; HR = 1.770 (1.041-3.009)] held a significantly longer DFS (). Meanwhile, the expression level of CD8 could also stratify the DFS with a marginable significance [low vs. high: P =0.0604; HR = 1.882 (1.077–3.287)], which could be attributed to the limited size of patients (). The similar prognostic impacts of CD4 [low vs. high: P = 0.0181; HR = 1.985 (1.162–3.392)], PD-1 on TILs [high vs. low: P = 0.0013; HR = 5.427 (0.4073–72.31)], Gal-9 on TILs [low vs. high: P = 0.0287; HR = 2.173 (0.8318–5.674)], HLA on TILs [low vs. high: P = 0.0280; HR = 1.921 (1.120–3.296)] were found in the survival analysis for OS (). Considering the dramatic prognostic value of CD4, PD-1, Gal-9, and HLA, the further modeling and validation would be primarily based on these four proteins.
Figure 2. Kaplan–Meier survival curves with log-rank tests for DFS between patients with different levels of CD4 (a), PD-1 (b), Gal-9 on TC (c), and CD8 (d)
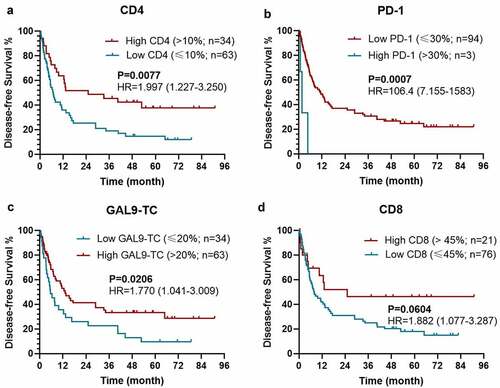
Figure 3. Kaplan–Meier survival curves with log-rank tests for OS between patients with different levels of CD4 (a), PD-1 (b), Gal-9 on TIL (c), HLA on TIL (d)
Combinational immune-related proteins served as a risk model for OS and DFS
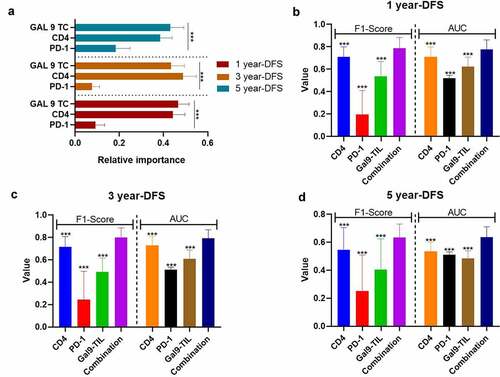
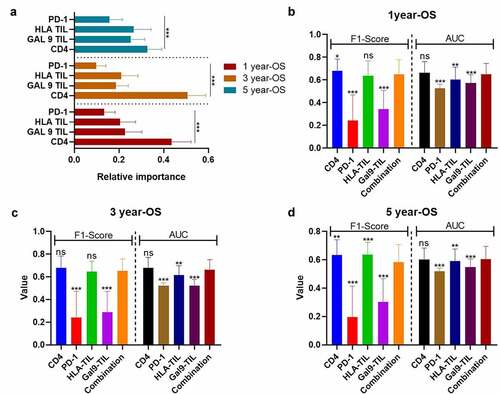
In order to establish a risk model for PSC based on these prognostic combinational immune-related proteins, we applied a random forest on proteins that were independent variables for OS and DFS in the univariable Cox regression. To improve the reliability of this data set, we also performed the preprocessing of SMOTE and bootstrapping (×100). According to the variable importance measures, Gal-9 on TCs was the most critical factor for 1-y DFS and 5-y DFS, while CD4 was slightly more important for 3-y DFS than Gal-9 on TCs (all P < 0.001; ). Moreover, the combination of Gal-9 on TCs with CD4 and PD-1 on TILs presented a significantly stronger predictive ability for DFS than all single parameters (1-y DFS: F1-score = 0.7880.096, AUC = 0.776 ± 0.085; 3-y DFS: F1-score = 0.7990.086, AUC=0.791±0.078; 5-y DFS: F1-score = 0.635 ± 0.096, AUC = 0.636 ± 0.075; , all P < 0.001).
Figure 4. The performance of immune-based risk models for DFS. (a) The rank of relative importance of Gal-9 on TC, CD4, and PD-1 for DFS according to the random forest. The F1-score and AUC of CD4, PD-1, Gal-9, and the combination of the three proteins for 1 y- (b), 3-y (c), and 5-y DFS (d). The heights of the columns represent the average of 100 testing groups, and vertical lines represent the standard error of mean (SEM) of 100 testing groups. ***P < 0.001
However, as for OS, CD4 was a more important predictive biomarker than the rest of protein or combinational proteins (). Additionally, the predictive performance of CD4 (1-y OS: F1-score = 0.679 ± 0.105; AUC = 0.663 ± 0.099; 3-y OS: F1-score = 0.678 ± 0.105, AUC = 0.678 ± 0.093) and the combinational model of CD4, PD-1 on TILs, HLA on TILs, and Gal-9 on TILs (F1-score = 0.650 ± 0.128; AUC=0.651 ± 0.095; 3-y OS: F1-score = 0.653 ± 0.104, AUC=0.664±0.087) did not present any significantly difference (). When it comes to 5-y OS, CD4 (5-y OS: F1-score = 0.635 ± 0.106, AUC = 0.601 ± 0.082) presented a more accurate prediction than the combinational model (5-y OS: F1-score = 0.584 ± 0.124, AUC = 0.605 ± 0.090) and other single variables (). Like the combinational model for DFS, the higher expression level of CD4 tended to predictive a better OS in different TNM-stages, but without a significant difference, due to the limited size of patients’ number (Figs. S2A-S2C).
Figure 5. The performance of immune-based risk models for OS. (a) The rank of relative importance of Gal-9 on TIL, HLA on TIL, CD4, and PD-1 for OS according to the random forest. The F1-score and AUC of CD4, PD-1, Gal-9 on TIL, HLA on TIL, and the combination of the four proteins for 1 y- (b), 3-y (c), and 5-y OS (d). The heights of the columns represent the average of 100 testing groups, and vertical lines represent the standard error of mean (SEM) of 100 testing groups. *P < 0.05; **P < 0.01; ***P < 0.001; ns, not significant
Immune risk models assist TNM-Stage in predicting DFS and OS
As the combination of CD4, PD-1 on TILs, and Gal-9 on TCs demonstrated the best effectiveness for DFS prediction, we applied this combinational immune system to the TNM-stage, which could significantly improve the predictive ability of the TNM-stage (). The F1-score of the TNM-Immune system (TNM-stage + the combination of CD4, PD-1 on TILs, and Gal-9 on TCs) for 1-y (0.840 ± 0.138 vs. 0.681±0.087, P < 0.001), 3-y (0.844 ± 0.069 vs. 0.620±0.128, P < 0.001), and 5-y DFS (0.664 ± 0.069 vs. 0.590±0.107, P < 0.001) were far ahead of the TNM-stage alone (). The AUC values of 1-y (TNM-Immune vs. TNM: 0.847 ± 0.087 vs. 0.756 ± 0.082, P < 0.001), 3-y (TNM-Immune vs. TNM: 0.844 ± 0.065 vs. 0.721 ± 0.073, P <0.001), but 5-y DFS (TNM-Immune vs. TNM: 0.678 ± 0.074 vs. 0.693 ± 0.063, P = 0.1421) also demonstrated a similar comparative result (). These results demonstrated a potential risk model based on the expression level of CD4, PD-1 on TILs, and GAL-9 on TCs, which could assist the TNM-Stage to risk-stratify recurrence and metastasis for PSC patients.
Figure 6. The improvement brought by the immune-based models to the TNM-Stage for the F1-Score (a) and AUC (b) of DFS predictions, and for the F1-Score (c) and AUC (d) of OS predictions. The heights of the columns represent the average of 100 testing groups, and dots represent the standard error (SE) of 100 testing groups. ***P < 0.001; ns, not significant
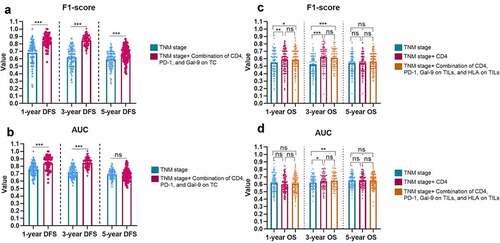
For OS, CD4, and the combination of CD4, PD-1 on TILs, Gal-9 on TILs, and HLA on TILs demonstrated evenly good performance. Thus, we supplemented both CD4 alone and the combination of four proteins to the TNM-stage, respectively. CD4 demonstrated a slightly stronger auxiliary function to the TNM-stage than the 4-protein combination in 1-y (F1-score: CD4 vs. CD4+TNM vs. 4-protein combination + TNM, 0.550 ± 0.162 vs. 0.589 ± 0.141 vs. 0.587 ± 0.140) and 2-y OS (F1-score: CD4 vs. CD4+TNM vs. 4-protein combination + TNM, 0.524 ± 0.127 vs. 0.625 ± 0.130 vs. 0.613 ± 0.119; AUC: CD4 vs. CD4+TNM vs. 4-protein combination + TNM, 0.619 ± 0.086 vs. 0.641 ± 0.097 vs. 0.650 ± 0.087) prediction (). Considering the simplicity of the model, CD4 could be considered a single predominant marker to be supplemented to the regular TNM-stage for OS risk-stratification.
Enriched pathways differed with expression levels of immune-related proteins
Since the combination of CD4, PD-1, and Gal-9 exhibited significant prognostic values on recurrence and survival with the robust predictive ability for DFS, we explored the biological pathway that contributed to the level of these three molecules by GESA analysis. Here we applied the transcriptome gene expression of 14 PSC tissues from GSE110205 to GESA analysis and classified these 14 samples into two groups: low expression level (none or one high of CD4, PDCD1, and LGALS9) and high expression (two or three high of CD4, PDCD1, and LGALS9). Most clinical factors did not correlate to these gene expression (Figs. S3-S5). The expression levels of CD4 and LGALS9 in elder patients were significantly higher than those in younger patients (Figs. S3A and S4A), while the expression level of CD4 was higher in T-stage 1-2 than that in T-stage 3-4 (FigureS3C). A total of 3323 gene sets were upgraded in the high expression group, and 1975 gene sets were upregulated in the low expression group. Four most enriched Gene Ontology (GO) pathways were screen out with the highest normalized enrichment score (NES) among those with an enrichment score (ES)>0.6, a false discovery rate (FDR) <0.25, and a nominal P value <0.05, which were “regulation of alpha-beta T cell activation,” “non-membrane spanning protein tyrosine kinase activity,” “positive regulation of cell adhesion mediated by integrin,” and “T cell migration” (). Ten genes were overlapped among these four pathways (), and two genes (SYK and ZAP70) co-occurred in three pathways.
Figure 7. The enriched pathways and genes in the samples with a high level of CD4, PDCD1, and LAGLS9 by GESA. (a) The top four significant enrichment plots in samples with a high level of CD4, PDCD1, and LGALS9, compared with those in a low expression. (b) The heatmap of the overlap between subsets: the darker the color, the greater the overlap between the subsets. (c) The volcano map of the genes enriched in the group with high expression of CD4, PDCD1, and LGALS9 (ES>0.6 or ES<-0.6). The red dots and blue present the genes significantly downgraded and upgraded in the PSC samples compared with normal tissues, respectively (FDR<0.05, log2|fold change|>1). (d) The mRNA level of five DEGs between PSC and normal tissues. *P < 0.05
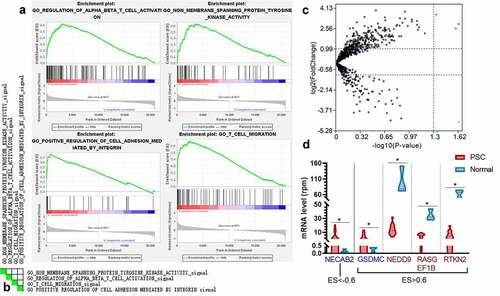
Further, 27 significant pathways were selected with FDR<0.01 and nominal P value <0.0001. The Cytoscape revealed that most of these pathways (22/27) demonstrated a considerable similarity among each other (edge cutoff>0.5; Fig. S6A). Among the 115 genes enriched in the high expression or low expression group (ES>0.6 or ES<−0.6), five genes (NECAB2, GSDMC, NEDD9, RASGEF1B, and RTKN2) were also DEGs between 14 PSC tissues and three normal lung parenchyma tissues (). NECAB2 was the gene that was more enriched in the low expression groups and significantly downregulated in the normal lung parenchyma, which could be a potential therapeutic target. Besides, according to the leading-edge analysis, the number of occurrences peaked at the range of Jaccard values of 0.02-0.04 and 0.06-0.08 (Fig. S6B).
The prognostic immune-related proteins were associated with immune infiltration landscapes
To make a thorough inquiry of the mechanism of how CD4, PD-1, and Gal-9 correlated to the prognosis, we analyzed the difference of immune infiltration status of 14 PSC tissues from GSE110205 via ImmuCellAI. The level of CD4 was negatively related to the infiltration of neutrophils (P = 0.015; Fig. S7A), while PDCD1 was positively correlated with exhausted T cells (Texs; P = 0.02) and induced regulatory T cells (iTregs; P = 0.021; Fig. S7B). Meanwhile, the higher level of LGALS9 boosted the infiltration of dendritic cells (DCs; P = 0.021; Fig. S7C). All these different immune infiltration landscapes can rationalize our conclusions on the prognostic effects of these single immune-related proteins.
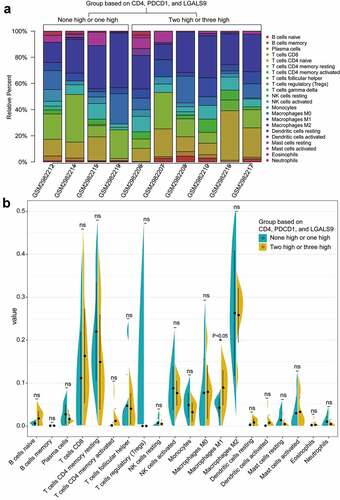
As for the combinational effect of CD4, PD-1, and Gal-9, we analyzed the immune infiltration landscapes of the low expression group and high expression group of CD4, PDCD1, and LGALS9 by CIBERSORT. The PSC samples with a P value <0.05 from GSE110205 and their immune infiltration landscape are shown in . Most of the infiltrated immune cells represented a moderate correlation with each other, especially M0-macrophages and resting NK cells (correlation coefficient = 0.89), eosinophils, and activated dendritic cells (correlation coefficient = 0.90), and follicular T helper cells and CD4+ resting memory T cells (correlation coefficient = −0.81; Figure S8). Among all samples, the high expression group (two or three high of CD4, PDCD1, and LGALS9) tended to be infiltrated with more M1-type macrophages (P <0.05) than the low expression group (none or one high of CD4, PDCD1, and LGALS9) (). In conclusion, recruiting more M1-type macrophages into the PSC microenvironment might be a promising immunotherapeutic direction.
Figure 8. The landscapes of immune infiltration of the two groups with the low and high expression of CD4, PDCD1, LGALS9. (a) The stacked histogram of the proportion of 22 types of cells in ten PSC tissues with a P value<0.05 according to CIBERSORT. (b) The comparison of the percentage of each cell between the two groups in all samples. The black dots in the violins represent the mean of the group, and the vertical lines represent the standard of error (SE). *P < 0.05; ns, not significant
Discussion
In this study, we illustrated the expression status of nine immune-related proteins in PSC and clarify their effect on patients’ prognosis. Among these proteins, CD4, Gal-9 on TCs were independently positive biomarkers for DFS, while CD4, Gal-9 on TILs, and HLA on TILs were significant protective factors for OS. Meanwhile, PD-1 was a significant risk factor for both DFS and OS, and the combination of PD-1, CD4, and Gal-9 on TC even demonstrated a dramatic stratification ability for DFS in the subgroup analysis of stage-II. Further, risk models based on these independent factors were conducted by random forests, where the combination of CD4, PD-1 on TILs, and Gal-9 on TC was the one with the best performance for DFS, and CD4 was the most concise but vital model for OS. Moreover, these two models brought a dramatic improvement to the predictive ability of the TNM-stage for DFS and OS, which indicated the potential of building a TNM-Immune system in PSC. Additionally, the bioinformatics analysis on the RNA sequencing from public data validated the single parameter. The combination of CD4, PD-1, and Gal-9 presented a substantial impact on the PSC microenvironment, which could both explain our results and provide an idea for future immunotherapeutic targets.
Based on the Cox regression and survival analysis, CD4, Gal-9, and HLA were protective proteins for DFS or OS, consistent with our previous findings in LUAD, LUSC,Citation9,Citation11 and small cell lung cancer (SCLC),Citation28 or other pan-cancer studiesCitation29–32 . As a member of β-galactosidase-binding animal lectins, Gal-9 has been reported to involve in enhanced CD8+ T-cell-mediated anti-tumor immunity,Citation33 boosted interferon-gamma (IFN-γ) production,Citation33 and competitively blockade of other immunosuppressive pathways mediated by TIM-3Citation34. HLA-II is an indispensable component for CD4+ T cell activation and has been validated to upgrade immune-mediated tumor rejection in vivoCitation.35 The higher expression of HLA is associated with a higher number of CD4+ and CD8+ TILs, which indicates a hot tumor or a better response to ICIs.Citation35,Citation36 These mechanisms and conclusions are in line with our results and have been confirmed in PSC in this study.
CD3 and HLA are the general markers of total T cells, including CD8+ cytotoxic T lymphocytes (CTLs),Citation37 CD4+ helper T cells,Citation38 NKTs,Citation39 Foxp3+Tregs,Citation40 and exhausted T cellsCitation.39 Considering the diametrically opposed immunomodulatory effect between effector/helper T cells with Tregs, the expression level of CD3 or HLA might not be an ideal marker for immune activity. As for CD8+ T cells, they have been reported to kill tumor cells via secreting cytotoxic molecules, such as granzymes, perforin, and IFN-γCitation.41 In this study, CD8 played a marginable significant role in DFS (P = 0.061), and the Kaplan–Meier plot indicated that the DFS time could be stratified by the level of CD8 (). Thus, the statistical analysis of CD8 in this study did not achieve the threshold of P < 0.05 could be attributed to the limited number of patients.
In this study, we chose the combination of CD4, PD-1 on TILs, and Gal-9 on TCs, to establish a predictive model for DFS, and screened out CD4 as the best risk-stratification parameter for OS. These immune-based prognostic models could further improve the stratification ability of the TNM-stage, which is similar to the TNM-Immune system first proposed in colon cancersCitation.42 TNM-iImmune system, a combination of TNM-stage and the score immune cell infiltration or immune-related proteins based on IHC, has the potential to predict the immunotherapeutic response and has been widely explored in other NSCLCs.Citation43–45 However, no TNM-Immune system has been established in PSC due to the rare resected samples. Thus, this is an originally predictive TNM-Immune system proposed in PSC, which is expected to assist clinicians in treatment decisions with future large-scale validation.
GSEA analysis revealed that the four pathways, “regulation of alpha-beta T cell activation,” “non-membrane spanning protein tyrosine kinase activity,” “positive regulation of cell adhesion mediated by integrin,” and “T cell migration,” were enriched in the patients with a higher level of CD4, PDCD1, and LGALS9, who might present a better prognosis. Alpha–beta T cells are the source of peripheral CD4+ and CD8+ T cells after the selection in the thymus,Citation36 and T cell migration is vital to the interaction between T cells and antigen-presenting cells (APCs),Citation46 which is the core of T cell immune responses. The loss of cell adhesion malignant cells has been known to assist TCs to degrade the extracellular matrix and progress to metastasisCitation.47 Thus, the positive regulation of cell adhesion is not conducive to tumor invasion. Although the alternation of membrane-spanning tyrosine kinase resulting in cancer cell growth and invasion,Citation48 the role of non-membrane spanning protein tyrosine kinase in lung cancer is still controversial and not well reported. JAK/STAT pathways have been reported as an inhabitation on K-RAS-driven LUAD,Citation49 while SCR is one of the primary targets for anticancer tyrosine kinase inhibitors (TKIs) Citation.50 Thus, how non-membrane spanning protein tyrosine kinase activity impacts PSC progression is worthy of future attention and exploration. Moreover, NECAB2 was the gene enriched in the PSC with higher levels of CD4, PDCD1, and LGALS9 and significantly downgraded in normal tissues. NECAB2 is a Ca2+ binding protein predominantly expressed in brain and cancer cells, including lung cancer cellsCitation.51 Although the correlation between NECAB2 with lung cancer is unknown, its homologous protein, NECAB3, could reduce the level of hypoxia-inducible factor-1 (HIF-1), which is a critical pathway for glycolysis in cancer cellsCitation.51 Thus, NECAB2 is expected to be a potential therapeutic target for PSC with future studies of relevant mechanisms.
Further, CD4, PDCD1, LGALS9, and their combination have a critical role in tumor microenvironment components. PDCD1 and LGALS9 were positive related to iTregs/Texs and DCs, respectively, while CD4 was negatively correlated with neutrophils. Meanwhile, a high level of the combination of CD4, PDCD1, and LGALS9 indicated a higher infiltration of M1-type tumor-associated macrophages (TAMs). The negative correlation between CD4 and tumor-associated neutrophils (TANs) has been proved in lung cancer that TANs highly expressed myeloperoxidase (MPO) and factor associated with factor associated with suicide (Fas)/factor associated with suicide ligand (FasL) forming a TANs-mediated inhabitation of CD4+ T cellsCitation.52 Thus, TANs have been deemed as a prognostic index for poor survival in multiple human cancers.Citation53–55 The previous mouse model revealed that Gal-9 increased the number of T cell immunoglobulin and mucin domain-containing protein 3+ (TIM3+) CD86+ mature DCs in vivo and in vitro,Citation56 which could vigorously promote anticancer immunity.Citation57 Furthermore, the PSC with a combinational level of CD4, PD-1, and Gal-9 was infiltrated with more M1-type TAMs, which was more attributed to CD4 and PD-1 than Gal-9. A cognate interaction between CD4+ Th1 cells and TAMs could polarize macrophages to M1 rather than M2Citation58, and increased M1-type TAMs with reduced M2-type TAMs were observed with the blockade of PD-1Citation59. Taken together, our conclusions are in line with previous observations and revealed novel combinational immunotherapeutic targets in PSC, such as blocking the infiltration of M2-TAMs and TANs.
Considering the suppressive effect of tumor-associated innate immune cells on anti-tumor immunity, the blockade of innate immune checkpoints has been proposed. CD47 and CD24 are two innate immune checkpoints in the spotlight. A research team from Stanford revealed that the combination of CD47 on TC and signal-regulatory protein α (SIRPα) on macrophages could dramatically weaken the phagocytic ability of macrophages.Citation60–66 The inhibition of the CD47-SIRPα pathway reduced the tumor growth by enhancing the killing effect of innate immunity and has been applied in multiple cancers preclinically.Citation63–66 Meanwhile, CD24 was another novel checkpoint on TCs, which could specifically combine with sialic-acid-binding Ig-like lectin 10 (Siglec-10) on macrophagesCitation.67 The CD24-Siglec-10 pathway negatively regulates the danger-associated molecular patterns (DAMPs) signaling,Citation68 which is essential for recruiting inflammatory macrophages. Interestingly, the expression of CD24 significantly increased with the inhabitation of CD47Citation67. Thus, the inhibition of CD47 and (or) CD24 should be the focus of future PSC innate immunotherapy research.
This study remained several limitations. First, the number of patients included in this study was relatively small, which might lead to the marginal significance of CD8 in DFS. Although bootstrap resampling and cross validation have been performed to minimize the offset, relevant conclusions need to be verified in future larger studies. Second, the primary research method used of this study was single IHC, which cannot visually demonstrate the co-expression of immune-related proteins. Due to the limited number of samples in this retrospective study, there is no condition for the continued implementation of immunofluorescence. Therefore, future prospective studies were essential to reveal the co-expression of these immune-related proteins. Third, the subtypes of pathology among these PSC patients were missing, due to the retrospective study design. Meanwhile, the analysis on differences of staining between the sarcomatous and non-sarcomatous portions was absent. Further, the scarce incidence of PSC results in little information in public datasets. Thus, we did not realize the validation of the above proteins and risk models on PSC patients’ survival from public datasets.
In conclusion, we explored the expression level of nine immune proteins in PSC tissues and revealed their relationship to OS and DFS. Meanwhile, this study established a risk model for DFS based on the combination of CD4, PD-1 on TILs, and Gal-9 on TCs, and confirmed that CD4 was the most optimized predictive parameter for OS, both of which could further improve the performance of the TNM-stage. The transcriptome analysis of related proteins from public datasets further validated and revealed these risk models.
Data Availability
All data relevant to the study are included in the article or uploaded as supplementary information. The code of the whole process for this section is available on Github (https://github.com/phil329/PSC.git).
Supplemental Material
Download ()Disclosure statement
There were no conflicts and interests.
Supplementary material
Supplemental data for this article can be accessed on the publisher’s website
Additional information
Funding
Notes on contributors
Haoyue Guo
Haoyue Guo, Ph.D, Department of Medical Oncology, Shanghai Pulmonary Hospital, Tongji University Medical School Cancer Institute, Tongji University School of Medicine, No 507 Zhengmin Road, Shanghai 200433, China
Binglei Li
Binglei Li, Bachelor of Engineering, Department of Computer Science and Technology, College of Electronic and Information Engineering, Tongji University
Li Diao
Li Diao, Master of Engineering, Department of Automation, School of Electronic Information and Electrical Engineering, Shanghai Jiao Tong University, No 800 Dongchuan Road, Shanghai, China
Hao Wang
Hao Wan, Ph.D, Department of Medical Oncology, Shanghai Pulmonary Hospital, Tongji University Medical School Cancer Institute, Tongji University School of Medicine, No 507 Zhengmin Road, Shanghai 200433, China
Peixin Chen
Peixin Chen Ph.D, Department of Medical Oncology, Shanghai Pulmonary Hospital, Tongji University Medical School Cancer Institute, Tongji University School of Medicine, No 507 Zhengmin Road, Shanghai, China
Minlin Jiang
Minlin Jiang, Ph.D, Department of Medical Oncology, Shanghai Pulmonary Hospital, Tongji University Medical School Cancer Institute, Tongji University School of Medicine, No 507 Zhengmin Road, Shanghai 200433, China
Lishu Zhao
Lishu Zhao, Ph.D, Department of Medical Oncology, Shanghai Pulmonary Hospital, Tongji University Medical School Cancer Institute, Tongji University School of Medicine, No 507 Zhengmin Road, Shanghai 200433, China
Yayi He
Yayi He, Associated Professor, Ph.D., M.D, Department of Medical Oncology, Shanghai Pulmonary Hospital, Tongji University Medical School Cancer Institute, Tongji University School of Medicine, No 507 Zhengmin Road, Shanghai 200433, China
Caicun Zhou
Caicun Zhou, Professor, Ph.D., M.D, Department of Medical Oncology, Shanghai Pulmonary Hospital, Tongji University Medical School Cancer Institute, Tongji University School of Medicine, No 507 Zhengmin Road, Shanghai 200433, China
References
- Yang Z, Xu J, Li L, Li R, Wang Y, Tian Y, Guo W, Wang Z, Tan F, Ying J, et al.. Integrated molecular characterization reveals potential therapeutic strategies for pulmonary sarcomatoid carcinoma. Nature Communications. 2020;11(1):4878. doi:10.1038/s41467-020-18702-3.
- Travis WD, Brambilla E, Nicholson AG, Yatabe Y, Austin JHM, Beasley MB, Chirieac LR, Dacic S, Duhig E, Flieder DB, et al.. The 2015 world health organization classification of lung tumors: impact of genetic, clinical and radiologic advances since the 2004 classification. Journal of Thoracic Oncology: Official Publication of the International Association for the Study of Lung Cancer. 2015;10(9):1243–16. doi:10.1097/JTO.0000000000000630.
- Huang S-Y, Shen S-J, Li X-Y. Pulmonary sarcomatoid carcinoma: a clinicopathologic study and prognostic analysis of 51 cases. World Journal of Surgical Oncology. 2013;11(1):252. doi:10.1186/1477-7819-11-252.
- Martin LW, Correa AM, Ordonez NG, Roth JA, Swisher SG, Vaporciyan AA, Walsh GL, Rice DC. Sarcomatoid carcinoma of the lung: a predictor of poor prognosis. The Annals of Thoracic Surgery. 2007;84(3):973–980. doi:10.1016/j.athoracsur.2007.03.099.
- Roesel C, Terjung S, Weinreich G, Hager T, Chalvatzoulis E, Metzenmacher M, Welter S. Sarcomatoid carcinoma of the lung: a rare histological subtype of non-small cell lung cancer with a poor prognosis even at earlier tumour stages. Interactive CardioVascular and Thoracic Surgery. 2016;24:407–413.
- Rahouma M, Kamel M, Narula N, Nasar A, Harrison S, Lee B, Stiles B, Altorki NK, Port JL. Pulmonary sarcomatoid carcinoma: an analysis of a rare cancer from the Surveillance, Epidemiology, and End Results database†. European Journal of Cardio-Thoracic Surgery. 2017;53(4):828–834. doi:10.1093/ejcts/ezx417.
- Johnson DB, Rioth MJ, Horn L. Immune checkpoint inhibitors in NSCLC. Current Treatment Options in Oncology. 2014;15:658–669.
- He Y, Rozeboom L, Rivard CJ, Ellison K, Dziadziuszko R, Yu H, Zhou C, Hirsch FR. PD-1, PD-L1 protein expression in non-small cell lung cancer and their relationship with tumor-infiltrating lymphocytes. Medical Science Monitor: International Medical Journal of Experimental and Clinical Research. 2017;23:1208. doi:10.12659/MSM.899909.
- He Y, Rozeboom L, Rivard CJ, Ellison K, Dziadziuszko R, Yu H, Zhou C, Hirsch FR. MHC class II expression in lung cancer. Lung Cancer. 2017;112:75–80. doi:10.1016/j.lungcan.2017.07.030.
- He Y, Zhang X, Jia K, Dziadziuszko R, Zhao S, Deng J, Wang H, Hirsch FR, Zhou C. OX40 and OX40L protein expression of tumor infiltrating lymphocytes in non-small cell lung cancer and its role in clinical outcome and relationships with other immune biomarkers. Translational Lung Cancer Research. 2019;8(4):352. doi:10.21037/tlcr.2019.08.15.
- He Y, Jia K, Dziadziuszko R, Zhao S, Zhang X, Deng J, Wang H, Hirsch FR, Zhou C. Galectin-9 in non-small cell lung cancer. Lung Cancer. 2019;136:80–85. doi:10.1016/j.lungcan.2019.08.014.
- Velcheti V, Rimm DL, Schalper KA. Sarcomatoid lung carcinomas show high levels of programmed death ligand-1 (PD-L1). Journal of Thoracic Oncology. 2013;8(6):803–805. doi:10.1097/JTO.0b013e318292be18.
- Yang Z, Xu J, Li R, Gao Y, He J. PD-L1 and CD47 co-expression in pulmonary sarcomatoid carcinoma: a predictor of poor prognosis and potential targets of future combined immunotherapy. Journal of Cancer Research and Clinical Oncology. 2019;145(12):3055–3065. doi:10.1007/s00432-019-03023-w.
- Schenk E, Boland J, Mansfield A, Aubry MC, Dietz A. Local and systemic immunity predict survival in patients with pulmonary sarcomatoid carcinoma. Medical Oncology. 2017;34(8):1–6. doi:10.1007/s12032-017-1000-8.
- Vieira T, Girard N, Ung M, Monnet I, Cazes A, Bonnette P, Duruisseaux M, Mazieres J, Antoine M, Cadranel J. Efficacy of first-line chemotherapy in patients with advanced lung sarcomatoid carcinoma. Journal of Thoracic Oncology. 2013;8(12):1574–1577. doi:10.1097/01.JTO.0000437008.00554.90.
- Bae H-M, Min HS, Lee S-H, Kim D-W, Chung DH, Lee J-S, Kim YW, Heo DS. Palliative chemotherapy for pulmonary pleomorphic carcinoma. Lung Cancer. 2007;58(1):112–115. doi:10.1016/j.lungcan.2007.05.006.
- Domblides C, Leroy K, Monnet I, Mazières J, Barlesi F, Gounant V, Baldacci S, Mennecier B, Toffart A-C A-VC, Audigier-Valette C. Efficacy of immune checkpoint inhibitors in lung sarcomatoid carcinoma. Journal of Thoracic Oncology. 2020;15(5):860–866. doi:10.1016/j.jtho.2020.01.014.
- Jin C, Yang B. Dramatic response of pulmonary sarcomatoid carcinoma to nivolumab combined with anlotinib: a case report. Case Reports in Oncology. 2020;13(2):601–605. doi:10.1159/000507568.
- Marmarelis ME, Aggarwal C. Combination immunotherapy in non-small cell lung cancer. Current Oncology Reports. 2018;20(7):55. doi:10.1007/s11912-018-0697-7.
- Camp RL, Dolled-Filhart M, Rimm DL. X-tile: a new bio-informatics tool for biomarker assessment and outcome-based cut-point optimization. Clinical Cancer Research: An Official Journal of the American Association for Cancer Research. 2004;10(21):7252–7259. doi:10.1158/1078-0432.CCR-04-0713.
- Qi Y. Random forest for bioinformatics. Ensemble Machine Learning: Springer. 2012;307–323.
- Chawla NV, Bowyer KW, Hall LO, Kegelmeyer WP. SMOTE: synthetic minority over-sampling technique. Journal of Artificial Intelligence Research. 2002;16:321–357. doi:10.1613/jair.953.
- Subramanian A, Tamayo P, Mootha VK, Mukherjee S, Ebert BL, Gillette MA, Paulovich A, Pomeroy SL, Golub TR, Lander ES, et al.. Gene set enrichment analysis: a knowledge-based approach for interpreting genome-wide expression profiles. Proceedings of the National Academy of Sciences. 2005;102(43):15545–15550. doi:10.1073/pnas.0506580102.
- Shannon P. Cytoscape: a software environment for integrated models of biomolecular interaction networks. Genome Research. 2003;13(11):2498–2504. doi:10.1101/gr.1239303.
- Miao Y-R, Zhang Q, Lei Q, Luo M, Xie G-Y, Wang H, Guo A-Y. ImmuCellAI: a unique method for comprehensive T-cell subsets abundance prediction and its application in cancer immunotherapy. Advanced Science. 2020;7(7):1902880. doi:10.1002/advs.201902880.
- Chen B, Khodadoust MS, Liu CL, Newman AM, Alizadeh AA. Profiling tumor infiltrating immune cells with CIBERSORT. Cancer systems biology: Springer. 2018. 243–259.
- Yao H, Wang H, Li C, Fang JY, Xu J. Cancer Cell-Intrinsic PD-1 and implications in combinatorial immunotherapy. Front Immunol. 2018;9:1774. doi:10.3389/fimmu.2018.01774.
- Chen P, Zhang L, Zhang W, Sun C, Wu C, He Y, Zhou C. Galectin-9-based immune risk score model helps to predict relapse in stage I–III small cell lung cancer. Journal for Immunotherapy of Cancer. 2020;8(2):2. doi:10.1136/jitc-2020-001391.
- Wang K, Chen Z, Wu R, Yin J, Fan M, Xu X. Prognostic role of high gal-9 expression in solid tumours: a meta-analysis. Cellular Physiology and Biochemistry. 2018;45(3):993–1002. doi:10.1159/000487294.
- Takeuchi M, Miyoshi H, Asano N, Yoshida N, Yamada K, Yanagida E, Moritsubo M, Nakata M, Umeno T, Suzuki T. Human leukocyte antigen class II expression is a good prognostic factor in adult T-cell leukemia/lymphoma. haematologica. 2019;104(8):1626. doi:10.3324/haematol.2018.205567.
- Dunne MR, Phelan JJ, Michielsen AJ, Maguire AA, Dunne C, Martin P, Noonan S, Tosetto M, Geraghty R, Fennelly D. Characterising the prognostic potential of HLA-DR during colorectal cancer development. Cancer Immunology, Immunotherapy. 2020;69(8):1577–1588. doi:10.1007/s00262-020-02571-2.
- Forero A, Li Y, Chen D, Grizzle WE, Updike KL, Merz ND, Downs-Kelly E, Burwell TC, Vaklavas C, Buchsbaum DJ. Expression of the MHC class II pathway in triple-negative breast cancer tumor cells is associated with a good prognosis and infiltrating lymphocytes. Cancer Immunology Research. 2016;4(5):390–399. doi:10.1158/2326-6066.CIR-15-0243.
- Nagahara K, Arikawa T, Oomizu S, Kontani K, Nobumoto A, Tateno H, Watanabe K, Niki T, Katoh S, Miyake M. Galectin-9 increases Tim-3+ dendritic cells and CD8+ T cells and enhances antitumor immunity via galectin-9-Tim-3 interactions. The Journal of Immunology. 2008;181:7660–7669.
- Huang X, Bai X, Cao Y, Wu J, Huang M, Tang D, Tao S, Zhu T, Liu Y, Yang Y. Lymphoma endothelium preferentially expresses Tim-3 and facilitates the progression of lymphoma by mediating immune evasion. Journal of Experimental Medicine. 2010;207(3):505–520. doi:10.1084/jem.20090397.
- Axelrod ML, Cook RS, Johnson DB, Balko JM. Biological consequences of MHC-II expression by tumor cells in cancer. Clinical Cancer Research. 2019;25(8):2392–2402. doi:10.1158/1078-0432.CCR-18-3200.
- Accolla RS, Ramia E, Tedeschi A, Forlani G. CIITA-driven MHC class II expressing tumor cells as antigen presenting cell performers: toward the construction of an optimal anti-tumor vaccine. Frontiers in Immunology. 2019;10:1806. doi:10.3389/fimmu.2019.01806.
- Saraiva DP, Jacinto A, Borralho P, Braga S. 2018. In cytotoxic T lymphocytes predicts breast cancer patients’ response to neoadjuvant chemotherapy. Frontiers in Immunology. Vol. 9. 2605. Cabral MG. HLA-DR.
- Costantino CM, Spooner E, Ploegh HL, Hafler DA, Albert ML. Class II MHC self-antigen presentation in human B and T lymphocytes. PLOS ONE. 2012;7(1):e29805. doi:10.1371/journal.pone.0029805.
- Shivhare SB, Bulmer JN, Lash GE. Chapter 114 - Immunity at the maternal–fetal interface. In: Mestecky J, Strober W, Russell MW, Kelsall BL, Cheroutre H, Lambrecht BN, editors. Mucosal Immunology (Fourth Edition). Boston: Academic Press; 2015. p. 2231–2250. Massachusetts/U.S.A.
- Baecher-Allan C, Wolf E, Hafler DA. MHC class II expression identifies functionally distinct human regulatory T cells. Journal of Immunology (Baltimore, Md.: 1950). 2006;176(8):4622–4631. doi:10.4049/jimmunol.176.8.4622.
- Tsukumo S-i YK, Yasutomo K. Regulation of CD8+ T cells and antitumor immunity by notch signaling. Frontiers in Immunology. 2018;9:101. doi:10.3389/fimmu.2018.00101.
- Taube JM. Emerging immunologic biomarkers: setting the (TNM-immune) stage. Clinical Cancer Research. 2014;20(8):2023–2025. doi:10.1158/1078-0432.CCR-14-0328.
- Donnem T, Hald SM, Paulsen -E-E, Richardsen E, Al-Saad S, Kilvaer TK, Brustugun OT, Helland A, Lund-Iversen M, Stromal PM. CD8+ T-cell density—a promising supplement to TNM staging in non–small cell lung cancer. Clinical Cancer Research. 2015;21(11):2635–2643. doi:10.1158/1078-0432.CCR-14-1905.
- Catacchio I, Scattone A, Silvestris N, Mangia A. Immune prophets of lung cancer: the prognostic and predictive landscape of cellular and molecular immune markers. Translational Oncology. 2018;11(3):825–835. doi:10.1016/j.tranon.2018.04.006.
- Donnem T, Kilvaer T, Andersen S, Richardsen E, Paulsen E, Hald S, Al-Saad S, Brustugun OT, Helland A, Lund-Iversen M. Strategies for clinical implementation of TNM-Immunoscore in resected nonsmall-cell lung cancer. Annals of Oncology. 2016;27(2):225–232. doi:10.1093/annonc/mdv560.
- Krummel MF, Bartumeus F, Gérard A. T cell migration, search strategies and mechanisms. Nature Reviews Immunology. 2016;16(3):193. doi:10.1038/nri.2015.16.
- Okegawa T, Pong RC, Li Y, Hsieh JT. The role of cell adhesion molecule in cancer progression and its application in cancer therapy. Acta biochimica Polonica. 2004;51(2):445–457. doi:10.18388/abp.2004_3583.
- Sangwan V, Park M. Receptor tyrosine kinases: role in cancer progression. Current Oncology. 2006;13(5):191. doi:10.3390/curroncol13050019.
- Katz SG, Rabinovich PM. T cell reprogramming against cancer. Cell reprogramming for immunotherapy: Springer. 2020. 3–44.
- Broekman F. Tyrosine kinase inhibitors: multi-targeted or single-targeted?. World Journal of Clinical Oncology. 2011;2(2):80. doi:10.5306/wjco.v2.i2.80.
- Nakaoka HJ, Hara T, Yoshino S, Kanamori A, Matsui Y, Shimamura T, Sato H, Murakami Y, Seiki M, Sakamoto T. NECAB3 promotes activation of hypoxia-inducible factor-1 during normoxia and enhances tumourigenicity of cancer cells. Scientific Reports. 2016;6(1):1–13. doi:10.1038/srep22784.
- Yuan M, Zhu H, Xu J, Zheng Y, Cao X, Liu LQ. Tumor-Derived CXCL1 promotes lung cancer growth via recruitment of tumor-associated neutrophils. Journal of Immunology Research. 2016;2016:2016. doi:10.1155/2016/6530410.
- Manfroi B, Moreaux J, Righini C, Ghiringhelli F, Sturm N, Huard B. Tumor-associated neutrophils correlate with poor prognosis in diffuse large B-cell lymphoma patients. Blood Cancer Journal. 2018;8(7):66. doi:10.1038/s41408-018-0099-y.
- Jaillon S, Ponzetta A, Di Mitri D, Santoni A, Bonecchi R, Mantovani A. Neutrophil diversity and plasticity in tumour progression and therapy. Nature Reviews Cancer. 2020;20:485–503.
- Shen M, Hu P, Donskov F, Wang G, Liu Q, Du J. Tumor-associated neutrophils as a new prognostic factor in cancer: a systematic review and meta-analysis. PloS One. 2014;9(6):e98259.
- Nagahara K, Arikawa T, Oomizu S, Kontani K, Nobumoto A, Tateno H, Watanabe K, Niki T, Katoh S, Miyake M, et al.. Galectin-9 Increases Tim-3 + Dendritic Cells and CD8 + T cells and enhances antitumor immunity via galectin-9-Tim-3 interactions. Journal of Immunology (Baltimore, Md.: 1950). 2008;176(8):7660–7669. doi:10.4049/jimmunol.181.11.7660.
- Dudek AM, Martin S, Garg AD, Agostinis P. Immature, semi-mature, and fully mature dendritic cells: toward a DC-cancer cells interface that augments anticancer immunity. Frontiers in Immunology. 2013;4:438. doi:10.3389/fimmu.2013.00438.
- Eisel D, Das K, Dickes E, König R, Osen W, Eichmüller SB. Cognate interaction with CD4+ T cells instructs tumor-associated macrophages to acquire M1-like phenotype. Frontiers in Immunology. 2019;10:219. doi:10.3389/fimmu.2019.00219.
- Dhupkar P, Gordon N, Stewart J, Kleinerman ES. Anti-PD-1 therapy redirects macrophages from an M2 to an M1 phenotype inducing regression of OS lung metastases. Cancer Medicine. 2018;7(6):2654–2664. doi:10.1002/cam4.1518.
- Advani R, Flinn I, Popplewell L, Forero A, Bartlett NL, Ghosh N, Kline J, Roschewski M, LaCasce A, Collins GP. CD47 blockade by Hu5F9-G4 and rituximab in non-Hodgkin’s lymphoma. New England Journal of Medicine. 2018;379(18):1711–1721. doi:10.1056/NEJMoa1807315.
- Edris B, Weiskopf K, Volkmer AK, Volkmer J-P, Willingham SB, Contreras-Trujillo H, Liu J, Majeti R, West RB, Fletcher JA. Antibody therapy targeting the CD47 protein is effective in a model of aggressive metastatic leiomyosarcoma. Proceedings of the National Academy of Sciences. 2012;109(17):6656–6661. doi:10.1073/pnas.1121629109.
- Willingham SB, Volkmer J-P, Gentles AJ, Sahoo D, Dalerba P, Mitra SS, Wang J, Contreras-Trujillo H, Martin R, Cohen JD. The CD47-signal regulatory protein alpha (SIRPa) interaction is a therapeutic target for human solid tumors. Proceedings of the National Academy of Sciences. 2012;109(17):6662–6667. doi:10.1073/pnas.1121623109.
- Kl A, Km S, Ito D, Dc L, LJ M, Weiskopf K, NG R, Am R, Shimizu Y, Mescher MF. Evolutionarily conserved resistance to phagocytosis observed in melanoma cells is insensitive to upregulation of pro-phagocytic signals and to CD47 blockade. Melanoma Research. 2020;181(11):147. doi:10.1097/CMR.0000000000000629.
- Majeti R, Chao MP, Alizadeh AA, Pang WW, Jaiswal S, Gibbs KD Jr, van Rooijen N, Weissman IL. CD47 is an adverse prognostic factor and therapeutic antibody target on human acute myeloid leukemia stem cells. Cell. 2009;138(2):286–299. doi:10.1016/j.cell.2009.05.045.
- Liu X, Pu Y, Cron K, Deng L, Kline J, Frazier WA, Xu H, Peng H, Fu Y-X, Xu MM. CD47 blockade triggers T cell–mediated destruction of immunogenic tumors. Nature Medicine. 2015;21(10):1209–1215. doi:10.1038/nm.3931.
- Tseng D, Volkmer J-P, Willingham SB, Contreras-Trujillo H, Fathman JW, Fernhoff NB, Seita J, Inlay MA, Weiskopf K, Anti-CD47 MM. antibody–mediated phagocytosis of cancer by macrophages primes an effective antitumor T-cell response. Proceedings of the National Academy of Sciences. 2013;110(27):11103–11108. doi:10.1073/pnas.1305569110.
- Barkal AA, Brewer RE, Markovic M, Kowarsky M, Barkal SA, Zaro BW, Krishnan V, Hatakeyama J, Dorigo O, Barkal LJ, et al.. CD24 signalling through macrophage Siglec-10 is a target for cancer immunotherapy. Nature. 2019;572(7769):392–396. doi:10.1038/s41586-019-1456-0.
- Chen GY, Tang J, Zheng P, Liu Y. CD24 and Siglec-10 selectively repress tissue damage-induced immune responses. Science (New York, N.Y.). 2009;110(27):1722–1725. doi:10.1126/science.1168988.