
ABSTRACT
Esophageal adenocarcinoma (EAC) is a disease with dismal treatment outcomes. Response to neoadjuvant chemoradiation (CRT) varies greatly. Although the underlying mechanisms of CRT resistance are not identified, accumulating evidence indicates an important role for local antitumor immunity. To explore the immune microenvironment in relation to response to CRT we performed an in-depth analysis using multiplex immunohistochemistry, flow cytometry and mRNA expression analysis (NanoString) to generate a detailed map of the immunological landscape of pretreatment biopsies as well as peripheral blood mononuclear cells (PBMCs) of EAC patients. Response to CRT was assessed by Mandard’s tumor regression grade (TRG), disease-free- and overall survival. Tumors with a complete pathological response (TRG 1) to neoadjuvant CRT had significantly higher tumor-infiltrating T cell levels compared to all other response groups (TRG 2–5). These T cells were also in closer proximity to tumor cells in complete responders compared to other response groups. Notably, immune profiles of near-complete responders (TRG 2) showed more resemblance to non-responders (TRG 3–5) than to complete responders. A high CD8:CD163 ratio in the tumor was associated with an improved disease-free survival. Gene expression analyses revealed that T cells in non-responders were Th2-skewed, while complete responders were enriched in cytotoxic immune cells. Finally, complete responders were enriched in circulating memory T cells. preexisting immune activation enhances the chance for a complete pathological response to neoadjuvant CRT. This information can potentially be used for future patient selection, but also fuels the development of immunomodulatory strategies to enhance CRT efficacy.
Introduction
In esophageal adenocarcinoma (EAC) and gastroesophageal junction adenocarcinomas, treatment with neoadjuvant chemoradiotherapy (CRT) with paclitaxel, carboplatin and concurrent radiotherapy followed by surgical resection has improved overall survivalCitation1. However, the treatment responses are highly variable, with only 19% of EACs achieving a complete histopathological response after CRT.Citation2 Incomplete response is a strong predictor of disease recurrence and reduced survival following surgical resection.Citation3,Citation4 It is still not apparent which biological factors contribute to the variability in response, but accumulating evidence points toward a role for local anti-tumor immunity.Citation5,Citation6
Over the last decades, it has become recognized that radiotherapy influences the local anti-tumor immune response via several mechanisms,Citation7 including enhanced T cell priming through immunogenic cell death and sensitization of cancer cells to T cell-mediated killing by upregulation of Fas and MHC-I.Citation8,Citation9 The efficacy of radiotherapy, however, is also influenced by the composition of the preexisting tumor microenvironment (TME).Citation10,Citation11 In vivo mouse studies have identified that pre-treatment T cell features contribute to the efficacy of radiotherapy.Citation12,Citation13 For example, in B16-F10 bearing mice irradiation increases antigen presenting capability along with more IFNγ-producing T cells within tumor-draining lymph nodes when compared to nonirradiated mice.Citation14 In another mouse model, preexisting intratumoral T cells survived irradiation up to 20 Gy and showed an improved effector function afterward, being able to control tumor growth without new infiltrating T cells.Citation15 On the other hand, immunosuppressive cell types such as Th2-skewed CD4 + T cells, regulatory T cells, M2 macrophages and myeloid-derived suppressor cells (MDSCs) can induce radiotherapy resistance by hampering CD8+ cytotoxic T cells, which are crucial for an effective radiotherapy-induced antitumor immune response.Citation16
How these findings translate to CRT efficacy in EAC is currently unknown. We have previously demonstrated that EACs are mostly immune cell excluded, although some degree of T cell infiltration was identified.Citation17 As EAC typically develops within a chronically inflamed and immunosuppressive environment characterized by PD-L2 expressing tumor cells, PD-L1 expressing immune cells, Th2-skewing and presence of tumor-promoting M2 macrophages and MDSCs,Citation18,Citation19 they might be resistant to CRT by nature.
In this study, we aimed to decipher the immunological characteristics of EAC in relation to response to CRT, and found that pre-treatment tumor infiltrating activated T cells were associated with a complete pathological response to neoadjuvant CRT. Given recent developments in immune modulating drugs,Citation20 these data may not only be useful for selecting patients who may most benefit from neoadjuvant CRT, but may also guide research and implementation of novel immunomodulatory strategies to improve outcome in localized EAC.
Materials and methods
Patient material
Patient material, as well as data on patient characteristics and disease outcome were collected as part of an IRB-approved clinical trial (METC-VUmc identifier 2013.074). Patients with histologically confirmed, stages 2 and 3 esophagus- or gastroesophageal junction tumors were eligible for inclusion in this study. After obtaining informed consent, snap frozen, formalin-fixed paraffin embedded and fresh primary tumor biopsies were collected from the patients prior to neoadjuvant chemoradiation (paclitaxel, carboplatin and concurrent radiotherapy of 41.4 Gy in 23 fractions) during endoscopy. When possible, a heparin blood sample was obtained for isolation of plasmas and PBMCs. Only patients with adenocarcinoma who had completed the entire treatment regime (including surgery) and had sufficient quality tissue obtained were selected for further analysis. In addition, nine archival pre-treatment FFPE specimen from similar patients (previously collected for genetic profilingCitation21) were included. Histology was assessed by an expert pathologist (NvG) on H&E stains from all biopsies and representative tumor areas were carefully annotated prior to processing for downstream applications.
Response evaluation
Response to neoadjuvant CRT was evaluated by Mandard’s tumor regression grade (TRG) system using the post-treatment resection specimen. The Mandard’s TRG score ranges from 1 (no residual cancer) to 5 (absence of regressive changes).Citation22 A complete pathological response was defined as TRG 1.
Multiplex immunohistochemistry
Multiplex immunofluorescence staining was performed with the OPAL 7-color fluorescence immunohistochemistry (IHC) kit (Akoya Biosciences, USA) on 43 slides from formalin-fixed paraffin embedded tumor biopsies in 2 batches. After deparaffinization and rehydration, endogenous peroxidase was blocked with 0.3% H2O2 (VWR chemicals) in methanol for 20 minutes. Subsequently, an extra fixation step was included for 20 minutes with 10% neutral buffered formalin (Reagecon), followed by 2 minute rinses in Mili-Q water, then in 0.05% Tween 20 in Tris-buffered saline (TBST). The following primary antibodies were used: CK clone AE1/AE3 (Dako), CD8 clone C8/144B (Dako), CD3 polyclonal (Dako), FoxP3 clone 236A/E7 (Abcam), CD163 clone 10D6 (Novocastra) and Ki67 clone SP6 (Abcam). The following steps were repeated for each primary antibody; slides were heated in 0.05% ProClin300/Tris-EDTA buffer at pH 9.0 in an 800 W standard microwave at 100% power until boiling point (260 seconds), followed by 15 minutes at 30% power (240 W). Thereafter, slides were allowed to cool down, washed for 2 minutes in Milli-Q at 30 rounds per minute (rpm) and 2 minutes 1× TBST at 30 rpm and then blocked with Antibody Diluent/Block (Perkin Elmer) for 10 minutes at room temperature (RT). After that, the slides were incubated with primary antibody diluted in Antibody Diluent/Block. Next, the slides were washed 3 × 2 minutes in TBST at RT and 30 rpm and were subsequently incubated with OPAL secondary antibody working solution for 15 minutes at RT. Afterward, slides were washed (same as above) and incubated with Opal fluorochromes (Opal520, Opal650, Opal570, Opal540 Opal620, and Opal690) diluted in amplification buffer for 10 minutes at RT. Slides were then washed as above. Finally, a microwave treatment with AR6 buffer was performed and the slides were rinsed for 2 minutes in Milli-Q, then in TSBT. Spectral DAPI working solution was applied for 5 minutes at RT and the slides were rinsed again in TSBT and Milli-Q, and then mounted under coverslips with ProLong Diamond anti-fade mounting medium (Life Technologies, USA). Slides were stored at 4°C until imaging.
Imaging was done on the Vectra® Polaris™ multispectral scanning microscope (Akoya Biosciences, USA). Whole slide scans were reviewed with Phenochart® (Akoya Biosciences, USA) for selection of multispectral regions. These regions were selected based on H&E stains from the same FFPE sections annotated for representative tumor areas by an expert pathologist (NvG). Three samples were excluded from further analysis because of substandard staining or tissue quality.
Multispectral images were analyzed per case in INFORM® (Akoya Biosciences, USA). First, trainable tissue segmentation based on expression of CK and DAPI was used to identify areas with tumor, stroma and no tissue. Second, adaptive cell segmentation was performed and single positive phenotypes (CD3+, CD8+, FoxP3+, CD163+, Ki67+, CK+ and Other) were identified by two researchers (ME and TvS) and reviewed by two other researchers (RG and MH); discrepancies were compared to a positive control tonsil slide and corrected upon mutual agreement between both reviewers. Third, data was exported for quantitative- and spatial analysis with the phenoptrReports package (Akoya Biosciences, USA) in RStudio version 1.2.5033 (RStudio, Inc., Boston, MA, USA). Cell densities were calculated and reported as cells per squared millimeter and cell-to-cell distances were compared in median micrometers. Of note, in the tumor area 55.7% (15.1–79.0%) of all cells were CK positive tumor cells, in contrast to 0.6% (0.0–2.5%) in the stromal region, confirming adequate tissue segmentation (data not sown). Heatmaps were generated by hierarchical agglomerative clustering using the Ward’s minimum variance method by the Pheatmap package in RStudio version 1.2.5033 (RStudio, Inc., Boston, MA, USA).
Tumor dissociation and flow cytometry
Fresh primary tumor biopsies were collected in DMEM with 10% Fetal Calf Serum (FCS) on ice and immediately processed. After macro-dissociation with a scalpel, biopsy fragments were dissociated to a single-cell suspension on a magnet stirrer for 45 minutes at 37 C in the DMEM with 10% Fetal Calf Serum (FCS), DNAse type I (50 µg/ml final concentration, Roche) and Collagenase type IV (100 U/ml final concentration, Life Technologies). After 45 minutes this procedure was repeated with a fresh medium after which cells were incubated with red blood cell lysis for 5 minutes at 4°C. After the washing step, cells were resuspended in PBS and dead cells stained with trypan blue and counted on a hemocytometer before dividing the cells into FACS tubes for staining.
Peripheral blood mononuclear cells (PBMCs) from heparinized blood were isolated by standard Ficoll-Hypaque density centrifugation, counted and immediately frozen in FBS+10%DMSO. On the day of flow cytometry staining, PBMCs were thawed at 37°C, then incubated in RPMI+10% FCS and DNAse (final concentration 10 µg/ml) for 10 minutes at RT. After a washing step, viable cells counted and 500,000 cells/FACS tube were used. For extracellular staining, the cells were immediately incubated with antibodies for 30 minutes at 4°C. For intracellular staining (T cell panel), cells were first permeabilized using the Foxp3/Transcription Factor Staining Buffer Set (eBioscience). The list of antibodies can be found in Table S10. Data acquisition was performed on a LSRFortessa flow cytometer (BD Biosciences, CA, USA). Downstream analyses were performed using FlowJo™ Software for Windows Version 10.2.
For the PBMC analysis, 8,000 random events were collected from each sample from the manual live single cells gate (DownSampleV3 plugin) and combined together in one fcs file. Next, Phenograph was ran to determine the number of metaclusters to be created using FlowSOM plugin. Finally, tSNE algorithm was ran to visualize differences based on response and/or for each cell population. Graphs were made using GraphPad Prism version 8.2.1 (GraphPad Software, San Diego, CA, USA).
NanoString
RNA was isolated from tumor biopsies using the Qiagen RNeasy FFPE or AllPrep DNA/RNA FFPE kit (Qiagen, Germantown, MD). RNA was analyzed using the nCounter® PanCancer Immune Profiling panel (NanoString Technologies, Seattle, WA), which includes 770 genes that cover markers of different immune cell types and populations, recognized cancer antigens, and markers of key immune responses. The resulting data were analyzed with NanoString’s nSolver software (version 4.0). All samples passed quality control (imaging QC, binding density QC, positive control linearity QC, and limit of detection QC). The nCounter Advanced Analysis 2.0 plugin was used for normalization, generation of gene set scores (cell types and pathways) and differential gene expression analysis. The normalization module utilizes the geNorm algorithmCitation23 for selection of the optimal amount of the most stable reference (housekeeping) genes. Gene sets defining cell types, signatures, and pathways can be found in Table S8 and S9. The total leukocytes (TLs) score is the average of the B, CD45+, cytotoxic, macrophage, and T cell scores. Gene Set Enrichment Analysis was performed on the normalized count data, using the pathway gene sets as defined by NanoString.Citation24
Statistical analysis
Statistical analyses were performed using IBM SPSS Statistics for Windows (Version 25.0. Armonk, NY: IBM Corp.). Baseline characteristics were compared with either an independent samples t test, chi-square test or chi-square test for trend. Median cell densities and percentages were compared with a Mann–Whitney U-test. Associations between cell type and pathway gene expression scores (NanoString) were tested with an independent samples t test or Mann–Whitney U-test where appropriate. For Kaplan–Meier survival analysis, multiplex IHC variables were dichotomized based on median and upper quartile range and subsequently compared with a logrank test. A two-sided p-value ≤ 0.05 was considered statistically significant.
Results
Multiplex IHC identifies more abundant T cell infiltrates in complete responders
To assess the relationship between local tumor immunity and sensitivity to neoadjuvant chemoradiotherapy (CRT), multicolor immunohistochemistry (mIHC) was performed on a series of pretreatment biopsies of 40 EAC patients undergoing neoadjuvant CRT. Baseline characteristics are presented in Table S1. Pathological response to neoadjuvant CRT was evaluated by the Mandard tumor regression grading (TRG) using the post-treatment resection specimen;Citation22 30.8% of all patients had a complete histopathological response after neoadjuvant CRT (TRG 1), while 46.2% showed partial response (TRG 2–3) and 23.1% had limited to no response at all (TRG 4–5). Median disease-free survival (DFS) and overall survival (OS) were 38.5 and 67.2 months, respectively.
An average tissue area of 1.44 mm2 from the pre-treatment biopsies, containing both tumor and stroma, was available for analysis (Supplementary Figure S1a). The cell densities (cells per mm2) of T cell subtypes (CD3, CD8 and FoxP3), myeloid cells (CD163) and tumor cells (pancytokeratin (CK)), as well as their proliferation status (Ki67) and spatial distribution in tumor and stroma compartment (segmentation based on CK expression) were evaluated. Principal component analysis, performed to assess a potential batch effect between stained samples, identified one extremely inflamed outlier, which was excluded from further analyses (Supplementary Figure S1b). This outlier did not have microsatellite instability (MSI) or Epstein Barr virus positivity as potential explanation for its inflammatory state. Interestingly, the corresponding post-treatment resection specimen showed a large immunologically cold tumor with the absence of regressive changes (TRG 5). The discrepant results before and after CRT raise the potential for selective outgrowth of a region of tumor lacking immune infiltration.
Quantitative analysis of immune cell phenotypes identified a large variation in the distribution of both T cells and CD163+ myeloid cells. The median density was 47 cells/mm2 (range 0–831) for CD8+ T cells (CD3+CD8+) and much higher, 509 cells/mm2 (range 117–4573), for CD8− T cells (CD3+CD8− cells, which are mostly, but not necessarily limited to CD4+ T cells). In addition, median density for regulatory T cells (Tregs, CD3+CD8−FoxP3+) was 182 cells/mm2 (range 51–1009) and for CD163+ myeloid cells 285 cells/mm2 (range 34–851) (Supplementary Figure S1c). Of note, median T cell counts were on average 2–3 times higher in the stroma than in the tumor area, indicating an immune-excluded phenotype as described before.Citation17
Since immune cells coordinately influence local immunity, unsupervised clustering analysis of cell densities was done for both tumor and stromal regions, which identified two distinct clusters; cluster A, characterized by a T cell dominant immune infiltrate, and cluster B, characterized by a relative immune cell sparsity in general, except for a higher intratumoral CD163+ density in 4 out of 24 cases (). Interestingly, the complete responders (CR; TRG 1) were overrepresented in cluster A (7/13 in cluster A vs. 5/26 in cluster B, P = .027, Table S2), suggesting a role for T cells in response to CRT. None of the other baseline characteristics, including DFS or OS, differed significantly between patients in the two clusters.
Figure 1. Multicolor IHC shows increased T cell infiltrate and importance of spatial distribution in the tumor of complete responders
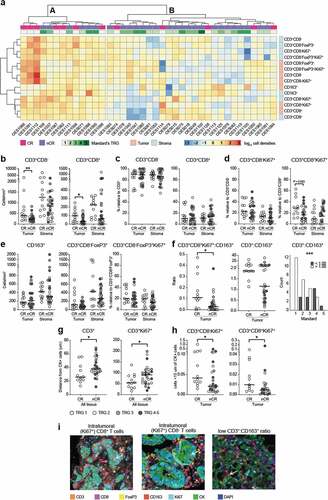
The association between T cells and response to CRT was explored further, showing that patients with a complete histopathological response (TRG 1) had significantly higher intratumoral T cell densities in the pre-treatment biopsies compared to those with a non-complete response (nCR; TRG 2–5) (P = .005 for CD3+, P = .010 for CD3+CD8− and P = .031 for CD3+CD8+; +i and Table S3). Of note, neither the stromal T cell densities () nor the percentage of CD3+CD8− and CD3+CD8+ relative to CD3 differed significantly between response groups (). We therefore questioned whether T cells were more active in complete responders but no differences in activation state was observed by assessing the proliferation marker Ki67, except for a trend toward higher intratumoral levels of proliferating CD8+ T cells in CR compared to nCR (P = .083; and Supplementary table S3).
Focusing on immune suppressive cells, which might hamper response to CRT, we found that the densities of Tregs, proliferating Tregs and CD163+ myeloid cells in the tumor and stromal compartments did not correlate with response ( and Table S3). However, when comparing myeloid cells relative to (proliferating) T cells, increased intratumoral CD3+CD8+(Ki67)+:CD163+ ratios in CR versus nCR were observed (P = .036 for Ki67− and P = .011 for Ki67+ CD8+ T cells; and Table S3). Moreover, the intratumoral ratio of CD3:CD163 exceeded 1.0 in all complete responders and was strongly associated with a favorable Mandard score (P = .001; +iand Table S3), pinpointing that the balance between more pro-inflammatory and suppressive cells might be indicative for achieving a histopathological CR.
Next, the spatial relationship between tumor and immune cells was assessed by comparing the median distances from any CK+ tumor cell to immune cells, as well as cell counts within a 15 µm radius of any CK+ tumor cell, i.e. adjacent ‘touching’ cells; an indicator of increased anti-tumor immunity. In tumors of patients with CR, (proliferating) T cells were found to be in closer proximity of tumor cells compared to T cells of patients with nCR (P = .026 for CD3+ and P = .042 for CD3+Ki67+; and Table S3). The same was observed for the number of proliferating T cells adjacent to CK+ tumor cells (P = .025 for CD8− T cells, and P = .031 for CD8+ T cells; , Supplementary Figure S2b and Table S3). For the Tregs and CD163+ myeloid cells no differences were seen (Supplementary Figure S2a).
As additional measurement of success of CRT,Citation3,Citation4,Citation25 we compared immune scores to disease-free survival (DFS) and overall survival (OS) and identified that a high (upper quartile) CD8+:CD163+ ratio in the tumor was associated with an improved DFS (P = .050; Supplementary Figure S3). Also, high T cell densities showed a trend toward improved DFS (P = .082 for CD8− T cells and P = .054 for CD8+ T cells; Supplementary Figure S3). For Tregs and CD163+ myeloid cell densities no association was found. No correlations with OS were identified.
Phenotypic immune profiling with flow cytometry reveals high interpatient variability independent of response
As multicolor IHC analyses allowed analyses of only a limited number of immune cell types, we decided to perform a more detailed analyses of the tumor immune microenvironment using 13-color flow cytometry performed on fresh pretreatment tumor biopsies of patients with CR (TRG 1, n = 9) and nCR (TRG 2–5, n = 21). Median cell viability was 69.8% (range 22.9–93.9%), resulting in a median of 12602 live single cells per patient (range 1099–133065). Based on the biopsy size, 20/30 samples were profiled by an extended T cell and myeloid panel.
Using this method, high heterogeneity in the composition of the tumor immune microenvironment between patients was observed. By looking at infiltrating immune cell subsets, we found two predominant cell populations in EAC tumors: CD11b+CD14−CD15+ (granulocytic) gMDSCs with an overall median of 25% (range 1.9–70%, dark green bars, ), and T cells with an overall median of 16.8% (range 5–40%, pink bars). In 11/20 patients gMDSCs were the most frequently occurring population, in 8/20 patients T cells were the most frequent population. gMDSC or T cell dominancy did not correlate with pathological response.
Figure 2. Flow cytometry on pre-treatment biopsies did not identify any response-specific immune signatures
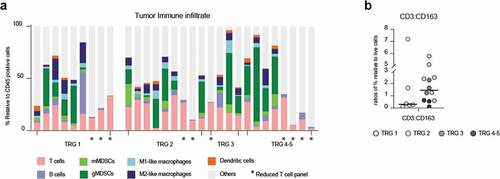
The third most frequent cell type was CD163+ M2 macrophages, with a median of 5.7% (range 1.7–19.8%, dark blue bars). Other cell types identified were mMDSCs, M1 macrophages, Dendritic cells (DCs) and B cells, all with low frequencies. Non-annotated CD45+ cells are likely granulocytes and neutrophils for which no antibodies were added to our panel. None of the immune cell subtypes was specifically enriched in CR or nCR.
Different from the mIHC findings, CR had a lower (but not significant) CD3:CD163 cell ratio compared to nCR (). Same results were found for CD8:CD163 ratios (SupplementaryFigure S4a).
We next analyzed potential enrichment of T cell subtypes in CR or nCR and confirmed the general enrichment of CD4+ T cells in 22 out of 30 patients (CD4:CD8 ratios >1, SupplementaryFigure S4b and Table S4). Furthermore, we identified central/effector memory dominance (high memory:naïve ratios, SupplementaryFigure S4b) as well as proliferation (Ki67 expression) and activation in most CD4 and CD8 T cell subset (SupplementaryFigure S4c). However, none of these T cell subtypes were enriched in one of the response groups. Additionally, (activated)Tregs were identified in 17/20 patients (>10% relative to CD4 + T cells, SupplementaryFigure S4c), with a CD8:Treg ratio <1 in 13/30 patients (SupplementaryFigure S4b) although once again, we found no associations with histopathological response (Table S4).
mRNA expression analysis identified cytotoxic gene expression signatures in complete responders
To further investigate differences in local immunity between patients with a differential response to CRT, NanoString mRNA gene expression analysis was performed on 25 pre-treatment biopsies. Since partial responders (TRG 2 and 3) did not show a distinct immune profile in our multiplex IHC data, the opposite ends of the histopathological response spectrum were compared (TRG 1, complete responders (CR), n = 14 vs. TRG 4–5, non-responders (NR), n = 11, Supplementary Figure S5a). First, analysis of the cellular immune composition relative to total leukocytes (TLs; see Table S5 for definitions) confirmed a significant enrichment of cytotoxic cells (P = .026, t-test) in CR compared to NR ( and Supplementary Figure S5b). Moreover, there was a trend toward higher Th2-polarized CD4+ T cell signature expression relative to total T cells in NR compared to CR (P = .059, t-test) ().
Figure 3. NanoString analysis shows an more cytotoxic cells complete responders than non-responders
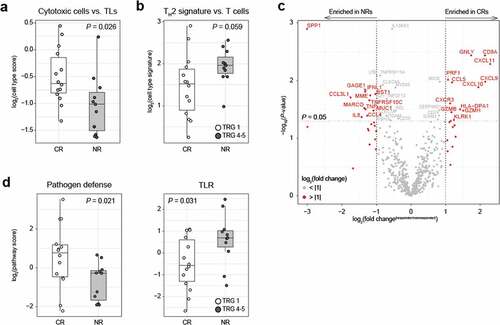
Next, a differential gene expression analysis comparing CR and NR revealed a total of 40 significantly differentially expressed genes ( and Table S6). Although none of the associations remained significant after multiple comparison correction, it is striking that among genes upregulated in CR were several cytotoxicity-associated genes, such as granulysin, CD8A, perforin 1, granzyme H and granzyme B, as well as several interferon-induced cytokines associated with T cell chemotaxis such as CXCL9, CXCL10, and CXCL11, and their common receptor, CXCR3. Irrespective of response, CXCL9, CXCL10, and CXCL11 correlated positively with cytotoxic cells relative to TLs, and correlated negatively with Th2 cells relative to TLs, with Th2 cells relative to T cells and with Tregs relative to TLs (Table S7). This suggests that CXCL9, CXCL10 and CXCL11 do indeed attract cytotoxically active T cells into the tumor. Among the genes upregulated in NR were several myeloid cell attractants such as CCL3L1 and CCL4 (both attract macrophages and DCs through interaction with CCR5) and neutrophil-attractant IL8. Moreover, NRs were enriched with antigens commonly found in myeloid cells, such as CD157 (bone marrow stromal antigen 1 (BST1); stimulator of pre-B-cell growth) and the innate pattern recognition receptor MARCO (macrophage receptor with collagenous structure) found in macrophages. Interestingly, CLEC4A, a suppressive C-type lectin expressed in DCs upon TLR signaling, was also enriched in NRs.
Gene set pathway scoring showed a higher pathogen defense gene set score (P = .021, t-test) in CRs, while NRs had a higher toll-like receptor signaling gene set score (P = .031, t-test, ), thereby confirming the association between activation of an innate immune response and resistance to CRT. Additional gene set enrichment analysis identified a significant enrichment of the interleukin gene set in NR (Supplementary Figure S5c and Table S8-9).
Enrichment for circulating CD8 memory T cells in complete responders
Considering the challenges of studying the tumor immune microenvironment using fresh tumor tissue (e.g. limited material and an invasive procedure), we evaluated whether peripheral blood mononuclear cells (PBMCs) can be used as indicator of local response to CRT. Therefore, PBMCs, collected before the start of CRT, from eight complete responders (CR; TRG 1) and 18 non-complete responders (nCR; TRG 2–5) were assessed with an extensive phenotypical immune analysis using multicolor flow cytometry.
The collected data were combined and subjected to a t-distributed Stochastic Neighbor Embedding (tSNE) analysis to compare CRs versus nCRs. Next, FlowSOM was applied to identify myeloid subsets ( and Supplementary Figure S6c for FlowSOM heatmaps and population frequencies). The most frequent myeloid subsets included monocytes (classical, intermediate-like) and neutrophils. While some populations were clearly differentially expressed between response groups (in black, purple and light green, and Supplementary Figure S6b-c), with manual gating we did not find correlations with histopathological response.
Figure 4. Flow analysis on circulating cells shows enriched CD8+ memory T cells in complete responders
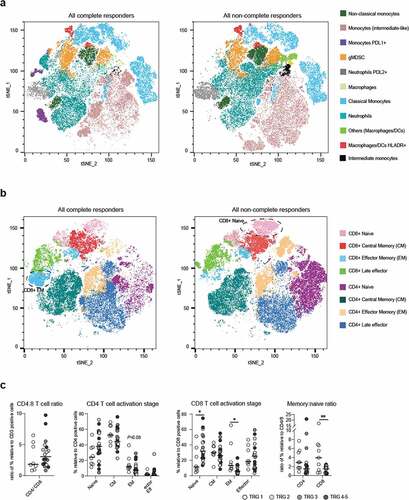
Next, we focused on the T cell component and identified that CRs had visually enriched EM CD8 + T cells in CR, while nCR had enriched naïve CD8 + T cells. With manual gating, both populations resulted significantly enriched in CRs and nCRs, respectively (P = 0,019 for EM and P = 0,016 for naïve; ).
Discussion
Accumulating evidence shows that the chance to respond to immunotherapy and conventional therapy, such as chemo- or radiotherapy, increases when there is preexisting immune cell activation in the tumor microenvironment.Citation10–12,Citation26 T cells have been shown to be pivotal for effective radiotherapy and here we explore if this is also the case for EAC. Previous work in the context of esophageal cancer showed that high levels of tumor infiltrating T cells were associated with a favorable prognosis.Citation27–30 Using several complementary assays to characterize the pre-treatment tumor immune microenvironment of EACs, we found that localized immunity and T cell activation are associated significantly with the efficacy of therapy.
Specifically, the TME of complete responders (TRG 1) to CRT differed from non-complete responders (TRG 2–5) by having significantly higher numbers of tumor-infiltrating T cells (TILs). Recently, Göbel et al. identified low intratumoral FoxP3+:CD8+ ratio, high peritumoural CD163+:CD68+ ratio and high intratumoral TAM densities in EAC to be associated with poor tumor regression upon CRT.Citation30 In line with these findings we report an association between high intratumoral numbers of actively proliferating CD8+ T cells and low numbers of CD163+ M2 macrophages and CR and extended DFS. These results are in accordance with findings by DeNardo et al., who showed that a low CD68:CD8 ratio was associated with CR after neoadjuvant chemotherapy in breast cancer.Citation26 Although in this small series no associations with OS could be established, ‘immunologically hot’ EACs have been reported to have an increased OS compared to ‘cold’ tumors after neoadjuvant chemotherapy.Citation31 Interestingly, in our study activated/proliferating T cells were also in closer proximity to tumor cells in complete responders and higher frequencies of memory T cells were present in peripheral blood as compared to non-complete responders. The location of TILs has been previously shown to positively affect prognosis in EACCitation30 as well as in other tumor types such as colorectal cancer,Citation32 suggesting that their location could be associated with their effector function and clinical impact.
Infiltrating regulatory T cells, higher numbers of which have been associated with advanced disease stage before treatmentCitation33 and worse survival following CRTCitation34 by others, did not show correlation with pathological response in our cohort. These are all findings indicative of an enhanced preexisting activated immune response in complete responders.
The flow cytometry results on pretreatment biopsies highlighted high variability in immune microenvironment between patients but in contrast to mIHC results no association with response to CRT. This discrepancy can potentially be explained by selective cell death of specific immune cell subsets during tumor dissociation and the lack of spatial context of immune cells, which is lost using flow cytometry.
Remarkably, near-complete pathological responders (TRG 2) displayed immune signatures resembling those of patients with a particularly unfavorable response (TRG 3–5) more than those of complete responders (TRG1), despite having a prognosis often comparable to TRG 1. Future studies should further elucidate how local immunity differs between near-complete- (TRG 2) and non-responders (TRG4-5).
For instance, the future possibility of early identification of patients likely to achieve a complete pathological response to CRT raises the question of whether surgery could be omitted in selected patients. Additionally, immune signatures could be used to select patients for immune interventions to modulate the TME before CRT in order to improve response to therapy and therefore outcome. One potential immunomodulatory strategy would be to combine (chemo)radiotherapy with immune checkpoint blockade (ICB) to obtain a synergistic effectCitation35,Citation36 and reinvigorate T cells. Indeed, the benefits of RT and ICB combinations have been reported in several cancer settings;Citation37,Citation38 some with remarkable results. In the PACIFIC trial for example, non-small cell lung cancer patients receiving PD-L1 blockade after CRT had significantly prolonged survival compared to those receiving placebo.Citation39 In the context of EAC, the PERFECT study showed that compared to a propensity matched cohort of the Dutch Cancer Registry, good responders (CR) seemed to have an additional survival benefit from neoadjuvant checkpoint inhibition combined with CRT, while in NRs there was no difference in survival compared to patients receiving CRT only.Citation40
Recently, very promising results of the trial Checkmate-577 (adjuvant PD-1 blockade following resection of EC/Esophageal of the gastric junction cancer (EGJC) in patients with residual pathologic disease) were the first to show a statistically significant and clinically meaningful improvement in disease free survival compared to placebo (and a well-tolerated safety profile) in patients with resected EC/GEJC, who have received neoadjuvant CRT.Citation41 Additionally, the randomized, global phase III study CheckMate 649 showed that first-line GC/GEJC/EAC patients that received PD-1 blocking NIVO + chemo had a statistically significant improvement in OS and PFS vs chemo only (when tumors expressed PD-L1).Citation42 Unlike the squamous subtype,Citation43 results from other clinical trials reported less exciting responses to PD-1 and other ICB therapies in the context of EAC (KEYNOTE-180 trial of PD-1 blockade for heavily pretreated patients with advanced, metastatic esophageal cancer,Citation44 KEYNOTE-061 trial, with PD-1 blockade versus paclitaxel in patients with advanced gastric or GEJC that progressed on first-line chemotherapy with platinum and fluoropyrimidineCitation45 and anti-CTLA-4 versus best supportive care (BSC) among patients with advanced/metastatic gastric or GEJC who achieved at least stable disease with first-line chemotherapyCitation46). These contrasting responses to ICB could be linked to the pre-treatment status of these patients and highlight that it is not readily apparent how to enhance antitumor immune responses in EAC.
In our analysis, we observed consistent expression of PD-1 and CTLA-4 by T cells in the TME; the latter was also reported by others.Citation47,Citation48 The combination of PD-1 and CTLA-4 blockade before CRT could be beneficial for non-complete responders. The same might be true for other immune checkpoint proteins for which the expression was not assessed in the current study; this could be mapped out in the future research.
Gene expression analyses highlighted an enrichment of a Th2 signature in patients with a poor response (TRG 4–5), whereas a more cytotoxic environment correlated with complete response. Th2 skewed cells are generally associated with the infiltration of myeloid-derived suppressor cells (MDSCs) and M2-polarized macrophagesCitation19 that can suppress antitumor immunity. Moreover, tumors from non-responders were enriched in genes linked to immune suppression like CLEC4A (encoding for the suppressive receptor DCIR expressed in DCs upon TLR signaling)Citation49 and IL8, which promotes angiogenesis and inhibits CD8+ T cell functions.Citation50 These findings provide a rationale to test additional therapeutic strategies, such as shifting the balance from Th2 to Th1 (for example through inhibition of Notch signalingCitation51,Citation52), which can in turn affect MDSC and M2 macrophage development, or targeting M2 macrophages (for example, through CXCR2 blockadeCitation53) that could ultimately improve response to CRT.
Together, these findings demonstrate that local immunity, and in particular T cell location, skewing and activation status, is associated with response to neoadjuvant CRT in EAC patients. Future research is needed to complement these findings and investigate prospectively whether the preexisting immune infiltrate can be used as a biomarker for selection of patients that might benefit from CRT, as well as whether neoadjuvant immunomodulatory strategies can be used to improve the outcome for patients with this deadly disease.
Ethics approval and consent to participate
All patient-derived material was obtained after patients signed an informed consent.
Consent for publication
Not applicable.
Availability of data and material
The data presented in this article are available upon request to the corresponding author.
Authors’ contributions
RG conceptualized the project, planned and performed experiments, analyzed results and wrote the manuscript. MH planned and performed experiments, analyzed results and wrote the manuscript. LKK analyzed Nanostring results and wrote the manuscript. TvS, ME, MG, NP, NvG and ESJ contributed to acquisition, analysis and/or interpretation of the data. MvBH, RP and HvL helped with patient recruitment. HV and JvdV contributed to the study of the concept. VT had direct supervision. AB, TdG and SD contributed to study concept and design, supervision and manuscript preparation. All authors contributed to a critical revision of the manuscript.
Supplemental Material
Download ()Acknowledgments
O2 core facility (Elena de Miquel and Marko Popovic) for assisting with mIHC.
Nursing staff from endoscopy (Ria van Huffel and Linda Penninx) and surgery (Nel de Vries, Loes Nooteboom) to help with patient inclusions.
Disclosure Statement
Adam Bass has research support from Merck Sharp & Dohme Corp., a subsidiary of Merck & Co., Inc., Kenilworth, NJ, U.S.A, which has also provided financial support for the study. Tanja D. de Gruijl has a consultant or advisory role in DCprime, Macrophage Pharma, Partner Tx, is a co-founder of LAVA Therapeutics, and receives research funding from Idera Pharmaceuticals. Mark I. van Berge Henegouwen has a consultant role for Medtronic, Johnson and Johnson, Alesi Surgical and Mylan. Unrestricted research funds from Olympus and Stryker. All fees are paid to the institution. Hanneke W.M. van Laarhoven has consultant or advisory role in BMS, Lilly, MSD, Nordic Pharma, Servier and receives research funding/medication: Bayer, BMS, Celgene, Janssen, Lilly, Merck, Nordic Pharma, Philips, Roche, Servier. Johannes J. van der Vliet is CSO at Lava Therapeutics.
Supplementary material
Supplemental data for this article can be accessed on the publisher’s website
Additional information
Funding
References
- Shapiro J, van Lanschot JJB, Hulshof MCCM, Van Hagen P, van Berge Henegouwen MI, Wijnhoven BPL, van Laarhoven HWM, Nieuwenhuijzen GAP, Hospers GAP, Bonenkamp JJ, et al. Neoadjuvant chemoradiotherapy plus surgery versus surgery alone for oesophageal or junctional cancer (CROSS): long-term results of a randomised controlled trial. Lancet Oncol. 2015;16(9):1090–12. doi:10.1016/S1470-2045(15)00040-6.
- Al-Kaabi A, Van Der Post RS, Van Der Werf LR, et al. Impact of pathological tumor response after CROSS neoadjuvant chemoradiotherapy followed by surgery on long-term outcome of esophageal cancer: a population-based study. Acta Oncologica. 2021;60(4):497–504. DOI: 10.1080/0284186X.2020.1870246
- Van Hagen P, Hulshof MCCM, van Lanschot JJB, Steyerberg EW, Henegouwen MIVB, Wijnhoven BPL, Richel DJ, Nieuwenhuijzen GAP, Hospers GAP, Bonenkamp JJ, et al. Preoperative chemoradiotherapy for esophageal or junctional cancer. N Engl J Med. 2012;366(22):2074–2084. doi:10.1056/NEJMoa1112088.
- den Bakker CM, Smit JK, Bruynzeel AME, van Grieken NCT, Daams F, Derks S, Cuesta MA, Plukker JTM, van der Peet DL. Non responders to neoadjuvant chemoradiation for esophageal cancer: why better prediction is necessary. J. Thorac. Dis. 2017;9(S8):S843–S850. doi:10.21037/jtd.2017.06.123.
- Babar L, Kosovec JE, Jahangiri V, Chowdhury N, Zheng P, Omstead AN, Salvitti MS, Smith MA, Goel A, Kelly RJ, et al. Prognostic immune markers for recurrence and survival in locally advanced esophageal adenocarcinoma. Oncotarget. 2019;10(44):4546–4555. doi:10.1200/jco.2019.37.4_suppl.50.
- Kamran SC, Lennerz JK, Margolis CA, Liu D, Reardon B, Wankowicz SA, Van Seventer EE, Tracy A, Wo JY, Carter SL, et al. Integrative molecular characterization of resistance to neoadjuvant chemoradiation in rectal cancer. Clin. Cancer Res. 2019;25(18):5561–5571. doi:10.1158/1078-0432.CCR-19-0908.
- van den Ende T, van den Boorn HG, Hoonhout NM,et al. Priming the tumor immune microenvironment with chemo(radio)therapy: a systematic review across tumor types. Biochim Biophys Acta Rev Cancer. 2020. doi:10.1016/j.bbcan.2020.188386.
- Garnett CT, Palena C, Chakarborty M, et al. Sublethal irradiation of human tumor cells modulates phenotype resulting in enhanced killing by cytotoxic T lymphocytes. Cancer Res. 2004;64(21):7985–7994. doi:10.1158/0008-5472.CAN-04-1525.
- Reits EA, Hodge JW, Herberts CA, Groothuis TA, Chakraborty M, K.Wansley E, Camphausen K, Luiten RM, De Ru AH, Neijssen J, et al. Radiation modulates the peptide repertoire, enhances MHC class I expression, and induces successful antitumor immunotherapy. J. Exp. Med. 2006;203(5):1259–1271. doi:10.1084/jem.20052494.
- Formenti SC, Demaria S. Combining radiotherapy and cancer immunotherapy: a paradigm shift. J Natl Cancer Inst. 2013;105:256–265. doi:10.1093/jnci/djs629.
- Goedegebuure RSA, de Klerk LK, Bass AJ, Derks S, Thijssen VLJL. Combining radiotherapy with anti-angiogenic therapy and immunotherapy; a therapeutic triad for cancer? Front Immunol. 2019;9(3107). doi:10.3389/fimmu.2018.03107.
- Spiotto M, Fu Y-X, Weichselbaum RR. The intersection of radiotherapy and immunotherapy: mechanisms and clinical implications. Sci Immunol. 2016;1. eaag1266 LP–eaag1266. doi:10.1126/sciimmunol.aag1266.
- Demaria S, Formenti SC. Role of T lymphocytes in tumor response to radiotherapy. Front Oncol. 2012:2. doi:10.3389/fonc.2012.00095.
- Lugade AA, Moran JP, Gerber SA, Rose RC, Frelinger JG, Lord EM. Local radiation therapy of B16 melanoma tumors increases the generation of tumor antigen-specific effector cells that traffic to the tumor. J. Immunol. 2005;174(12):7516–7523. doi:10.4049/jimmunol.174.12.7516.
- Arina A, Beckett M, Fernandez C, Zheng W, Pitroda S, Chmura SJ, Luke JJ, Forde M, Hou Y, Burnette B, et al. Tumor-reprogrammed resident T cells resist radiation to control tumors. Nat. Commun. 2019;10(1). doi:10.1038/s41467-019-11906-2.
- Shiao SL, Ruffell B, DeNardo DG, Faddegon BA, Park CC, Coussens LM. TH 2-Polarized CD4+T Cells and Macrophages Limit Efficacy of Radiotherapy. Cancer Immunol. Res. 2015;3(5):518–525. doi:10.1158/2326-6066.CIR-14-0232.
- Derks S, de Klerk LK, Xu X, Fleitas T, Liu KX, Liu Y, Dietlein F, Margolis C, Chiaravalli AM, Da Silva AC, et al. Characterizing diversity in the tumor-immune microenvironment of distinct subclasses of gastroesophageal adenocarcinomas. Ann. Oncol. 2020;31(8):1011–1020. doi:10.1016/j.annonc.2020.04.011.
- Derks S, Nason KS, Liao X, Stachler MD, Liu KX, Liu JB, Sicinska E, Goldberg MS, Freeman GJ, Rodig SJ, et al. Epithelial PD-L2 expression marks Barrett’s Esophagus and Esophageal Adenocarcinoma. Cancer Immunol. Res. 2015;3(10):1123–1130. doi:10.1158/2326-6066.CIR-15-0046.
- Gao J, Wu Y, Su Z, et al. Infiltration of alternatively activated macrophages in cancer tissue is associated with MDSC and Th2 polarization in patients with esophageal cancer. PLoS One. 2014;9.
- Yang H, Wang K, Wang T, et al. The combination options and predictive biomarkers of PD-1/PD-L1 inhibitors in esophageal cancer. Front Oncol. 2020;10(300).
- Klerk LK, Goedegebuure, RSA, van Grieken NCT, et al. Molecular profiles of response to neoadjuvant chemoradiotherapy in oesophageal cancers to develop personalized treatment strategies. Mol Oncol. 2021;1878–0261.12907. doi:10.1002/1878-0261.12907.
- Mandard AM, Dalibard F, Mandard J-C, Marnay J, Henry-Amar M, Petiot J-F, Roussel A, Jacob J-H, Segol P, Samama G, et al. Pathologic assessment of tumor regression after preoperative chemoradiotherapy of esophageal carcinoma. Clinicopathologic correlations. Cancer. 1994;73(11):2680–2686. doi:10.1002/1097-0142(19940601)73:11<2680::AID-CNCR2820731105>3.0.CO;2-C.
- Vandesompele J, De Preter K, Pattyn F, Poppe B, Van Roy N, De Paepe A, Speleman F. Accurate normalization of real-time quantitative RT-PCR data by geometric averaging of multiple internal control genes. Genome Biol. 2002;3(7):research0034.1. doi:10.1186/gb-2002-3-7-research0034.
- Subramanian A, Tamayo P, Mootha VK, Mukherjee S, Ebert BL, Gillette MA, Paulovich A, Pomeroy SL, Golub TR, Lander ES, et al. Gene set enrichment analysis: a knowledge-based approach for interpreting genome-wide expression profiles. Proc. Natl. Acad. Sci. 2005;102(43):15545–15550. doi:10.1073/pnas.0506580102.
- Oppedijk V, van der Gaast A, van Lanschot JJB, Van Hagen P, Van Os R, van Rij CM, van der Sangen MJ, Beukema JC, Rütten H, Spruit PH, et al. Patterns of recurrence after surgery alone versus preoperative chemoradiotherapy and surgery in the CROSS trials. J. Clin. Oncol. 2014;32(5):385–391. doi:10.1200/JCO.2013.51.2186.
- DeNardo DG, Brennan DJ, Rexhepaj E, Ruffell B, Shiao SL, Madden SF, Gallagher WM, Wadhwani N, Keil SD, Junaid SA, et al. Leukocyte complexity predicts breast cancer survival and functionally regulates response to chemotherapy. Cancer Discov. 2011;1(1):54–67. doi:10.1158/2159-8274.CD-10-0028.
- Schumacher K, Haensch W, Röefzaad C, Schlag PM. Prognostic significance of activated CD8+ T cell infiltrations within esophageal carcinomas. Cancer Res. 2001:3932–3936.
- Svensson MC, Warfvinge CF, Fristedt R, Hedner C, Borg D, Eberhard J, Micke P, Nodin B, Leandersson K, Jirström K, et al. The integrative clinical impact of tumor-infiltrating T lymphocytes and NK cells in relation to B lymphocyte and plasma cell density in esophageal and gastric adenocarcinoma. Oncotarget. 2017;8(42):72108–72126. doi:10.18632/oncotarget.19437.
- Stein AV, Dislich B, Blank A, Guldener L, Kröll D, Seiler CA, Langer R. High intratumoural but not peritumoural inflammatory host response is associated with better prognosis in primary resected oesophageal adenocarcinomas. Pathology. 2017;49(1):30–37. doi:10.1016/j.pathol.2016.10.005.
- Göbel HH, Büttner-Herold MJ, Fuhrichc N, et al. Cytotoxic and immunosuppressive inflammatory cells predict regression and prognosis following neoadjuvant radiochemotherapy of oesophageal adenocarcinoma. Radiother Oncol. 2020;146:151–160. doi:10.1016/j.radonc.2020.02.003.
- Humphries MP, Craig SG, Kacprzyk R, Fisher NC, Bingham V, McQuaid S, Murray GI, McManus D, Turkington RC, James J, et al. The adaptive immune and immune checkpoint landscape of neoadjuvant treated esophageal adenocarcinoma using digital pathology quantitation. BMC Cancer. 2020;20(1). doi:10.1186/s12885-020-06987-y.
- Naito Y, Saito K, Shiiba K, et al. CD8+ T cells infiltrated within cancer cell nests as a prognostic factor in human colorectal cancer. Cancer Res. 1998;3491–3494.
- Ichihara F, Kono K. , Takahashi A, et al. Increased populations of regulatory T cells in peripheral blood and tumor-infiltrating lymphocytes in patients with gastric and esophageal cancers. Clin Cancer Res. 2003;4404–4408.
- Vacchelli E, Semeraro M, Adam J, Dartigues P, Zitvogel L, Kroemer G. Immunosurveillance in esophageal carcinoma: the decisive impact of regulatory T cells. Oncoimmunology. 2016;5(2):e1064581. doi:10.1080/2162402X.2015.1064581.
- Heinhuis KM, Ros W, Kok M, Steeghs N, Beijnen JH, Schellens JHM. Enhancing antitumor response by combining immune checkpoint inhibitors with chemotherapy in solid tumors. Annals of Oncology. 2019;30(2):219–235. doi:10.1093/annonc/mdy551.
- Kang J, Demaria S, Formenti S. Current clinical trials testing the combination of immunotherapy with radiotherapy. J Immunother Cancer. 2016;4(1). doi:10.1186/s40425-016-0156-7.
- Wang Y, Deng, W, Li, N, et al. Combining immunotherapy and radiotherapy for cancer treatment: current challenges and future directions. Front Pharmacol. 2018. doi:10.3389/fphar.2018.00185.
- Dovedi SJ, Cheadle, EJ, Popple, AL, et al. Fractionated radiation therapy stimulates antitumor immunity mediated by both resident and infiltrating polyclonal T-cell populations when combined with PD-1 blockade. Clin. Cancer Res. 2017;23(18):5514–5526. doi:10.1158/1078-0432.CCR-16-1673.
- Gray JE, Villegas, A, Daniel, D, et al. Three-year overall survival with durvalumab after chemoradiotherapy in stage III NSCLC—Update from PACIFIC. J. Thorac. Oncol. 2020;15(2):288–293. doi:10.1016/j.jtho.2019.10.002.
- van den Ende T, de Clercq NC, van Berge Henegouwen MI, Gisbertz SS, Geijsen ED, Verhoeven RHA, Meijer SL, Schokker S, Dings MPG, Bergman JJGHM, et al. Neoadjuvant Chemoradiotherapy Combined with Atezolizumab for Resectable Esophageal Adenocarcinoma: a Single Arm Phase II Feasibility Trial (PERFECT). Clin. Cancer Res. 2021;27(12):3351–3359. clincanres.4443.2020. doi:10.1158/1078-0432.ccr-20-4443.
- Kelly RJ, Ajani JA, Kuzdzal J, Zander T, Van Cutsem E, Piessen G, Mendez G, Feliciano J, Motoyama S, Lièvre A, et al. Adjuvant nivolumab in resected esophageal or gastroesophageal junction cancer. N. Engl. J. Med. 2021;384(13):1191–1203. doi:10.1056/NEJMoa2032125.
- Moehler M, Shitara, K, Garrido, M, et al. LBA6_PR Nivolumab (nivo) plus chemotherapy (chemo) versus chemo as first-line (1L) treatment for advanced gastric cancer/gastroesophageal junction cancer (GC/GEJC)/esophageal adenocarcinoma (EAC): First results of the CheckMate 649 study. 2020. 10.1016/j.annonc.2020.08.2296.
- Yamamoto S, Kato K. Immuno-oncology for esophageal cancer. Futur. Oncology fon-2020-0545. 2020;16(32):2673–2681. doi:10.2217/fon-2020-0545.
- Shah MA, Kojima T, Hochhauser D, Enzinger P, Raimbourg J, Hollebecque A, Lordick F, Kim S-B, Tajika M, Kim HT, et al. Efficacy and safety of pembrolizumab for heavily pretreated patients with advanced, metastatic adenocarcinoma or squamous cell carcinoma of the esophagus: the phase 2 KEYNOTE-180 study. JAMA Oncol. 2019;5(4):546. doi:10.1001/jamaoncol.2018.5441.
- Shitara K, Özgüroğlu, M, Bang, YJ, et al. Pembrolizumab versus paclitaxel for previously treated, advanced gastric or gastro-oesophageal junction cancer (KEYNOTE-061): a randomised, open-label, controlled, phase 3 trial. Lancet. 2018;31257. doi:10.1016/S0140-6736(18.
- Bang YJ, Cho, JY, Kim YH, et al. Efficacy of sequential ipilimumab monotherapy versus best supportive care for unresectable locally advanced/metastatic gastric or gastroesophageal junction cancer. Clin. Cancer Res. 2017;23(19):5671–5678. doi:10.1158/1078-0432.CCR-17-0025.
- Kelly RJ, Zaidi AH, Smith MA, Omstead AN, Kosovec JE, Matsui D, Martin SA, DiCarlo C, Werts ED, Silverman JF, et al. The dynamic and transient immune microenvironment in locally advanced esophageal adenocarcinoma post chemoradiation. Ann. Surg. 2018;268(6):992–999. doi:10.1097/SLA.0000000000002410.
- Jinhua X, Wang, JI, Cheng, S, et al. Expression of immune checkpoints in T cells of esophageal cancer patients. Oncotarget. 2016. doi:10.18632/oncotarget.11611.
- Uto T, Fukaya, T, Takagi H, et al. Clec4A4 is a regulatory receptor for dendritic cells that impairs inflammation and T-cell immunity. Nat Commun. 2016. doi:10.1038/ncomms11273.
- Lin C, He H, Liu H, Li R, Chen Y, Qi Y, Jiang Q, Chen L, Zhang P, Zhang H, et al. Tumour-associated macrophages-derived CXCL8 determines immune evasion through autonomous PD-L1 expression in gastric cancer. Gut. 2019;68(10):1764–1773. doi:10.1136/gutjnl-2018-316324.
- Li Q, Zhang, H, Yu, L, et al. Down-regulation of Notch signaling pathway reverses the Th1/Th2 imbalance in tuberculosis patients. Int Immunopharmacol. 2018. doi:10.1016/j.intimp.2017.10.026.
- Hu C, Li, Z, Feng, J, et al. Glucocorticoids modulate Th1 and Th2 responses in asthmatic mouse models by inhibition of Notch1 signaling. Int. Arch. Allergy Immunol. 2018;175(1–2):44–52. doi:10.1159/000485890.
- Di Mitri D, Mirenda M, Vasilevska J, Calcinotto A, Delaleu N, Revandkar A, Gil V, Boysen G, Losa M, Mosole S, et al. Re-education of tumor-associated macrophages by CXCR2 blockade drives senescence and tumor inhibition in advanced prostate cancer. Cell Rep. 2019;28(8):2156–2168.e5. doi:10.1016/j.celrep.2019.07.068.