
 ?Mathematical formulae have been encoded as MathML and are displayed in this HTML version using MathJax in order to improve their display. Uncheck the box to turn MathJax off. This feature requires Javascript. Click on a formula to zoom.
ABSTRACT
The past decade has witnessed the gradual and steady progress of adoptive T cell therapy in treating various types of cancer. In combination with gemcitabine and carboplatin chemotherapy, we previously conducted a clinical trial, NCT00690872, to treat Epstein-Barr virus (EBV)-positive nasopharyngeal carcinoma (NPC) patients with autologous EBV-expanded cytotoxic T lymphocytes (CTLs). While achieving a 2-year overall survival rate of 62.9%, this trial failed to induce an anti-tumor response in a sizable fraction of patients. Thus, the identification of benchmarks capable of evaluating CTL products and predicting clinical immunotherapeutic efficacy remains an urgent need. We conducted T cell receptor (TCR) repertoire sequencing to assess EBV-expanded infusion-ready CTL products. To depict the overall repertoire landscape, we evaluated the individual repertoire diversity by Shannon entropy, and, compared the inter-patient CDR3 similarity to estimate T cells expanded by common antigens. With a recently developed bioinformatics algorithm, termed Motif Analysis, we made a machine-learning prediction of structural regions within the CDR3 of TCRβ that associate with CTL therapy prognosis. We found that long term survivors, defined as patients surviving longer than two years, had a higher CTL repertoire diversity with reduced inter-patient similarity. Furthermore, TCR Motif Analysis identified 11 structural motifs distinguishing long term survivors from short term survivors. Specifically, two motifs with a high area under the curve (AUC) values were identified as potential predictive benchmarks for efficacious CTL production. Together, these results reveal that the presence of diverse TCR sequences containing a common core motif set is associated with a favorable response to CTL immunotherapy against EBV-positive NPC.
Introduction
In Southern China and Southeast Asia, nasopharyngeal carcinoma (NPC) is highly prevalent with an incidence of 30 to 50 per 100,000 people. Although a high cure rate has been achieved for localized NPC lesions using conventional chemoradiation therapy, the prognosis for patients with relapsed and metastatic disease remains poor.Citation1 NPC onset and progression are etiologically linked to Epstein–Barr virus (EBV) infection. Due to the expression of targetable tumor-associated viral antigens, NPC is suitable for T cell-based immunotherapies. Indeed, adoptive immunotherapy using EBV-specific cytotoxic T lymphocytes (EBV-CTLs) has shown clinical efficacy.Citation2 By combining EBV-CTL adoptive transfer with chemotherapy, in a phase II clinical trial, our group has yielded a remarkable objective response rate of 71.4% and a 2-year overall survival rate of 62.9% in patients with advanced NPC, compared to the 2-year overall survival rate of 29.5% in standard chemotherapy.Citation3 Despite these encouraging results, clinical outcomes remained variable such that 28.6% of patients were unresponsive to EBV-CTL immunotherapy. Therefore, benchmarks capable of evaluating CTL products and identifying favorable patients potentially benefiting from EBV-CTLs adoptive transfer are urgently needed to further improve EBV-CTL immunotherapy.
For EBV-CTL therapy, or any other T cell-mediated immunotherapies, efficacy is determined by both the efficiency of tumor antigen presentation and in situ T cell activation.Citation4 On the antigen presentation side, tumors heavily loaded with homogeneously distributed immunogenic antigens are most susceptible to T cell-mediated killing.Citation4,Citation5 High human leukocyte antigen (HLA) expression supports a higher probability of tumor antigen presentation to reduce the chance of immune evasion.Citation5 On the T cell activation side, the tumor microenvironment plays a pivotal role by restricting the capacity of T cell proliferation and cytolytic function.Citation4 Besides these extrinsic factors, intrinsic T cell activation, proliferation, and cytokine secretion are controlled by a T cell’s differentiation state,Citation4,Citation6 and most importantly, its antigen binding structure, the T cell receptor (TCR).Citation7,Citation8
The TCR is responsible for recognizing peptide antigens presented by the major histocompatibility complex (MHC).Citation9,Citation10 The TCR:pMHC interaction mediates the activity and specificity of the T-cell response to a given antigen.Citation11 In humans, TCRs are expressed on the surface of T cells as a disulfide-linked heterodimer composed of α and β chain.Citation12 TCR repertoire diversity is generated during early development in the thymus by somatic recombination of the TCRα and TCRβ loci.Citation13,Citation14 During this rearrangement process, TCR variable (V), diversity (D in the TCRβ) and joining (J) gene segments are reorganized and assembled by random and non-templated ligation.Citation14 The huge number of possible combinations generates a highly diverse set of antigen receptor sequences. Most importantly, the highly polymorphic protein domain called complementarity determining region 3 (CDR3), the principal antigen recognition site,Citation15 is created when TCR genomic loci undergo somatic recombination between gene segments;Citation16 this CDR3 region determines the specificity and affinity of antigen recognition.Citation11,Citation15 Therefore, direct analysis of CDR3 clonotypes might provide an improved understanding of the T-cell-mediated antitumor response.
To support this, recent advances in high-throughput sequencing offer unprecedented analytic power to monitor dynamic changes in the global TCR repertoire, thereby making precision analysis of T cell clonotypes feasible. Current TCR sequencing analyses provide unbiased measurements of clonotype composition, clonotype size, overall clonotype diversity, and inter-repertoire similarity measurements which can serve as direct readouts of a T cell clone’s proliferation and contraction to reflect its immunotherapeutic efficacy.Citation17,Citation18 Furthermore, utilizing machine learning algorithms, CDR3 regions sharing similar binding motifs toward a common antigen can be unbiasedly clustered. Using a certain CDR3 set as an anchor, we screened the entire TCR repertoire to distinguish TCRs with the same epitope specificities even without apparent global sequence similarity.Citation19,Citation20 Here, we applied these tools to assess repertoire features of EBV-expanded CTLs produced during clinical trial NCT00690872, hypothesizing that certain TCR repertoire features might inform the prediction of responsiveness to CTL immunotherapy in patients with NPC.
Materials and methods
Study design
In the NCT00690872 clinical cohort, a total of 38 patients with histologically proven, EBV-associated metastatic or locally recurrent NPC were enrolled. In the first-line treatment, four cycles of gemcitabine and carboplatin (GC) chemotherapy were administered, followed by six doses of EBV-CTL infusion, ranging from 0.1 to 12 × 108 cells.Citation3EBV-CTLs were expanded from autologous peripheral blood mononuclear cells (PBMCs) using autologous EBV-transformed lymphoblastoid cell lines (LCLs) as antigen-presenting cells. Each CTL product was tested for immunophenotype, EBV antigen specificity and HLA background. EBV-specific activation was confirmed by IFN-γ ELISPOT assay stimulated with LCLs, or HLA-restricted synthesized pool of peptides derived from EBV antigens (BZLF1, BRLF1, BMRF1, EBNA1, EBNA3A, EBNA3B, EBNA3C, LMP1, and LMP2). Due to rapid disease progression or death during chemotherapy, 3 patients have no chance to get CTL infusion. Of 35 patients receiving CTL therapy, 2 patients had no CTLs remaining for TCR sequencing. Therefore, 33 CTL pools were used for deep TCRβ sequencing (Figure S1). This bed-side to bench-side translational research was covered by SingHealth Centralized Institutional Review Board approval (CIRB reference number: 2019/2409). Patient informed consents were obtained before the trial.
After sequencing, data were mining through comparisons between long term survivors (LTS) and short term survivors (STS). Patients, surviving longer than two years, were categorized as LTS, based on overall survival (OS) differences between the GC-CTL-treated patient cohort and patients receiving chemotherapy alone in the same center. The latter cohorts were treated with paclitaxel-gemcitabine-carboplatin (PGC)Citation21 and PGC-5- fluorouracil (PGC-5-FU)Citation22 respectively. These three clinical trials enrolled similar patients with locally recurrent or metastatic NPC. Their one-year OS rates are 81.3, 75.0, 77.1%, two-year OS rates are 29.5, 42.9,62.9%, and three-year OS rates are 16.4, 25.0, 37.1% for PGC, PGC-5-FU and GC-CTL respectively. Compared to the chemotherapy alone regimens, the GC-CTL therapy showed progress in improving the two-year OS rate and three-year OS rate. Particularly, the OS rate improvement is significant in comparison with GCP regimen (Table S1). Thereby, the two-year is a natural cutoff to group our patients into LTS or STS.
TCR library construction and TCRβ sequencing
Frozen CTLs were thawed, and RNA was isolated using an RNAqueous™-Micro Total RNA Isolation Kit (Life Technologies, USA). A total of 500 ng RNA of each sample was reverse transcribed into complementary DNA (cDNA) with a universal constant region primer for TCRβ (ATCTCTGCTTCTGATGGCTCA) using a qScript Flex cDNA Kit (Quantabio, USA). Multiplex PCR was then conducted to amplify the entire CDR3 region using a Multiplex PCR Assay Kit (TaKaRa, Japan) with forward primers specific to V segments and a reverse primer targeting the C region.Citation23 PCR products were loaded onto a 2.5% agarose gel (Sigma, USA). After 90 min of electrophoresis at 130 V, bands centered at 300 bp were extracted (TaKaRa MiniBEST Agarose Gel DNA Extraction Kit Ver.3.0). Real-time fluorescence quantitative PCR was used to quantify the absolute concentration of the purified fragment (VAHTS Library Quantification Kit for Illumina). Based on their concentrations, all libraries were pooled and subjected to sequencing using the HiSeq X Ten platform under a 150 bp paired-end strategy. About 1.5 GB data were generated for each sample, which contains about five millions of reads to ensure enough depth.
Raw data processing
Raw data was cleaned by filtering out low-quality reads, adaptor sequences, and short length reads. Clean reads were assembled and aligned to reference V, D, J, and C genes of T-cell receptors using MiXCR software.Citation24 Specifically, a two-round assembly, including a first-round partial assembly and a second-round full assembly, was conducted to capture more clonotypes, referred to a specific CDR3 sequence. High-quality reads were firstly assembled into core clonotypes, which were then extended based on unique V and J genes against germline sequences. The final assembly was performed with error correction algorithms to merge similar clonotypes and their abundance. Out of frame sequences were excluded from further analysis. Numbers of distinct TCR clonotypes and accumulative clone frequencies (both amino acid and nucleotide sequences) were calculated after normalization using in-house R scripts.
Diversity analysis
TCR repertoire diversity was evaluated based on the Shannon entropy index, which was produced using the tcR package under the R environment.Citation25 Entropy function was used on clonotype frequencies to assess their diversity within each sample. This analysis was based on amino acid sequences from either the CDR3 region or the entire TCR region. Shannon entropy (H) was calculated using
where is the frequency of
TCR clonotype, and
represents the total number of TCR clonotypes for sample
.
Similarity analysis
The similarity of TCR repertoires from intra-group pairwise patients was quantified by calculating the Jaccard index, as previously reported.Citation26 Jaccard index values range from 0 to 1, indicating distinct to completely identical. These analyses were based on amino acid sequences from either the CDR3 region or the full-length TCR, as indicated.
Motif analysis
TCR clonotypes were included to generate all possible amino acid motifs with varying lengths using the R tcR package. Two separate pools of CDR3 sequences were created initially for each of these motifs from LTS and STS. To account for different sequence depths across samples, we normalized the number of CDR3s containing each motif by the total number of CDR3s containing all motifs in each sample. The motif frequency ratios between LTS and STS were correlated with patients’ clinical response. A higher ratio represents more abundant motifs in LTS compared with STS, enabling the identification of a set of candidate motifs distinguishing LTS and STS groups. The importance of each motif was evaluated using both Mean Decrease Accuracy and Mean Decrease Gini in the random forest. A standard receiver operating characteristic (ROC) approach was applied to evaluate the predictive power of each motif. These analyses were performed using R randomForestCitation27 and ROC packages.
Statistical analysis
The significance of diversity, similarity, and Motif Analysis comparisons between groups were measured by Wilcoxon signed-rank test, Pearson chi-square test, and Fisher exact test. Correlations between patient clinical response and entropy were quantified by Pearson correlation. Unsupervised hierarchical clustering was performed using the Manhattan distance or Ward.D2 method. Circular dendrograms were graphed with the R factoextra package. Figures were plotted using ggplot2 and ggpubr packages. All statistics were conducted under the R statistic environment.
Results
Characteristics of patients and their EBV-CTLs from Clinical trial NCT00690872
In the NCT00690872 clinical cohort,Citation3 patients were enrolled with metastatic or locally recurrent NPC. The HLA background, infused CTL number and overall survival time of each patient are summarized in Table S2. Of 33 CTL products available for TCRβ sequencing, 31 samples generated high-quality sequencing data. Thereby, TCR repertoire data from 18 LTS and 13 STS were subjected to further bioinformatic analyses (Table S2 and Figure S1). Total reads from these 31 CTL pools ranged from two to seven million, which are sufficient to detect low-frequency clonotypes (Table S3).
Long term survivors exhibit higher TCR repertoire diversity
Two possible mechanisms could underlie the observed clinical benefits of EBV-CTL immunotherapy. First, the clinical benefits might be associated with a few selected T cell clones, which are efficiently expanded to dominate the anti-tumor response. This would predict that clinical efficacy is associated with low CTL TCR repertoire diversity. Alternatively, rather than dominancy developed against a narrow range of tumor antigens, numerous clonotypes could be expanded by EBV stimulation to achieve a relatively even clonal size, which would target a broader spectrum of tumor cells with heterogeneous EBV antigen presentation. This scenario would predict that a favorable clinical response is associated with high CTL repertoire diversity.
A variety of statistical indices have been utilized to measure TCR repertoire diversity, including Simpson diversity, Hill numbers, and Shannon entropy. In comparison to the others, Shannon entropy is most balanced to summarize clonotype richness and evenness and employed as the surrogate parameter for clonal expansion and selection.Citation23,Citation28,Citation29 The antigen-recognizing residues of a TCR are separated into three CDRs:Citation30,Citation31 CDR1 and CDR2 contact conserved helical residues of the MHC and are encoded in germline V regions; and hypervariable CDR3 loops generated during VDJ recombination engage presented peptides within the groove of the MHC structure and therefore define the specificity of a given TCR.Citation32 Therefore, we measured the diversity of both CDR3 sequences and, to include the MHC interaction, the full-length TCR. At the individual level, although lacking statistical significance, we observed a weak positive correlation between TCR diversity and overall patient survival (Figure S2). However, after dividing patients into STS and LTS groups, in both CDR3 and full-length measurements, CTLs infused to LTS contained markedly higher TCR diversities (, 1b).
Figure 1. Long term survivors to EBV-specific adoptive T cell therapy have higher TCR repertoire diversity without HLA bias. a. Comparison of Shannon entropy between LTS and STS for CDR3 regions. b. Comparison of Shannon entropy for full-length TCRs. c-h. Shannon entropy comparisons in subgroups. LTS and STS are subgrouped according to their HLA alleles or types. Each dot represents the Shannon entropy value of each patient’s CTL repertoire. P values were calculated using nonparametric Wilcoxon signed-rank test; *, p < .05. LTS, long term survivors; STS, short term survivors
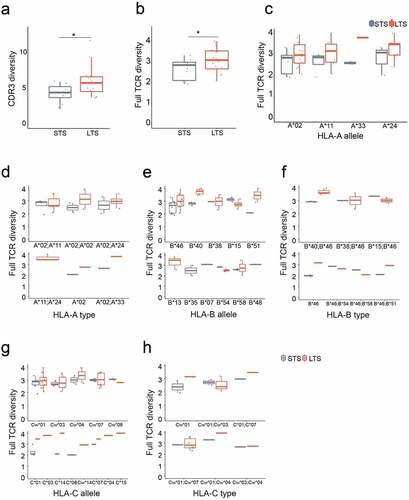
TCR activation and expansion require the engagement of both peptide antigen and MHC molecules, termed HLA in humans.Citation33 The HLA locus is the most polymorphic region of the human genome, encoding more than 6,000 HLA allomorphs.Citation34 Structural biology studies have shown a pairwise interaction between HLAs and TCRs through complementary amino acid residues.Citation35 Consequently, any differences in HLA diversity between LTS and STS groups should impact TCR diversity during CTL production. To exclude this confounding factor, we subdivided patients according to their major HLA haplotypes. We previously determined that EBV-CTLs generated from PBMCs were dominantly CD8+ positive;Citation3 therefore, we only assessed the diversity of type-I MHC: HLA-A, -B, -C molecules were included for analysis here, with HLA-DP, -DQ and – DR excluded. Although sample sizes limited the statistical significance for some subgroups, for almost all HLA types, TCR repertoire diversities were higher in the LTS group (), indicating a lack of HLA bias for the observed CTL repertoire diversity. Together, these findings suggest that during CTL production, the generation of diversified EBV-specific T cell clones may favor anti-NPC efficacy.
Long term survivors share lower inter-patient similarity
Although diversity analysis suggests that there may not be dominant EBV antigens governing the anti-tumor response of CTLs, it is unclear whether in LTS CTLs were raised against a common set of “effective” antigens. Using Jaccard index analysis,Citation26 we quantified the intra-group and inter-patient similarity of the TCR repertoire. Compared to the STS group, the inter-patient CTL CDR3 similarity in the LTS group was lower (), and, when this analysis was extended to the full TCR, the same pattern was observed ().
Figure 2. Long term survivors have lower inter-patient TCR repertoire similarity unrelated to HLA allomorphs. a-b. Similarity comparisons between LTS and STS for the CDR3 region. Each dot represents a Jaccard similarity value for a pair of LTS or STS. c. Similarity comparisons for full-length TCR. d. CDR3 similarity for top frequency clones. TCR clonotype analyses used 10%, 1%, and 0.1% clonotypes. e. Inter-patient HLA overlap in LTS and STS groups. The size of each dot represents the number of patient-matching pairs. P values were calculated using Pearson’s Chi-squared test. f. Correlation of inter-patient similarity versus the number of shared HLAs. P values were calculated using Wilcoxon signed-rank test; **, p < .01; ***, p < .001, ****, p < .0001; ns, not significant; LTS, long term survivors; STS, short term survivors
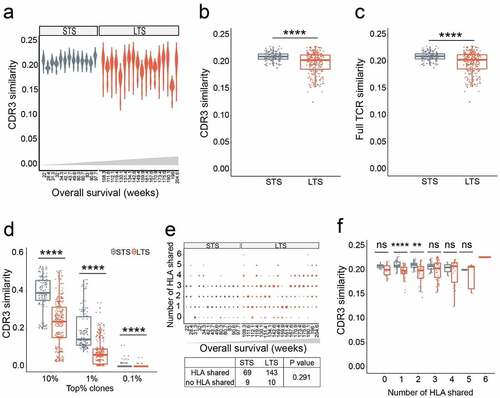
We also observed that the clonal frequency distribution in each CTL product is largely biased toward highly expanded clones: clonotypes with frequencies ranked in the top 1% accumulatively occupy 90.10% (±12.85%) of the repertoire in LTS and 96.83% (±1.41%) in STS. For inter-sample clonotype similarity measurements, this distribution profile could underestimate the contribution of high-frequency clones. To mitigate this bias, we assessed similarity among the most prevalent clonotypes. By investigating the highest frequency clones at top 10%, top 1%, and top 0.1% ranges, we found that inter-patient TCR CDR3 similarities gradually decrease in both LTS (mean similarity values range from 0.2292 to 0.0006) and STS (mean similarity values range from 0.3868 to 0.0051), indicating that higher frequency clones contribute more to similarity. Nevertheless, in each ranking category, compared with STS, significantly lower CDR3 sharing was observed within the LTS group (). Together, these results suggest that among the LTS, infused CTL cells are less likely to be expanded against a set of common epitopes. Like the intra-patient TCR diversity analysis described above, these inter-patient CDR3 similarity analyses also indicate that a common EBV antigen may not be the primary determinant of anti-NPC CTLs’ clinical efficacy.
To determine whether this similarity analysis was biased by intra-group HLA overlap, we examined the correlation between repertoire similarity and HLA sharing. Three alleles of type I HLA were examined, with numbers of inter-individual HLA alleles shared ranging from 0 to 6. No differences in HLA complexity were observed between LTS and STS (). Moreover, regardless of HLA diversity, all STS had higher CDR3 sharing rates than LTS ().
CDR3 structural motifs predict clinical response
Accumulating evidence from recent structural studies has determined that TCR-pMHC recognition does not require every amino acid in the CDR3 region. Instead, peptide contact hotspots, termed motifs consisting of 3–4 core amino acids within the CDR3 structure, can be routinely identified. This indicates that different CDR3s sharing the same motif may recognize the same epitope, even if the rest of their CDR3 sequences vary.Citation36,Citation37 When applied to TCR repertoire analysis, Motif Analysis compellingly enhances the accuracy in organizing TCRs based on shared antigen specificities, eventually leading to more reliable frequency quantification of antigen-specific T cells.Citation20,Citation36 To perform Motif Analysis, we pooled all CDR3 clonotypes together from all LTS, and the unique CDR3 list was generated by removing the duplicates. The 2mer, 3mer, and 4mer connected amino acid sequences derived from the top 10% unique CDR3 clonotypes constituted the initial motif pools. The ratio of intra-group summed frequencies of CDR3 containing the K-mer motif was calculated between LTS and STS groups (LTS/STS). We then utilize an accuracy algorithm to identify motifs preferentially enriched in CTLs of LTS, where accuracy defines how well the input variables predict the outcomes ().Citation38 When the ratio of LTS/STS is higher than 10, a total of 11 motifs were identified as non-negatively correlated with overall survival (). Taking the presence and frequency of these 11 motifs as the sole grouping parameter, we separated the majority of patients to match their clinical responses, except only three LTS misidentified (90.3% accuracy; ), suggesting that CDR3 motifs identified through machine learning may effectively stratify NPC patients benefitting from EBV-CTL therapy. In recent years, many EBV-specific TCRs were functionally validated and deposit into public databases, such as VDJdbCitation39 and McPAS-TCR.Citation40 We submitted all these 11 responses-associated motifs to these two databases for a search. Eight motifs, DGAG, EES, EVAG, GSRS, KTGE, LYL, SPFS and TTNT, were successfully discovered within the CDR3 region of TCR(s) against EBV antigen epitopes. These epitopes spread on BMLF1, BRLF1, EBNA, and BZLF1 proteins (). This supports the notion that these motifs belong to CTLs that were expanded by EBV antigens during the production.
Figure 3. TCRβ CDR3 structural motifs predict clinical response. a. Model accuracy was applied to choose the optimal motif ratio in LTS and STS groups. The accuracy is valuated with the pool of motifs non-negatively correlated with overall survival. Number of X axis indicates greater than x. At a ratio of greater than 10, accuracy reached a maximum. b. Plot depicting LTS/STS CDR3 ratios and correlation with overall survival. The top candidates (highlighted in black) were chosen based on their positive correlation (≥0) and ratio ≥11. c. LTS were distinguished from STS by combining 11 CDR3 motifs. d. Motifs found in public databases. The 11 Motifs used to group patients were searched in VDJdb and McPAS-TCR databases. e. The indicated 11 CDR3 motifs were ranked according to their predictive accuracy. Left, mean decrease accuracy; right, mean decrease Gini. f. Enrichment of SPFS and SPDQ motifs in LTS. g. ROC curves of SPFS and SPDQ motifs indicate medium to high predictive power to distinguish between NR and R groups. h. Correlation between overall survival and accumulative frequency of CDR3 clonotypes bearing SPFS or SPDQ motifs. i. Correlation between HLA sharing and accumulative frequency of CDR3s bearing SPFS or SPDQ motifs. Statistics based on Wilcoxon signed-rank test; *, p < .05; **, p < .01; ns, not significant; LTS, long term survivors; STS, short term survivors
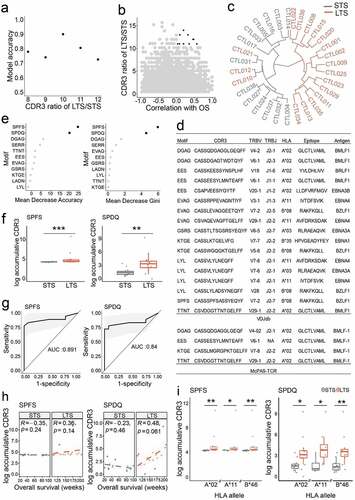
We next utilized machine learning to further rank the importance of these 11 CDR3 motifs. Two independent accuracy parameters were generated for each motif: mean decrease of accuracy and mean decrease Gini. The former computes the accuracy changes by permutating each variable with the hypothesis that permutation of the critical variable will decrease model accuracy. The latter builds individual decision trees and then measures the mean total decrease in node impurity for each variable. Both approaches identified the same two 4mer motifs, SPFS and SPDQ, as contributing most to response prediction accuracy across all patients (), both of which are significantly enriched among TCRs of LTS CTLs (). Frequency comparisons for the other 9 motifs also identified the motif SERR as enriched in the LTS group (Figure S3a), although its influence on prediction accuracy is lower (). As biomarker evaluation, ROC analysis yielded areas under the curve (AUC) of 89.1% and 84% for SPFS and SPDQ, respectively (). For individual patients, the accumulative CDR3 frequency of the SPQD motif showed a positive correlation with overall survival among LTS ( and Figure S3b). Moreover, these two motifs are significantly enriched in LTS with A2, A11, or B46 HLA alleles (). Together, these results show that the enrichment of specific motifs within the CDR3 region of infused CTLs may predict NPC patients’ response to EBV-CTL therapy. Specifically, through the database search, we determined that the SPFS motif belongs to TCRs that recognize the RAKFKQLL epitope in the BLZF1 protein (). Experimentally, this epitope was presented by HLA-B*08:01. Although HLA-B*08:01 cannot be found for any patient in the motif analysis, we assessed whether other HLA alleles may present this epitope using NetMHCpan4.1Citation41 and HLAthenaCitation42 algorithms. These bioinformatics tools predicted that the RAKFKQLL epitope may be presented by HLA-A*33:03, B*15:01, B*15:25, B*38:02, or B*46:01 with sufficient affinity. In our cohort, 27 out of 31 patients contain at least one of these HLA alleles (Table S4). Therefore, for our cohort, the presentation of RAKFKQLL epitope in tumor tissues is probable. This implies that SPFS-containing TCRs in the CTL products may be the component delivered the observed clinical benefit.
Discussion
EBV-positive NPC cells express several general viral antigens, including EBNA1, LMP1, and LMP2, which can be targeted to eliminate tumor cells effectively.Citation43 Multiple clinical studies have shown that EBV-enriched CTLs containing LMP2-specific reactivity are associated with objective response.Citation2,Citation3,Citation43 However, while survival analysis showed significantly improved overall survival, the frequency of LMP2-specific T cells among infused CTLs, as analyzed by ELISPOT, failed to predict individuals’ anti-tumor response.Citation3 Here, we conducted high-throughput TCRβ repertoire analysis by deep sequencing to provide insight into the characteristics of EBV-CTL repertoires. We found that LTS have higher intra-patient TCR repertoire diversity and lower inter-patient similarity. Using a newly developed Motif Analysis algorithm,Citation20 we identified 11 motifs capable of separating LTS from STS, such that these motifs might eventually be used as predictors of clinical efficacy.
TCR repertoire diversity characterizes the T cell clonal composition, which reflects the spectrum of antigen specificity and the quantity of each clonotype.Citation44 Here we found that LTS have a more diverse CTL TCR repertoire, a finding which can be explained by at least two possible mechanisms. First, because multiple different TCR clones can recognize the same antigen epitope,Citation32,Citation45 vast repertoire diversity can magnify the immune response to a given antigen by formation of a more diverse pool of effector T cells with functionally heterogeneity.Citation46 This will enhance the resilience against the inevitable loss of individual clonotypes.Citation18,Citation47 If this antigen is dominant in tumor tissue, this could generate superior anti-tumor immunity. This phenomenon was previously observed in a breast cancer patient with a complete response toward tumor-infiltrating lymphocyte (TIL) therapy comprising seven highly expanded TCR clones against the same neoantigen.Citation18 Second, NPC cells might express several epitopes derived from EBV antigens to induce a cytotoxic CD8 + T cell response. In this way, more TCR clonotypes targeting an assortment of potential epitopes could simultaneously trigger a more robust anti-tumor immune response and prevent immune escape due to tumor heterogeneity. The breast cancer patient mentioned above received autologous TILs reactive against four neoantigens to achieve durable complete tumor regression. Although before infusion, the in vitro-generated TIL product recognized only two neoantigens with eight different T cell clonotypes, three rare clonotypes emerged as dominant clones targeting two more neoantigens after in vivo expansion. Thus, a diverse TCR repertoire has a greater probability of containing rare clonotypes, which might expand into dominant clones in vivo to mediate late but durable tumor regression.Citation18 In support of this, we observed decreased tumor growth rates after initial progression in several patients, indicating a delayed anti-tumor response of infused EBV-CTLs.Citation3 This is also consistent with a previous retrospective analysis of melanoma patients showing that rare T cell clonotypes expand and exhibit superior anti-cancer properties in vivo.Citation17
Regardless of which of these two mechanisms is most prominent for NPC patient outcomes, a positive relationship between CTL repertoire diversity and prognosis has been documented in numerous pre-clinical and clinical studies. In B16 melanoma-bearing mice, increased diversity of tumor-infiltrating T cells contributes to successful checkpoint blockade immunotherapy.Citation44 Moreover, diverse resident memory T cells in tumor-adjacent mucosa provide more effective immunological surveillance for postoperative gastric cancer patients.Citation23 A phase III clinical trial of patients with metastatic renal cell carcinoma showed that TCR repertoires with high diversity are also correlated with a favorable prognosis.Citation48 In addition, post-therapy TCR repertoire analysis revealed that peripheral CD4 + T cells from colorectal cancer patients with partial response exhibited significantly higher TCR repertoire diversity than those from patients with stable or progressive disease. This diversity difference was enlarged after cetuximab plus fluorouracil-leucovorin-irinotecan (FOLFIRI) treatment, further demonstrating the utility of monitoring TCR repertoire diversity changes for efficacy prediction.Citation49 Finally, one study showed that favorable prognosis correlates with higher TCR repertoire diversity in NPC tumor tissues compared to paired adjacent normal tissues.Citation50 These previous results are consistent with our findings that high CTL diversity associates with improved NPC patient immunotherapeutic outcomes.
Our Motif Analysis uncovered several motifs significantly associated with prolonged overall survival in advanced NPC patients. The idea that antigen specificity is primarily determined by a stretch of 3–4 amino acids within the CDR3 region is also strongly supported by the TCR:pMHC structural biology study. Through a comprehensive yeast display screening, Garcia and colleaguesCitation51 exhaustively searched all possible antigens recognized by the 42F3 TCR. Out of 4.2 × 10⁸ variants, hundreds can bind the 42F3 TCR. Although the sequences of engaged antigens differ drastically, the TCRs invariably use the (S)DAP motif within CDR3β to recognize all antigens. Additionally, Davis and colleagues recently updated their motif analysis platform with GLIPH2.Citation52 With GLIPH2 algorithm, they successfully annotated 19044 unique TCRβ sequences into a smaller number of groups based on their motif similarity. The power of this tool was further validated through antigen discovery and functional validation. These elegant studies demonstrated that the motif-driven analysis is a reliable algorithm to classify TCR specificities without prerequisite for epitope or HLA restriction. This set of 11 tri/tetrapeptide motifs identified here independently predict clinical benefit with high accuracy, suggesting their possible future use as biomarkers to characterize the quality of EBV-CTL products and responsiveness to EBV-CTL therapy. CTL generation is a complex and challenging process requiring highly trained and skilled staff to maintain large numbers of T cells over a long duration.Citation53 Typically, after an initial 7-day culture, millions of CTLs can be generated and sequenced. Results from repertoire sequencing combined with Motif Analysis could instruct us to stop further expansion if CTLs do not exhibit an appropriate LTS motif pattern, and, at this time, patients with an unfavorable prognosis could choose alternative treatments that have a higher likelihood of success.
It is important to note the limitations of our study. First, only 31 samples (18 LTS and 13 STS) were subjected to TCR repertoire analysis. Additional collection and sequencing of peripheral blood samples could be used to strengthen our conclusions. Second, ideally, the TCR repertoire should be tracked after adoptive cell transfer. A comparison between pre- and post-infusion CTLs would provide more comprehensive information on TCR repertoire reconstitution in vivo. These caveats notwithstanding, our study presents a new methodology to stratify in vitro-generated EBV-CTLs by CDR3 recognition motifs associated with NPC patient survival in order to optimize therapeutic recommendations.
Conclusions
In this study, by conducting TCRβ repertoire sequencing with autologous EBV-expanded CTL products, we found that the presence of diverse TCR sequences containing a common core motif set is associated with a favorable response to CTL immunotherapy against EBV-positive NPC. This bedside to bench translational study is timely and instructive for the optimization of adoptive EBV-CTL NPC therapy.
Authors’ contributions
Qi-Jing Li, Xiao-Fan Wang, Timothy Wai Ho Shuen, and Han-Chong Toh were responsible for study design and data interpretation. Ying Wan was responsible for TCRβ repertoire sequencing technology development. Guoping Wang and Haiyang Wu performed the experiments. Poorva Mudgal and Liuyang Wang provided bioinformatics analysis for the data. Guoping Wang, Peter Alexander, and Qi-Jing Li wrote the manuscript. Timothy Wai Ho Shuen collected clinical samples and patient information. Who-Whong Wang was responsible for the production of EBV-CLTs.
Supplemental Material
Download ()Acknowledgments
We thank Elizabeth Robins and Laura Christian from Duke University Medical Center for providing technical consultation. Guoping Wang was supported by a Postdoctoral Fellowship from the Third Military Medical University, Chongqing, China. This research was supported by Duke DCI-NUS Pilot grant (453-1141).
Disclosure statement
Qi-Jing Li is a scientific co-founder and shareholder of TCRCure Biopharma.
Supplementary material
Supplemental data for this article can be accessed on the publisher’s website
Additional information
Funding
References
- Wee J, Tan EH, Tai BC, Wong HB, Leong SS, Tan T, et al. Randomized trial of radiotherapy versus concurrent chemoradiotherapy followed by adjuvant chemotherapy in patients with American Joint Committee on Cancer/International Union against cancer stage III and IV nasopharyngeal cancer of the endemic variety. J Clin Oncol. 2005;23:6730–10. doi:10.1200/JCO.2005.16.790.
- Straathof KC, Bollard CM, Popat U, Huls MH, Lopez T, Morriss MC, et al. Treatment of nasopharyngeal carcinoma with Epstein-Barr virus–specific T lymphocytes. Blood. 2005;105:1898–1904. doi:10.1182/blood-2004-07-2975.
- Chia WK, Teo M, Wang WW, Lee B, Ang SF, Tai WM, et al. Adoptive T-cell transfer and chemotherapy in the first-line treatment of metastatic and/or locally recurrent nasopharyngeal carcinoma. Mol Ther. 2014;22:132–139.
- Tran E, Robbins PF, Rosenberg SA. ‘Final common pathway‘ of human cancer immunotherapy: targeting random somatic mutations. Nat Immunol. 2017;18(3):255–262. doi:10.1038/ni.3682.
- Van Belzen IAEM, Kesmir C. Immune biomarkers for predicting response to adoptive cell transfer as cancer treatment. Immunogenetics. 2019;71(2):71–86. doi:10.1007/s00251-018-1083-1.
- Crompton JG, Sukumar M, Restifo NP. Uncoupling T-cell expansion from effector differentiation in cell-based immunotherapy. Immunol Rev. 2014;257(1):264–276. doi:10.1111/imr.12135.
- Simoni Y, Becht E, Fehlings M, Loh CY, Koo S-L, Teng KWW, Yeong JPS, Nahar R, Zhang T, Kared H, et al. Bystander CD8+ T cells are abundant and phenotypically distinct in human tumour infiltrates. Nature. 2018;557(7706):575–579. doi:10.1038/s41586-018-0130-2.
- Scheper W, Kelderman S, Fanchi LF, Linnemann C, Bendle G, de Rooij MAJ, Hirt C, Mezzadra R, Slagter M, Dijkstra K, et al. Low and variable tumor reactivity of the intratumoral TCR repertoire in human cancers. Nat Med. 2019;25(1):89–94. doi:10.1038/s41591-018-0266-5.
- Smith-Garvin JE, Koretzky GA, Jordan MS. T Cell Activation Annual Review of Immunology. 2009;27. 591–619.
- Kenneth M, Casey W. Janeway’s immunobiology .9th ed. New York (USA): Garland Science; 2016.
- Davis MM, Boniface JJ, Reich Z, Lyons D, Hampl J, Arden B, et al. Ligand recognition by alpha beta T cell receptors. Annu Rev Immunol. 1998;16:523–544.
- Ebert PJ, Li QJ, Huppa JB, Davis MM. Functional development of the T cell receptor for antigen. Prog Mol Biol Transl Sci. 2010;92:65–100.
- Chien Y-H, Gascoigne NRJ, Kavaler J, Lee NE, Davis MM. Somatic recombination in a murine T-cell receptor gene. Nature. 1984;309:322–326. doi:10.1038/309322a0.
- Krangel MS. Mechanics of T cell receptor gene rearrangement. Curr Opin Immunol. 2009;21:133–139. doi:10.1016/j.coi.2009.03.009.
- Garcia KC, Degano M, Stanfield RL, Brunmark A, Jackson MR, Peterson PA, et al. An alphabeta T cell receptor structure at 2.5 A and its orientation in the TCR-MHC complex. Science. 1996;274:209–219. doi:10.1126/science.274.5285.209.
- Gellert M. Molecular analysis of V(D)J recombination. Annu Rev Genet. 1992;26:425–446. doi:10.1146/annurev.ge.26.120192.002233.
- Chapuis AG, Desmarais C, Emerson R, Schmitt TM, Shibuya K, Lai I, et al. Tracking the Fate and Origin of Clinically Relevant Adoptively Transferred CD8(+) T Cells In Vivo. Science Immunology. 2017;2:eaal2568. doi:10.1126/sciimmunol.aal2568.
- Zacharakis N, Chinnasamy H, Black M, Xu H, Lu YC, Zheng Z, et al. Immune recognition of somatic mutations leading to complete durable regression in metastatic breast cancer. Nat Med. 2018;24:724–730. doi:10.1038/s41591-018-0040-8.
- Glanville J, Huang H, Nau A, Hatton O, Wagar LE, Rubelt F, et al. Identifying specificity groups in the T cell receptor repertoire. Nature. 2017;547:94.
- Zheng M, Zhang X, Zhou Y, Tang J, Han Q, Zhang Y, et al. TCR repertoire and CDR3 motif analyses depict the role of alphabeta T cells in Ankylosing spondylitis. EBioMedicine. 2019;47:414–426. doi:10.1016/j.ebiom.2019.07.032.
- Leong SS, Wee J, Tay MH, Toh CK, Tan SB, Thng CH, et al. Paclitaxel, carboplatin, and gemcitabine in metastatic nasopharyngeal carcinoma: a Phase II trial using a triplet combination. Cancer. 2005;103:569–575. doi:10.1002/cncr.20804.
- Leong SS, Wee J, Rajan S, Toh CK, Lim WT, Hee SW, et al. Triplet combination of gemcitabine, paclitaxel, and carboplatin followed by maintenance 5-fluorouracil and folinic acid in patients with metastatic nasopharyngeal carcinoma. Cancer. 2008;113:1332–1337. doi:10.1002/cncr.23687.
- Jia Q, Zhou J, Chen G, Shi Y, Yu H, Guan P, et al. Diversity index of mucosal resident T lymphocyte repertoire predicts clinical prognosis in gastric cancer. Oncoimmunology. 2015;4:e1001230. doi:10.1080/2162402X.2014.1001230.
- Bolotin DA, Poslavsky S, Mitrophanov I, Shugay M, Mamedov IZ, Putintseva EV, et al. MiXCR: software for comprehensive adaptive immunity profiling. Nat Methods. 2015;12:380. doi:10.1038/nmeth.3364.
- Nazarov VI, Pogorelyy MV, Komech EA, Zvyagin IV, Bolotin DA, Shugay M, et al. tcR: an R package for T cell receptor repertoire advanced data analysis. BMC Bioinform. 2015;16:175. doi:10.1186/s12859-015-0613-1.
- Pacholczyk R, Ignatowicz H, Kraj P, Ignatowicz L. Origin and T Cell Receptor Diversity of Foxp3+CD4+CD25+ T Cells. Immunity. 2006;25:249–259. doi:10.1016/j.immuni.2006.05.016.
- Liaw A, Wiener M. Classification and regression by randomForest. R News. 2002;2:18–22.
- Keylock CJ. Simpson diversity and the Shannon-Wiener index as special cases of a generalized entropy. Oikos. 2005;109(1):203–207. doi:10.1111/j.0030-1299.2005.13735.x.
- Hill MO. Diversity and Evenness: a Unifying Notation and Its Consequences. Ecology. 1973;54:427–432. doi:10.2307/1934352.
- Rossjohn J, Gras S, Miles JJ, Turner SJ, Godfrey DI, McCluskey J. T cell antigen receptor recognition of antigen-presenting molecules. Annu Rev Immunol. 2015;33(1):169–200. doi:10.1146/annurev-immunol-032414-112334.
- Turner SJ, Doherty PC, McCluskey J, Rossjohn J. Structural determinants of T-cell receptor bias in immunity. Nat Rev Immunol. 2006;6:883–894. doi:10.1038/nri1977.
- Sewell AK. Why must T cells be cross-reactive? Nat Rev Immunol. 2012;12(9):669–677. doi:10.1038/nri3279.
- Zinkernagel RM, Doherty PC. Restriction of in vitro T cell-mediated cytotoxicity in lymphocytic choriomeningitis within a syngeneic or semiallogeneic system. Nature. 1974;248(5450):701–702. doi:10.1038/248701a0.
- Adams EJ, Luoma AM. The Adaptable Major Histocompatibility Complex (MHC) Fold: structure and Function of Nonclassical and MHC Class I–Like Molecules. Annu Rev Immunol. 2013;31(1):529–561. doi:10.1146/annurev-immunol-032712-095912.
- La Gruta NL, Gras S, Daley SR, Thomas PG, Rossjohn J. Understanding the drivers of MHC restriction of T cell receptors. Nat Rev Immunol. 2018;18(7):467–478. doi:10.1038/s41577-018-0007-5.
- Glanville J, Huang H, Nau A, Hatton O, Wagar LE, Rubelt F, Ji X, Han A, Krams SM, Pettus C, et al. Identifying specificity groups in the T cell receptor repertoire. Nature. 2017;547(7661):94–98.
- Dash P, Fiore-Gartland AJ, Hertz T, Wang GC, Sharma S, Souquette A, Crawford JC, Clemens EB, Nguyen THO, Kedzierska K, et al. Quantifiable predictive features define epitope-specific T cell receptor repertoires. Nature. 2017;547(7661):89–93. doi:10.1038/nature22383.
- Bradley AP. The use of the area under the ROC curve in the evaluation of machine learning algorithms. Pattern Recognit. 1997;30(7):1145–1159. doi:10.1016/S0031-3203(96)00142-2.
- Bagaev DV, Vroomans RMA, Samir J, Stervbo U, Rius C, Dolton G, Greenshields-Watson A, Attaf M, Egorov ES, Zvyagin IV, et al. VDJdb in 2019: database extension, new analysis infrastructure and a T-cell receptor motif compendium. Nucleic Acids Res. 2020;48(D1):D1057–D62. doi:10.1093/nar/gkz874.
- Tickotsky N, Sagiv T, Prilusky J, Shifrut E, Friedman N, Wren J. McPAS-TCR: a manually curated catalogue of pathology-associated T cell receptor sequences. Bioinformatics. 2017;33(18):2924–2929. doi:10.1093/bioinformatics/btx286.
- Reynisson B, Alvarez B, Paul S, Peters B, Nielsen M. NetMHCpan-4.1 and NetMHCIIpan-4.0: improved predictions of MHC antigen presentation by concurrent motif deconvolution and integration of MS MHC eluted ligand data. Nucleic Acids Res. 2020;48(W1):W449–W54. doi:10.1093/nar/gkaa379.
- Sarkizova S, Klaeger S, Le PM, Li LW, Oliveira G, Keshishian H, Hartigan CR, Zhang W, Braun DA, Ligon KL, et al. A large peptidome dataset improves HLA class I epitope prediction across most of the human population. Nat Biotechnol. 2020;38(2):199–209. doi:10.1038/s41587-019-0322-9.
- Comoli P, Pedrazzoli P, Maccario R, Basso S, Carminati O, Labirio M, Schiavo R, Secondino S, Frasson C, Perotti C, et al. Cell Therapy of Stage IV Nasopharyngeal Carcinoma With Autologous Epstein-Barr Virus–Targeted Cytotoxic T Lymphocytes. J Clin Oncol. 2005;23(35):8942–8949. doi:10.1200/JCO.2005.02.6195.
- Hosoi A, Takeda K, Nagaoka K, Iino T, Matsushita H, Ueha S, Aoki S, Matsushima K, Kubo M, Morikawa T, et al. Increased diversity with reduced “diversity evenness” of tumor infiltrating T-cells for the successful cancer immunotherapy. Sci Rep. 2018;8(1):1058. doi:10.1038/s41598-018-19548-y.
- Song I, Gil A, Mishra R, Ghersi D, Selin LK, Stern LJ. Broad TCR repertoire and diverse structural solutions for recognition of an immunodominant CD8+ T cell epitope. Nat Struct Mol Biol. 2017;24(4):395–406. doi:10.1038/nsmb.3383.
- Han A, Glanville J, Hansmann L, Davis MM. Linking T-cell receptor sequence to functional phenotype at the single-cell level. Nat Biotechnol. 2014;32(7):684–692. doi:10.1038/nbt.2938.
- Gil A, Yassai MB, Naumov YN, Selin LK. Narrowing of Human Influenza A Virus-Specific T Cell Receptor α and β Repertoires with Increasing Age. J Virol. 2015;89:4102–4116. doi:10.1128/JVI.03020-14.
- Ho TH, Gagnon RC, Liu Y, Hodi FS, Signoretti S, Choueiri TK. T-cell receptor (TCR) repertoire in metastatic renal cell carcinoma (RCC) patients treated with first-line vascular endothelial growth factor receptor blockade. Journal of Clinical Oncology. 2016;34(2_suppl):501. doi:10.1200/jco.2016.34.2_suppl.501.
- Luo W, He W-T, Wen Q, Chen S, Wu J, Chen X-P, et al. Changes of TCR repertoire diversity in colorectal cancer after Erbitux (cetuximab) in combination with chemotherapy. Am J Cancer Res. 2014;4:924–933.
- Jin Y-B, Luo W, Zhang G-Y, Lin K-R, Cui J-H, Chen X-P, Pan Y-M, Mao X-F, Tang J, Wang Y-J, et al. TCR repertoire profiling of tumors, adjacent normal tissues, and peripheral blood predicts survival in nasopharyngeal carcinoma. Cancer Immunology, Immunotherapy: CII. 2018;67(11):1719–1730. doi:10.1007/s00262-018-2237-6.
- Adams JJ, Narayanan S, Birnbaum ME, Sidhu SS, Blevins SJ, Gee MH, Sibener LV, Baker BM, Kranz DM, Garcia KC, et al. Structural interplay between germline interactions and adaptive recognition determines the bandwidth of TCR-peptide-MHC cross-reactivity. Nat Immunol. 2016;17(1):87–94. doi:10.1038/ni.3310.
- Huang H, Wang C, Rubelt F, Scriba TJ, Davis MM. Analyzing the Mycobacterium tuberculosis immune response by T-cell receptor clustering with GLIPH2 and genome-wide antigen screening. Nat Biotechnol. 2020;38(10):1194–1202. doi:10.1038/s41587-020-0505-4.
- Jin J, Sabatino M, Somerville R, Wilson JR, Dudley ME, Stroncek DF, et al. Simplified method of the growth of human tumor infiltrating lymphocytes in gas-permeable flasks to numbers needed for patient treatment. Journal of Immunotherapy (Hagerstown, Md: 1997). 2012;35:283–292. doi:10.1097/CJI.0b013e31824e801f.