
ABSTRACT
Gliomas are heavily infiltrated with immune cells of myeloid origin. Past studies have shown that high-grade gliomas have a higher proportion of alternatively activated and suppressive myeloid cells when compared to low-grade gliomas, which correlate with poor prognosis. However, the differences in immune cell phenotypes within high-grade gliomas (between grade 3 and grade 4 or GBM) are relatively less explored, and a correlation of phenotypic characteristics between immune cells in the blood and high-grade tumors has not been performed. Additionally, myeloid cells of granulocytic origin present in gliomas remain poorly characterized. Herein, we address these questions through phenotypic characterizations of monocytes and neutrophils present in blood and tumors of individuals with glioblastoma (GBM, IDH-wild type) or grade 3 IDH-mutant gliomas. We observe that neutrophils are highly heterogeneous among individuals with glioma, and are different from healthy controls. We also show that CD163 expressing M2 monocytes are present in greater proportions in GBM tissue when compared to grade 3 IDH-mutant glioma tissue, and a larger proportion of granulocytic myeloid-derived suppressor cells are present in grade 3 IDH-mutant gliomas when compared to GBM. Finally, we demonstrate that the expression levels of CD86 and CD63 showed a high correlation between blood and tumor and suggest that these may be used as possible markers for prognosis.
Introduction
High-grade gliomas, the most common form of brain tumors, are associated with poor prognosis.Citation1 The current standard of care has met with limited success, possibly due to the high adjacent tissue infiltrative capacity,Citation2,Citation3 treatment-resistant cells,Citation4 low-to-medium mutational burden,Citation5 and cellular heterogeneityCitation6,Citation7 of glioblastoma (GBM). Immunotherapy, such as the use of antibodies against programmed cell death protein 1 (PD)-1Citation8 that focus on preventing immunosuppression by regulatory T cells, have shown limited success,Citation3 which may be due to the diversity of immunosuppressive cells present in the GBM microenvironment.
In addition to regulatory T cells, multiple reports have highlighted the increased presence of alternatively activated or suppressive cells of myeloid origin in GBMs.Citation9–11 For example, larger numbers of myeloid-derived suppressor cells (MDSCs) have been observed in the blood,Citation12–15 and these cells are also enriched in the GBM microenvironment.Citation5,Citation16–18 An enrichment of suppressive monocyte/macrophages (M2 or M0 phenotype)Citation10,Citation19–21 has also been observed. Further, it has been suggested that the monocytes in the GBM microenvironment may be phenotypically and functionally different,Citation22–25 and the same is possibly true for neutrophilsCitation26–28 too. Determining the prevalence of such immuno-modulatory cells of myeloid origin and characterizing their phenotype, could have implications for the development of new therapies.
In this context, herein, we aimed to address a few questions with regard to myeloid cells in individuals with gliomas: 1) if there are differences in the abundance of suppressive myeloid cells between grade 3 IDH-mutant and GBM IDH-wild type (IDH-wt). Most studies suggest that the frequencies of suppressive cells are increased in GBM when compared to lower grade gliomas (grade 2), but comparisons between GBM and grade 3 do not show significant differences.Citation10,Citation17 2) The characterization of granulocytes in the tumor microenvironment. Wang et al.Citation27 demonstrated that cells with neutrophil gene signatures were present in GBM, and Chai et. al.Citation28 showed that individuals with GBM had a greater proportion of neutrophilic-MDSC in the blood when compared to healthy controls. However, detailed immuno-phenotyping of these neutrophil populations has not yet been reported. And, 3) if there is a correlation in the phenotype of myeloid cells between blood and tumor tissue of the same individual, similar to regulatory T cells.Citation29 Identifying phenotypes of immune cells in the blood that are predictive of glioma severity might help in making decisions with regard to clinical treatment and management. To answer these questions, we evaluated the phenotype (surface protein expression) of myeloid cells obtained from tumor resections and blood of individuals with gliomas using multi-color flow cytometry.
Methods
Ethics statement
Both human glioma tissue and blood samples were collected from individuals following informed consent at the Mazumdar Shaw Medical Center (MSMC), and all procedures were conducted in compliance with the approved protocol of the Institutional Review Board (No: NHH/MEC-CL-EA-1-2018-536). The diagnosis of glioma and grade of glioma was confirmed by histopathological examinations by pathologists at the MSMC, and followed the c-IMPACT update six guidelines.Citation30–32 A total of 28 individuals gave informed consent to be recruited into the study. Among these, data from 20 individuals (with grade 3 IDH-mutant tumor or GBM (IDH-wt) or healthy controls) were analyzed further based on tumor grade and IDH mutation criteria.
Sample collection and preparation of single cell suspensions
All individuals with gliomas that undergo surgery at MSMF are given dexamethasone starting with 4 mg four times a day for a day before surgery and post-surgery too. Freshly resected tumor tissue was transported to the laboratory on ice within 1 hour of surgery in cold Roswell Park Memorial Institute 1640 culture medium (RPMI, Gibco, USA) media containing 1% antibiotics (Pen-strep, Thermo Fisher Scientific, USA). Samples were washed three times with cold phosphate-buffered saline (PBS) with antibiotics and minced using a scalpel in a 60-mm petri dish. The tissue fragments were digested in 30ug/ml accutase (Gibco) in 5 ml of RPMI for 10–15 minutes at 37°C and dissociated by pipetting with a 1 ml-pipette 2–3 times. Dissociation was stopped by adding 10 ml of RPMI, and the cell suspension was passed through 70-μm cell strainers (BD Falcon, USA). The single-cell suspension was washed twice with cold PBS, centrifuged, and used for fixable live-dead staining, as described below. About 3 ml of peripheral venous blood drawn from consented individuals was spun down at 500 g for 5 minutes and plasma was saved. The cell pellets were subjected to RBC lysis using ACK lysis buffer (0.15 M Ammonium Chloride, 10 mM Potassium Bicarbonate, 0.1 mM EDTA) for 10 minutes at room temperature in 1:10 (blood:lysis buffer) ratio by volume. Lysis was quenched using PBS solution containing 4 mM EDTA, and the solution was centrifuged at 400 g for 10 minutes at 4 degree. Supernatant was discarded and the pelleted white blood cells were suspended in PBS.
Blood and tumor cell suspensions were labeled with fixable live-dead stain (0.3 µl dye/100 µl volume of 1 million cell suspension) for 20 minutes at room temperature. Staining was quenched using 2 ml PBS containing 1% bovine albumin and 4 mM EDTA (flow cytometry buffer), and cells were centrifuged at 400 g for 4 minutes at 4°C. Cell pellets were fixed using 2% paraformaldehyde (prepared in PBS) while subjecting the tube to pulse-vortex. After 30 minutes, cells were washed and suspended in the flow cytometry buffer. Cell suspensions not stained with fixable live-dead dye were also fixed as described above, and used as controls.
Immunohistochemistry (IHC)
IHC was performed on formalin-fixed paraffin-embedded 3-micron tissue sections for selected proteins. Deparaffinization was carried out in xylene solution followed by rehydration with a series of graded alcohol, and antigen retrieval in Tris-EDTA buffer, pH 9.0. Endogenous tissue peroxidases were blocked with 3% hydrogen peroxide, and nonspecific binding was blocked with 10% bovine serum albumin (BSA) in PBS with 0.1% Triton X-100 (PBST, pH 7.6). The sections were then incubated for 2 h at room temperature with primary antibodies – CD163 (Abcam, ab182422, 1:200), CD14 (Abcam, ab183322, 1:200), MPO (Invitrogen, PA5-16672, 1:500) followed by HRP-conjugated secondary antibody incubation for 1 hour and developed with 3, 3 – diaminobenzidine chromogen (DAB). Sections were counterstained with Mayer’s hematoxylin and mounted. IHC images were acquired and analyzed by a neuropathologist. IHC image analysis is described in supplementary methods.
Immuno-phenotyping using flow cytometry
Cells were stained with a panel of antibodies (all from BD Biosciences, USA) described in Supplementary Table S1. Antibodies were added to fixed cell suspensions (made up of flow cytometry buffer) as per manufacturer’s instructions. Samples were incubated at 4°C for 30 minutes, and washed once to remove unbound antibodies. After washing, the centrifuged pellet was suspended in 300 µl flow cytometry buffer and run through a flow cytometer (BD FACS Celesta, USA). Single color controls were prepared using compensation beads (BD Biosciences) to which appropriate antibodies were added. Fluorescence-minus-one (FMO) controls were prepared using live-dead stained cell suspensions by removing one antibody at a time, and replacing it with its isotype during the antibody staining step. Flow cytometry data was analyzed using FlowJo (FlowJo LLC, USA). Compensation beads (BD Biosciences) were used for compensation in all flow cytometry experiments. A minimum of 20,000 CD45+ live events were collected from each tumor and blood sample. A minimum threshold of 100 events was used to report percentage positive and MFI values.
Clustering and other analysis
The single-event level flow cytometry data exported through FlowJo was ArcSinh transformed with a cofactor of 150. We used the markers CD14 for monocytic lineage and CD15 for granulocytic lineage as well as the CD45 to classify cells into subsets. For each of the markers, we categorized the values as absent, low (-), medium (+), and high (++) based on their frequency distribution plots. This resulted into 64 subsets and allowed us to merge data from multiple flow panels. For each subset, MFI was calculated and subsets were merged with similar marker profiles resulting in five subsets. Welch’s two samples t-tests were used to calculate the difference between median intensities for all markers across No Tumor, Grade 3 IDHmutant and GBM samples in blood and tumor tissues.
Neutrophil proteomics
Three ml of peripheral venous blood was drawn from individuals with informed consent in EDTA-coated vacutainers at two different time intervals – before the administration of dexamethasone (before surgery) and after the administration of dexamethasone (during surgery). The blood samples were stored at 4°C for less than an hour before processing. Ficoll – PaqueTM PLUS (GE Healthcare) was used to allow density gradient centrifugation at 1:1.5 (blood: ficoll) ratio by volume for the extraction of neutrophils. The bottom, granulocyte and erythrocyte layer, from the ficoll separation was then subjected to RBC lysis using freshly prepared RBC lysis buffer (0.15 M Ammonium Chloride, 10 mM Potassium Biocarbonate, 0.1 mM EDTA) for 10–15 minutes at room temperature. The lysis was quenched using PBS (Gibco) solution (twice the volume), and the solution was centrifuged at 400 RCF for 5 minutes at 4°C. The supernatant was discarded and the pelleted white blood cells were washed in PBS twice before storing it at −20°C until further use.
Proteins were extracted from neutrophils of each individual patient using SDS lysis buffer (2.5% SDS in 50 mM TEABC (Sigma) with protease inhibitor (Sigma). The protein amount was quantified using bicinchoninic acid BCA quantitative assay (Takara Bio). Equal amounts of protein from the three pre and during surgery samples were taken and subjected to reduction with 5 mM DTT followed by alkylation with 10 mM iodoacetamide. The samples were precipitated with acetone followed by trypsin digestion at 37 C overnight. Post digestion, the peptide amount was estimated using a quantitative colorimetric peptide estimation assay (Thermo Fisher, USA). An equal amount of peptide digests was taken from each sample for quantitative proteomic analysis using iTRAQ labeling (ThermoFisher). Briefly, peptide digests from six samples (three patients’ pre-surgery and during-surgery) were labeled with 115, 116, 117, 118, 119 and 121 labels, respectively, according to manufacturer’s instructions. Post labeling, the samples were pooled, and fractionated using a high pH reverse phase LC with Agilent 1200 nano-flow LC system. In total six fractions were obtained. Post fractionation, the peptides were dried and desalted using C18 Stage Tips. Each fraction was split into two and LC-MS/MS analysis was performed in duplicates (R1 and R2) using an Orbitrap Fusion Tribrid mass spectrometer. The raw data obtained from MS/MS analysis was analyzed using Proteome Discoverer (v 2.1; ThermoFisher) suite for protein identification and quantitation. Data analysis was carried out using R software package.
Analysis of proteomics data
The mass spectrometry raw files from each fraction run in duplicates (R1 and R2) were searched against RefSeq 89 using Proteome Discoverer (v 2.1; ThermoFisher). Carbamidomethylation of cysteine residues, iTRAQ-8 plex on lysine and peptide N-termini were chosen as static modifications, while oxidation of methionine, acetylation of protein N-termini were chosen as dynamic modifications. Precursor ion tolerance and fragment ion tolerance were set as 10 ppm and 0.05 Da, respectively. The number of missed cleavages allowed was 1% and 1% FDR cutoff applied at protein level. Normalized abundances of each sample were obtained based on the total peptide amount, which is the factor of sum of the abundances of each of the sample and the maximum sum in all samples. After normalization, scaling was performed so that the average of all channels is 100. The common proteins of R1 and R2 experiments were selected and log2 grouped abundances of R1 and R2 were used for further analysis including PCA and differential expression analysis between post and pre-treated samples. Fold change of 1.5 and FDR paired t test p-value of 0.05 were chosen as cut-offs for selecting differentially expressed proteins between these two groups. Prcomp function in stats (v3.6.2) package in R was used for PCA analysis.
Statistical analysis
Statistical analysis was performed using either Graphpad Prism version 5 or ‘R’. Student’s t test, one-ANOVA or two-way ANOVA, chi-square, or Wilcoxon tests were used for statistical comparisons.
Results
Clinical characteristics
Individuals undergoing craniotomy at the Mazumdar-Shaw Medical Center were recruited into this study, following informed consent. Among the individuals recruited into the study, data from 20 were taken for further analysis as they were either diagnosed with grade 3 IDH1 mutant glioma (six individuals), or with Glioblastoma (11 individuals), and three were healthy volunteers (). Clinical data of individuals with GBM and grade 3 glioma along with tumor staging is provided in Supplementary Table 2. Among the individuals with GBM, and grade 3 gliomas, an underrepresentation of females is observed, which may be attributed to the relatively small number of samples being analyzed in this study.
Table 1. Clinical characteristics of individuals recruited into this study. Tumor grade refers to the WHO glioma grade, and IDH refers to the isocitrate dehydrogenase mutation, both of which were determined by a pathologist. * – data from this individual were not included in further analysis
Frequencies of immune cells in tumor and blood
To profile the tumor microenvironment, a portion of the resected tumor was used for immunohistochemistry (IHC) based identification of cell types, and another portion was used to generate single-cell suspensions to be analyzed by flow cytometry. IHC was performed on five grade 3 and five GBM samples, to specifically identify myeloperoxidase (MPO) and CD14 expressing cells. MPO was used as a marker to identify granulocytes, and CD14 as a marker for monocytes. IHC based analysis shows an increased number of MPO () and CD14 () expressing cells in GBM compared to grade 3 IDHmutant gliomas, which potentially correlates with suggestions of increases in immune cell infiltration with increasing glioma grade.Citation7
Figure 1. Immune cell frequencies
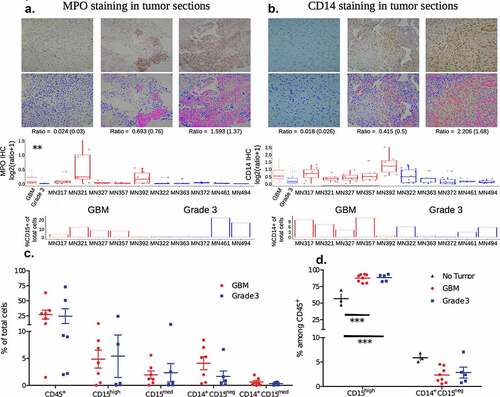
Separately, live single-cell suspensions of resected tumors were obtained from six and seven individuals with grade 3 gliomas and GBM (tumor tissue was not available from one GBM individual for immuno-phenotyping), respectively, for flow cytometry-based analysis. Single-cell suspensions were stained with antibodies that enabled the identification of total immune cells (determined as CD45 expressing live cells by flow cytometry), neutrophils (CD45+ CD15high), other granulocytes (CD45+ CD15med), and two different monocyte subsets (CD14+ CD15neg and CD14+ CD15med) were quantified. Supplementary Figure 1a describes the gating strategies used to identify different immune subsets. Neutrophils and other granulocytes were distinguished by determining the expression of CD66b (present on neutrophils and absent on other granulocytes). Flow cytometry-based analysis of percentages of immune cells revealed: (i) intra-tumor variability in immune infiltration when directly compared with histology sections (bottom panels of , where all CD15 and CD14 expressing cells are grouped together as granulocytes and monocytes, respectively); and (ii) inter-tumor variability in the frequencies of various immune cell subsets (). Nevertheless, the combination of histology and flow cytometry data are suggestive of an increased presence of myeloid cell subsets in the tumor microenvironment of GBM compared to grade 3 IDHmutant gliomas.
Peripheral venous blood was also collected from five of the six individuals with grade 3 gliomas and all seven of the individuals with GBM at the time of surgery (matching blood and tumor samples). In addition, peripheral venous blood was collected from one additional individual with GBM and three healthy (no tumor) individuals to serve as controls. In blood, unlike tumors, a single monocyte subset was observed (CD14+ CD15neg), and all the CD15 expressing cells were labeled as neutrophils, as cells expressing medium to low levels of CD15 were not observed (Supplementary Figure 2). Neutrophils were found to be present in significantly higher percentages in both GBM and grade 3 gliomas when compared to healthy controls (), which is likely due to the administration of steroids (dexamethasone in this case, which lowers lymphocyte numbers) prior to surgery.
Phenotyping immune cells in tumor and blood
To further characterize the myeloid cell subsets, single-cell suspensions of the tumor lysate and blood were analyzed via flow cytometry using four antibody panels that focused on neutrophil and monocyte/macrophage activation markers, as well as markers for MDSC (Supplementary Table S1). This analysis focused on determining the percentage of cells expressing a specific protein (as percentage positive cells) or measuring the extent of protein expression in a group of cells to report as median fluorescence intensity (MFI). Percentage positive cells were measured when a multimodal distribution of protein expression levels in cells was observed, like in the case of certain monocyte proteins (for example, CD163). Among granulocytes and some surface proteins of monocytes, the expression level of proteins on cells was unimodal, and hence MFI was quantified as a measure for expression. Among the cells from tumors, most proteins that we measured (CD11b, CD15, CD33, CD54, CD62L, CD63, CD282, and HLA-DR) did not show statistically different expression levels across tumor grades. A few surface receptors did have significantly different expressions, such as CD16 expressed at higher levels on neutrophils, and CD284 expressed at higher levels on one of the monocyte subsets of grade 3 tumors compared to those of GBM (Supplementary Figure S3). Among cells from blood, neutrophils from individuals with tumors showed significantly lower expression of a few activation markers (CD11b, CD16, CD54, and CD63) and L-selectin (CD62L), when compared to healthy controls (Supplementary Figure 4). However, these differences were not significant between the two grades of tumor. Similarly, a few surface proteins (CD54, CD282, and HLA-DR) were expressed at lower levels on monocytes from the blood of individuals with tumors, when compared to healthy controls (Supplementary Figure 5).
To reveal possible features in our data that traditional manual analysis may have missed, we performed a hierarchical clustering analysis of the flow cytometry single-event level data. Through this analysis, we identified four types of cells in tumor and blood with positive expression of at least one of the monocytic (CD14) or granulocytic (CD15) markers: (i) Monocytes/macrophages (CD14++ CD15−); (ii) Neutrophils_CD14medium (CD15++CD14med); (iii) Granulocytic (CD15+/++ CD14−); and (iv) Dual_high (CD15++ CD14++). All the remaining cells are labeled as “Other” ().
Figure 2. Clustering analysis of flow cytometry data
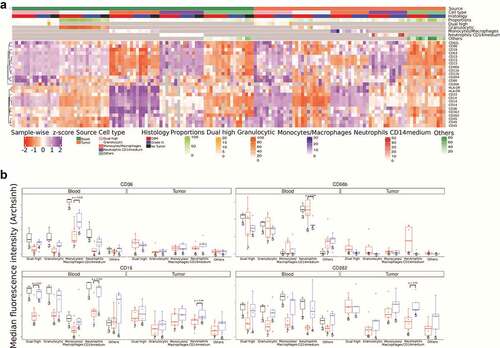
For the first population (monocytes/macrophages – CD14++ CD15−), we observe that these cells show prominent expression of HLA-DR, CD33, CD163, CD36, and CD282 when present in blood. Specifically looking at CD36 expression among these cells in the blood, we observe lower expression among individuals with GBM compared to grade 3 IDHmutant gliomas (). All three healthy controls show higher expression of CD36 compared to gliomas. Additionally, the monocytes/macrophages infiltrated in tumor tissue express significantly lower levels of CD36 and increased levels of HLA-DR compared to monocytes in peripheral blood. The second population (neutrophils_CD14medium – CD15++CD14med) are found in small numbers in the blood; however, in the tumor these cells are a significant fraction of the immune cells (). We observe a trend where these cells from GBM patients express higher levels of CD66b but lower levels of CD16 and CD282 (). The third population (granulocytic) have a surface protein expression pattern similar to neutrophils_CD14medium except they express lower levels of CD62L whereas in tumor tissue these cells lack all other marker expressions. Anywhere between 5% and 50% of CD45+ cells in glioma tissues are granulocytic, which is in line with a previous report.Citation33 These glioma infiltrating cells have the lowest levels of HLA-DR expression. Finally, the fourth population (dual_high – CD15++ CD14++) of cells are rare in the blood but a larger fraction of tumor-infiltrating immune cells display this phenotype. In the tumor tissue, these CD15 and CD14 double positive cells express markers for both neutrophils as well as macrophages (HLA-DR, CD16, CD163, CD284, CD282, CD33, CD36, CD62L, CD63, CD66b, CD80, and CD86). We see that the dual_high cells from GBM patients’ blood show reduced CD16 expression (). The results largely matched the traditional manual analysis with some additional insight on the double positive population. One possible explanation for the differences among neutrophils in the blood of those with tumors compared to healthy individuals could be the steroidal (dexamethasone) treatment given to the individuals prior to surgery.
Proteomics of neutrophils
To determine if the dexamethasone administration prior to surgery causes any significant changes in the neutrophil proteomic profile, we performed total proteomic analysis of neutrophils from three GBM patients with matched samples collected before surgery (pre) and during surgery (post) along with one sample from a healthy individual. A total of 1810 proteins were identified from 9620 peptides and 34512 PSMs with an FDR cutoff of 1% at the protein level. Out of a total of 1257 proteins were commonly detected in all samples. The top 10 enriched GO biological processes are related to neutrophils, granulocytes and leukocytes (Supplementary Figure 6). We were able to detect MPO, CD11b, CD45, CD66b, CD63, CD16, CD62L, CD33, and CD14 among the markers investigated in this study. We did not see any significant differences in their intensity levels between pre and post samples (). Paired Student’s t-test analysis also did not reveal any significant differences in any of the proteins detected. The lack of differences is further highlighted in the PCA plot where individual pre- and post-surgery samples cluster together, but all the pre- or all the post samples do not cluster together ().
Figure 3. Neutrophil proteomics
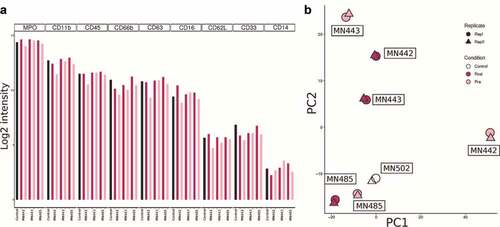
Together, these data show that there are significant differences in the immuno-phenotype of myeloid cells between individuals with gliomas and healthy individuals, which may not be entirely attributed to the use of steroids.
CD163 expression and suppressor cells
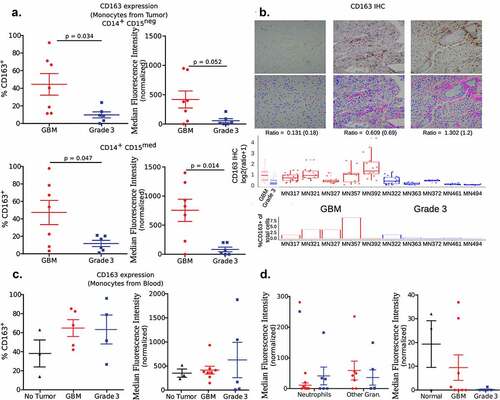
Notably, one of the surface proteins, CD163, showed a distinctly different pattern of expression between the two tumor groups. CD163 expression levels on both subsets of monocytes, measured as percentage positive cells and MFI, was significantly higher in GBM when compared to grade 3 tumors (). These differences were observed in IHC sections too, which on quantification showed a higher ratio of CD163 expressing cells among all other cells in GBM when compared to grade 3 tumors (). Analysis of The Cancer Genome Atlas (TCGA) and the Chinese Glioma Genome Atlas (CGGA) data also validates our finding that CD163 expression is higher in GBM (IDH-wild-type) compared to grade 3 IDH-mutant (Supplementary Figure 7). Markedly, the expression level of CD163 on monocytes present in the blood was not significantly different among the two grades of tumor and healthy controls (). Further, expression levels were not significantly different in the granulocyte subsets in tumor and blood (), which may not be surprising as granulocytes are not known to express CD163.
Figure 4. Expression of CD163
In addition, myeloid-derived suppressor cells (MDSCs) have been reported to be present in increased numbers in the blood,Citation12–15 and are enriched in the tumor microenvironment of individuals with GBM.Citation5,Citation16,Citation17 Utilizing the flow cytometry gating strategy described by Alban et. al.Citation17 in a subset of our clinical samples (four individuals with GBM and grade 3 IDHmutant gliomas, and three healthy controls), MDSCs were identified as CD33 and CD11b expressing cells, but not expressing HLA-DR among the CD45+ immune cells (Supplementary Figure 8). We did not observe any significant differences in the frequencies of MDSC in the blood of individuals with tumors when compared to healthy controls (Supplementary Figure 9A). Partitioning the MDSC into granulocytic-MDSC (CD15-expressing) and monocytic-MDSC (CD14-expressing) also did not reveal any differences. Further, the overall MDSC frequency in the tumors was similar between the two grades of tumors. However, granulocytic-MDSC were enriched in grade 3 IDHmutant gliomas (statistically significant), while monocytic-MDSC were enriched in GBM (not statistically significant) when compared to each other (Supplementary Figure 9B). A point to note is that data on MDSC subpopulations (granulocytic and monocytic) were available for three of the four individuals (for tumors of both grades), as the number of events in one individual from each tumor grade was below our threshold for analysis.
Correlation of blood and tumor Immuno-phenotype
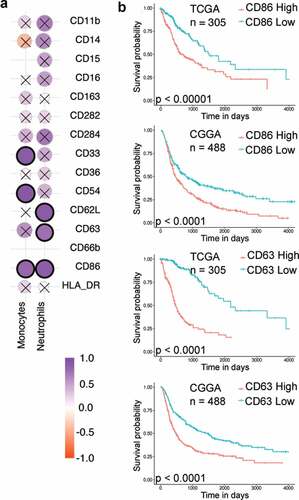
One possible outcome of such phenotypic analysis is the identification of markers in the blood that might help predict the grade of the tumor or the expected progression of the disease. To determine if such biomarkers are present, the phenotype of immune cells in the blood was compared to the phenotype of the same subset of immune cells present in the tumor, for each individual. Such a comparison was first performed through a correlation analysis of the expression levels (measured as MFIs) of various surface proteins among traditional monocytes (CD14+CD15−) and neutrophils (CD15high). Among monocytes, CD33, CD54, and CD86 showed a positive correlation, whereas, among neutrophils CD62L, CD63 and CD86 showed a positive correlation (). Analysis of TCGA and CGGA data reveals that the high expression of two markers, CD63 and CD86, in gliomas is associated with a poor prognosis (, Supplementary File 2). Based on our data it might be possible to utilize CD86 expression on both blood neutrophils and monocytes, as well as CD63 expression on blood neutrophils as possible biomarkers for prognosis. Additionally, we observed that the correlation of CD163 expression between blood and tumor was extremely poor, suggesting that their expression levels in the blood are unlikely to represent the expression levels in the tumor.
Figure 5. Correlation analysis
Discussion
There is a growing appreciation for myeloid cells in tumor microenvironments, especially those that are alternately activated or have suppressive functions. This is especially true for brain tumors, where cells of myeloid origin make up a large percentage of cells in the tumor.Citation34–38 Characterizing the number, phenotype and function of these myeloid cells has the potential to enhance current treatment strategies, or help develop new therapeutic approaches. Through the data presented here, we add to the current knowledge of myeloid cell phenotypes in grade 3 IDH-mutant and Glioblastoma IDH-wt.
First, we report that about one-fourth of the glioma cell count comprises of immune cells identified based on the expression of CD45, and about half of these cells could be classified as granulocytes or monocytes based on the expression of CD15 (or MPO in histology) and CD14, respectively. These numbers are lower than what has been reported historicallyCitation39,Citation40 (reviewed inCitation34,Citation35), but higher than a recent report.Citation41 The differences in overall numbers could be due to heterogeneity in the tumor or possibly due to population level variations. With respect to the number of neutrophils, Liang et alCitation26 have demonstrated that neutrophil infiltration of gliomas increases with the grade, and that these cells may be responsible for disease progression and therapy resistance. Our data also shows high neutrophil infiltration in high-grade gliomas, but differences between GBM and grade 3 IDH-mutant are not observed. The latter may be due to the differences in the classification of the gliomas or due to the methods used to arrive at the percentages and numbers. We also observe that neutrophils in both the tumor tissue and the blood of individuals with glioma are heterogeneous, as determined by their expression of various cell surface proteins. Neutrophil heterogeneity is now well-recognized,Citation42 although they remain poorly characterized. In the context of tumors, Singhal et al.Citation43 had identified a unique sub-population of antigen-presenting cell-like neutrophils in lung cancers. Our analysis also reveals a subpopulation of neutrophils that express antigen-presenting cell receptors like CD86.
Additionally, in the glioma microenvironment, we observe previously unidentified myeloid cell populations. The first one is an additional monocyte subpopulation that we characterize as CD14+ CD15med through analysis of flow cytometry data. Their overall proportions are rather low, and they phenotypically resemble the traditional monocytes (CD14+ CD15neg) present in the tumor microenvironment. This specific cell subset is not observed in the blood, and hence we speculate that they arise from traditional monocytes in the tumor microenvironment. The second is the identification of heterogeneous neutrophils, with a specific CD14 and CD15 double positive population that are enriched only in gliomas. The roles of these neutrophil sub-populations, and their effect on glioma progression remains to be studied.
Phenotyping of the monocyte subsets in the tumor specifically revealed an enrichment of CD163 expressing cells in GBM compared to grade 3 gliomas. However, we did not observe any differences in the CD163 expression among the monocytes present in the blood of the same individuals. In fact, we did not observe a higher proportion of CD163 expressing monocytes in the blood of individuals with glioma when compared to healthy controls too, which appears to be contrary to previous reports by Heimberger and colleaguesCitation19 and Agrewala and colleagues.Citation21 However, it is important to note the following differences: the former study compared the expression levels of CD163 at the RNA level, while the latter study used a different gating strategy (CD11b vs. CD14 used by us). Additionally, if we specifically look at the data related to the percentage expression of CD163 among monocytes in blood, we observe an increase (not statistically significant) in both tumor grades when compared to healthy controls. Importantly, we did not observe a correlation between CD163 expression levels in the blood and in the tumor of the same individuals, which might suggest that the tumor microenvironment plays an important role in either recruiting or converting activated monocyte/macrophage populations to CD163 cells (with possible suppressive function).
With regard to MDSC frequencies, we did not observe differences in the blood of individuals with tumors when compared to healthy individuals. This is in stark contrast to a number of previous reports that show increased numbers of these cells in the blood when compared to healthy controls.Citation12–15,Citation17,Citation19 One possible reason for this difference is that our study is underpowered for MDSC analysis, as data have been collected from a relatively low number of individuals (4 in the tumor groups and 3 in healthy controls). Another, and we speculate that the most likely possibility, is that our analysis was performed on whole blood, and not the PBMC fraction. How the use of whole blood instead of the PBMC fraction might impact the MDSC data are unclear, and further studies are necessary to determine the true reason for the differences. However, analysis of MDSC levels in the tumors reveals an interesting pattern of increased monocytic-MDSC in GBM and increased granulocytic-MDSC in grade 3 IDHmutant gliomas, when compared to each other. The increased monocytic-MDSC in GBM tissue is similar to observations by Raychaudhari et al.Citation13 Furthermore, an overall increase in MDSC level, and the presence of granulocytic-MDSC in both GBM and grade 3 IDHmutant gliomas is in line with reports by Dubinski et al.Citation33 and Gieryng and colleagues.Citation44
One of the caveats of our study is that the tumor grade and the presence or absence of IDH mutation are two independent variables. Our data and analysis do not segregate these variables, and hence conclusions drawn may not be defined as grade-specific or IDH-status-specific. Nevertheless, we performed the study to compare grade 3 IDH-mutant and GBM IDH-wild-type as these are the most common high-grade gliomas. Comparisons between them are likely to provide clinicians with new insights on treating the individuals they most commonly see in their clinics. One recent study showed that IDH mutation can influence macrophage numbers and phenotype in GBM,Citation45 but another has shown that MDSCs in IDH-mutant and IDH-wt GBM may not be significantly different.Citation17 More recently, a comprehensive analysis of immune cells in brain tumors focused on comparing GBM (that is IDH-wt) and other lower grade IDH-mutant gliomas, as these are usually the most frequent in the clinic.Citation25 Hence, we chose to address the differences between grade 3 IDH-mutant and GBM (IDH-wt). Another point to note is that our data and analysis are based on a small sample number. We do validate a number of findings presented here using data available in the TCGA and CGGA databases. Nevertheless, the results presented here will need to be verified through a study involving a larger cohort size.
In conclusion, by comparing the phenotype of myeloid cells between blood and tumor of the same individual, we were able to determine if blood phenotype is a representation of the tumor phenotype. To a large extent, CD86 and CD63 were the only cell-surface proteins whose expression levels correlated among myeloid cells in the blood and tumor. Given that higher expression of both these proteins in the tumor is associated with poor prognosis, we propose that the expression levels of these proteins on myeloid cells in the blood may be used as a prognostic marker for the progression of gliomas.
Authorship
JVR collected and analyzed flow cytometry data. RG prepared patient samples, performed IHC experiments, and helped with IHC image analysis. PS performed single-event flow cytometry data analysis. DN assisted with patient sample preparation, IHC experiments, and image analysis. AEJ did neutrophil proteomics. PA assisted with flow cytometry. DS did the IHC image analysis and HPS did the neutrophil proteomics analysis. SP, KPC, KM and SLD performed surgeries and collected patient samples. AL evaluated histology and immunohistochemistry sections. NS and SJ designed the experiments, helped with data analysis and interpretation of the data. All authors contributed towards writing, and have read and approved the final version of the manuscript.
Supplemental Material
Download ()Acknowledgments
Anjali Vijaykumar and Shruthi K.S. for helping in sample preparation for flow cytometry, and Yogesh Pasupathy and Anurag C.N. for sample collection.
Disclosure statement
The authors have no conflict of interest.
Supplementary material
Supplemental data for this article can be accessed on the publisher’s website
Correction Statement
This article has been republished with minor changes. These changes do not impact the academic content of the article.
Additional information
Funding
References
- Taylor OG, Brzozowski JS, Skelding KA. Glioblastoma Multiforme: an overview of emerging therapeutic targets. Front Oncol. 2019:9. doi:10.3389/fonc.2019.00963.
- Darmanis S, Sloan SA, Croote D, Mignardi M, Chernikova S, Samghababi P, Zhang Y, Neff N, Kowarsky M, Caneda C, et al. Single-Cell RNA-Seq analysis of infiltrating neoplastic cells at the migrating front of human glioblastoma. Cell Rep. 2017;21(5):1399–11. doi:10.1016/j.celrep.2017.10.030.
- Jackson CM, Choi J, Lim M. Mechanisms of immunotherapy resistance: lessons from glioblastoma. Nat Immunol. 2019;20(9):1100–1109. doi:10.1038/s41590-019-0433-y.
- Chen J, Li Y, Yu T-S, McKay RM, Burns DK, Kernie SG, Parada LF. A restricted cell population propagates glioblastoma growth after chemotherapy. Nature. 2012;488(7412):522–526. doi:10.1038/nature11287.
- Charoentong P, Finotello F, Angelova M, Mayer C, Efremova M, Rieder D, Hackl H, Trajanoski Z. Pan-cancer immunogenomic analyses reveal genotype-immunophenotype relationships and predictors of response to checkpoint blockade. Cell Rep. 2017;18(1):248–262. doi:10.1016/j.celrep.2016.12.019.
- Schäfer N, Gielen GH, Rauschenbach L, Kebir S, Till A, Reinartz R, Simon M, Niehusmann P, Kleinschnitz C, Herrlinger U, et al. Longitudinal heterogeneity in glioblastoma: moving targets in recurrent versus primary tumors. J Transl Med. 2019;17(1). doi:10.1186/s12967-019-1846-y
- Puchalski RB, Shah N, Miller J, Dalley R, Nomura SR, Yoon J-G, Smith KA, Lankerovich M, Bertagnolli D, Bickley K, et al. An anatomic transcriptional atlas of human glioblastoma. Science. 2018;360(6389):660–663. doi:10.1126/science.aaf2666.
- Zeng J, See AP, Phallen J, Jackson CM, Belcaid Z, Ruzevick J, Durham N, Meyer C, Harris TJ, Albesiano E, et al. Anti-PD-1 blockade and stereotactic radiation produce long-term survival in mice with intracranial gliomas. International Journal of Radiation Oncology*Biology*Physics. 2013;86(2):343–349. doi:10.1016/j.ijrobp.2012.12.025.
- Parney IF, Waldron JS, Parsa AT. Flow cytometry and in vitro analysis of human glioma–associated macrophages. J Neurosurg. 2009;110(3):572–582. doi:10.3171/2008.7.JNS08475.
- Prosniak M, Harshyne LA, Andrews DW, Kenyon LC, Bedelbaeva K, Apanasovich TV, Heber-Katz E, Curtis MT, Cotzia P, Hooper DC. Glioma grade is associated with the accumulation and activity of cells bearing m2 monocyte markers. Clinical Cancer Research. 2013;19(14):3776–3786. doi:10.1158/1078-0432.CCR-12-1940.
- Chae M, Peterson TE, Balgeman A, Chen S, Zhang L, Renner DN, Johnson AJ, Parney IF. Increasing glioma-associated monocytes leads to increased intratumoral and systemic myeloid-derived suppressor cells in a murine model. Neuro-Oncology. 2015;17(7):978–991. doi:10.1093/neuonc/nou343.
- Raychaudhuri B, Rayman P, Ireland J, Ko J, Rini B, Borden EC, Garcia J, Vogelbaum MA, Finke J. Myeloid-derived suppressor cell accumulation and function in patients with newly diagnosed glioblastoma. Neuro-Oncology. 2011;13(6):591–599. doi:10.1093/neuonc/nor042.
- Raychaudhuri B, Rayman P, Huang P, Grabowski M, Hambardzumyan D, Finke JH, Vogelbaum MA. Myeloid derived suppressor cell infiltration of murine and human gliomas is associated with reduction of tumor infiltrating lymphocytes. J Neurooncol. 2015;122(2):293–301. doi:10.1007/s11060-015-1720-6.
- Gielen PR, Schulte BM, Kers-Rebel ED, Verrijp K, Petersen-Baltussen HMJM, ter Laan M, Wesseling P, Adema GJ. Increase in both CD14-Positive and CD15-Positive Myeloid-Derived suppressor cell subpopulations in the blood of patients with glioma but predominance of CD15-Positive Myeloid-Derived suppressor cells in glioma tissue. J Neuropathol Exp Neurol. 2015;74(5):390–400. doi:10.1097/NEN.0000000000000183.
- Gielen PR, Schulte BM, Kers-Rebel ED, Verrijp K, Bossman SAJFH, ter Laan M, Wesseling P, Adema GJ. Elevated levels of polymorphonuclear myeloid-derived suppressor cells in patients with glioblastoma highly express S100A8/9 and arginase and suppress T cell function. Neuro-Oncology. 2016;18(9):1253–1264. doi:10.1093/neuonc/now034.
- Otvos B, Silver DJ, Mulkearns-Hubert EE, Alvarado AG, Turaga SM, Sorensen MD, Rayman P, Flavahan WA, Hale JS, Stoltz K, et al. Cancer Stem Cell-Secreted Macrophage Migration Inhibitory Factor Stimulates Myeloid Derived Suppressor Cell Function and Facilitates Glioblastoma Immune Evasion: CSC-Secreted MIF and MDSCs in GBM. STEM CELLS. 2016;34(8):2026–2039. doi:10.1002/stem.2393.
- Alban TJ, Alvarado AG, Sorensen MD, Bayik D, Volovetz J, Serbinowski E, Mulkearns-Hubert EE, Sinyuk M, Hale JS, Onzi GR, et al. Global immune fingerprinting in glioblastoma patient peripheral blood reveals immune-suppression signatures associated with prognosis. JCI Insight. 2018;3(21). doi:10.1172/jci.insight.122264
- Pereira MB, Barros LRC, Bracco PA, Vigo A, Boroni M, Bonamino MH, Lenz G. Transcriptional characterization of immunological infiltrates and their relation with glioblastoma patients overall survival. OncoImmunology. 2018;7(6):e1431083. doi:10.1080/2162402X.2018.1431083.
- Gabrusiewicz K, Rodriguez B, Wei J, Hashimoto Y, Healy LM, Maiti SN, Thomas G, Zhou S, Wang Q, Elakkad A, et al. Glioblastoma-infiltrated innate immune cells resemble M0 macrophage phenotype. JCI Insight. 2016;1(2):2. doi:10.1172/jci.insight.85841.
- Quail DF, Bowman RL, Akkari L, Quick ML, Schuhmacher AJ, Huse JT, Holland EC, Sutton JC, Joyce JA. The tumor microenvironment underlies acquired resistance to CSF-1R inhibition in gliomas. Science. 2016;352(6288):aad3018–aad3018. doi:10.1126/science.aad3018.
- Vidyarthi A, Agnihotri T, Khan N, Singh S, Tewari MK, Radotra BD, Chatterjee D, Agrewala JN. Predominance of M2 macrophages in gliomas leads to the suppression of local and systemic immunity. Cancer Immunology, Immunotherapy. 2019;68(12):1995–2004. doi:10.1007/s00262-019-02423-8.
- Szulzewsky F, Arora S, de Witte L, Ulas T, Markovic D, Schultze JL, Holland EC, Synowitz M, Wolf SA, Kettenmann H. Human glioblastoma-associated microglia/monocytes express a distinct RNA profile compared to human control and murine samples: human GAMs RNA Sequencing. Glia. 2016;64(8):1416–1436. doi:10.1002/glia.23014.
- Bowman RL, Klemm F, Akkari L, Pyonteck SM, Sevenich L, Quail DF, Dhara S, Simpson K, Gardner EE, Iacobuzio-Donahue CA, et al. Macrophage ontogeny underlies differences in tumor-specific education in brain malignancies. Cell Rep. 2016;17(9):2445–2459. doi:10.1016/j.celrep.2016.10.052.
- Friebel E, Kapolou K, Unger S, Núñez NG, Utz S, Rushing EJ, Regli L, Weller M, Greter M, Tugues S, et al. Single-Cell mapping of human brain cancer reveals tumor-specific instruction of tissue-invading leukocytes. Cell. 2020;181(7):1626–1642.e20. doi:10.1016/j.cell.2020.04.055.
- Klemm F, Maas RR, Bowman RL, Kornete M, Soukup K, Nassiri S, Brouland J-P, Iacobuzio-Donahue CA, Brennan C, Tabar V, et al. Interrogation of the microenvironmental landscape in brain tumors reveals disease-specific alterations of immune cells. Cell. 2020;181(7):1643–1660.e17. doi:10.1016/j.cell.2020.05.007.
- Liang J, Piao Y, Holmes L, Fuller GN, Henry V, Tiao N, de Groot JF. Neutrophils promote the malignant glioma phenotype through S100A4. Clinical Cancer Research. 2014;20(1):187–198. doi:10.1158/1078-0432.CCR-13-1279.
- Wang Q, Hu B, Hu X, Kim H, Squatrito M, Scarpace L, deCarvalho AC, Lyu S, Li P, Li Y, et al. Tumor evolution of glioma-intrinsic gene expression subtypes associates with immunological changes in the microenvironment. Cancer Cell. 2017;32(1):42–56.e6. doi:10.1016/j.ccell.2017.06.003.
- Chai E, Zhang L, Li C. LOX-1+ PMN-MDSC enhances immune suppression which promotes glioblastoma multiforme progression. Cancer Manag Res. 2019;11:7307–7315. doi:10.2147/CMAR.S210545.
- Jacobs JFM, Idema AJ, Bol KF, Nierkens S, Grauer OM, Wesseling P, Grotenhuis JA, Hoogerbrugge PM, De Vries IJM, Adema GJ. Regulatory T cells and the PD-L1/PD-1 pathway mediate immune suppression in malignant human brain tumors. Neuro-Oncology. 2009;11(4):394–402. doi:10.1215/15228517-2008-104.
- Shirahata M, Ono T, Stichel D, Schrimpf D, Reuss DE, Sahm F, Koelsche C, Wefers A, Reinhardt A, Huang K, et al. Novel, improved grading system(s) for IDH-mutant astrocytic gliomas. Acta Neuropathol. 2018;136(1):153–166. doi:10.1007/s00401-018-1849-4.
- Brat DJ, Aldape K, Colman H, Figrarella-Branger D, Fuller GN, Giannini C, Holland EC, Jenkins RB, Kleinschmidt-DeMasters B, Komori T, et al. cIMPACT-NOW update 5: recommended grading criteria and terminologies for IDH-mutant astrocytomas. Acta Neuropathol. 2020;139(3):603–608. doi:10.1007/s00401-020-02127-9.
- Louis DN, Wesseling P, Aldape K, Brat DJ, Capper D, Cree IA, Eberhart C, Figarella‐Branger D, Fouladi M, Fuller GN, et al. cIMPACT‐NOW update 6: new entity and diagnostic principle recommendations of the cIMPACT‐Utrecht meeting on future CNS tumor classification and grading. Brain Pathol. 2020;30(4):844–856. doi:10.1111/bpa.12832.
- Dubinski D, Wölfer J, Hasselblatt M, Schneider-Hohendorf T, Bogdahn U, Stummer W, Wiendl H, Grauer OM. CD4+ T effector memory cell dysfunction is associated with the accumulation of granulocytic myeloid-derived suppressor cells in glioblastoma patients. Neuro Oncol. 2016;18(6):807–818. doi:10.1093/neuonc/nov280.
- Graeber MB, Scheithauer BW, Kreutzberg GW. Microglia in brain tumors. Glia. 2002;40(2):252–259. doi:10.1002/glia.10147.
- Hambardzumyan D, Gutmann DH, Kettenmann H. The role of microglia and macrophages in glioma maintenance and progression. Nat Neurosci. 2016;19(1):20–27. doi:10.1038/nn.4185.
- Quail DF, Joyce JA. The microenvironmental landscape of brain tumors. Cancer Cell. 2017;31(3):326–341. doi:10.1016/j.ccell.2017.02.009.
- Locarno CV, Simonelli M, Carenza C, Capucetti A, Stanzani E, Lorenzi E, Persico P, Della Bella S, Passoni L, Mavilio D, et al. Role of myeloid cells in the immunosuppressive microenvironment in gliomas. Immunobiology. 2020;225(1):151853. doi:10.1016/j.imbio.2019.10.002.
- gChang Y-Z, Li G-Z, Pang B, Zhang K-N, Zhang X-H, Wang Y-Z, Jiang Z, Chai R-C. Transcriptional CHaracteristics of IDH-Wild type glioma subgroups highlight the biological processes underlying heterogeneity of IDH-Wild Type WHO Grade IV Gliomas. Front Cell Dev Biol. 2020;8:580464. doi:10.3389/fcell.2020.580464.
- Morantz RA, Wood GW, Foster M, Clark M, Gollahon K. Macrophages in experimental and human brain tumors. J Neurosurg. 1979;50(3):305–311. doi:10.3171/jns.1979.50.3.0305.
- Rossi ML, Hughes JT, Esiri MM, Coakham HB, Brownell DB. Immunohistological study of mononuclear cell infiltrate in malignant gliomas. Acta Neuropathol. 1987;74(3):269–277. doi:10.1007/BF00688191.
- Kim AR, Choi KS, Kim M-S, Kim K-M, Kang H, Kim S, Chowdhury T, Yu HJ, Lee CE, Lee JH et al. Absolute quantification of tumor-infiltrating immune cells in high-grade glioma identifies prognostic and radiomics values. Cancer Immunol Immunother. 2021 Jan 8;70(7):1995–2008. doi:10.1007/s00262-020-02836-w.
- Nicolás-Ávila JÁ, Adrover JM, Hidalgo A. Neutrophils in homeostasis, immunity, and cancer. Immunity. 2017;46(1):15–28. doi:10.1016/j.immuni.2016.12.012.
- Singhal S, Bhojnagarwala PS, O’Brien S, Moon EK, Garfall AL, Rao AS, Quatromoni JG, Stephen TL, Litzky L, Deshpande C, et al. Origin and role of a subset of tumor-associated neutrophils with antigen-presenting cell features in Early-Stage human lung cancer. Cancer Cell. 2016;30(1):120–135. doi:10.1016/j.ccell.2016.06.001.
- Gieryng A, Kaminska B. Myeloid-derived suppressor cells in gliomas. wo. 2016;5:345–351. doi:10.5114/wo.2016.64592.
- Poon CC, Gordon PMK, Liu K, Yang R, Sarkar S, Mirzaei R, Ahmad ST, Hughes ML, Yong VW, Kelly JJP. Differential microglia and macrophage profiles in human IDH-mutant and -wild type glioblastoma. Oncotarget. 2019;10(33):3129–3143. doi:10.18632/oncotarget.26863.