
ABSTRACT
Emerging immunotherapies quest for better patient stratification in cancer treatment decisions. Moderate response rates of PD-1 inhibition in gastric and esophagogastric junction cancers urge for meaningful human model systems that allow for investigating immune responses ex vivo. Here, the standardized patient-derived tissue culture (PDTC) model was applied to investigate tumor response to the PD-1 inhibitor Nivolumab and the CD3/CD28 t-lymphocyte activator ImmunoCultTM. Resident t-lymphocytes, tumor proliferation and apoptosis, as well as bulk gene expression data were analyzed after 72 h of PD-1 inhibition either as monotherapy or combined with Oxaliplatin or ImmunoCultTM. Individual responses to PD-1 inhibition were found ex vivo and combination with chemotherapy or t-lymphocyte activation led to enhanced antitumoral effects in PDTCs. T-lymphocyte activation as well as the addition of pre-cultured peripheral blood mononuclear cells improved PDTC for studying t-lymphocyte and tumor cell communication. These data support the potential of PDTC to investigate immunotherapy ex vivo in gastric and esophagogastric junction cancer.
Introduction
Gastric cancer (GC) and esophagogastric junction cancer (EGJC) are highly aggressive and heterogeneous tumors.Citation1,Citation2 Despite ongoing progress in new treatment concepts, GC and EGJC still have a poor prognosisCitation3 and clinical response to standard chemotherapy regimens is unpredictable.Citation4 In the last decade, targeted treatment strategies (e.g., Her2 blockade or VEGFR inhibition) and immune checkpoint inhibitors (e.g., PD-1/PD-L1 blockade) have complemented chemotherapy.Citation5 Immune checkpoint molecules, expressed on immune and cancer cells suppress the immune response and favor tumor progression.Citation6 In GC and EGJC, anti PD-1 monotherapies display moderate efficiency.Citation7,Citation8 Combined treatment of immune checkpoint inhibition and chemotherapy are currently investigated in several clinical trials.Citation9–11 Still, with the rise of novel therapeutic choices, individual patient stratification becomes more important. Predictive biomarkers in GC and EGJC are still limited.Citation12,Citation13 Microsatellite instability, PD-L1 expression, tumor mutational burden, high amount of tumor infiltrating lymphocytes and specific mRNA expression profiles (e.g., IFNg-related signature) can indicate potential benefit of immune checkpoint inhibition.Citation14,Citation15 Despite these biomarkers, the overall response to checkpoint inhibition remains limited and individual response is not efficiently predictable.
Basic cell culture and immunocompromised mouse models depict established models for examination of tumor biology and development of novel treatments with limitations in restricted complexity and species differences.Citation16,Citation17 Therefore, translation from bench to bedside often fails as the majority of drugs selected by preclinical testing are not effective in patients.Citation18,Citation19 The important role of the tumor microenvironment and immune targets are recognized and urge for more complex approaches to investigate tumor cells in a clinical relevant model system. For enhanced understanding of treatment mechanisms in immune checkpoint blockade and more precise patient stratification, human tumor models, providing enhanced representation of the biological complexity of cancer and the tumor microenvironment, are needed.
Patient-derived tissue cultures (PDTC) were successfully established for several tumor entities and preserve intra- and intertumoral heterogeneity as well as individual tumor microenvironment (TME) for several days ex vivo.Citation20–24 Besides, PDTC provide an unique ex vivo system to investigate treatment with chemotherapy, radiation or molecularly targeted therapies in individual patients.Citation20–22,Citation25–30 Therefore, in this study, we analyzed the preservation and functionality of the resident t-lymphocyte population and further investigated the effect of different immune modulating drugs in PDTC of GC and EGJC ex vivo.
Methods
Specimens
Patient-derived tumor specimens were received from clinical departments of the University Hospital Leipzig and two academic hospitals in Braunschweig and Leipzig. In total, material from 15 patients with GC and EGJC was included in this study and used for qualitative and quantitative analyses. Patient’s characteristics are shown in Supplemental Table 1. This study was approved by the ethics committee of the Medical Faculty, University of Leipzig. All patients had given their informed written consent.
Preparation of tumor tissue cultures
PDTC were processed immediately after surgical resection and pathological assessment. The preparation was performed as previously described.Citation28 In brief, tumor specimen were cut into 350 µm slices with a tissue chopper (McIlwain TC752; Campden Instruments, Leicestershire, England). Afterward the size of the slices was standardized by a coring tool (kai Europe, Solingen, Germany) into slices of 3 mm in diameter. Then, tumor slices were cultivated on 6-well-plates on 0.4 µm PFTE membrane inserts (Millipore Corporation, Billerica, MA, USA) under standard conditions (5% CO2, 37°C). Baseline tissue was fixed with 4% PFA after preparation and cultivated tissue was fixed with 4% PFA after 78–96 h of cultivation.
Experimental setup
Slices were cultured 6–24 h in culture medium, which was composed of RPMI-1640 (Gibco, Life Technologies, Paisly, UK), 10% fetal bovine serum (fetal bovine serum (FBS), Gibco), 1% amphotericin B (Carl Roth, Karlsruhe, Germany), 1% penicillin/streptomycin (Gibco) and 1% L-glutamine (Gibco). Then, tumor slices were treated with Nivolumab (3 µg/ml and 10 µg/ml, Bristol Myers Squibb, New York, NY, USA), ImmunoCultTM (CD3/CD28 t-cell activator, 25 µl/ml, Stemcell Technologies, Vancouver, BC, Canada), Oxaliplatin (20 µmol/l and 100 µmol/l, Sanofi-Aventis, Paris, France), Oxaliplatin (20 µmol/l) plus Nivolumab (3 µg/ml) and ImmunoCultTM (25 µl/ml) plus Nivolumab (3 µg/ml) for 72 h. Media were changed after 6–24 h, after 24 h and at 72 h.
Besides using our standard established culture medium, different compositions of media were tested. We have used RPMI-1640 (Gibco), Hibernate A (Gibco) and X–Vivo (Lonza, Basel, Switzerland) supplemented with 10% FBS (Gibco), 1% amphotericin B (Carl Roth), 1% penicillin/streptomycin (Gibco), 1% L-glutamine (Gibco) and 1% insulin, transferrin, selenium (insulin, transferrin, selenium [ITS]; Gibco) in various combinations (Supplemental Table 2).
Staining procedure
Slices were embedded in paraffin and cut into 5 mm sections. After antigen retrieval and blocking with normal goat serum (Jackson ImmunoResearch, Ely, Cambridgeshire, UK) primary antibodies, diluted in 0.5% bovine serum albumin (Carl Roth), were applied overnight at 4°C. Following antibodies were used: AE1/3 (BioGenex, Fremont, CA, USA, mouse, 1:100), cPARP (abcam, Cambridge, UK, rabbit, 1:100), Ki67 (DCS, Hamburg, Germany, rabbit, 1:200), CD3 (Bio-Rad laboratories, Hercules, CA, USA, rat, 1:200), CD8a (Cell Signaling Technology, Danvers, MA, USA, mouse, 1:100) and FoxP3 (Invitrogen, mouse, 1:100). Then, sections were washed with 0,3% PBS/Triton and secondary antibodies were added for 1 h at room temperature. Tissue stained with diaminobenzidine (DAB, Sigma Aldrich) and counterstained with hematoxylin. The following secondary antibodies were used: biotinylated goat anti rat (Vector laboratories, Burlingame, CA, USA, 1:100) and biotinylated goat anti-mouse (Sigma Aldrich, 1:100) diluted in 0,3% phosphate buffered saline/TritonX. For staining of FoxP3 0,5% tris buffered saline/Tween. Following secondary antibodies were used for immunofluorescence staining: goat anti rabbit 568 (AlexaFluor, Invitrogen; Eugene, OR, USA, 1:500) and goat anti mouse (AlexaFluor, Invitrogen, Eugene, OR, USA, 1:500). Nuclei were stained with Hoechst 33342 (Sigma-Aldrich, St.Louis, MO, USA, 1:10.000).
Peripheral mononuclear blood cells (PBMC) isolation and cultivation
PBMCs were isolated from EDTA stabilized patient’s blood 5 days before surgery took place. PBMCs were isolated with LymphoprepTM density gradient medium (15 ml; Stemcell Technologies) according to manufacturer’s protocol. PBMCs were cultured in a 48 well plate (2x10⁶ cells per well, 200 µl/well) for 5 days in t-cell expansion medium (ImmunCultTM-; Stemcell Technologies) supplemented with 1% penicillin/streptomycin and 1% L-glutamine. Besides, one part of PBMCs were pre-treated with ImmunoCultTM (25 µl/ml) for 3 days. Each cultured slice was treated with 500.000 PBMCs after 2 h of cultivation, applied within a polypropylene ring around the slice for 30 min. Then slices were treated as described above with Nivolumab over 72 h.
mRNA expression analysis with Nanostring nCounter platform
RNA was isolated from formalin-fixed paraffin-embedded (FFPE) tissue sections. A total of 10–15 FFPE section (5 µm) were used for RNA isolation using the FFPE RNA isolation kit (Quiagen N.V., RNeasy FFPE Kit (50), ID: 73504, Venlo, the Netherlands) according to the manufacturer’s protocol. For gene expression analysis, NanoString nCounter platform was used. The PanCancer IO Panel 360™ Panel was applied, and analysis was performed according to the manufacturer’s protocol.
Analysis
Hematoxylin-eosin (H&E) staining was performed to estimate histomorphology of PDTC. H&E sections were evaluated by using slide scans (Panoramic SCAN and Panoramic Viewer, 3D Histech, Budapest, Hungary). Experiments representing no tumor cells in baseline tissue specimen were excluded from analysis. Further basic parameters like tumor cell fraction, proliferating tumor cell fraction and apoptotic tumor cell fraction were determined by quantification of immunofluorescence stainings (AE1/3, Ki67 and cPARP). Five pictures per slice (3x5 pictures per condition) were taken manually by using an Olympus BX51 fluorescent microscope (Olympus Deutschland, Hamburg, Germany). In order to analyze these pictures, we have used a semi automatized pixel counting algorithm (created by Sönnichsen et al. 2018).Citation28 Total positive pixel of Hoechst 33342, AE1/3, cPARP, Ki67 were counted to quantify cell nuclei (Hoechst 33342-positive), tumor cell fraction (Hoechst 33342-, AE1/3-positive), apoptotic tumor cell fraction (Hoechst 33342-, AE1/3-, cPARP-positive) and proliferating tumor cell fraction (Hoechst 33342-, AE1/3-, Ki67-positive). Only pictures with more than 2% tumor cells (Hoechst 3342-, AE1/3-positive) were considered for further quantification of apoptotic and proliferating tumor cell fractions. Due to experimental variance that were similarly described in Sönnichsen et alCitation28 and Körfer et alCitation26 we normalized each condition to the control condition (CTR = 1). To differentiate responding vs. non-responding specimens the cutoff was determined to be equal or higher than 2.5 times of the CTR.
Immunohistochemistry sections of immune cell stainings were scanned by a slide scanner and quantified manually by counting positive immune cells (CD3, CD8, and FoxP3) in QuPath software (QuPath, Edinburgh, UK). DAB-positive cells were illustrated in proportion to hematoxylin-positive cells.
Statistical analysis
For statistical analysis of pictures of immunofluorescence/immunohistochemical stainings, mean values for conditions were calculated using mean slice values and standard error of the mean (SEM). For combination of different experiments mean values and SEM were calculated from mean condition values. Gene expression data were normalized to 15 housekeeping genes (ABCF1, DNAJC14, ERCC3, G6PD, GUSB, MRPL19, NRDE2, OAZ1, POLR2A, PSMC4, PUM1, SDHA, SF3A1, STK11IP, TBC1D10B, TBP, TFRC, TLK, TMUB2, UBB) and background thresholding was performed with NanoString nSolver software. IFNg signatureCitation15 (CD27, CD274, CD276, CD8A, CMKLR1, CXCL9, CXCR6, HLA-DQA1, HLA-DRB1, HLA-E, IDO1, LAG3, NKG7, PDCD1LG2, PSMB10, STAT1, TIGIT) and immune suppression scoreCitation31 (IMS: CCL8, VCAN, CCL2, CD163, CCL13, COL6A3, BCAT1, ADAM12, AXL, ISG15, SIGLEC1, PDGFRB, IL10, STC1, OLFML2B, TWIST2, FAP, INHBA) were calculated according to publications. For each experiment, relative change of gene expression data in treated conditions (e.g., Nivolumab) related to the negative control was calculated.
GraphPad Prism 8 (GraphPad Software, La Jolla, VA, USA) was used for calculating one-way analysis of variance with Bonferroni post test correction and students t-test. P < 0.05 was set significant. Non-significant changes were not illustrated in the figures.
Results
Preservation of tissue resident t-lymphocytes in PDTC of GC and EGJC over four days ex vivo
In order to evaluate PDTC in GC and EGJC as a model for exploring immunotherapy ex vivo, we have first looked for t-lymphocyte morphology and functionality preservation in PDTC of GC and EGJC by analyzing overall t-lymphocyte populations (CD3+) at the beginning of cultivation and after four days in culture (). Prior to cultivation, we observed a high individual variance in total t-lymphocyte infiltration as it has been already observed in GC and EGJC tumor specimensCitation32 (supplemental ). Quantification of CD3 staining was done in 11 cases (). Here, we can observe that the fraction of CD3+ cells remains stable on day 4 of cultivation compared to baseline tissue. Moreover, the subpopulations of cytotoxic t-lymphocytes (CD8+) and regulatory t-lymphocytes (Tregs, FoxP3+) did not show significant change throughout culture period of four days ex vivo ().
Figure 1. Preservation of t-lymphocytes in PDTC of GC and EGJC after 4 days (a) Representative images of immunohistochemical staining, showing t-lymphocytes (CD3), cytotoxic t-lymphocytes (CD8) and regulatory t-lymphocytes (FoxP3) at day 0 and after 4 days of cultivation. (b) Quantification of DAB stainings for t-lymphocytes (CD3) and (c, d) subtypes (CD8, FoxP3) at day 0 compared to 4 days ex vivo. Matched tissue specimens of 11 specimen donors were analyzed. Mann-Whitney-U test (P ≤ 0,05) showed no significant change of t-lymphocyte amounts. Day 0 normalized to 1; bars = 40 µm; error bars: SEM
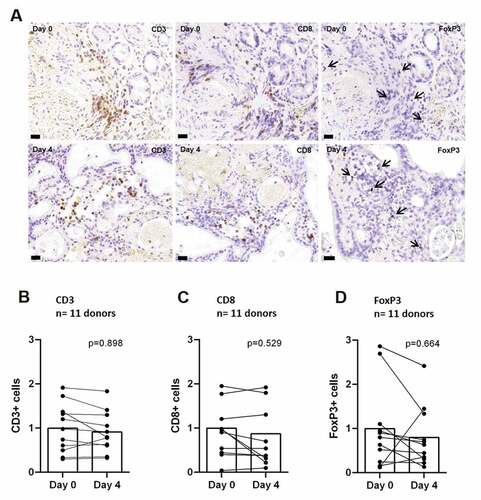
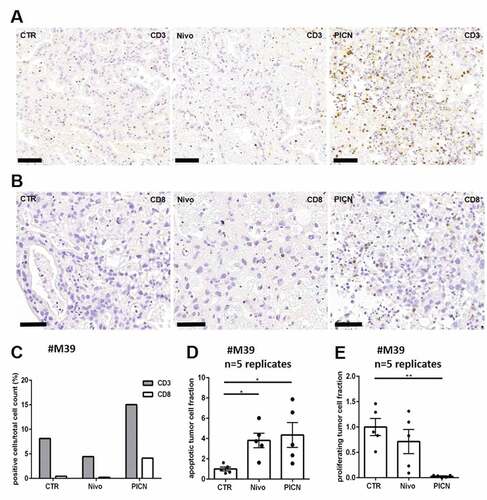
Figure 2. Co-cultivation of peripheral mononuclear blood cells (PBMC) with PDTC Tissue cultures of #M39 were supplemented with either Nivolumab (Nivo) or together with stimulated PBMCs (PICN) and analyzed after 72 h of treatment. (a, b) Representative pictures of DAB stainings with antibodies against CD3 (t-lymphocyte) and CD8 (cytotoxic t-lymphocyte). (c) Quantification of CD3- and CD8 DAB staining. (d, e) Normalized effects of Nivolumab and PBMC co-cultivation on tumor cell apoptosis (cPARP) and tumor cell proliferation (Ki67). bars = 40 µm; CTR, control; error bars: SEM; *p ≤ 0,05, **p ≤ 0,01; Kruskal-Wallis test
Exploration of modified culture media for PDTC
We examined whether histomorphological preservation of PDTC in general and especially of t-lymphocytes after 4 days in culture can be improved by altered culture media composition (media A-H) (supplemental Table 2). Taking four cases into account, no significant difference of apoptotic or proliferating tumor cell fractions was detected between the investigated compositions (supplemental Figure 1b and 1c). Intratumoral heterogeneity, represented by three tissue slices forming one condition demonstrated a high variability of apoptotic-/proliferating tumor cell fractions that was also observed in a previous study of colorectal cancer.Citation28 Investigating t-lymphocyte population (CD3+) in different media composition conditions, no significant difference in t-lymphocyte preservation was observed (Supplemental Figure 1d). All further functional experiments were subsequently conducted with medium A.
PBMCs can be co-cultivated with PDTC of GC and EGJC after preceding t-lymphocyte stimulation ex vivo
PDTC preserve tissue resident t-lymphocytes during culture period as shown above. To examine potential migration of immune cells into PDTC and opportunities of immune modification in PDTC ex vivo, co-culture experiment with patient-specific PBMCs are shown as proof of principle (n = 1). PMBCs were isolated and stimulated with CD3/CD28 t-cell activator (25 µl/ml) ex vivo before they were applied to tissue cultures. Tissue cultures were analyzed after 4 days of co-cultivation with stimulated PBMCs. A higher infiltration of CD3 + t-lymphocytes was seen in co-cultured tissue with PBMCs. shows apoptotic and proliferating tumor cell fractions of this case, demonstrating altered cPARP and Ki67 expression together of tumor cells.
Nivolumab treatment ex vivo results in heterogeneous antitumoral effects
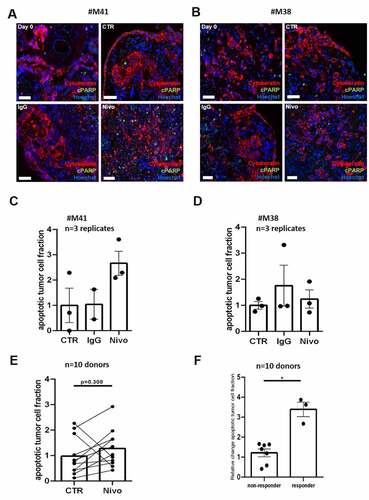
In order to investigate functionality of resident t-lymphocytes in PDTC, we have treated 10 different tumor specimens with Nivolumab ex vivo. Two clinical relevant concentrations of Nivolumab were applied and we did not see significant changes in apoptotic tumor cell fractions between both concentrations (supplemental Figure 4b, n = 3). Furthermore, the IgG vehicle treatment did not lead to differences in basic parameters like apoptosis and proliferation compared to the control (supplemental Figure 5, n = 7). Concluding these observations, further experiments were performed with Nivolumab 3 µg/ml and with no additional control for the IgG vehicle. In 10 cases treated with Nivolumab alone, we determined 7 cases in which the relative change of apoptotic tumor cell fraction did not differ significantly from control conditions and we observed 3 cases in which the relative change of tumor cell fraction increased compared to control (). Two cases are shown in detail demonstrating that differentiation in responding and non-responding tissue can be observed. Case #M41 showed a non-significant increase of apoptosis rate after treatment with single Nivolumab supplementation compared to the control condition (∆1,66, ). Furthermore, a higher fraction of t-lymphocytes was measured after Nivolumab treatment compared to control in this case (supplemental Figure 3b). Contrasting these results, we also have observed in case #M38 no increase of apoptosis rate after Nivolumab treatment (∆0,24, ).
Figure 3. PD-1 inhibition in PDTC of GC and EGJC. (a, b) Representative immunofluorescence images of apoptotic tumor cells at day 0 and 4 days (CTR) ex vivo. Nivolumab and its respective IgG were applied for 72 h. (C, D, E) Quantification of the apoptotic tumor cell fraction after treatment normalized to the respective control condition in two single cases (#M38 and #M41) and in 10 different donor specimens respectively. (f) A change of the apoptotic tumor cell fraction greater than ∆2.5 was set as cut off for discrimination of Nivolumab responder and non-responder (*p ≤ 0,05; Mann-Whitney-U test, n = 10 patients). Hoechst, blue; Cytokeratin, red; cPARP, green, control (CTR), Nivolumab (Nivo, 3 µg/ml) and IgG (3 µg/ml); bars = 20 µm; error bars: SEM
Combined therapy with t-lymphocyte stimulation and Nivolumab enhances response in GC and EGJC
We investigated if tissue not responding to single Nivolumab therapy respond to combinational therapies ex vivo. Nivolumab was applied in combination with CD3/CD28 t-cell activator (ImmunoCultTM) in four cases for 72 h. CD3/CD28 t-cell activator was used for general t-cell stimulation to examine overall t-cell vitality and functionality. The combined supplementation of Nivolumab and the t-cell activator was applied to investigate the potency of immune activation in potential immune suppressed tissue specimens. Tumor apoptosis rate was increased significantly by the combination compared to monotherapy with Nivolumab in all cases (∆3.77, p≤0.01) or compared to monotherapy with CD3/CD28 t-cell activator (∆2.68, p≤0.05, ). Furthermore, monotherapy with CD3/CD28 t-cell activator showed an increased apoptotic tumor cell fraction compared to control, however due to high variances, the difference was not statistically significant (∆1.87, ). Regarding individual specimens, tissue responding to Nivolumab treatment showed benefits of combinational supplementation (#M41, ∆4.16) as well as non-responding tissue demonstrated a general enhancement of the tumor apoptosis rate after treatment with Nivolumab and the CD3/CD28 t-cell activator (#M38, ∆7.20, ).
Figure 4. Combined therapy of CD3/CD28-T-cell stimulation and Nivolumab in PDTC of GC and EGJC. (a) Quantification of apoptotic tumor cell fraction after 4 days ex vivo in PDTC of four tissue donors (b) Quantification of apoptotic tumor cell fraction of potential Nivolumab responder (#M41) and (c) potential non-responder (#M38) after 4 days ex vivo. Control (CTR), Nivolumab (Nivo; 3 µg/ml), t-cell activator (IC, 25 µg/ml) and combined supplementation with Nivolumab and t-cell activator (NIC); error bars: SEM; *p ≤ 0,05, **p ≤ 0,01; Kruskal-Wallis test
Response of PDTC to combined therapy with Nivolumab and Oxaliplatin
To evaluate clinical relevant therapies in PDTC of GC and EGJC, Nivolumab treatment was combined with Oxaliplatin. Shown previously, application of chemotherapy in PDTC results in dose-dependent effects.Citation23,Citation26,Citation28 Here, two different concentrations (20 µmol/l and 100 µmol/l) of Oxaliplatin were investigated. We observed dose-dependent enhancement of the apoptotic tumor cell fraction compared to control conditions (Ox20, ∆1.75; Ox100, ∆5.06, p≤0.01) and between the applied concentrations (∆3.31, p≤0.05) (supplemental Figure 4a). Additionally, PDTC were treated with Nivolumab combined with Oxaliplatin (20 µmol/l, NOx) in five cases. Here, we observed an non-significant increase of apoptotic tumor cells compared to monotherapy with Nivolumab (∆2.21) or Oxaliplatin (∆1.36, ). By analyzing individual cases, we observed major differences in tissue response to NOx (-db). Comparing several experiments, non-responding tissue to Nivolumab as well as to Oxaliplatin showed minor benefits of a combinational therapy compared to Nivolumab (#M32, ∆0.71) whereas non-responding tissue to Nivolumab and responding tissue to Oxaliplatin displayed measurably higher amount of apoptotic tumor cell fraction after treatment with NOx compared to monotherapy with Nivolumab (#M38, ∆5.16, ). Further we observed an enhancement of apoptotic tumor cell fraction in Nivolumab and Oxaliplatin responder after combined treatment (#M41, ∆7.02, ).
Figure 5. Combined therapy with Nivolumab and chemotherapy in PDTC of GC and EGJC. (a) Quantification of apoptotic tumor cell fraction after 4 days ex vivo in in PDTC of five tissue donors. (b-d) Quantification of apoptotic tumor cell fraction in different specific cases (#M32, #M38, #M41) which show various responses to monotherapy and combinational therapy. Control (CTR), Nivolumab (Nivo; 3 µg/ml), Oxaliplatin (Ox; 20 µmol/l) and combined therapy with Nivolumab and Oxaliplatin (NOx); error bars: SEM; **p ≤ 0,01; Kruskal-Wallis test
Increase of t-cell effector gene expression in PDTC after immunomodulatory treatment ex vivo
To investigate molecular changes in PDTC, RNA bulk analysis of formalin-fixed tissue slices was performed by the NanoString nCounter platform. Analysis was conducted with six experiments of different patient specimens. Regarding tumor cell apoptosis, we categorized six tissue specimens in responding tissue to Nivolumab (∆>2.5) and non-responding tissue (∆<2.5), defined by immunohistochemistry analysis. We evaluated a gene expression set of five genes (IFNg, GMZA, GMZB, PRF1, FASLG) representing cytotoxic t-cell effector function as a surrogate for determination of Nivolumab response in all PDTC ex vivo.Citation33–36 By comparing the relative change of expression of the t-cell effector gene set, responding tissue show a higher relative change of gene expression compared to non-responding tissue (∆0.54, p≤0.05; relative change: Nivo vs CTR; ). Further, we analyzed two established gene expression scores, the interferon gamma score (IFNg) by Ayers et al.Citation15 and immune suppression score (IMS) by Cui et al.Citation31 were related to the t-cell effector gene set established in PDTC. A correlation between relative change of the t-cell effector gene set expression and the IFNg score were observed. Especially, one responder (#M41) shows in both scores high values compared to all other PDTCs (). Regarding the immune suppression score, an inverse correlation of mean expression level of IMS compared to relative change of t-cell effector gene set can be demonstrated ().
Figure 6. Clinical related gene expression profiles confirm histological tissue analysis of PDTC in GC and EGJC (a) Relative change of the t-cell effector gene expression set determined in PDTC ex vivo (relative change of Nivo vs CTR, n = 6). (b) Histologically pre-determined cases are compared by the relative change of the t-cell effector gene set and the relative change of the clinical related Interferon gamma signature. (c) Histologically pre-determined cases are compared by the relative change of the t-cell effector gene set and the mean absolute count of gene expression of immune suppression score (IMS). Error bars: SEM, Mann-Whitney-U test
Discussion
Human model systems to investigate cancer cells in their relevant organotypic environment, displaying main characteristics, e.g. relevant immune cells, hypoxic areas and heterogeneous tumor populations, are desperately needed.Citation37 Here, we hypothesized that PDTC is a promising model to examine immunotherapy in GC and EGJC. This study shows that the resident t-lymphocytes can be manipulated and investigated in PDTC of GC and EGJC.
Heterogeneity and tumor mediated immunosuppression are characteristics for solid cancers leading to poor individual patient survival.Citation5,Citation38 Interaction of cancer cells with micro-environmental immune, mesenchymal or endothelial cells has major impact on tumor progression, invasion, metastases as well as on drug resistance.Citation38–41 Especially for immune checkpoint blockade, primary and adapted resistance is observed in the majority of patients.Citation42 Intratumoral or systemic immunosuppression mediated by Tregs, myeloid cells (e.g., myeloid derived suppressor cells) or neutrophils has been suggested as one reason for minor response to PD-1 blockade.Citation38 Therefore, the presented tissue model may represent a useful complementary system in translational research.Citation17,Citation37
Antitumoral but also immunosuppressive functions are captured by t-lymphocytes within the TME, mediating tumor cell death by secreting effector molecules like granzymes A/B, perforin or interferon gamma.Citation34 T-lymphocyte activation can be inhibited by immune cells like Tregs secreting immunosuppressive cytokines (IL-10, TGFß) or upregulation of immune checkpoint molecules (e.g. PD-1, PDL-1, LAG-3, TIM-3, VISTA) by t-lymphocyte- activation.Citation43 Inhibition of these checkpoint molecules subsequently enhance antitumoral effects in individual patients activating CD8 + t-lymphocytes.Citation41 Here, we can show that the number of tumor infiltrating t-lymphocyte subgroups like CD8 + t-lymphocytes and Tregs remain stable over four days of culture compared to baseline tissue. These results and similar observations in other tumor entities show that tissue resident t-lymphocytes and macrophages are preserved and can be analyzed in PDTC of GC and EGJC.Citation20,Citation22–24
PD-1 or PD-L1 blockade is approved in several tumor entities.Citation44–47 However, monotherapy with PD-1 antibodies have limited clinical benefit and response rates are low in most tumor entities.Citation42 Predictive markers, providing advice for clinical immune checkpoint therapy indication is however still under intensive investigation.Citation14 Here, we treated PDTC of GC and EGJC with Nivolumab monotherapy and observed similar low response rates as it has been described in clinical studies.Citation12,Citation13 Still, tissue specimens responding well to Nivolumab treatment did not necessarily express high PD-L1 levels. By maintaining the organotypic cellular composition, this result might suggest the involvement of further immunological tissue-related cells. Macrophages, B-cells and NK-cells are getting in the focus as they interfere in the PD-1/PD-L1 pathway and are suggested as regulators.Citation38,Citation48–50
Combinational approaches with other immune checkpoint inhibitors (e.g., CTLA4 blockade) or chemotherapy seem to be promising due to potential synergistic effects of more than one mechanism of action.Citation51 Treating PDTC ex vivo with combinational approaches of PD-1 inhibition together with Oxaliplatin or a commercial CD3/CD28 t-cell activator led to enhanced tumor cell apoptosis in most patient derived tumor specimens. Whereas the combined effect of the t-cell activator and PD-1 inhibition is t-lymphocyte related, the beneficial effect of the clinical relevant combination of oxaliplatin and PD-1 inhibition is supported by recent literature, despite the concept that immunogenic chemotherapies can lead to adaptive tolerance.Citation52 However, recent literature highlight the beneficial effect of combined therapy as found in the present study. It was revealed that therapeutic FOLFOX regimens induced CD8 T-cell activation in clinical specimens and that oxaliplatin can eliminate type 2 tumor-associated macrophages, concomtantly restoring t-cell reactivity in immunocompetent mice.Citation53,Citation54 These results indicate that PDTC can reflect clinical observations and might be a promising tool for further investigations of novel combinational therapy approaches prior to clinical phase 1 trials.
Investigating functionality of resident t-lymphoctyes in PDTC, protein and gene expression analysis were performed. In clinical trials of immunotherapy-specific t-lymphocyte inflammation, gene expression signatures have been established and have been proven of predictive value.Citation15,Citation31 In future, cancer therapy may become more and more complex, and precision medicine will be part of daily practice. Novel biomarkers can guide oncologist in immunotherapy treatment decisions.Citation14 Nonetheless, primary and adapted resistance compromise efficacy of immunotherapy or cancer treatment and the underlying mechanism of profitable combinational therapies are still not fully understood.Citation38,Citation55 Here, we have noticed a heterogeneous inter-individual gene expression after treatment with Nivolumab monotherapy. However, ex vivo PDTCs responding to PD-1 inhibition showed a significant higher change of cytotoxic t-cell effector gene expression compared to non-responding PDTCs. We utilized the INFg gene expression profile of Ayers et al, established in clinical specimens from PD-1 clinical trials of 9 cancer entities. This t-lymphocyte inflammation based profile, still under investigation in current PD-1 inhibition trials, could be correlated to the obtained overall effects.Citation15 Further, the immune suppressor score investigated by Cui et alCitation31 for their predictive potency in clinical melanoma and gastric cancer specimens was aplied in the current investigation as well as a gene set of t-cell effector molecules that are involved in t-lymphocyte mediated cytotoxicity.Citation33–36 Though, t-cell effector gene set supported our classification of tissue response by immunohistochemical determination with statistical power. Yet, the t-cell effector gene set is not entitled to predict Nivolumab response in a clinical setting and need to be confirmed therein. While, lower immune suppression scores have been observed in responding patients, it is suggested that the t-cell effector gene set and the immune suppression score might be applied together for more precise patient stratification. Therefore, prospective correlation with clinical data in PDTC of GC and EGJC must be pursued by endoscopic or core needle tumor specimens. In lung cancer, first successful clinical correlations of treatment susceptibilities ex vivo and clinical data have been published in PDTC and are ongoing.Citation29,Citation56
Still, the system model holds certain limitations as tumor specimens are scarce and have a limited culture period. Though, PDTC can provide preservation of heterogeneous tumors with typical features of immunosuppression or impact of mesenchymal cells.Citation20,Citation22–24 Functional experiments regarding migration and differentiation of immune cells can be performed in PDTC by co-culturing patient specific PBMCs tissue to enhance the understanding of systemic effectiveness.
In summary, we demonstrate a stable and functional t-lymphocyte population in PDTC of GC and EGJC. We were able to show that individual responses to PD-1 inhibition can be depicted in PDTC and combinational therapy approaches with chemotherapy are able to enhance antitumoral effects.
Supplemental Material
Download ()Acknowledgments
The authors thank Barbara Seliger, Katrin Hoffman, Christoph Thomssen, Martina Vetter, Kathrin Stückrath, Anja Müller and Kerstin Körber-Ferl for their commitment while mRNA expression analysis with Nanostring nCounter platform. For the assistance of the specimen organisation and logistics, the authors would like to thank Volker Wiechmann, Heike Bisanz, Benjamin Reubke and the Leipzig Medical Biobank as well as Angela Ehrlich for their technical support.
Disclosure statement
The authors declare no potential conflicts of interest.
Supplementary material
Supplemental data for this article can be accessed on the publisher’s website
Additional information
Funding
References
- Ho SWT, Tan P. Dissection of gastric cancer heterogeneity for precision oncology. Cancer Science. 2019;110(11):3405–11. doi:10.1111/cas.14191.
- Ychou M, Boige V, Pignon J-P, Conroy T, Bouché O, Lebreton G et al. Perioperative chemotherapy compared with surgery alone for resectable gastroesophageal adenocarcinoma: an FNCLCC and FFCD multicenter phase III trial. Journal of Clinical Oncology: Official Journal of the American Society of Clinical Oncology. 2011;29:1715–1721. doi:10.1200/JCO.2010.33.0597.
- Bray F, Ferlay J, Soerjomataram I, Siegel RL, Torre LA, Jemal A. Global cancer statistics 2018: GLOBOCAN estimates of incidence and mortality worldwide for 36 cancers in 185 countries. CA: A Cancer Journal for Clinicians. 2018;68:394–424. doi:10.3322/caac.21492.
- Lordick F, Lorenzen S, Yamada Y, Ilson D. Optimal chemotherapy for advanced gastric cancer: is there a global consensus? Gastric Cancer: Official Journal of the International Gastric Cancer Association and the Japanese Gastric Cancer Association. 2014;17(2):213–225. doi:10.1002/cam4.720.
- Roma-Rodrigues C, Mendes R, Baptista PV, Fernandes AR. Targeting Tumor Microenvironment for Cancer Therapy. International Journal of Molecular Sciences. 2019:20. doi:10.3390/ijms20040840.
- Ribas A, Wolchok JD. Cancer immunotherapy using checkpoint blockade. Science (New York, N.Y.). 2018;359(6382):1350–1355. doi:10.1126/science.aar4060.
- Bang Y-J, Cho JY, Kim YH, Kim JW, Di Bartolomeo M, Ajani JA et al. Efficacy of Sequential Ipilimumab Monotherapy versus Best Supportive Care for Unresectable Locally Advanced/Metastatic Gastric or Gastroesophageal Junction Cancer. Clinical Cancer Research: An Official Journal of the American Association for Cancer Research. 2017;23:5671–5678. doi:10.1158/1078-0432.CCR-17-0025.
- Kang Y-K, Boku N, Satoh T, Ryu M-H, Chao Y, Kato Ket al. Nivolumab in patients with advanced gastric or gastro-oesophageal junction cancer refractory to, or intolerant of, at least two previous chemotherapy regimens (ONO-4538-12, ATTRACTION-2): a randomised, double-blind, placebo-controlled, phase 3 trial. The Lancet. 2017;390(10111):2461–2471. doi:10.1016/S0140-6736(17)31827-5.
- Kawazoe A, Yamaguchi K, Yasui H, Negoro Y, Azuma M, Amagai Ket al. Safety and efficacy of pembrolizumab in combination with S-1 plus oxaliplatin as a first-line treatment in patients with advanced gastric/gastroesophageal junction cancer: cohort 1 data from the KEYNOTE-659 phase IIb study. European Journal of Cancer (Oxford, England: 1990). 2020;129:97–106. doi:10.1016/j.ejca.2020.02.002.
- Boku N, Ryu M-H, Kato K, Chung HC, Minashi K, Lee KW et al. Safety and efficacy of nivolumab in combination with S-1/capecitabine plus oxaliplatin in patients with previously untreated, unresectable, advanced, or recurrent gastric/gastroesophageal junction cancer: interim results of a randomized, phase II trial (ATTRACTION-4). Annals of Oncology: Official Journal of the European Society for Medical Oncology. 2019;30:250–258. doi:10.1093/annonc/mdy540.
- Moehler M, Shitara K, Garrido M, Salman P, Shen L, Wyrwicz L et al. LBA6_PR Nivolumab (nivo) plus chemotherapy (chemo) versus chemo as first-line (1L) treatment for advanced gastric cancer/gastroesophageal junction cancer (GC/GEJC)/esophageal adenocarcinoma (EAC): first results of the CheckMate 649 study. Annals of Oncology: Official Journal of the European Society for Medical Oncology. 2020;31:S1191. doi:10.1016/j.annonc.2020.08.2296.
- Muro K, Chung HC, Shankaran V, Geva R, Catenacci D, Gupta S et al. Pembrolizumab for patients with PD-L1-positive advanced gastric cancer (KEYNOTE-012): a multicentre, open-label, phase 1b trial. The Lancet Oncology. 2016;17:717–726. doi:10.1016/S1470-2045(16)00175-3.
- Janjigian YY, Bendell J, Emiliano Calvo JW, Kim PA, Ascierto PS, Ott PA et al. CheckMate-032 Study: efficacy and Safety of Nivolumab and Nivolumab Plus Ipilimumab in Patients With Metastatic Esophagogastric Cancer. Journal of Clinical Oncology 2018;36:28, 2836–2844. doi:10.1200/JCO.2017.76.6212
- Darvin P, Toor SM, Sasidharan Nair V, Elkord E. Immune checkpoint inhibitors: recent progress and potential biomarkers. Experimental & Molecular Medicine. 2018;50:1–11. doi:10.1038/s12276-018-0191-1.
- Ayers M, Lunceford J, Nebozhyn M, Murphy E, Loboda A, Kaufman DR et al. IFN-γ-related mRNA profile predicts clinical response to PD-1 blockade. The Journal of Clinical Investigation. 2017;127:2930–2940. doi:10.1172/JCI91190.
- Zitvogel L, Pitt JM, Daillère R, Smyth MJ, Kroemer G. Mouse models in oncoimmunology. Nature Reviews. Cancer. 2016;16:759–773. doi:10.1038/nrc.2016.91.
- Klinghammer K, Walther W, Hoffmann J. Choosing wisely – preclinical test models in the era of precision medicine. Cancer Treatment Reviews. 2017;55:36–45. doi:10.1016/j.ctrv.2017.02.009.
- Arrowsmith J. Trial watch: phase II failures: 2008-2010. Nature reviews. Drug Discovery. 2011;10:328–329. doi:10.1038/nrd3439.
- Arrowsmith J, Miller P. Trial watch: phase II and phase III attrition rates 2011-2012. Nature reviews. Drug Discovery. 2013;12:569. doi:10.1038/nrd4090.
- Prill S, Rebstock J, Tennemann A, Körfer J, Sönnichsen R, Thieme R et al. Tumor-associated macrophages and individual chemo-susceptibility are influenced by iron chelation in human slice cultures of gastric cancer. Oncotarget. 2019;10(46):4731–4742. doi:10.18632/oncotarget.27089.
- Lim CY, Chang JH, Lee WS, Lee KM, Yoon YC, Kim J Park IY. Organotypic slice cultures of pancreatic ductal adenocarcinoma preserve the tumor microenvironment and provide a platform for drug response. Pancreatology: Official Journal of the International Association of Pancreatology (IAP) … [Et Al.]. 2018;18:913–927. doi:10.1016/j.pan.2018.09.009.
- Sivakumar R, Chan M, Shin JS, Nishida-Aoki N, Kenerson HL, Elemento O et al. Organotypic tumor slice cultures provide a versatile platform for immuno-oncology and drug discovery. Oncoimmunology. 2019;8(12):e1670019. doi:10.1080/2162402X.2019.1670019.
- Jiang X, Seo YD, Chang JH, Coveler A, Nigjeh EN, Pan S et al. Long-lived pancreatic ductal adenocarcinoma slice cultures enable precise study of the immune microenvironment. Oncoimmunology. 2017;6(e1333210). doi:10.1080/2162402X.2017.1333210
- Temann A, Golovina T, Neuhaus V, Thompson C, Chichester JA, Braun A, Yusibov V. Evaluation of inflammatory and immune responses in long-term cultured human precision-cut lung slices. Human Vaccines & Immunotherapeutics. 2017;13:351–358. doi:10.1080/21645515.2017.1264794.
- Gerlach MM, Merz F, Wichmann G, Kubick C, Wittekind C, Lordick F, Bechmann I. Slice cultures from head and neck squamous cell carcinoma: a novel test system for drug susceptibility and mechanisms of resistance. British Journal of Cancer. 2014;110(2):479–488. doi:10.1038/bjc.2013.700.
- Koerfer J, Kallendrusch S, Merz F, Wittekind C, Kubick C, Kassahun WT et al. Organotypic slice cultures of human gastric and esophagogastric junction cancer. Cancer Medicine. 2016;5:1444–1453. doi:10.1002/cam4.720.
- Merz F, Gaunitz F, Dehghani F, Renner C, Meixensberger J, Gutenberg Aet al. Organotypic slice cultures of human glioblastoma reveal different susceptibilities to treatments. Neuro Oncol. 2013;15(6):670–681. doi:10.1093/neuonc/not003.
- Sönnichsen R, Hennig L, Blaschke V, Winter K, Körfer J, Hähnel S et al. Individual Susceptibility Analysis Using Patient-derived Slice Cultures of Colorectal Carcinoma. Clinical Colorectal Cancer . 2018;17(2):e189–e199. doi:10.1016/j.clcc.2017.11.002.
- Karekla E, Liao W-J, Sharp B, Pugh J, Reid H, Quesne JL et al. Ex Vivo Explant Cultures of Non–Small Cell Lung Carcinoma Enable Evaluation of Primary Tumor Responses to Anticancer Therapy. Cancer Research. 2017;77(8):2029–2039. doi:10.1158/0008-5472.CAN-16-1121.
- Roelants C, Pillet C, Franquet Q, Sarrazin C, Peilleron N, Giacosa, S et al. Ex-Vivo Treatment of Tumor Tissue Slices as a Predictive Preclinical Method to Evaluate Targeted Therapies for Patients with Renal Carcinoma. Cancers. 2020;12. doi:10.3390/cancers12010232.
- Cui C, Xu C, Yang W, Chi Z, Sheng X, Si L et al. Ratio of the interferon- γ signature to the immunosuppression signature predicts anti-PD-1 therapy response in melanoma. npj Genom. Med.2021;6 (1):S.7. doi:10.1038/s41525-021-00169-w.
- Galon J, Bruni D. Approaches to treat immune hot, altered and cold tumours with combination immunotherapies. Nature Reviews. Drug Discovery. 2019;18:197–218. doi:10.1038/s41573-018-0007-y.
- Martínez-Lostao L, Anel A, How PJ. Do Cytotoxic Lymphocytes Kill Cancer Cells? Clinical Cancer Research: An Official Journal of the American Association for Cancer Research. 2015;21:5047–5056. doi:10.1158/1078-0432.CCR-15-0685.
- Farhood B, Najafi M, Mortezaee K. CD8+ cytotoxic T lymphocytes in cancer immunotherapy: a review. Journal of Cellular Physiology. 2019;234:8509–8521. doi:10.1002/jcp.27782.
- Mittrücker H-W, Visekruna A, Huber M. Heterogeneity in the differentiation and function of CD8⁺ T cells. Archivum Immunologiae Et Therapiae Experimentalis. 2014;62:449–458. doi:10.1007/s00005-014-0293-y.
- Golstein P, Griffiths GM. An early history of T cell-mediated cytotoxicity. Nature Reviews Immunology. 2018;18(8):527–535. doi:10.1038/s41577-018-0009-3.
- Hickman JA, Graeser R, de Hoogt R, Vidic S, Brito C, Gutekunst M, van der Kuip H. Three-dimensional models of cancer for pharmacology and cancer cell biology: capturing tumor complexity in vitro/ex vivo. Biotechnology Journal. 2014;9:1115–1128. doi:10.1002/biot.201300492.
- Sharma P, Hu-Lieskovan S, Wargo JA, Ribas A. Primary, Adaptive, and Acquired Resistance to Cancer Immunotherapy. Cell 168, 707–723. 2017. doi:10.1016/j.cell.2017.01.017.
- McMillin DW, Negri JM, Mitsiades CS. The role of tumour–stromal interactions in modifying drug response: challenges and opportunities. Nature Reviews Drug Discovery. 2013;12(3):217–228. doi:10.1038/nrd3870.
- Whiteside TL. The tumor microenvironment and its role in promoting tumor growth. Oncogene. 2008;27(45):5904–5912. doi:10.1038/onc.2008.271.
- Whiteside TL, Demaria S, Rodriguez-Ruiz ME, Zarour HM, Melero I. Emerging Opportunities and Challenges in Cancer Immunotherapy. Clinical Cancer Research: an Official Journal of the American Association for Cancer Research. 2016;22:1845–1855. doi:10.1158/1078-0432.CCR-16-0049.
- Kelderman S, Schumacher TNM, Haanen JBAG. Acquired and intrinsic resistance in cancer immunotherapy. Molecular Oncology. 2014;8:1132–1139. doi:10.1016/j.molonc.2014.07.011.
- Chaudhary B, Elkord E. Regulatory T Cells in the Tumor Microenvironment and Cancer Progression: role and Therapeutic Targeting. Vaccines. 2016:4. doi:10.3390/vaccines4030028.
- Larkin J, Chiarion-Sileni V, Gonzalez R, Grob JJ, Cowey CL, Lao CD et al. Combined Nivolumab and Ipilimumab or Monotherapy in Untreated Melanoma. The New England Journal of Medicine. 2015;373:23–34. doi:10.1056/NEJMoa1504030.
- Larkin J, Lao CD, Urba WJ, McDermott DF, Horak C, Jiang J, Wolchok JD et al. Efficacy and Safety of Nivolumab in Patients With BRAF V600 Mutant and BRAF Wild-Type Advanced Melanoma: a Pooled Analysis of 4 Clinical Trials. JAMA Oncology. 2015;1:433–440. doi:10.1001/jamaoncol.2015.1184.
- Hellmann MD, Mathew D, Paz-Ares L, Bernabe Caro R, Zurawski B, Kim S-W, Carcereny Costa E et al. Nivolumab plus Ipilimumab in Advanced Non-Small-Cell Lung Cancer. The New England Journal of Medicine. 2019;381:2020–2031. doi:10.1056/NEJMoa1910231.
- D’Errico G, Machado HL, Sainz B. A current perspective on cancer immune therapy: step-by-step approach to constructing the magic bullet. Clinical and Translational Medicine. 2017;6(3). doi:10.1186/s40169-016-0130-5.
- Hartley GP, Chow L, Ammons DT, Wheat WH, Dow SW. Programmed Cell Death Ligand 1 (PD-L1) Signaling Regulates Macrophage Proliferation and Activation. Cancer Immunology Research. 2018;(6)1260–1273. doi:10.1158/2326-6066.CIR-17-0537.
- Davis Z, Felices M, Lenvik T, Badal S, Walker JT, Hinderlie P et al. Low-density PD-1 expression on resting human natural killer cells is functional and upregulated after transplantation. Blood Advances. 2021;(5):1069–1080. doi:10.1182/bloodadvances.2019001110.
- Shen H, Yang E S-H, Conry M, Fiveash J, Contreras C, Bonner JA, Shi LZ. Predictive biomarkers for immune checkpoint blockade and opportunities for combination therapies. Genes & Diseases. 2019;6:232–246. doi:10.1016/j.gendis.2019.06.006.
- Murciano-Goroff YR, Warner AB, Wolchok JD. The future of cancer immunotherapy: microenvironment-targeting combinations. Cell Research. 2020;30(6):507–519. doi:10.1038/s41422-020-0337-2.
- Schirrmacher V. From chemotherapy to biological therapy: a review of novel concepts to reduce the side effects of systemic cancer treatment (Review). International Journal of Oncology. 2019;54:407–419. doi:10.3892/ijo.2018.4661.
- Dosset M, Vargas TR, Lagrange A, Boidot R, Végran F, Roussey A et al. PD-1/PD-L1 pathway: an adaptive immune resistance mechanism to immunogenic chemotherapy in colorectal cancer. Oncoimmunology. 2018;7(e1433981). doi:10.1080/2162402X.2018.1433981
- Limagne E, Thibaudin M, Nuttin L, Spill A, Derangêre V, Furnet J-D et al. Trifluridine/Tipiracil plus Oxaliplatin Improves PD-1 Blockade in Colorectal Cancer by Inducing Immunogenic Cell Death and Depleting Macrophages. Cancer Immunology Research. 2019;7:1958–1969. doi:10.1158/2326-6066.CIR-19-0228.
- Swart M, Verbrugge I, Beltman JB. Combination Approaches with Immune-Checkpoint Blockade in Cancer Therapy. Frontiers in Oncology. 2016;6:233. doi:10.3389/fonc.2016.00233.
- Majumder B, Baraneedharan U, Thiyagarajan S, Radhakrishnan P, Narasimhan H, Dhandapani M et al. Predicting clinical response to anticancer drugs using an ex vivo platform that captures tumour heterogeneity. Nature Communications. 2015;6:6169. doi:10.1038/ncomms7169.