
 ?Mathematical formulae have been encoded as MathML and are displayed in this HTML version using MathJax in order to improve their display. Uncheck the box to turn MathJax off. This feature requires Javascript. Click on a formula to zoom.
ABSTRACT
Although the vast majority of patients with papillary thyroid cancer (PTC) have a favorable prognosis when conventional treatments are implemented, local recurrence and distant metastasis of advanced PTCs still hamper the survival and clinical management in certain patients. As immune checkpoint blockade (ICB) therapy achieves a great success in some advanced cancers, we aimed to investigate the immune landscape in PTC and its potential implications for prognosis and immunotherapy. In this study, different algorithms were conducted to estimate immune infiltration in PTC samples. A series of bioinformatic and machine learning approaches were performed to identify PTC-specific immune-related genes (IRGs) and distinct immune clusters. Differences in intrinsic tumor immunogenicity and potential immunotherapy response were observed between distinct immune clusters. A prognostic immune-related signature (IRS) was established to predict progression-free survival (PFS). IRS exhibited more powerful prognostic capacity and accurate survival prediction compared to conventional clinicopathological features. Furthermore, an integrated survival decision tree and a scoring nomogram were constructed to improve prognostic stratification and predictive accuracy for individual patients. In addition, altered pathways, mutational patterns, and potential applicable drugs were analyzed in different immune-related risk groups. Our study gained some insight into the immune landscape of PTC, and provided some useful clues for introducing immune-based molecular classification into risk stratification and guiding ICB decision-making.
Introduction
Thyroid cancer is currently the most common malignancy of the endocrine system.Citation1 In the past few decades, the incidence of thyroid cancer has increased steadily as a result of the technological advancements in diagnostic imaging and popularity of screening.Citation2 Among all the cases, papillary thyroid cancer (PTC) is the predominant histopathological subtype with an approximate proportion of 85%.Citation3 PTC patients have a favorable prognosis with a 10-year survival rate greater than 90% when conventional treatments are implemented, including surgical section, thyroid-stimulating hormone suppression and radioactive iodine (RAI) therapy, alone or in combination.Citation3,Citation4 However, local recurrence and distant metastasis of advanced PTCs still hamper the survival and clinical management in certain patients.Citation5,Citation6 Therefore, further exploration of potential biomarkers and therapeutic targets for PTC is of great clinical significance to facilitate personalized treatment and management.
Bulk tumor tissues consist not only of tumor cells but also heterogeneous microenvironment constituents such as immune and stromal cells.Citation7 The dynamic cross-talks between tumor cells and surrounding constituents exerts a dual role, either antitumor or protumor, at all stages of cancer development, from tumorigenesis to metastasis.Citation8,Citation9 It is now well acknowledged that immune cells within the tumor microenvironment (TME) could recognize and eliminate cancer cells through different immune mechanisms, which is known as immunosurveillance.Citation10 However, by recruitment of immunosuppressive cell populations, downregulation of tumor immunogenicity, or through other immunosuppressive mechanisms, cancer cells could modulate the host immune system to escape the immunosurveillance.Citation9,Citation11
Immunotherapy aims to exploit inherent immunosurveillance and potentiate a patient’s immune system to kill cancer cells with minimal side-effects.Citation12 Modulations of the immune system attract great interest from oncologists and cancer immunologists, which promotes the development of immunotherapy. In recent years, some immunotherapeutic agents including immune checkpoint inhibitors such as anti-CTLA-4 and anti-PD-L1/PD-1 have brought considerable clinical benefits for some patients with advanced stages.Citation13–15 At present, cutting-edge immunotherapies provide PTC patients with potential alternative strategies. Some in vitro and in vivo studies have demonstrated that immune checkpoint inhibitors could improve the effectivity of eliminating thyroid cancer cells.Citation16,Citation17 More importantly, several ongoing clinical trials have shed some light on the field of immunotherapy in advanced thyroid cancer.Citation18,Citation19 Although these findings indicate the importance of immunotherapy for PTC, the immune landscape and molecular characteristics of PTC TME remain unclear.
In this study, we aimed to investigate the immune landscape within PTC TME. A set of PTC-specific immune-related genes (IRGs) and two distinct immune clusters were identified. A series of bioinformatic and machine learning methods were conducted to evaluate potential immunotherapeutic implications and construct a prognostic immune-related signature. Differences in immune and mutational characterizations and their associations were further investigated in different histological variants and risk cohorts. From these comprehensive analyses, we gained some insight into the immune landscape of PTC and its potential clinical utility in prognostic stratification and immunotherapeutic implications for PTC patients.
Materials and methods
Data acquisition and preprocessing
The latest summary of 2,483 immune-related genes (IRGs) was downloaded from the Immunology Database and Analysis Portal (ImmPort, https://www.immport.org/home)Citation20 for further study.
Publicly available transcriptome data of PTC and normal thyroid tissues with clinical annotations were systematically searched. In total, five microarray datasets named GSE33630,Citation21 GSE60542,Citation22 GSE3467,Citation23 GSE3678 (unpublished), and GSE27155,Citation24 and two RNA-sequencing (RNA-seq) datasets named TCGA-THCACitation25 and GTEx-thyroidCitation26 were included in our study. All the raw CEL files and clinical information of microarray databases were downloaded from Gene Expression Omnibus (GEO, https://www.ncbi.nlm.nih.gov/geo/). Probe IDs were mapped to gene symbols according to the corresponding annotation file, and the maximal measurement was selected as the final gene expression value if one gene symbol has multiple probes. All the microarray and RNA-seq data included in this study were normalized and log2 transformed as previously reported.Citation27–29
Somatic mutation data of TCGA-THCA, which were identified using MuTect2, were sorted in the mutation annotation format (MAF) files and analyzed using R package ‘maftools’. The common frequent mutations (≥5%) shared by different PTC variants were visualized using R package ‘igraph’. Tumor mutational burden (TMB) was calculated with non-synonymous somatic mutations using 38 Mb as the estimate of the exome size.Citation30
Immune infiltration analysis
Three algorithms named xCell,Citation31 ESITMATE,Citation32 and CIBERSORTCitation33 were used to quantify the relative or absolute abundance of immune and stromal cell populations in heterogeneous samples with transcriptome data. The tumor purity of PTC samples was estimated using R package ‘ESTIMATE’.
The T cell infiltration score (TIS) was defined as the sum of absolute abundance of CD8 + T cell, CD4+ naïve T cell, CD4+ memory T cell, T follicular helper cell, regulatory T cell, and γδ T cell. Cytolytic activity (CYT) score was defined as the geometric mean of PRF1 and GZMA.Citation34
Identification of PTC-specific immune-related genes (IRGs)
Two approaches were combined to screen for PTC-specific IRGs. Weighted gene co-expression network analysis (WGCNA)Citation35 was used to construct a scale-free co-expression network using the R package ‘WGCNA’ and to identify a gene module that is mostly correlated with tissue types (PTC or normal thyroid). On the other hand, differentially expressed immune-related genes (DE-IRGs) were identified between PTC and normal thyroid samples with a filtering threshold of FDR Q value less than 0.01. The overlapping genes in the intersection of the “WGCNA-identified gene module” and “DE-IRGs” were considered as PTC-specific IRGs.
Establishment of the immune-related risk score (IRS)
Firstly, WGCNA was used to construct a gene module that is mostly correlated with both “innate immune response” and “adaptive immune response”. Then, the ‘sample’ function in R was used to randomly divide the total of 496 TCGA PTC patients into two parts (7:3) for training and testing. Using R package ‘coxph’, the values of hazard ratio (HR) and P were calculated for each gene involved in the “immune module” identified by WGCNA. Then, candidate genes with P value < .05 were used as the input of the least absolute shrinkage and selection operator (LASSO) Cox regression model. LASSO regularization adds a penalty parameter (λ) to Cox regression model, and this action can lead to zero coefficients, i.e. some of the candidate genes are completely neglected for evaluation of output. In our analysis, 15 genes retained their Cox coefficients after LASSO regularization. Based on their expression values and Cox coefficients, an immune-related risk score (IRS) for each sample was calculated as follows:
Survival analyses
The Kaplan–Meier method was used to draw survival curves, and the log-rank test was performed to evaluate survival difference. The ‘surv_cutpoint’ function of the R package ‘survminer’ was used to determine the optimal cutoff point based on the maximal log-rank statistics. Multivariate Cox regression analysis was performed to evaluate the risk significance of each variable for survival. Time-dependent concordance index (C-index) and time-dependent receiver operating characteristic (tROC) analysis were used to compare the predictive capacity of survival among different variables with R packages ‘survConcordance’ and ‘survivalROC’.
Construction of integrated prognostic models
Based on IRS and clinicopathological features, recursive partitioning analysis was performed to build an integrated survival decision tree for risk stratification with R package ‘rpart’. Using R package ‘rms’, a scoring nomogram was generated with detailed parameters including radiotherapy, gender, BRAF status, histological variant, age, TNM stage, and IRS, and calibration curves for 3- and 5-year PFS were plotted and compared with actual PFS.
Additional bioinformatic and statistical analyses
Differentially expressed genes were identified using R package ‘limma’ for microarray data or ‘DESeq2ʹ for RNA-seq reads count data. The correlation network involving different immune cell types was generated using R package ‘corrr’. Different immune clusters were identified with the PTC-specific IRGs expression matrix using non-negative matrix factorization (NMF, R package ‘NMF’), and the optimal factorization of k value was selected when the magnitude of the cophenetic correlation coefficient begins to fall. Principal component analysis (PCA) was used to visualize dissimilarity among different groups. The levels of innate and adaptive immune activity were quantified using a single-sample gene set enrichment analysis (ssGSEA) algorithm based on the transcriptome data and corresponding gene sets retrieved from Molecular Signatures Database (MSigDB).Citation36 Random forest algorithm (R package ‘randomForest’) was applied to screen for the most important candidates correlated with different PTC variants with two parameters ‘mtry’ and ‘ntree’ of optimal values. Potential immune checkpoint blockade (ICB) therapy response was predicted with the Tumor Immune Dysfunction and Exclusion (TIDE) algorithm.Citation37 Gene Ontology enrichment analysis was performed using a webtool named Metascape (https://metascape.org/).Citation38 Protein–protein interaction (PPI) network was generated to reflect the interactions among representative genes involved in a specific biological process using R package ‘STRINGdb’. Connectivity Map (CMap)Citation39 was used to explore potential targets and applicable drugs for IRS-high PTC patients. CMap is a resource that uses transcriptional expression data to probe relationships between disease, cell physiology, and therapeutics. The most significantly upregulated 150 genes in IRS-high PTC samples were chosen for analysis because CMap has a gene list size restriction of less than 150. Student’s t-test or one-way analysis of variance (ANOVA) was used to analyze differences between groups in variables with a normal distribution. Categorical variables between the two groups were compared using the chi-square test. A value of P < .05 was considered statistically significant.
Results
Identification of a set of 307 PTC-specific IRGs
Firstly, GSE33630 including 49 PTC and 45 normal thyroid samples was used as a discovery cohort due to its appropriate sample size. To evaluate the infiltrating levels of immune and stromal cells involved in tumor microenvironment (TME), two algorithms xCell and ESTIMATE were applied based on the transcriptome data of the 49 PTC samples. illustrate that cumulative proportion curves of immune scores (red lines) were continuously distributed at the right side of stromal scores (blue lines) in both xCell and ESTIMATE analyses, which means immune scores are always significantly higher than stromal scores, indicating the predominant role of immune infiltration in PTC TME. The infiltrating abundance of various immune cells was estimated using xCell, and the correlation network reflects the comprehensive relationships among different immune cell types (). Subsequently, WGCNA was performed with the IRGs expression matrix of 94 samples and their sample category (tumor or normal thyroid) to construct a scale-free co-expression network (). Three gene modules were generated with a power of 2 as the optimal soft threshold (). Among these modules, the blue module exhibited the highest correlation with sample category (|r| = 0.9, P = 4e-35) and was considered as “PTC-specific module” (). On the other hand, limma algorithm was used to identify a total of 492 DE-IRGs between PTC and normal thyroid samples with a filtering threshold of FDR Q value less than 0.01 (). Finally, 307 overlapping genes in the intersection of “PTC-specific module” and “DE-IRGs” were considered as “PTC-specific IRGs” () and the detailed information is shown in Supplementary Table 1.
Figure 1. A set of 307 PTC-specific IRGs were identified. Cumulative proportion curves showed that the immune scores were continuously distributed at the significantly higher side compared with stromal scores in both (a) xCell and (b) ESTIMATE outputs, indicating the predominant role of immune infiltration in PTC tumor microenvironment (TME). (c) A correlation network reflects the comprehensive relationships among different immune cell types involved in PTC TME. (d) The weighted gene co-expression network analysis (WGCNA) was performed with the IRGs expression matrix of 94 samples and their sample category (tumor or normal thyroid) to construct a scale-free co-expression network. (e) Three gene modules were generated, and a blue module exhibited the highest correlation with sample category (|r| = 0.9, P = 4e-35) and was considered as “PTC-specific module”. (f) Limma algorithm was used to identify a total of 492 DE-IRGs between PTC and normal thyroid samples with a filtering threshold of FDR Q value less than 0.01. (g) 307 overlapping genes in the intersection of “PTC-specific module” and “DE-IRGs” were considered as “PTC-specific IRGs”. DE-IRGs: differentially expressed immune-related genes. (h) PCA analysis demonstrated that PTC and normal thyroid samples were clearly separated as two distinct groups in the discovery cohort with the 307 PTC-specific IRGs expression matrix. (i-k) Three datasets (GSE60542, GSE3467, GSE3678) were used to validate the discriminative capacity of the 307 PTC-specific IRGs, and the dissimilarity between different sample categories was visualized in PCA analysis.
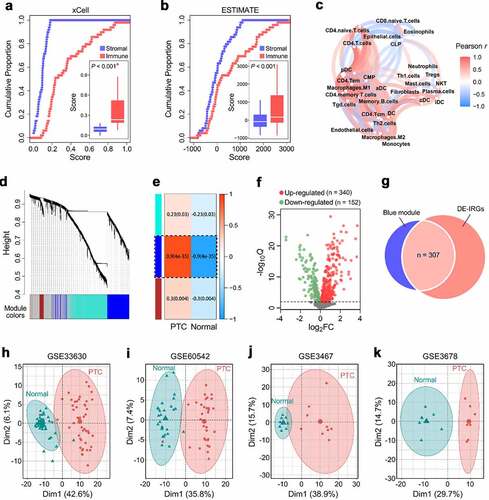
PCA analysis demonstrated that PTC and normal thyroid samples were clearly separated as two distinct groups in the discovery cohort with the 307 PTC-specific IRGs expression matrix (). Furthermore, three datasets (GSE60542, GSE3467, GSE3678) were used to validate the discriminative capacity of the 307 PTC-specific IRGs, and the dissimilarity between different sample categories was visualized in PCA analysis (). These evidences demonstrated that the 307 PTC-specific IRGs were unique IRGs of PTC, and had a strong discriminability for PTC and normal tissues.
Two distinct immune clusters were identified with PTC-specific IRGs
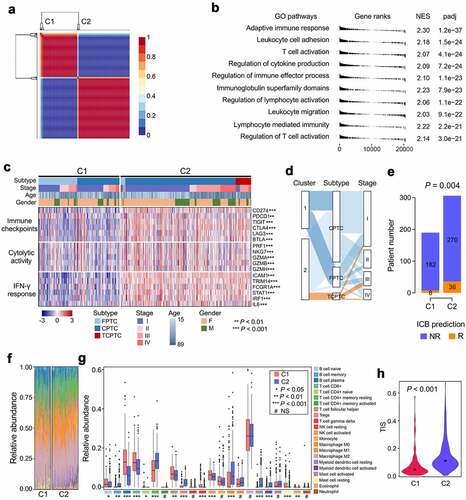
Then, we attempted to classify PTC samples into different immune clusters using the identified 307 PTC-specific IRGs. Based on the expression matrix of 307 PTC-specific IRGs, the TCGA PTC cohort (n = 496) were divided into two distinct immune clusters (C1 and C2, ) with the optimal NMF k value of 2 (supplementary Figure 1). GSEA analysis demonstrated that C2 exhibited significantly higher activity of various immune processes compared with C1, and the most significantly altered pathway was presented as “adaptive immune response” among all the gene sets from Gene Ontology (). A comprehensive heatmap illustrates the differences of clinicopathological features, immune checkpoints, cytolytic activity signature, and IFN-γ response signature between the two clusters (). A Sankey diagram depicts the flow from the two immune clusters to different variants and pathological stages, in which the width of the flow rate is proportional to the patient number (). In the TCGA PTC cohort, TCPTC exhibited worse PFS than FPTC and CPTC (supplementary Figure 2), and we observed that all the tall-cell variant PTC (TCPTC) samples were exclusively classified to C2 while most follicular variant (FPTC) samples were classified to C1 (). Further, TIDE algorithm was applied to evaluate the potential ICB response of each PTC sample, and we observed the proportion of responders is significantly elevated in C2 (P = .004; ). However, no significant difference of TMB distribution was observed between either the two immune clusters (P = .891) or patients with different ICB responses (P = .237) (supplementary Figure 3a & b). A stacked barplot illustrated the distinct patterns of the relative abundance of 22 immune cell types in the two immune clusters, and we observed macrophage M2 accounts for the highest proportion among all the immune cells (). Most of the immune cell types were differentially distributed between the two immune clusters (). The T cell infiltration score (TIS) was significantly elevated in C2 compared with C1 (P < .001; ), and this result is mainly attributed to significant increases of naïve CD4+ cells and Tregs in C2 (). These evidences indicated significant differences in intrinsic tumor immunogenicity and potential immunotherapy response between the two immune clusters.
Figure 2. Two distinct immune clusters were identified with PTC-specific IRGs. (a) Based on the expression matrix of 307 PTC-specific IRGs, the TCGA PTC cohort (n = 496) were divided into two distinct immune clusters (C1 and C2) with the optimal NMF k value of 2. (b) GSEA analysis demonstrated that C2 exhibited significantly higher activity of various immune processes compared with C1. GO: gene ontology; NES: normalized enrichment score; padj: adjusted P value. (c) A comprehensive heatmap illustrates the differences of clinicopathological features, immune checkpoints, cytolytic activity signature and IFN-γ response signature between the two clusters. (d) A Sankey diagram depicts the flow from the two immune clusters to different variants and pathological stages, in which the width of the flow rate is proportional to the patient number. (e) TIDE algorithm was applied to evaluate the potential ICB response of each PTC sample, and the proportion of responders is significantly elevated in C2 (P = .004). ICB: immune checkpoint blockade; NR: non-responder; R: responder. (f) A stacked barplot illustrated the distinct patterns of the relative proportion of 22 immune cell types in the two immune clusters, and macrophage M2 accounts for the highest proportion among all the immune cells. (g) Most of the 22 immune cell types were differentially distributed between the two immune clusters. NS: no significance. (h) T cell infiltration score (TIS) was significantly elevated in C2 compared with C1 (P < .001).
Mutational landscape and immune characterization in PTC variants
Considering immune infiltration is always strongly associated with mutation in solid tumors, we investigated the immune characterization, mutational landscape, and their relationships in different PTC variants. Oncoplots were generated for the three variants including FPTC, classical type (CPTC) and TCPTC respectively, and top 10 frequently mutated genes in each variant were ranked (). A community structure plot depicts the common frequent mutations shared by the three variants, and BRAF mutation was observed as the only overlapping mutation (). Interestingly, BRAF mutation frequency was stepwisely increased along with the malignant level of variants (from 0.18 to 0.94; ). CIBERSORT and ESTIMATE were used to estimate the immune infiltration for each sample, and the immune infiltration scores estimated by the two algorithms were stepwisely elevated along with the malignant level ( & G; both P < .001), which might be caused by the higher heterogeneity and immunogenicity in more malignant variants.
Figure 3. Characterizations of immune and mutational landscape were analyzed in different PTC variants. (a-c) Oncoplots were generated for the three histological variants including FPTC, CPTC and TCPTC respectively, and top 10 frequently mutated genes in each variant were ranked. FPTC: follicular variant PTC; CPTC: classical PTC; TCPTC: tall-cell variant PTC. (d) A community structure plot depicts the common frequent mutations shared by the three variants, and BRAF mutation is the only overlapping mutation. (e) BRAF mutation frequency was stepwisely increased along with the malignant level of variants. (F & G) The immune infiltration score was stepwisely elevated along with the malignant level in both CIBERSORT and ESTIMATE algorithms (both P < .001). (h) Random forest algorithm was applied to screen for the most important IRGs correlated with variant classification. OOB: out-of-bag; ntree: number of decision trees. (i) Nine genes were overlapped in two ranking methods (highlighted in red). (j) GSE27155 including 15 FPTC, 26 CPTC and 10 TCPTC samples was used to validate the discriminative capacity of the nine representative IRGs, and PCA analysis demonstrated the dissimilarity among the three variants based on the nine IRGs expression matrix.
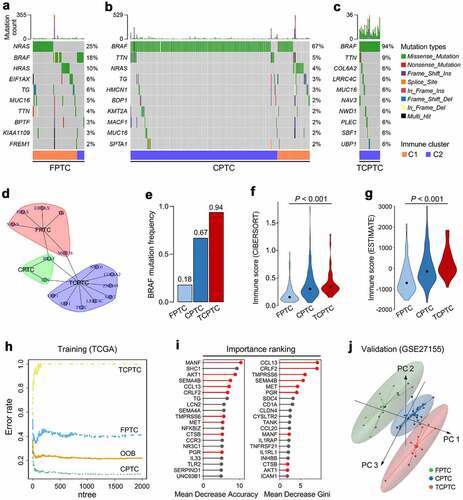
Random forest (RF) algorithm was applied to screen for the most important IRGs correlated with variants. With optimal parameter settings (mtry = 268, ntree = 2,000), the RF algorithm screened for the most important candidates based on the 307 PTC-specific IRGs expression matrix and variant classification (). 307 PTC-specific IRGs were ranked according to their importance, and nine genes (MANF, AKT1, SEMA4B, CCL13, CRLF2, TMPRSS6, MET, CTSB, PGR) were overlapped in two ranking methods (highlighted in red; ). In addition, we analyzed and compared their expression profiles among different PTC variants, and all nine genes exhibited significant differences in expression (supplementary Figure 4). Furthermore, GSE27155 including 15 FPTC, 26 CPTC and 10 TCPTC samples was used to validate the discriminative capacity of the nine representative IRGs. PCA analysis demonstrated the dissimilarity among the three variants based on the nine IRGs expression matrix in . These evidences revealed different mutational and immune characterizations in PTC variants.
Establishment and validation of immune-related risk score (IRS) in PTC patients
In the light of above findings that immune infiltration correlates with various clinicopathological features in PTC, we aimed to construct a gene expression-based scoring tool to predict PFS for PTC patients. Firstly, the performances of “innate immunity” and “adaptive immunity” in each sample were quantified using ssGSEA algorithm with corresponding gene sets retrieved from MSigDB. Then, WGCNA was performed with transcriptome data of the TCGA PTC cohort, and a green module that is mostly correlated with both innate and adaptive immunity was identified as the “immune-related module in PTC” (). The cohort of 496 TCGA PTC patients were randomly divided into two parts (7:3) for training and testing. Univariate Cox regression analysis was performed to calculate the HR and P values for the 1,562 genes involved in the “immune-related module in PTC”, and the results are shown in . With a filtering threshold of P value less than 0.05, 81 candidates remained and entered into LASSO Cox regression model (10-fold cross-validation). With an optimal λ value (), 15 genes (LCLAT1, DSC1, NUP210, C17orf99, TFR2, MMP23A, LYSMD1, C10orf54, LEF1, HNMT, NLRP3, C6orf114, BMP6, EID3, PLEKHA2) retained their individual Cox coefficients after LASSO regularization ().
Figure 4. Establishment and validation of the immune-related risk score (IRS) in PTC patients. (a) WGCNA was performed with transcriptome data of the TCGA PTC cohort, and a green module which is mostly correlated with both innate and adaptive immunity was identified as the “immune-related module in PTC”. (b) Univariate Cox regression analysis was performed to calculate the HR and P values for the 1,562 genes involved in the “immune-related module in PTC”. (c) With a filtering threshold of P value less than 0.05, 81 candidates remained and entered into LASSO Cox regression model, and (d) 15 genes were finally filtered with their individual coefficients to construct a prognostic immune-related signature. coef: Cox coefficient. (e) Kaplan-Meier analysis demonstrated that patients with higher IRS exhibited worse prognosis in the training set (HR = 15.90, 95% CI = 7.991–31.63, P < .001). PFS: progression-free survival. (f) In the multivariate Cox regression, IRS was the only independent risk factor among all the variables (P < .001). M: male; F: female; Mut: mutation; WT: wild type; C: CPTC; F: FPTC; TC: TCPTC. (g) IRS’s C-index ranked first among all the variables. C-index: concordance index. (h) In the testing cohort, Kaplan-Meier analysis showed that patients with higher IRS exhibited worse prognosis (HR = 4.707, 95% CI = 1.819–12.18, P = .0071), and (i) multivariate Cox regression analysis demonstrated that IRS was the only independent risk factor (P = .019), and (j) IRS’s C-index ranked first among all the variables.
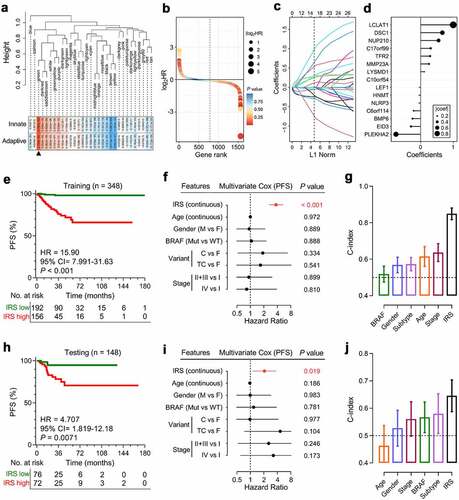
Using the established formula, the immune-related risk score (IRS) was calculated for each sample. With a best cutoff value, the training set is divided into IRS-low and -high groups. Kaplan–Meier analysis demonstrated that patients with higher IRS exhibited worse progression-free survival (PFS) in the training set (HR = 15.90, 95% CI = 7.991–31.63, P < .001; ). Multivariate Cox regression analysis was performed on six variables including IRS (continuous value), age (continuous value), gender (male or female), BRAF status (mutation or wild type), variants (FPTC, CPTC, or TCPTC) and pathological stage (I–IV), and result showed that IRS was the only independent risk factor among all the variables (P < .001; ). In addition, IRS’s C-index ranked first among all the variables (). As expected, similar results were observed in the testing cohort. The Kaplan–Meier analysis showed that patients with higher IRS exhibited worse prognosis (HR = 4.707, 95% CI = 1.819–12.18, P = .0071; ), and multivariate Cox regression analysis demonstrated that IRS was still the only independent risk factor (P = .019; ). In the testing cohort, IRS’s C-index still ranked first, which suggested the most powerful predictive capacity among all the variables (). In addition, univariate Cox regression analysis was performed on the 15 IRS-relevant genes in the total 496 TCGA PTC patients, respectively. The results were summarized as a forest plot in supplementary Figure 5. In other words, the established immune-related risk score is not only an independent risk factor for PFS, but also a promising survival predictor superior to conventional clinicopathological features.
Construction of integrated prognostic models for individual PTC patients
Next, we proposed an integrated prognostic model via the combination of IRS and other clinicopathological features to improve risk stratification and to personalize risk assessment. A total of 461 TCGA PTC patients with full-scale clinical annotations including radiotherapy (or not), gender, age, variant, pathological stage, and BRAF status were extracted to construct integrated prognostic models. Firstly, recursive partitioning analysis was performed to build a survival decision tree to optimize the risk stratification. As shown in the decision tree (), three risk subgroups were defined based on two components including IRS as the leading parameter together with pathological stage. In detail, patients with low IRS were defined as “low risk” group, while “intermediate risk” and “high risk” groups were defined as “High IRS & stage I/II” and “High IRS & stage III/IV”, respectively. Significant differences of PFS were observed among the three risk subgroups (P < .001; ).
Figure 5. Construction of integrated prognostic models for individual PTC patients. (a) A survival decision tree was built to optimize the prognostic stratification. (b) Significant differences of PFS were observed among the three risk subgroups (P < .001). (c) A personalized scoring nomogram was generated to predict 3- and 5-year PFS probability with the seven parameters, and the arrow shows an example. (d) Calibration curves of 3-year (blue dotted line) and 5-year (red dotted line) PFS prediction were close to the ideal performance (45-degree line). (e) Time-dependent ROC analysis demonstrated that the nomogram exhibited much more powerful capacity of survival prediction compared with conventional clinicopathological characteristics, with an average AUC above 0.8 during a follow-up of 5 years. AUC(t): time-dependent area under the ROC curve.
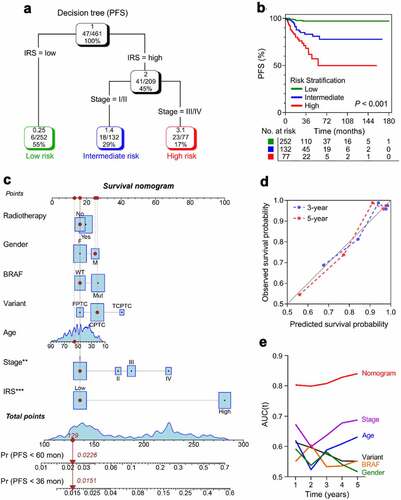
With a goal of quantifying the risk assessment for individual PTC patients, a personalized scoring nomogram was generated to predict 3- and 5-year PFS probability with the seven parameters, and the arrow shows an example (). Calibration curves of 3-year (blue dotted line) and 5-year (red dotted line) PFS prediction were close to the ideal performance (45-degree line), which indicated the predictive accuracy of the nomogram (). Time-dependent ROC analysis demonstrated the nomogram exhibited much more powerful capacity of survival prediction compared with other clinicopathological characteristics, with an average AUC above 0.8 during a follow-up of 5 years (). Overall, the integrated prognostic models could greatly optimize risk stratification and predict PFS for PTC patients accurately.
Genomic alterations and altered pathways were compared in different immune-related risk groups
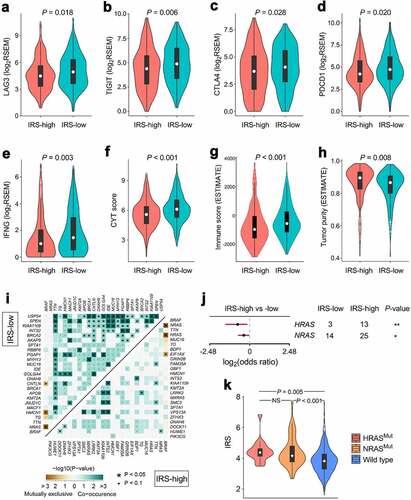
To explore the genomic alterations, altered pathways and potential applicable drugs correlated with different immune-related risk groups, we performed further bioinformatic analyses. Compared with IRS-high samples, some representative immune checkpoints including LAG3, TIGIT, CTLA4, and PDCD1 were significantly elevated in IRS-low ones (). In addition, IRS-low cohort was characterized with significantly higher IFNG expression, CYT score and immune score, and lower tumor purity (). As regards mutational features, more co-occurrence mutations were observed in IRS-low cohort when compared with IRS-high cohort (). With a threshold of P < .05 using Fisher’s exact test, differentially mutated genes were detected between the two cohorts. Interestingly, HRAS and NRAS were the only two significant differentially mutated genes detected between IRS-high and -low cohorts (). When compared with HRAS and NRAS wild-type samples, IRS was significantly elevated in HRASMut or NRASMut samples ().
Figure 6. Different immune characteristics and mutational patterns were observed between IRS-high and -low cohorts. (a-d) Compared with IRS-high samples, representative immune checkpoints including LAG3, TIGIT, CTLA4 and PDCD1 were significantly elevated in IRS-low ones, and (e-h) IRS-low cohort was characterized with significantly higher IFNG expression, CYT score and immune score, and lower tumor purity. RSEM: RNA-Seq by Expectation-Maximization. (i) More co-occurrence mutations were observed in IRS-low cohort when compared with IRS-high cohort. (j) With a threshold of P < .05 using Fisher’s exact test, HRAS and NRAS were the only two significant differentially mutated genes detected between IRS-high and -low cohorts. (k) IRS was significantly elevated in HRASMut or NRASMut samples compared with HRAS and NRAS wild type samples. NS: no significance.
To investigate the altered pathways underlying IRS in PTC, DEGs between IRS-low and -high samples were identified and submitted for Gene Ontology enrichment analysis, respectively. Most of the significantly downregulated genes in IRS-high samples were enriched in immune-related biological processes such as “leukocyte migration” as the most important term (). Based on the STRING database, a PPI network was generated to reveal interactions among representative genes involved in “leukocyte migration” (). Considering IL-6 acts as a pivotal regulator in both innate and adaptive immunity, we therefore investigated its expression profile in normal thyroid and different IRS groups (P < .001; ). Similarly, significantly upregulated genes in IRS-high samples were identified and were mainly enriched in cellular responses to external environment such as “DNA repair” (). Representative genes involved in “DNA repair” were used to construct a PPI network (), and the expression profile of a critical checkpoint gene CHEK1 was further investigated in normal thyroid and different IRS groups (P < .001; ). Considering high IRS indicated an increased ability of “DNA repair”, we performed GSEA with gene set “response to radiation therapy” and observed that IRS-high samples exhibited weaker response to radiation therapy compared with IRS-low samples (). To confirm this finding, 299 TCGA PTC patients who received radiation therapy in record were divided into two parts (IRS-low and -high), and we observed that patients with higher IRS exhibited much worse prognosis (HR = 19.63, 95% CI = 10.39–37.11, P < .001; ), which suggested IRS might serve as a potential indicator to predict resistance to radiation therapy. Univariate Cox regression analysis was applied to measure the prognostic performances of the 15 IRS-relevant genes in the 299 TCGA PTC patients who received radiation therapy, and the results were summarized as a forest plot in supplementary Figure 6.
Figure 7. Altered pathways and potential applicable drugs underlying IRS were investigated. (a) Most of the significantly downregulated genes in IRS-high samples were enriched in immune-related biological processes such as “leukocyte migration” as the most important term. (b) A protein-protein interaction network was generated to reveal interactions among representative genes involved in “leukocyte migration”. (c) IL-6 acts as a pivotal regulator in both innate and adaptive immunity, and its expression profile was investigated in normal thyroid and different IRS groups (P < .001). (d) Significantly upregulated genes in IRS-high samples were mainly enriched in cellular responses to external environment such as “DNA repair”. (e) Representative genes involved in “DNA repair” were used to construct a protein-protein interaction network, and (f) the expression profile of a critical checkpoint gene CHEK1 was investigated in normal thyroid and different IRS groups (P < .001). (g) GSEA showed that IRS-high samples exhibited weaker response to radiation therapy compared with IRS-low samples. ES: enrichment score. (h) Among 299 TCGA PTC patients who received radiation therapy, patients with higher IRS exhibited much worse prognosis (HR = 19.63, 95% CI = 10.39–37.11, P < .001). (i) CMap mode-of-action (MoA) analysis revealed 39 mechanisms of action shared by top 50 compounds potentially applicable for IRS-high patients.
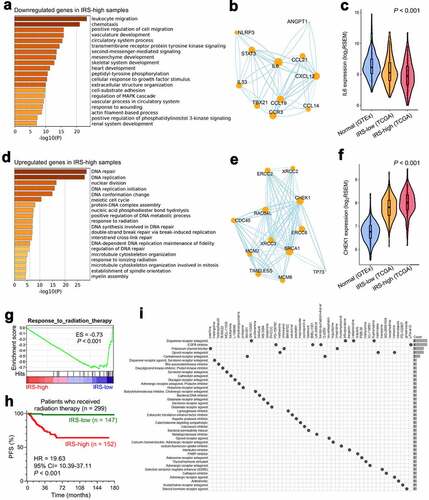
Recent polypharmacology studies suggest the need to design compounds that target multiple genes or molecular pathways. A list of top 150 upregulated genes in IRS-high samples were submitted to CMap to identify potential drugs applicable for IRS-high patients. CMap mode-of-action (MoA) analysis revealed 39 mechanisms of action shared by 50 compounds with the highest prediction scores (). In particular, four compounds, namely GR-103691, trifluoperazine, l-stepholidine and fluphenazine, shared the MoA of dopamine receptor antagonist. Their chemical structural formulas were shown in supplementary Figure 7a-D, and a common target named HRH1 was shared by the four compounds (supplementary Figure 7e).
In summary, immune checkpoints and cytolytic activity were significantly elevated in IRS-low group, while higher mutation frequency of HRAS and NRAS was observed in IRS-high group. High IRS might contribute to DNA repair in PTC and thus to promote resistance to radiotherapy. In addition, some potential targets and applicable drugs were probed using CMap database.
Discussion
To avoid immune destruction is a hallmark of cancer.Citation40 In the initial step of developing malignancy, a normal cell must acquire not only intrinsic characteristics such as activation of driver genes, uncontrolled proliferation and resistance to apoptosis, but also an important external factor: escape from immune killing. While developed into malignant cells, cancer cells continue evading the anti-cancer immune response and proceed to form tumors. On the other hand, the immunosurveillance exerted by heterogenous immune cells within the TME allows the immune system to monitor potentially dangerous neoplasia in the body and typically prevents the manifestation of cancerous growth.Citation10 The unity of opposites between cancer cells and immune system proposed a promising strategy: Positive modulations of the immune system such as enhancement of immunosurveillance in quantity or/and quality could inhibit tumorigenesis and tumor progression.
Aiming to interrupt the escape from immune surveillance, immunotherapeutic agents that target immune checkpoints including PD-L1/PD-1 and CTLA-4 have exhibited promising survival benefits in patients with metastatic melanoma, non-small cell lung cancer, and metastatic renal cancer in recent years.Citation13–15 In consideration of these achievements, there has been a strong interest in the immunotherapeutic effects across other solid cancers. However, the potential relationships among the immune infiltration, somatic mutations and clinical outcomes in PTC still remain unclear.
In this study, we investigated the immune landscape in PTC. Different algorithms including xCell, ESITMATE, and CIBERSORT were, respectively, conducted to estimate immune scores, stromal scores, absolute or relative infiltrating abundance of heterogeneous immune cells in PTC samples. A set of PTC-specific IRGs were identified, and these representative IRGs could discriminate PTC and normal thyroid tissues effectively in different datasets. Based on the NMF algorithm, two distinct immune clusters (C1 and C2) were identified in the TCGA PTC cohort, and significantly different immune activities were observed between the two clusters. In addition, the landscapes of immune checkpoints, cytolytic activity signature and IFN-γ signature were further investigated in the two NMF-identified immune clusters. We observed that all the gene markers were significantly elevated in C2, which indicated the differences in intrinsic tumor immunogenicity. More importantly, TIDE algorithm predicts significantly higher proportion of ICB responders in C2, which suggests different potential responses to ICB therapy in the two immune clusters. Interestingly, in contrast, no significant difference of TMB distribution was observed between either the two immune clusters or patients with different ICB responses. These findings indicated that at least in PTC, TMB might not be a promising biomarker for ICB therapy.
Different characterizations of immune and mutational landscapes were also observed among different PTC histological variants. For example, all the TCPTC samples were classified into C2, while most of the FPTC samples were classified into C1. Random forest algorithm was applied to screen for the most important IRGs correlated with variant classification, and nine IRGs (MANF, AKT1, SEMA4B, CCL13, CRLF2, TMPRSS6, MET, CTSB, PGR) were finally identified. The discriminative capacity of the nine representative IRGs was further validated in a GEO dataset. These results shed some light on the revelation of the immune and mutational landscape characterizations, and their relationships in different PTC variants.
Based on innate and adaptive immunity, a prognostic immune-related signature was established and tested in the TCGA PTC cohort. Univariate and LASSO Cox regression models were combined to screen for the most robust candidate genes to establish the immune-related risk score (IRS) for individual PTC patients. After adjustment of other clinicopathological features in multivariate Cox regression analysis, IRS still exhibited powerful prognostic capacity and accurate survival prediction. The mutational landscapes, altered pathways and potential applicable drugs were further analyzed and compared in different risk groups.
Some IRS-relevant genes have been investigated in cancer prognosis. For instance, DSC1, one risk biomarker in our study, was reported to predict worse prognosis in head and neck squamous cell carcinoma and anal carcinoma.Citation41,Citation42 BMP6 acts as a protective biomarker for PTC in our study, and similarly, Katsuta E et al. reported BMP6 was significantly downregulated in breast cancer, and high expression of BMP6 predicts better survival and correlates with high immune infiltration in estrogen receptor-positive samples.Citation43 Dysregulation of NLRP3 inflammasome activation is involved in tumor pathogenesis, but its role in cancer development and progression remains controversial.Citation44 In our study, NLRP3 tends to function as a protective biomarker for PTC patients.
Furthermore, CMap database was utilized to probe potential targets and applicable drugs for IRS-high patients. Four dopamine receptor antagonists were highlighted with highest prediction scores, and HRH1 is a common target shared by the four compounds. HRH1 is a member of histamine receptor family, and it has been reported that inhibition of HRH1 could not only enhance antitumor therapeutic response in breast cancer,Citation45 but also suppress colonic tumorigenesis.Citation46 These evidences indicate that HRH1 may also be a potential target in IRS-high PTC patients.
Some previous studies have reported gene expression-based immune landscape of PTC using the TCGA data. For example, Na et al. established a thyroid differentiation score (TDS) for PTC. They observed that high TDS was significantly correlated with immune infiltration, BRAF mutation, and expression of immunosuppressive markers.Citation47 In our study, in addition to transcriptome analysis, a series of bioinformatic and machine learning methods were used to reveal immune characterization and genomic alteration in different histological variants and risk cohorts, and two integrated prognostic models (a survival decision tree and a scoring nomogram) were constructed to improve prognostic stratification and survival prediction for PTC patients. Moreover, among patients who received RAI therapy, those with higher IRS exhibited much worse prognosis, indicating high IRS might serve as a promising indicator for resistance to RAI therapy. Radiotherapy-induced cell death is thought to be immunogenic and results in modulation of lymphocyte effector function in TME.Citation48 These evidences indicate that RAI therapy synergizing with immunotherapy to enhance antitumor effects can be considered a novel promising strategy for advanced PTC.
Despite comprehensive investigation in immune and mutational characterizations of different PTC variants and risk subgroups, multimodal analyses including histopathological examination and clinical trials should be a future work to elucidate our findings and promote clinical utility as biomarkers. Compared to PTC, more malignant subtypes such as poorly differentiated thyroid cancer (PDTC) and anaplastic thyroid cancer (ATC) call for a higher demand for immunotherapy, and this issue is worth further investigation. In addition to immune infiltration abundance, the immune-evasive mechanism also acts as a characteristic of immune system dysregulation and plays an important role in PTC progression.Citation49,Citation50 The combined effects of immune cell infiltration and cancer immune evasion on PTC should be considered in future studies.
In conclusion, our study gained some insight into the immune landscape within PTC TME, and provided useful clues for introducing immune-based molecular classification into risk stratification and guiding ICB therapy decision-making.
Ethics approval and consent to participate
This study is based on published or public datasets and does not require ethical approval and consent.
Author contributions
Minglun Li, Chuan Su, and Claus Belka conceived and planned the study design; Jing Sun and Run Shi performed formal analysis and data interpretation; Jing Sun, Run Shi, and Minglun Li wrote the original draft; Xiaowen Zhang, Da Fang, Josefine Rauch, Shun Lu, Xuanbin Wang, Lukas Käsmann, and Jing Ma provided critical revisions and contributed to the editing of the paper. All authors read and approved the final manuscript.
Declaration of competing interest
The authors declare no potential conflicts of interest.
Data availability
All presented data in this study are available from the corresponding author upon reasonable request.
Supplemental Material
Download ()Acknowledgments
We greatly thank the China Scholarship Council (CSC) for supporting the work of Jing Sun and Run Shi.
Supplementary material
Supplemental data for this article can be accessed on the publisher’s website
Correction Statement
This article has been republished with minor changes. These changes do not impact the academic content of the article.
Additional information
Funding
References
- Siegel RL, Miller KD, Jemal A. Cancer statistics, 2020. CA Cancer J Clin. 2020;70(1):7–14. doi:10.3322/caac.21590.
- McQueen AS, Bhatia KS. Thyroid nodule ultrasound: technical advances and future horizons. Insights Imaging. 2015;6(2):173–188. doi:10.1007/s13244-015-0398-9.
- Cabanillas ME, McFadden DG, Durante C. Thyroid cancer. Lancet. 2016;388(10061):2783–2795. doi:10.1016/S0140-6736(16)30172-6.
- Haugen BR, Alexander EK, Bible KC, Doherty GM, Mandel SJ, Nikiforov YE, et al. 2015 American Thyroid Association management guidelines for adult patients with thyroid nodules and differentiated thyroid cancer: the american thyroid association guidelines task force on thyroid nodules and differentiated thyroid cancer. Thyroid. 2016;26(1):1–133. doi:10.1089/thy.2015.0020.
- Sipos JA, Mazzaferri EL. Thyroid cancer epidemiology and prognostic variables. Clin Oncol (R Coll Radiol). 2010;22(6):395–404. doi:10.1016/j.clon.2010.05.004.
- Ito Y, Miyauchi A, Kihara M, Fukushima M, Higashiyama T, Miya A. Overall survival of papillary thyroid carcinoma patients: a single-institution long-term follow-up of 5897 patients. World J Surg. 2018;42(3):615–622. doi:10.1007/s00268-018-4479-z.
- Junttila MR, de Sauvage FJ. Influence of tumour micro-environment heterogeneity on therapeutic response. Nature. 2013;501(7467):346–354. doi:10.1038/nature12626.
- Gonzalez H, Hagerling C, Werb Z. Roles of the immune system in cancer: from tumor initiation to metastatic progression. Genes Dev. 2018;32(19–20):1267–1284. doi:10.1101/gad.314617.118.
- Schreiber RD, Old LJ, Smyth MJ. Cancer immunoediting: integrating immunity’s roles in cancer suppression and promotion. Science. 2011;331(6024):1565–1570. doi:10.1126/science.1203486.
- Dunn GP, Old LJ, Schreiber RD. The immunobiology of cancer immunosurveillance and immunoediting. Immunity. 2004;21(2):137–148. doi:10.1016/j.immuni.2004.07.017.
- Dunn GP, Bruce AT, Ikeda H, Old LJ, Schreiber RD. Cancer immunoediting: from immunosurveillance to tumor escape. Nat Immunol. 2002;3(11):991–998. doi:10.1038/ni1102-991.
- Mellman I, Coukos G, Dranoff G. Cancer immunotherapy comes of age. Nature. 2011;480(7378):480–489. doi:10.1038/nature10673.
- Hodi FS, O’Day SJ, McDermott DF, Weber RW, Sosman JA, Haanen JB, et al. Improved survival with ipilimumab in patients with metastatic melanoma. N Engl J Med. 2010;363(8):711–723. doi:10.1056/NEJMoa1003466.
- Topalian SL, Hodi FS, Brahmer JR, Gettinger SN, Smith DC, McDermott DF, et al. Safety, activity, and immune correlates of anti-PD-1 antibody in cancer. N Engl J Med. 2012;366(26):2443–2454. doi:10.1056/NEJMoa1200690.
- Choueiri TK, Escudier B, Powles T, Mainwaring PN, Rini BI, Donskov F, et al. Cabozantinib versus everolimus in advanced renal-cell carcinoma. N Engl J Med. 2015;373(19):1814–1823. doi:10.1056/NEJMoa1510016.
- Gunda V, Gigliotti B, Ndishabandi D, Ashry T, McCarthy M, Zhou Z, et al. Combinations of BRAF inhibitor and anti-PD-1/PD-L1 antibody improve survival and tumour immunity in an immunocompetent model of orthotopic murine anaplastic thyroid cancer. Br J Cancer. 2018;119(10):1223–1232. doi:10.1038/s41416-018-0296-2.
- Gunda V, Gigliotti B, Ashry T, Ndishabandi D, McCarthy M, Zhou Z, et al. Anti-PD-1/PD-L1 therapy augments lenvatinib’s efficacy by favorably altering the immune microenvironment of murine anaplastic thyroid cancer. Int J Cancer. 2019;144(9):2266–2278. doi:10.1002/ijc.32041.
- French JD. Immunotherapy for advanced thyroid cancers - rationale, current advances and future strategies. Nat Rev Endocrinol. 2020;16(11):629–641. doi:10.1038/s41574-020-0398-9.
- Moretti S, Menicali E, Nucci N, Guzzetti M, Morelli S, Puxeddu E. THERAPY OF ENDOCRINE DISEASE Immunotherapy of advanced thyroid cancer: from bench to bedside. Eur J Endocrinol. 2020;183(2):R41–R55. doi:10.1530/EJE-20-0283.
- Bhattacharya S, Andorf S, Gomes L, Dunn P, Schaefer H, Pontius J, et al. ImmPort: disseminating data to the public for the future of immunology. Immunol Res. 2014;58(2–3):234–239. doi:10.1007/s12026-014-8516-1.
- Tomas G, Tarabichi M, Gacquer D, Hebrant A, Dom G, Dumont JE, et al. A general method to derive robust organ-specific gene expression-based differentiation indices: application to thyroid cancer diagnostic. Oncogene. 2012;31(41):4490–4498. doi:10.1038/onc.2011.626.
- Tarabichi M, Saiselet M, Tresallet C, Hoang C, Larsimont D, Andry G, et al. Revisiting the transcriptional analysis of primary tumours and associated nodal metastases with enhanced biological and statistical controls: application to thyroid cancer. Br J Cancer. 2015;112(10):1665–1674. doi:10.1038/bjc.2014.665.
- He H, Jazdzewski K, Li W, Liyanarachchi S, Nagy R, Volinia S, et al. The role of microRNA genes in papillary thyroid carcinoma. Proc Natl Acad Sci U S A. 2005;102(52):19075–19080. doi:10.1073/pnas.0509603102.
- Giordano TJ, Kuick R, Thomas DG, Misek DE, Vinco M, Sanders D, et al. Molecular classification of papillary thyroid carcinoma: distinct BRAF, RAS, and RET/PTC mutation-specific gene expression profiles discovered by DNA microarray analysis. Oncogene. 2005;24(44):6646–6656. doi:10.1038/sj.onc.1208822.
- Cancer Genome Atlas Research N. Integrated genomic characterization of papillary thyroid carcinoma. Cell. 2014;159(3):676–690. doi:10.1016/j.cell.2014.09.050.
- Consortium GT. The genotype-tissue expression (GTEx) project. Nat Genet. 2013;45(6):580–585. doi:10.1038/ng.2653.
- Shi R, Bao X, Sun J, Lu S, Belka C, Li M. Tumor microenvironment characterization in head and neck squamous carcinoma reveals distinct genomic alterations and clinical outcomes. Clin Transl Med. 2020;10(5):e187. doi:10.1002/ctm2.187.
- Shi R, Bao X, Unger K, Sun J, Lu S, Manapov F, et al. Identification and validation of hypoxia-derived gene signatures to predict clinical outcomes and therapeutic responses in stage I lung adenocarcinoma patients. Theranostics. 2021;11(10):5061–5076. doi:10.7150/thno.56202.
- Sun J, Zhao T, Zhao D, Qi X, Bao X, Shi R, et al. Development and validation of a hypoxia-related gene signature to predict overall survival in early-stage lung adenocarcinoma patients. Ther Adv Med Oncol. 2020;12:1758835920937904. doi:10.1177/1758835920937904.
- Chalmers ZR, Connelly CF, Fabrizio D, Gay L, Ali SM, Ennis R, et al. Analysis of 100,000 human cancer genomes reveals the landscape of tumor mutational burden. Genome Med. 2017;9(1):34. doi:10.1186/s13073-017-0424-2.
- Aran D, Hu Z, Butte AJ. xCell: digitally portraying the tissue cellular heterogeneity landscape. Genome Biol. 2017;18(1):220. doi:10.1186/s13059-017-1349-1.
- Yoshihara K, Shahmoradgoli M, Martinez E, Vegesna R, Kim H, Torres-Garcia W, et al. Inferring tumour purity and stromal and immune cell admixture from expression data. Nat Commun. 2013;4:2612. doi:10.1038/ncomms3612.
- Chen B, Khodadoust MS, Liu CL, Newman AM, Alizadeh AA. Profiling tumor infiltrating immune cells with CIBERSORT. Methods Mol Biol. 2018;1711:243–259. doi:10.1007/978-1-4939-7493-1_12.
- Rooney MS, Shukla SA, Wu CJ, Getz G, Hacohen N. Molecular and genetic properties of tumors associated with local immune cytolytic activity. Cell. 2015;160(1–2):48–61. doi:10.1016/j.cell.2014.12.033.
- Langfelder P, Horvath S. WGCNA: an R package for weighted correlation network analysis. BMC Bioinform. 2008;9:559. doi:10.1186/1471-2105-9-559.
- Liberzon A, Birger C, Thorvaldsdottir H, Ghandi M, Mesirov JP, Tamayo P. The molecular signatures database (MSigDB) hallmark gene set collection. Cell Syst. 2015;1(6):417–425. doi:10.1016/j.cels.2015.12.004.
- Jiang P, Gu S, Pan D, Fu J, Sahu A, Hu X, et al. Signatures of T cell dysfunction and exclusion predict cancer immunotherapy response. Nat Med. 2018;24(10):1550–1558. doi:10.1038/s41591-018-0136-1.
- Zhou Y, Zhou B, Pache L, Chang M, Khodabakhshi AH, Tanaseichuk O, et al. Metascape provides a biologist-oriented resource for the analysis of systems-level datasets. Nat Commun. 2019;10(1):1523. doi:10.1038/s41467-019-09234-6.
- Subramanian A, Narayan R, Corsello SM, Peck DD, Natoli TE, Lu X, et al. A next generation connectivity map: L1000 platform and the first 1,000,000 profiles. Cell. 2017;171(6):1437–1452 e1417. doi:10.1016/j.cell.2017.10.049.
- Hanahan D, Weinberg RA. Hallmarks of cancer: the next generation. Cell. 2011;144(5):646–674. doi:10.1016/j.cell.2011.02.013.
- Wang Y, Chen C, Wang X, Jin F, Liu Y, Liu H, et al. Lower DSC1 expression is related to the poor differentiation and prognosis of head and neck squamous cell carcinoma (HNSCC). J Cancer Res Clin Oncol. 2016;142(12):2461–2468. doi:10.1007/s00432-016-2233-1.
- Myklebust MP, Fluge O, Immervoll H, Skarstein A, Balteskard L, Bruland O, et al. Expression of DSG1 and DSC1 are prognostic markers in anal carcinoma patients. Br J Cancer. 2012;106(4):756–762. doi:10.1038/bjc.2011.548.
- Katsuta E, Maawy AA, Yan L, Takabe K. High expression of bone morphogenetic protein (BMP) 6 and BMP7 are associated with higher immune cell infiltration and better survival in estrogen receptorpositive breast cancer. Oncol Rep. 2019;42(4):1413–1421. doi:10.3892/or.2019.7275.
- Moossavi M, Parsamanesh N, Bahrami A, Atkin SL, Sahebkar A. Role of the NLRP3 inflammasome in cancer. Mol Cancer. 2018;17(1):158. doi:10.1186/s12943-018-0900-3.
- Fernandez-Nogueira P, Noguera-Castells A, Fuster G, Recalde-Percaz L, Moragas N, Lopez-Plana A, et al. Histamine receptor 1 inhibition enhances antitumor therapeutic responses through extracellular signal-regulated kinase (ERK) activation in breast cancer. Cancer Lett. 2018;424:70–83. doi:10.1016/j.canlet.2018.03.014.
- Shi Z, Fultz RS, Engevik MA, Gao C, Hall A, Major A, et al. Distinct roles of histamine H1- and H2-receptor signaling pathways in inflammation-associated colonic tumorigenesis. Am J Physiol Gastrointest Liver Physiol. 2019;316(1):G205–G216. doi:10.1152/ajpgi.00212.2018.
- Na KJ, Choi H. Immune landscape of papillary thyroid cancer and immunotherapeutic implications. Endocr Relat Cancer. 2018;25(5):523–531. doi:10.1530/ERC-17-0532.
- Walle T, Martinez Monge R, Cerwenka A, Ajona D, Melero I, Lecanda F. Radiation effects on antitumor immune responses: current perspectives and challenges. Ther Adv Med Oncol. 2018;10:1758834017742575. doi:10.1177/1758834017742575.
- Al-Abdallah A, Jahanbani I, Mehdawi H, Ali RH, Al-Brahim N, Mojiminiyi O, et al. Down-regulation of the human major histocompatibility complex class I chain-related gene A (MICA) and its receptor is mediated by microRNA-146b-5p and is a potential mechanism of immunoediting in papillary thyroid carcinoma. Exp Mol Pathol. 2020;113:104379. doi:10.1016/j.yexmp.2020.104379.
- Stenman A, Backman S, Johansson K, Paulsson JO, Stalberg P, Zedenius J, et al. Pan-genomic characterization of high-risk pediatric papillary thyroid carcinoma. Endocr Relat Cancer. 2021;28(5):337–351. doi:10.1530/ERC-20-0464.