
ABSTRACT
Glioma is emerging as an aggressive type of glioma characterized by invasive growth pattern and dismal oncologic outcomes. microRNAs (miRNAs) have been attracting research attention in tumorigenesis. Herein, the aim of the current investigation was to explore the functional role of mesenchymal stem cells (MSCs)-derived extracellular vesicles (EVs) containing miR-503 in glioma. The glioma tissues and corresponding normal brain tissues were collected from patients with glioma, followed by quantification of miR-503, kinesin family member 5A (KIF5A) and interleukin-7 (IL-7). EVs were isolated from bone marrow MSCs and identified by transmission electron microscope and nanoparticle tracking analysis. EVs from miR-503 mimic-transfected MSCs, miR-503 agomir,, oe-KIF5A, or sh-IL-7 was delivered into glioma cells to determine their effects on biological behaviors of glioma and T cells as well as the release of immunosuppressive factors. Lastly, a mouse model of glioma was developed to validate the function in vivo. miR-503 was expressed at a high level in glioma tissues while KIF5A was poorly expressed and targeted by miR-503. Furthermore, miR-503 loaded in MSC-EVs or upregulated miR-503 was demonstrated to facilitate glioma cell proliferation, migration and invasion accompanied by promoted release of immunosuppressive factors. Effects of overexpressed KIF5A on T cell behavior modulation were dependent on the IL-7 signaling pathway. Such results were reproduced in mice with glioma. Collectively, the discovery of miR-503 incorporated in MSC-EVs being a regulator that controls immune escape in glioma provides a novel molecular insight that holds promises to develop therapeutic strategies against glioma.
Introduction
Human gliomas are the most prevalent and lethal brain tumors, accounting for 70% of malignant primary brain tumors in adults, with high invasiveness and recurrence.Citation1 Glioma, the grade IV gliomas, possesses the worst prognosis. Even in the presence of standard radiation and chemotherapy, patients with glioma have a median survival of less than fifteen months.Citation2 Glioma is characterized by significant intertumoral and intratumoral heterogeneity that contributes to a profound challenge to developing effective therapy for individual patient.Citation3 Recently, immunotherapy has been suggested as a new approach for various refractory cancers, which promotes the development of immune therapeutic strategies that usurp the power of a patient’s immune system to recognize and eliminate residual glioma cells.Citation4 However, these strategies are often limited by the profound immune suppression mediated by glioma microenvironment.
Extracellular vesicles (EVs), nano-sized vesicles (30 to 100 nm in diameter), have been recognized as critical regulators of brain tumors by the delivery of oncogenic proteins, receptors, and small RNAs that may support brain tumor progression, including glioma.Citation5 EVs have also shown to affect host anti-tumor immune response and tumor cell immune escape in glioma.Citation6 EVs are released by both normal and diseased cells including mesenchymal stem cells (MSCs).Citation7 The pluripotency and immunoregulation of MSCs can facilitate tumor development, progression and even metastasis in glioma.Citation8 microRNA-503 (miR-503) serves as an upregulated miR in glioma from previous evidence and functionally facilitates glioma cell proliferation.Citation9 A web-available bioinformatic prediction shows kinesin-1 (KIF5) as a putative target gene of miR-503. KIF5 family members are microtubule-dependent molecular motors that consist of KIF5A, KIF5B, and KIF5C. Among the KIF5s, KIF5A is neuron specific and highly expressed in the central nervous system, which is required for neuronal function.Citation10 Mutation of KIF5A is linked with the pathogenesis of neurological diseases.Citation11 Evidence shows that peripheral immunization by combining interleukin-7 (IL-7)- and interferon-gamma (IFNγ)-producing tumor cells prolong survival in two rat glioma models.Citation12 Herein, we proposed a prevailing hypothesis that MSC-derived EVs transfer miR-503 to glioma cells, and overexpressed miR-503 enhances glioma immune escape.
Materials and methods
Ethics statement
The study was conducted with the approval of the Ethics Committee of The First Hospital of Qiqihar & Affiliated Qiqihar Hospital, Southern Medical University. Each participant signed written informed consent prior to the study. Experiments involving human beings were performed in strict accordance with the Declaration of Helsinki. The experimental animals were treated according to the Guide for the Care and Use of Laboratory Animals.
Study subjects
In total, 66 patients (35 males, 31 females, median age: 43 years ranging from 18 to 75 years, with 34 cases ≤43 years old and 32 cases >43 years old) who were diagnosed as glioma and experienced resection in The First Hospital of Qiqihar & Affiliated Qiqihar Hospital, Southern Medical University between 1st January 2015 and 1st January 2017 were enrolled in our study. There were 28 cases of glioma localized at the frontal lobe, 11 cases at the temporal lobe and 27 cases at the occipital lobe. Considering the pathological types, 43 cases were confirmed as low-graded astrocytoma, 14 cases as anaplastic oligodendroglioma and 9 cases as glioblastoma. There were 37 cases of low-grade glioma and 29 cases of high-grade glioma. Patients were considered qualified if they met the following criteria: (1) glioma was suggested by enhanced magnetic resonance imaging (MRI) and magnetic resonance spectroscopy before operation and pathologically confirmed after resection; (2) patients were subjected to operation for the first time without reoperation for recurrence; (3) patients were not treated by radiotherapy or chemotherapy before operation. In addition, 30 patients (19 males, 11 females, median age: 41 years ranging from 22 to 75 years) who experienced intracranial decompression during the corresponding period were enrolled if they met the following criteria: (1) patients were diagnosed as hypertensive cerebral hemorrhage; (2) normal brain tissues in the nonfunctional area were confirmed for collection during operation. The rotten fish-like tumor tissues were resected and made into three tissue blocks (diameter = 1 cm) while another three normal brain tissue blocks (diameter = 1 cm) in the nonfunctional area were obtained. All tissue samples were stored in liquid nitrogen and further transferred in a refrigerator at −80°C for further experiments.
Cell culture
Human astrocytoma cell line U-251 MG (JK-CS0022, Shanghai Jingkang Bioengineering Co., Ltd., Shanghai, China; https://shjingk.biomart.cn/), murine glioma cell line GL261 (fk-hy186 J, Shanghai Yan Mu Industrial Co., Ltd. Shanghai, China; https://fanketech.biomart.cn), and human bone marrow MSCs (MZ-0958, Ningbo Mingzhou Biotechnology Co., Ltd., Zhejiang, China) were used. The cells were cultured in Dulbecco’s Modified Eagle’s medium (DMEM) supplemented with 10% fetal bovine serum (FBS), 50 μIU/mL penicillin and 50 μg/mL streptomycin sulfate in moist air with 5% CO2 at 37°C. Human bone marrow was isolated from three patients with osteonecrosis of the femoral head in The First Hospital of Qiqihar & Affiliated Qiqihar Hospital, Southern Medical University. The extracted bone marrow fluid was diluted and mixed with an equal volume of PBS, centrifuged at 1500 rpm for 10 min at room temperature. After the fat layer was discarded, the diluted bone marrow fluid was slowly added to the equal volume of Ficoll separation solution along the wall of the centrifuge tube, and centrifuged at 2500 rpm for 30 min at room temperature to obtain the mononuclear cells in the albuginea-like layer, followed by suspension in PBS and centrifugation at 1500 rpm at room temperature for 10 min. The supernatant was discarded. The cells were resuspended in a special medium for bone marrow MSCs containing 10% FBS, adjusted to a suitable cell density, seeded in a culture flask, and placed in a 37°C, 5% CO2 incubator for culture.
Cell treatment
The glioma cells were seeded in a 6-well plate or 6-cm petri dish (Techno Plastic Products, Trassadingen, Switzerland) overnight at an appropriate density for adherence. When cell confluence reached 90%, cells at the logarithmic growth phase were trypsinized and dispersed into cell suspension (2.5 × 10⁴ cells/mL), which was then seeded in a 6-well plate (2 mL/well). Corresponding lentiviral vectors were transduced into cells when cells grew logarithmically and reached 30% confluence. Briefly, 2 × 10⁶ TU lentiviral vectors and 5 μg Poly-brene were added into 1 mL culture medium in the absence of serum and antibacterial agents for transduction. After 2– 3 days, lentiviral infection was observed under the inverted fluorescence microscope. Then, 48 h later, stably infected cells were screened by adding 1 μg/mL puromycin into each well. The medium was renewed with conventional culture medium when cells were stably infected. Transient transfection was followed using miR-503 mimic/inhibitor with reference to manual of LipofectamineTM 2000 (Invitrogen, Carlsbad, CA, USA) when cell density reached 70–80%. After 48 h, cells were collected at different time points for further experiments.
The human glioma cell line (U-251 MG) was treated with overexpressed-negative control (oe-NC) + phosphate buffer saline (PBS), oe-KIF5A + PBS, oe-KIF5A + MSC-EVs-NC, oe-KIF5A + MSC-EVs-miR-503, oe-NC, oe-KIF5A, oe-NC + sh-NC, oe-KIF5A + sh-NC, or oe-KIF5A + sh-IL-7.
Human bone marrow MSCs were transfected with mimic-NC + oe-NC (vector lentivirus), miR-503 mimic + oe-NC, or miR-503 mimic + oe-KIF5A. mimic-NC and miR-503 mimic were transfected into MSCs. After extracting MSC-EVs, MSC-EV-miR-503 and oe-KIF5A were cotransfected into glioma cell line U-251 MG.
Murine glioma cells (GL261) were treated with vehicle as the control group, agomir-NC + oe-NC, miR-503 agomir + oe-NC or miR-503 agomir + oe-KIF5A.
Isolation of EVs from bone marrow MSCs
Bone marrow was provided by five patients (three males, two females, age: 26–52 years) with osteonecrosis of the femoral head in The First Hospital of Qiqihar & Affiliated Qiqihar Hospital, Southern Medical University. According to Association Research Circulation Osseous (ARCO), the stages of osteonecrosis of three male patients were classified into stages I, I, and II, respectively, while two female patients were classified into stage I, and II. Five patients were found to have obvious sclerosis in the femoral head without joint space stenosis and other abnormalities diagnosed with X-ray examinations. According to MRI, patients were not suffering much loss of femoral head, wound, diseases of blood system, or tumor infiltration. EVs were depleted from FBS through ultracentrifugation at 4°C for 16 h at 1 × 10⁶ ×g (Avanti J-30I, Beckman Coulter, Brea, CA, USA). The EVs-depleted FBS was used for subsequent experiments to avoid the effects of EVs. After cell culture for 48–72 h, EVs were collected from culture medium through ultracentrifugation. An equal volume of plasma (1 mL) and filtered PBS were mixed to reduce the viscosity of the solution before centrifugation. In brief, cell culture medium was centrifuged at 300 ×g for 10 min, at 2000 ×g for 15 min and at 12,000 ×g for 30 min to remove floating cells and cellular debris and then filtered through a 0.22-μm filter. The supernatant was further centrifuged at 1 × 10⁶ ×g for 2 h at 4°C and washed in PBS, followed by another round of spin under the same condition. The precipitate was resuspended in 100 mL PBS and stored at −80°C.
Transmission electron microscope (TEM)
The precipitate containing EVs (400 mL) through ultracentrifugation was fixed in 2% glutaraldehyde at 4°C, fixed with 1% OsO4 for 1 h, dehydrated by ethanol and embedded with epoxy resin for 10 min. TEM (JEM-1010, JEOL, Tokyo, Japan) was introduced for observation on size distribution and morphological characteristics of EVs. The EV suspension was mixed with 4% paraformaldehyde of equal volume and precipitated on the Formvar carbon-coated EM grid. Images were captured under TEM (Hitachi, Tokyo, Japan). The EV marker proteins, CD63 and CD81 were identified by Western blot analysis using antibodies to CD63 (ab59479, Abcam, Cambridge, UK) and CD81 (ab79559, Abcam), respectively.
Nanoparticle tracking analysis (NTA)
20 μg EVs were suspended in 1 mL PBS to evenly distribute EVs, followed by observation using NanoSight NTA (Malvern Panalytical, Malvern, UK).
Isolation and activation of T cells
Blood was collected from healthy adult human volunteers. Peripheral blood mononuclear cells (PBMCs) were centrifuged and purified by Ficoll-Plaque PLUS. In short, heparinized blood was diluted by PBS as a ratio of 1:1, spread on Ficoll and centrifuged. The cell interface layer was collected and resuspended in Magnetically Activated Cell Separator (MACS) buffer (Miltenyi Biotec, Cologne, Germany). T cells were purified using EasySep™ human T cell isolation kit (STEMCELL Technologies, Vancouver, BC, Canada). The isolated T cells were resuspended in NeuroCult™ basal culture medium and seeded in the 96-well round plate, which was further coated with 1 μg/mL human antibody to CD3 (BD Biosciences, San Jose, CA, USA) for 2–3 h. The inactivated T cells were collected by un-coated plate. The isolated T cells were seeded with 100,000 cells/well at a final volume of 100 μL. The soluble human antibody to CD28 (BD Pharmingen, Franklin Lake, NJ, USA) was added into the coated wells. Cells were collected 48 h after activation.
Co-culture of glioma cells and T cells
The glioma cell line (U-251 MG) was cultured with T cells in vitro for 72 h after different treatment protocols for 48 h. The glioma cells, CD4+ T lymphocytes and supernatant were collected respectively. The CD4+ T lymphocyte proliferation was detected by carboxyfluorescein succinimidyl amino ester (CFSE) and T cell apoptosis was evaluated by Annexin V-fluorescein isothiocyanate/propidiumiodide (FITC/PI) double staining. The levels of prostaglandin E2 (PGE2), transforming growth factor-β (TGF-β), and vascular endothelial growth factor (VEGF) in the supernatant were determined by enzyme linked immunosorbent assay (ELISA).
Dual-luciferase reporter gene assay
KIF5A 3ʹuntranslated region (3ʹUTR) dual-luciferase reporter gene vector, PmirGLO-KIF5A-wild type (PmirGLO-KIF5A-WT), and mutant (MUT) vector containing mutated binding sites to miR-503, PmirGLO-KIF5A-MUT, were constructed, respectively, both of which were co-transfected with miR-503 mimic or mimic NC into HEK293T cells (104, Hanbio Biotechnology Co., Ltd., Shanghai, China, https://hanhbio.biomart.cn/). After transfection for 24 h, cells were collected and lysed. The supernatant was collected through centrifugation at 12,000 rpm for 1 min. The luciferase activity was measured using Dual-Luciferase® Reporter Assay System (E1910, Promega, Madison, WI, USA) and expressed as the ratio of firefly luciferase activity to renilla luciferase activity (for internal reference).
Reverse transcription quantitative polymerase chain reaction (RT-qPCR)
Total RNA was extracted from cells using TRIzolTM Reagent (Invitrogen). Total RNA was reversely transcribed into complementary DNA (cDNA) using a RT kit (RR047A, Takara, Kusatsu, Shiga, Japan) for mRNA detection and using miRNA First Strand cDNA Synthesis (Tailing Reaction) kit (B532451-0020, Sangon Biotech Co., Ltd., Shanghai, China) for miRNA detection. Samples were loaded using SYBR® Premix Ex TaqTM II (Perfect Real Time) kit (DRR081, Takara) and subjected to RT-qPCR in a real-time fluorescence qPCR instrument (ABI7500, ABI, Foster City, CA, USA). The universal negative primer for miRNA and forward primer of U6 were provided by miRNA First Strand cDNA Synthesis (Tailing Reaction) kit while the remaining primers were synthesized by Shanghai Sangon. The relative fold enrichment of target regions was calculated based on the differences in Ct values (ΔCt) between fold change = 2−ΔΔCt with U6 or glyceraldehyde-3-phosphate dehydrogenase (GAPDH) serving as the loading control.
Cell counting kit-8 (CCK-8) assay
The transfected cells or EVs-treated cells for 24 h were seeded in a 96-well plate at a concentration of 2.5 × 10⁴ cells/well overnight. Cell proliferation was detected at 0, 24, 48 and 72 h by means of CCK-8 kit (Dojindo Molecular Technologies, Kyushu, Japan). Following addition of 10 µL CCK-8 solution, cells were cultured for 2 h at 37°C. Cell viability was measured at the wavelength of 450 nm by a microplate reader (Wellscan MK3; Labsystems Dragon, Finland).
Transwell migration and Matrigel invasion assays
Transwell migration assay was performed using a Transwell insert that contained polycarbonate filters with 8-μm pores (cat. no. 3422; Corning, Corning, NY, USA). The 5 × 10⁴ glioma cells were suspended in 200 µL serum-free medium and added into the apical chambers. The EVs suspending in DMEM supplemented with 10% FBS and penicillin/streptomycin were added into the basolateral chambers. After 24 h, the migrated cells were fixed in 4% paraformaldehyde, stained by crystal violet, and microscopically observed (CKX41, Olympus, Japan). Cell migration was quantified in 10 randomly selected fields.
Invasion capacity of glioma cells was measured by Matrigel matrix gel invasion assay using a Transwell system (BD Biosciences) where apical chambers (pore diameter: 8 µm) were coated with 1 mg/mL Matrigel.
Bioinformatics analysis
miRNA expression dataset GSE42658 and gene expression dataset GSE65626 were downloaded from GEO database (https://www.ncbi.nlm.nih.gov/geo/). GSE42656 dataset contained three normal brain tissue samples (normal) and three glioma samples (tumor), while GSE42658 dataset contains four normal brain tissue samples (normal) and five glioma samples (tumor). The differentially expressed genes were screened using the “limma” package, with |log2FC| >2, p < .05 as the threshold. The miRNAs related to MSC-derived EVs through the EVmiRNA database (http://bioinfo.life.hust.edu.cn/EVmiRNA#!/browse) were obtained, and intersected with the differentially expressed miRNAs from GSE65626 dataset to screen the differentially expressed miRNAs related to EVs. The expression of miRNA was predicted using GSE65626 dataset. The target genes of differential miRNAs were predicted through StarBase database (http://starbase.sysu.edu.cn/) and TargetScan database (http://www.targetscan.org/vert_71/). The above results were intersected with the differentially expressed genes from the GSE42658 dataset to screen the target genes of the different miRNAs. The StarBase database was adopted to obtain the binding sites of miRNAs and target genes. The expression of the target gene was obtained through the GSE42658 dataset, and finally the expression level of the target gene in TCGA was verified through the GEPIA online website (http://gepia.cancer-pku.cn/). The KEGG database (https://www.genome.jp/kegg/pathway.html) was adopted query the relevant signal pathways of target genes to further predict the relevant regulatory mechanisms.
Xenograft tumor of GL261 cells in nude mice
Six-week male C57BL/6J mice were purchased from River of Life Co., Ltd., (Beijing, China) and kept apart in new specific pathogen-free environment for at least 5 days with free access to sterilized food and water under (55 ± 15)% humidity at (21 ± 5)°C in a room exposed to artificial 12/12-h light-dark cycles.
Mice were anesthetized by pentobarbital sodium and subcutaneously inoculated with 3 × 10⁶ murine glioma cells (GL261, 20 µL). When the tumor volume reached 100 mm3, every 7 mice at the same growth rate were randomly selected for subsequent injection of GL261 cytomedicine treated with PBS of equal volume, agomir-NC + oe-NC, miR-503 agomir + oe-NC or miR-503 agomir + oe-KIF5A. The agomir was diluted in autoclaved PBS and injected into mice at a dose of 5 nmol each time (volume: 20 µL) every 3 days for 30 days in total at multiple points. The day of the first injection was designated as the 1st day. The tumor width (W) and length (L) were measured by a vernier caliper and tumor volume (V) was calculated with the formula that V = 0.5 × L × W.Citation2 The mouse weight and tumor volume were measured every 3 days. The tumors were resected and weighed immediately after the research.
Flow cytometry
The blood from mouse eyeball was diluted. PBMCs were isolated and added with Hanks solution. The supernatant was removed through centrifugation. The cells were resuspended in 0.5 mL Roswell Park Memorial Institute (RPMI) 1640 medium and counted with the cell concentration adjusted. In a 24-well plate, cells were added into each well with 5 × 10⁵ cells/mL and incubated in RPMI 1640 medium at room temperature for 30 min under condition void of light in the presence of 20 μL FITC-labeled antibody to CD4, followed by flow cytometric analysis. Tumor-infiltrating lymphocytes were harvested from tumors in accordance with the instructions of tumor dissociation kit (Miltenyi Biotech). The erythrocytes in cell suspension were removed by adding erythrocyte lysis working solution for 15-min incubation. Following centrifugation at 300 ×g for 10 min, the cell concentration was adjusted to 107 cells/mL by PBS. The proliferation ability of CD4+T lymphocytes was evaluated by CFSE and apoptosis was assessed by Annexin V-FITC/PI double staining.
Protein preparation and Western blot analysis
Total protein extracted from cells and tissues was lysed by Radio Immunoprecipitation Assay lysis (Thermo Fisher Scientific, Waltham, MA, USA) containing protease inhibitor and phosphatase inhibitor (Roche Life Science, Basel, Switzerland) on ice for 30 min. The protein concentration was determined by Bio-Rad protein detection kit (Bio-Rad Laboratories, Hercules, CA, USA). Samples were loaded into the wells of sodium dodecyl sulfate-polyacrylamide gel electrophoresis and transferred onto the polyvinylidene fluoride membrane (Bio-Rad). The membrane was probed with diluted primary antibodies (Abcam) of rabbit antibodies to KIF5A (ab5628), IL-7 (ab175380) and β-actin (1:1000, ab5694) at 4°C overnight and re-probed with secondary antibody of goat anti-rabbit antibody to Immunoglobulin G (IgG) (ab6721) at room temperature for 1 h. The protein signal was detected by enhanced chemiluminscense kit (BB-3501, Amersham, Little Chalfont, UK) and analyzed by Quantity One v4.6.2. Images were captured by Bio-Rad image analysis system (Bio-Rad). The relative protein expression was expressed as the ratio of the gray value of protein to be tested to that of internal reference (β-actin).
ELISA
The levels of PGE2, TGF-β1 and VEGF in U-251 MG cell supernatant and murine peripheral blood were measured using commercially purchased ELISA kits (Abcam) of PGE2 (ab136948), TGF-β1 (ab119557 for mice and ab100647 for human) and VEGF (ab222510).
Statistical analysis
Data analysis was performed using SPSS 21.0 software (IBM, Armonk, NY, USA). Measurement data obeying normal distribution and homogeneity of variance were expressed as mean ± standard deviation unless otherwise indicated. Data of unpaired design between two groups were compared by unpaired t-test. Data comparison among multiple groups was analyzed by one-way analysis of variance (ANOVA), followed by Tukey’s post hoc test. Data comparison at different time points was analyzed by Bonferroni-corrected repeated measures ANOVA. A p-value <0.05 was considered statistically significant.
Results
miR-503 is highly expressed in glioma and targets KIF5A
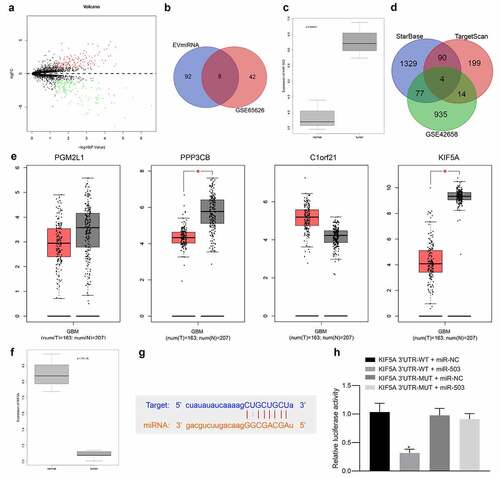
Through microarray-based expression analysis available in GSE65626, 302 differentially expressed genes were obtained, 155 of which were upregulated and 147 were downregulated (). As revealed from EVmiRNA database regarding miRNAs related to MSC-EVs, eight miRNAs were selected through intersection with results of GSE65626, hsa-miR-199a-3p, hsa-miR-199a-5p, hsa-miR-10b-5p, hsa-miR-199b-3p, hsa-miR-503-3p, hsa-miR-21-5p, hsa-miR-503-5p and hsa-miR-27a-3p (). Notably, high expression of miR-503 has been reported in glioma tissues and holds potentials of functioning as a molecular target for treatment against glioma.Citation9 Therefore, miR-503 was selected in our study for further analysis. Concordantly, the putative expression pattern of miR-503 in glioma was found to be higher according to dataset GSE65626 (). The potential target genes of miR-503 were predicted in StarBase and TargetScan databases, followed by intersection with differentially expressed genes from GSE42658, after which four genes PGM2L1, PPP3CB, C1orf21 and KIF5A were obtained (). Gene Expression Profiling Interactive Analysis was then introduced to verify the expression patterns of PGM2L1, PPP3CB, C1orf21 and KIF5A in glioma (), results of which showed that KIF5A was the most significantly poorly expressed in glioma samples (p < .05). In addition, differential analysis from GSE42658 also revealed low expression of KIF5A in glioma (). Subsequently, the binding sites between KIF5A and miR-503 were obtained from StarBase (). As verified by dual-luciferase reporter gene assay, the relative luciferase activity was the lowest in response to KIF5A 3ʹUTR-WT + miR-503 (), indicating that KIF5A was targeted by miR-503. Taken together, these findings demonstrated the high miR-503 expression and low KIF5A expression along with their targeting relation in glioma.
Figure 1. High expression of miR-503 and low expression of KIF5A are identified in glioma. a) The volcano plot displaying the differentially expressed genes in glioma samples (red dots: upregulated genes, green dots: downregulated genes). The abscissa refers to log10 p value and the ordinate corresponds to logFoldChange. b) Venn diagram displaying the intersection of differentially expressed miRNAs from GSE65626 and MSC-EVs-related miRNAs from EVmiRNA. c) The box plot displaying the expression of miR-503 in glioma-related microarray dataset GSE65626. d) Venn diagram displaying the intersection of predictions results regarding target genes of miR-503 from TargetScan and differentially expressed genes from GSE42658. e) The box plot displaying the expression of PGM2L1, PPP3CB, C1orf21 and KIF5A in glioma samples from The Cancer Genome Atlas with. f) The box plot displaying the expression of KIF5A in microarray dataset GSE65626. g) The putative binding sites between miR-503 and KIF5A from StarBase. H, The targeting relation between miR-503 and KIF5A verified by dual-luciferase reporter gene assay. *p < .05 vs. the KIF5A 3ʹUTR-WT + miR-NC group. The measurement data were expressed as mean ± standard deviation derived from at least 3 independent experiments. Data comparison among multiple groups was analyzed by one-way ANOVA, followed by Tukey’s post hoc test
MSC-EVs promote glioma cell proliferation, migration, and invasion through target-inhibition of KIF5A by miR-503
With results determining that miR-503 targeted and negatively regulated expression of KIF5A, next research focus was shifted to the involvement of KIF5A in the effects of MSC-EVs-loaded miR-503 on immune invasion of glioma. Firstly, the expression of miR-503 in normal brain tissues (n = 30) and glioma tissue samples (n = 66) from World Health Organization was analyzed by means of TaqManTM array MicroRNA evaluation (). Results revealed significantly higher expression of miR-503 in glioma tissue samples than that in normal brain tissues (p < .05). The immunohistochemical staining for positive expression of KIF5A showed that the positive rate of KIF5A expression was 13.64% (9/66) in glioma tissue samples but 83.33% in normal brain tissues (25/30) (), suggesting that KIF5A was expressed at a low level in glioma. Then, EVs derived from MSCs were isolated, followed by identification using TEM (), NTA and Western blot analysis (). RT-qPCR was performed to determine the expression of miR-503 in MSC-EVs (). It was observed that the average diameter of MSC-EVs was (150 ± 3.9) nm and MSC-EVs were positive for CD63 and CD81 but negative for calnexin while miR-503 was highly expressed in MSC-EVs. We compared the expression of miR-503 in MSCs and glioma cells and found that the expression of miR-503 in MSCs was significantly higher than that of glioma cells (). Then, oe-KIF5A was delivered into glioma cells (U-251 MG), followed by treatment of miR-503 isolated from MSC-EVs. After 72 h, the expression of miR-503 and KIF5A was determined by RT-qPCR, the results of which showed that miR-503 expression changed insignificantly, whereas KIF5A was highly expressed in the presence of oe-KIF5A when compared with treatment of oe-NC in glioma cells treated with PBS. Following addition of MSC-EVs-miR-503, miR-503 expression increased and KIF5A expression decreased in the presence of oe-KIF5A ().
Figure 2. miR-503 loaded in EVs derived from MSCs enhances glioma cell proliferation, migration, and invasion by negatively regulating KIF5A. (a) The relative expression of miR-503 in glioma samples (n = 66) and normal brain tissues (n = 30) detected by TaqManTM array MicroRNA. (b) The positive rate of KIF5A expression in glioma samples (n = 66) and normal brain tissues (n = 30) detected by immunohistochemistry. (c) The microscopic observation of EVs derived from MSCs by TEM (scale bar = 100 nm). (d) The expression of CD63, CD81 and calnexin in 5 μg EVs and 20 μg cell lysates detected by Western blot analysis. (e) The relative expression of miR-503 in supernatant and MSC-EVs determined by RT-qPCR. (f) miR-503 expression in MSC-derived EVs and glioma cells determined with RT-qPCR. (g) The relative expression of miR-503 and KIF5A in U-251 MG cells determined by RT-qPCR. (h) The U-251 MG cell proliferation detected by CCK-8 assay. (i, j) The U-251 MG cell migration and invasion detected by Transwell assay (200 ×). *p < .05 vs. normal brain tissues, cell lysates, supernatant or U-251 MG cells treated with oe-NC + PBS. #p < .05 vs. U-251 MG cells treated with oe-KIF5A + MSC-EVs-NC. The measurement data were expressed as mean ± standard deviation derived from at least 3 independent experiments. Data comparison was analyzed by independent sample t-test between two groups and by one-way ANOVA among multiple groups, followed by Tukey’s post hoc test. Data at various time points were compared by Bonferroni-corrected repeated measures ANOVA
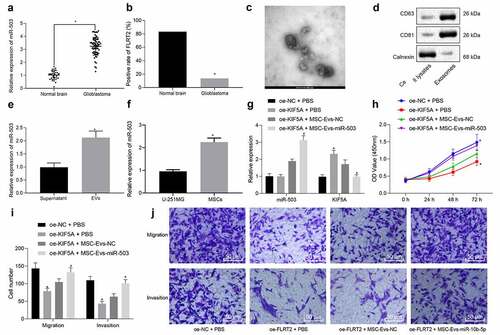
To explore the effects of MSC-EVs-miR-503 on biological behaviors of glioma cells, CCK-8 and Transwell assays were performed for detection of cell proliferation (), migration () and invasion (). Results revealed significantly suppressed proliferation, migration, and invasion of PBS-treated glioma cells after oe-KIF5A treatment in comparison to oe-NC treatment. However, opposite changing tendency was observed in glioma cells treated with oe-KIF5A in combination with MSC-EVs-miR-503 compared with MSC-EVs-NC. To conclude, miR-503 in MSCs-derived EVs contributed to the malignant behaviors of glioma cells by targeting KIF5A.
MSC-EVs promote the release of immunosuppressive factors by miR-503 through target-inhibition of KIF5A
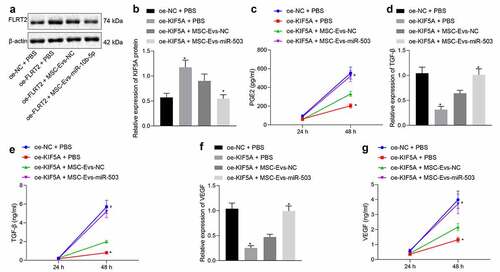
It is acknowledged that glioma cells harbor the property of secreting immunosuppressive factors, which can reduce the killing effects of immune cells on tumor cells. Herein, subsequent experiments were conducted to investigate whether MSC-EVs-loaded miR-503 was functional to the immune response in glioma. First, oe-KIF5A was transfected into U-251 MG cells, followed by delivery of miR-503 in EVs derived from MSCs. Western blot analysis showed that KIF5A protein expression was upregulated by oe-KIF5A but downregulated by miR-503-enriched MSC-EVs (). RT-qPCR and ELISA were performed to quantify multiple immunosuppressive factors secreted from U-251 MG cells, including PGE2 (), TGF-β () and VEGF (, g). It was found that levels of PGE2, TGF-β and VEGF were diminished in PBS-treated glioma cells in response to oe-KIF5A in contrast to that of oe-NC + PBS, while elevated in response to oe-KIF5A in combination with MSC-EVs-miR-503 when compared with that of oe-KIF5A + MSC-EVs-NC. These results validated the encouraging effects of MSC-EVs-loaded miR-503 on release of immunosuppressive factors by targeting KIF5A.
Figure 3. miR-503 loaded in EVs derived from MSCs promotes release of immunosuppressive factors by negatively regulating KIF5A. (a, b) The relative expression of KIF5A in U-251 MG cells normalized to β-actin determined by Western blot analysis. (c) The PGE2 level released from U-251 MG cells measured by ELISA. (d) The relative expression of TGF-β in U-251 MG cells determined by RT-qPCR. (e) The TGF-β level released from U-251 MG cells measured by ELISA. (f) The relative expression of VEGF in U-251 MG cells determined by RT-qPCR. (g) The VEGF level released from U-251 MG cells measured by ELISA. *p < .05 vs. U-251 MG cells treated with oe-NC + PBS. #p < .05 vs. U-251 MG cells treated with oe-KIF5A + MSC-EVs-NC. The measurement data were expressed as mean ± standard deviation derived from at least 3 independent experiments. Data comparison was analyzed by one-way ANOVA among multiple groups, followed by Tukey’s post hoc test. Data at various time points were compared by Bonferroni-corrected repeated measures ANOVA
Overexpressed KIF5A promotes T cell proliferation and inhibits T cell apoptosis via the Il-7 signaling pathway
KIF5A has been reported to be associated with immune-mediated genes.Citation13 As revealed from Kyoto Encyclopedia of Genes and Genomes (map04144), KIF5A was found to mediate the cytokine receptor signaling pathway, which has been indicated to be related to IL-7.Citation14 Hence, we endeavored to explore whether KIF5A could mediate the IL-7 signaling pathway to be implicated in regulation of T cell proliferation. Immunohistochemistry () revealed that compared with the positive rate of IL-7 expression in normal brain tissues, positive rate of IL-7 expression was significantly lower in glioma tissues. RT-qPCR, ELISA () and Western blot analysis (, d) showed that expression of KIF5A and IL-7 increased in U-251 MG cells treated with oe-KIF5A alone. However, IL-7 expression was reduced when IL-7 was silenced, while further overexpression of KIF5A did not markedly change KIF5A expression. It was observed by RT-qPCR and ELISA () that overexpressed KIF5A significantly downregulated expression of PGE2, TGF-β and VEGF . Moreover, further silencing IL-7 could override the inhibitory effects of overexpressed KIF5A. It could be concluded that KIF5A promoted the release of immunosuppressive factors via IL-7.
Figure 4. Upregulated KIF5A mediates the IL-7 signaling pathway to promote proliferation and inhibit apoptosis of T cells. (a) The positive rate of IL-7 expression in glioma tissues (n = 66) and normal brain tissues (n = 30) determined by immunohistochemistry. (b) The relative expression of KIF5A and IL-7 in U-251 MG cells determined by RT-qPCR. (c, d) The protein expression of KIF5A and IL-7 in U-251 MG cells normalized to β-actin determined by Western blot analysis. (e) The PGE2 level released from U-251 MG cells measured by ELISA. (f) The relative expression of TGF-β in U-251 MG cells determined by RT-qPCR. (g) The TGF-β level released from U-251 MG cells measured by ELISA. (h) The relative expression of VEGF in U-251 MG cells determined by RT-qPCR. (i) The VEGF level released from U-251 MG cells measured by ELISA. (j) T cell proliferation detected by CFSE staining of flow cytometry. (k) T cell apoptosis detected by flow cytometry. (l) The expression of CD4 and FoxP3 determined by flow cytometry. *p < .05 vs. normal brain tissues or U-251 MG cells treated with oe-NC + sh-NC. #p < .05 vs. U-251 MG cells treated with oe-KIF5A + sh-NC. The measurement data were expressed as mean ± standard deviation derived from at least 3 independent experiments. Data comparison was analyzed by independent sample t-test between two groups and by one-way ANOVA among multiple groups, followed by Tukey’s post hoc test. Data at various time points were compared by Bonferroni-corrected repeated measures ANOVA
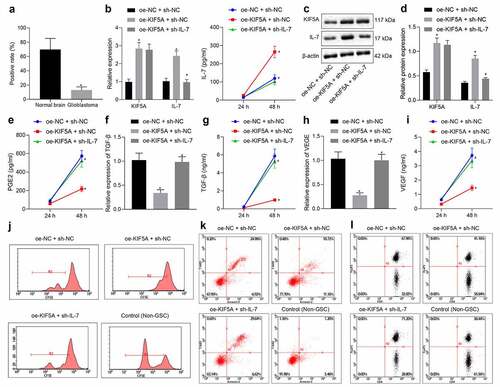
T cell proliferation was then assessed by determining the number of T cells that were cocultured with glioma cells through CFSE staining of flow cytometric analysis (). Additionally, T cell apoptosis was evaluated by measuring the percentage of Annexin V+7-AAD+ cells (). CD4 and FoxP3 expression was also quantified by flow cytometry for analysis of T cells (). T cell proliferation was suppressed, apoptosis was promoted, CD4 expression decreased and FoxP3 expression increased in glioma cells treated with oe-NC + sh-NC. Opposite changing tendency was induced in response to overexpressed KIF5A, the results of which were further counterweighed by downregulating IL-7. To sum up, the effects of overexpressed KIF5A on T cell behavior modulation were dependent on the IL-7 signaling pathway.
miR-503 inhibits T cell proliferation and promotes immune escape of glioma by targeting KIF5A via the IL-7 signaling pathway
Subsequent experiments were focused on the involvement of the IL-7 signaling pathway. For exploration purpose, miR-503 mimic was delivered into MSCs, followed by extraction of EVs. Then, miR-503-EVs were co-transfected with oe-KIF5A into U-251 MG cells for 48 h, which were further co-cultured with T cells. RT-qPCR () and Western blot analysis (, c) revealed that compared with mimic-NC + oe-NC, expression of KIF5A and IL-7 was inhibited by miR-503 mimic + oe-NC. However, the inhibitory effects of miR-503 mimic were abolished by overexpressed KIF5A.
Figure 5. miR-503 negatively regulates KIF5A to suppress T cell proliferation in contribution to immune escape of glioma through the IL-7 signaling pathway. (a) The expression of miR-503 and KIF5A in U-251 MG cells determined by RT-qPCR. (b, c) The protein expression of KIF5A and IL-7 in U-251 MG cells normalized to β-actin determined by Western blot analysis. (d) T cell proliferation detected by CFSE staining of flow cytometry. (e) T cell apoptosis detected by flow cytometry. (f) The expression of CD4 and FoxP3 determined by flow cytometry. *p < .05 vs. U-251 MG cells treated with mimic-NC + oe-NC. #p < .05 vs. U-251 MG cells treated with miR-503 mimic + oe-NC. The measurement data were expressed as mean ± standard deviation derived from at least 3 independent experiments. Data comparison was analyzed by one-way ANOVA among multiple groups, followed by Tukey’s post hoc test
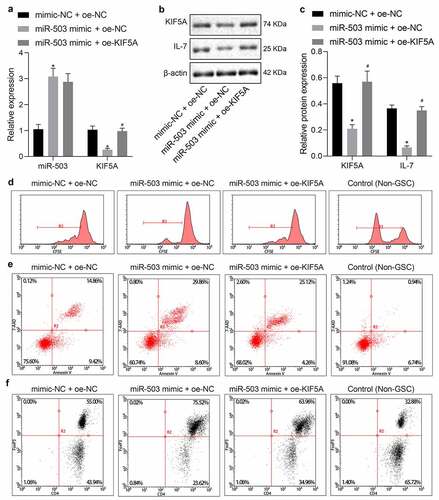
The functional role of miR-503 in MSC-EVs on T cell proliferation and apoptosis was then investigated by flow cytometric analysis (). Results showed that in comparison to non-glioma cells, T cell proliferation was suppressed but apoptosis was enhanced accompanied by lower CD4 level and higher FoxP3 level in glioma cells with different treatment protocols. When miR-503 mimic was delivered, there were fewer proliferative T cells, more apoptotic T cells, diminished CD4 expression and elevated FoxP3 expression. Further addition of oe-KIF5A triggered completely opposite changing results. The above-mentioned findings elaborated the functional role of the IL-7 signaling pathway to inhibit T cell proliferation playing a critical role in glioma immune escape.
Overexpressed miR-503 promoted immune escape of glioma in vivo
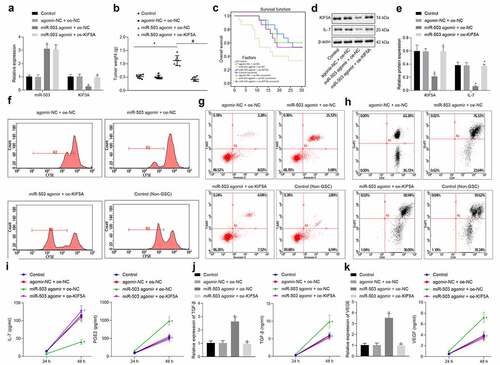
Lastly, the aforementioned functional axis was studied in vivo by developing a mouse model of glioma. When tumor volume reached 100 mm3, GL261 cells were injected into mice 1 time every 3 days. Total RNA was extracted from tumor tissues on the 3rd day after injection for quantification of transfection efficacy of miR-503 and KIF5A by RT-qPCR (). At the end of research, tumors were collected and weighed () while mouse survival was analyzed (). The results illustrated that tumor weight increased in the presence of miR-503 agomir along with decreased survival rate but the delivery of miR-503 agomir and oe-KIF5A in combination induced opposite results. Western blot analysis () and flow cytometry () showed that miR-503 agomir treatment alone resulted in downregulated KIF5A and IL-7, inhibited T cell proliferation, promoted T cell apoptosis, decreased CD4 expression and increased FoxP3 expression. Furthermore, the addition of oe-KIF5A led to an opposite trend. RT-qPCR and ELISA () revealed diminished IL-7 level, elevated expression of TGF-β and VEGF as well as higher levels of PGE2, TGF-β and VEGF in response to the delivery of miR-503 agomir. However, further delivery of oe-KIF5A was observed to function in an opposite way. In conclusion, the promoting effects of miR-503 on immune escape of glioma via KIF5A through the IL-7 signaling pathway were validated in vivo.
Figure 6. miR-503 contributes to immune escape of mice with glioma by regulating KIF5A via the IL-7 signaling pathway. (a) The expression of miR-503 and KIF5A in tumor tissues determined by RT-qPCR. (b) The scatter plot displaying tumor weight. (c) The curve displaying survival rate of mice. (d, e) The protein expression of KIF5A and IL-7 in tumor tissues normalized to β-actin determined by Western blot analysis. (f) T cell proliferation detected by CFSE staining of flow cytometry. (g) T cell apoptosis detected by flow cytometry. (h) The expression of CD4 and FoxP3 determined by flow cytometry. (i) The levels of IL-7 and PGE2 measured by ELISA. (j) The expression and level of TGF-β measured by RT-qPCR and ELISA, respectively. K, The expression and level of VEGF measured by RT-qPCR and ELISA, respectively. *p < .05 vs. mice injected with PBS. #p < .05 vs. mice injected with GL261 cells treated by miR-503 agomir + oe-NC. n = 7. The measurement data were expressed as mean ± standard deviation derived from at least 3 independent experiments. Data comparison was analyzed by one-way ANOVA among multiple groups, followed by Tukey’s post hoc test. Data at various time points were compared by Bonferroni-corrected repeated measures ANOVA
Discussion
Gliomas have been reported to account for approximately 30% of all brain and central nervous system tumors and 80% of all malignant brain tumors.Citation15 The development of malignant gliomas has been closely associated with the proliferation and immune escape of tumor cells.Citation16 Fortunately, MSC-derived EVs containing miRNAs exhibit anti-tumor activities by targeting different molecules associated with tumor survival, thus representing a promising strategy against tumor.Citation17,Citation18 The gathered findings from the current study revealed that miR-503 shuttled from MSC-derived EVs had the potential to accelerate glioma cell proliferation and immune escape by inhibiting KIF5A-dependent IL-7 signaling pathway.
In this study, we initially found an amplified miR-503 expression in glioma tissues. Similarly, miR-503 is observed to be overexpressed in human glioblastoma tissues in comparison with normal brain tissues.Citation9 Emerging evidence demonstrates that miRNAs play an important role in the regulation of tumor cell growth, invasion and metastasis by inhibiting the expression of their targets.Citation19 Our in vitro experiments indicated that miR-503 could negatively modulate KIF5A expression by interacting with the 3ʹ UTR of KIF5A. In addition, we found that overexpression of miR-503 augmented glioma cell proliferation through inhibition of KIF5A. KIF5A encodes a neuron-specific kinesin heavy chain involved in intracellular transport of mitochondria and other cargoes, the mutation of which closely relates to myoclonic seizure and neonatal progressive leukoencephalopathy.Citation20 The findings from the present study showed a poor expression of KIF5A in glioma tissues. Previously, a significant reduction in KIF5A expression has been shown in clinical samples of multiple sclerosis, a neurological disease characterized by central nervous system inflammation, demyelination, axonal degeneration, and neuronal injury.Citation11 In addition, KIF5A knockout mice present with myoclonus reflected by mitochondrial dysfunction in the spinal cord.Citation21
Some miRNAs are documented to be enriched in MSC-derived EVs such as miR-16, miR-222 and miR-223.Citation22 In our study, miR-503 was highly expressed in MSC-derived EVs. Furthermore, MSC-derived EVs significantly enhanced glioma cell proliferation, migration, and invasion by transferring miR-503. Indeed, MSC-derived EVs can affect the outcomes of renal, liver, heart, and brain diseases via transfer of their miRNA contents.Citation23 A previous study has revealed that delivery of anti-miR-9 by MSC-derived EVs contributes to chemosensitivity in glioblastoma multiforme cells,Citation24 suggesting that miR-9 deficiency may impair glioblastoma multiforme cell growth. Moreover, miR-208a shuttled by MSC-derived EVs has been reported to promote osteosarcoma cell proliferation, migration, and invasion.Citation25 VEGF, TGF-β and PGE2 derived from tumors serve as both pro-angiogenetic and immune suppressive factors and their upregulated production leads to suppression of T cell function.Citation26 miR-503 has been demonstrated to enhance the production of VEGFCitation27 and injection of miR-503 inhibitor decreases the expression of TGF-β in the transverse aortic constriction mice.Citation28 Therefore, miR-503 delivered from MSC-derived EVs could also be a contributor to the immune escape of glioma. In addition, increased IL-7 expression can improve immune cell infiltration and tumor cell survival in chimeric antigen receptor T cells in solid tumors.Citation29 Our study found that upregulated KIF5A could activate the IL-7 signaling pathway and consequently promote T cell proliferation and inhibit its apoptosis. Thus, we reasoned that miR-503 disrupted T cell proliferation and promoted glioma immune escape by blocking KIF5A-dependent IL-7 signaling pathway.
Conclusion
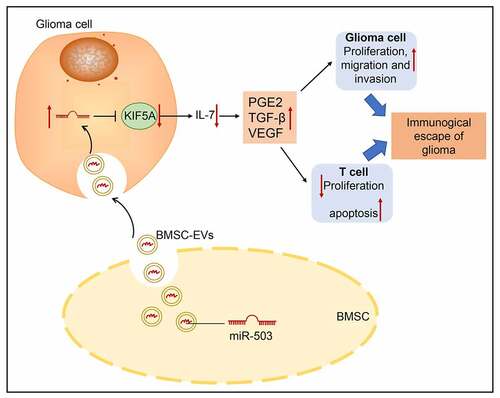
Overall, miR-503, which is delivered via MSC-derived EVs, can promote glioma immune escape by targeting KIF5A and inactivating the IL-7 signaling pathway (summarized in ), thereby providing a new treatment strategy for glioma. Considering that the isolation of EVs and the culture of MSCs include reagents and methods that are still inappropriate for human use, safety data from animal studies cannot ensure the safety of initial studies in humans. Improvement in the methods for MSC culture and EV purification will increase the feasibility and safety of MSC-derived EV therapy in clinical application.
Figure 7. The graphical summary of miR-503 incorporated in MSC-EVs being a regulator that controls immune escape in glioma. miR-503, which is delivered via MSC-derived EVs, can promote glioma immune escape by targeting KIF5A and inactivating the IL-7 signaling pathway
Authors’ contributions
X.S.W., X.J.Y., K.W. and S.X.W. designed the study. Q.K.L., Y.G.W., H.L. and C.H. collated the data, carried out data analyses and produced the initial draft of the manuscript. X.S.W., X.J.Y. and C.H. contributed to drafting the manuscript. All authors have read and approved the final submitted manuscript.
Abbreviations
EVs: Extracellular vesicles; DMEM: Dulbecco’s Modified Eagle’s medium; FBS: fetal bovine serum; PBS: phosphate buffer saline
Disclosure of interests
The author(s) declare no conflict of interest.
Ethical statement
The study was conducted with the approval of the Ethics Committee of The First Hospital of Qiqihar & Affiliated Qiqihar Hospital, Southern Medical University. Each participant signed written informed consent prior to the study. Experiments involving human beings were performed in strict accordance with the Declaration of Helsinki. The experimental animals were treated according to the Guide for the Care and Use of Laboratory Animals.
Consent to participate
Each participant signed written informed consent prior to the study.
Consent for publication
Not applicable.
Acknowledgments
We would like to give our sincere appreciation to the colleagues for their helpful suggestions on this article.
Data Availability
The datasets generated/analyzed during the current study are available.
Additional information
Funding
References
- Lapointe S, Perry A, Butowski NA. Primary brain tumours in adults. Lancet. 2018;392(10145):432–12. doi:10.1016/S0140-6736(18)30990-5.
- Alifieris C, Trafalis DT. Glioblastoma multiforme: pathogenesis and treatment. Pharmacol Ther. 2015;152:63–82. doi:10.1016/j.pharmthera.2015.05.005.
- Fine HA. Malignant gliomas: simplifying the complexity. Cancer Discov. 2019;9(12):1650–1652. doi:10.1158/2159-8290.CD-19-1081.
- Wang H, Xu T, Huang Q, Jin W, Chen J. Immunotherapy for malignant glioma: current status and future directions. Trends Pharmacol Sci. 2020;41(2):123–138. doi:10.1111/cge.12831.
- Whitehead CA, Kaye AH, Drummond KJ, Widodo SS, Mantamadiotis T, Vella LJ, Stylli SS. Extracellular vesicles and their role in glioblastoma. Crit Rev Clin Lab Sci. 2019:1–26. doi:10.1080/10408363.2019.1700208.
- Graner MW, Alzate O, Dechkovskaia AM, Keene JD, Sampson JH, Mitchell DA, Bigner DD. Proteomic and immunologic analyses of brain tumor exosomes. FASEB J. 2009;23(5):1541–1557. doi:10.3390/cancers9070071.
- Raposo G, Stahl PD. Extracellular vesicles: a new communication paradigm? Nat Rev Mol Cell Biol. 2019;20(9):509–510. doi:10.1038/s41580-019-0158-7.
- Pavon LF, Sibov TT, de Souza AV, da Cruz EF, Malheiros SMF, Cabral FR, de Souza JG, Boufleur P, de Oliveira DM, de Toledo SRC, et al. Tropism of mesenchymal stem cell toward CD133+ stem cell of glioblastoma in vitro and promote tumor proliferation in vivo. Stem Cell Res Ther. 2018;9(1):310. doi:10.1186/s13287-018-1049-0.
- Guo P, Yu Y, Li H, Zhang D, Gong A, Li S, Liu W, Cheng L, Qiu Y, Yao W, et al. TGF-β1-induced miR-503 controls cell growth and apoptosis by targeting PDCD4 in glioblastoma cells. Sci Rep. 2017;7(1):11569. doi:10.1016/j.tips.2019.12.003.
- Nakajima K, Yin X, Takei Y, Seog DH, Homma N, Hirokawa N. Molecular motor KIF5A is essential for GABAA receptor transport, and KIF5A deletion causes epilepsy. Neuron. 2012;76(5):945–961. doi:10.1016/j.neuron.2012.10.012.
- Hares K, Kemp K, Rice C, Gray E, Scolding N, Wilkins A. Reduced axonal motor protein expression in non-lesional grey matter in multiple sclerosis. Mult Scler. 2014;20(7):812–821. doi:10.1177/1352458513508836.
- Fritzell S, Eberstal S, Sanden E, Visse E, Darabi A, Siesjo P. IFNγ in combination with IL-7 enhances immunotherapy in two rat glioma models. J Neuroimmunol. 2013;258(1–2):91–95. doi:10.1016/j.jneuroim.2013.02.017.
- Sharma N, Mannan R, Titiyal JS. Nonresolution of acute hydrops because of intrastromal migration of perfluoropropane gas. Cornea. 2010;29(8):944–946. doi:10.1097/ICO.0b013e3181ca6353.
- Wang Y, Jiang H, Luo H, Sun Y, Shi B, Sun R, Li Z. An IL-4/21 inverted cytokine receptor improving CAR-T cell potency in immunosuppressive solid-tumor microenvironment. Front Immunol. 2019;10:1691. doi:10.3389/fimmu.2019.01691.
- Goodenberger ML, Jenkins RB. Genetics of adult glioma. Cancer Genet. 2012;205(12):613–621. doi:10.1016/j.cancergen.2012.10.009.
- Pan DS, Feng SZ, Cao P, Li JJ. Endothelin B receptor promotes the proliferation and immune escape of malignant gliomas. Artif Cells Nanomed Biotechnol. 2018;46(6):1230–1235. doi:10.1080/21691401.2017.1366336.
- Lou G, Song X, Yang F, Wu S, Wang J, Chen Z, Liu Y. Exosomes derived from miR-122-modified adipose tissue-derived MSCs increase chemosensitivity of hepatocellular carcinoma. J Hematol Oncol. 2015;8(1):122. doi:10.1186/s13045-015-0220-7.
- Reza A, Choi YJ, Yasuda H, Kim JH. Human adipose mesenchymal stem cell-derived exosomal-miRNAs are critical factors for inducing anti-proliferation signalling to A2780 and SKOV-3 ovarian cancer cells. Sci Rep. 2016;6(1):38498. doi:10.1038/srep38498.
- Chan SH, Wang LH. Regulation of cancer metastasis by microRNAs. J Biomed Sci. 2015;22(1):9. doi:10.1186/s12929-015-0113-7.
- Rydzanicz M, Jagla M, Kosinska J, Tomasik T, Sobczak A, Pollak A, Herman-Sucharska I, Walczak A, Kwinta P, Ploski R. KIF5A de novo mutation associated with myoclonic seizures and neonatal onset progressive leukoencephalopathy. Clin Genet. 2017;91(5):769–773. doi:10.1111/cge.12831.
- Duis J, Dean S, Applegate C, Harper A, Xiao R, He W, Dollar JD, Sun LR, Waberski MB, Crawford TO, et al. KIF5A mutations cause an infantile onset phenotype including severe myoclonus with evidence of mitochondrial dysfunction. Ann Neurol. 2016;80(4):633–637. doi:10.1002/ana.24744.
- Sempere LF, Keto J, Fabbri M. Exosomal MicroRNAs in breast cancer towards diagnostic and therapeutic applications. Cancers (Basel). 2017;9(12):71. doi:10.3390/cancers9070071.
- Qiu G, Zheng G, Ge M, Wang J, Huang R, Shu Q, Xu J. Mesenchymal stem cell-derived extracellular vesicles affect disease outcomes via transfer of microRNAs. Stem Cell Res Ther. 2018;9(1):320. doi:10.1186/s13287-018-1069-9.
- Munoz JL, Bliss SA, Greco SJ, Ramkissoon SH, Ligon KL, Rameshwar P. Delivery of FUNCTIONAL Anti-miR-9 by mesenchymal stem cell–derived exosomes to glioblastoma multiforme cells conferred chemosensitivity. Mol Ther Nucleic Acids. 2013;2:e126. doi:10.1038/mtna.2013.60.
- Qin F, Tang H, Zhang Y, Zhang Z, Huang P, Zhu J. Bone marrow-derived mesenchymal stem cell-derived exosomal microRNA-208a promotes osteosarcoma cell proliferation, migration, and invasion. J Cell Physiol. 2020;235(5):4734–4745. doi:10.1002/jcp.29351.
- Mulligan JK, Rosenzweig SA, Young MR. Tumor secretion of VEGF induces endothelial cells to suppress T cell functions through the production of PGE2. J Immunother. 2010;33(2):126–135. doi:10.1097/CJI.0b013e3181b91c9c.
- Ong J, Faiz A, Timens W, van den Berge M, Terpstra MM, Kok K, van den Berg A, Kluiver J, Brandsma CA. Marked TGF-β-regulated miRNA expression changes in both COPD and control lung fibroblasts. Sci Rep. 2019;9(1):18214. doi:10.1038/s41598-019-54728-4.
- Zhou Y, Deng L, Zhao D, Chen L, Yao Z, Guo X, Liu X, Lv L, Leng B, Xu W, et al. Micro RNA-503 promotes angiotensin II-induced cardiac fibrosis by targeting Apelin-13. J Cell Mol Med. 2016;20(3):495–505. doi:10.1111/jcmm.12754.
- Adachi K, Kano Y, Nagai T, Okuyama N, Sakoda Y, Tamada K. IL-7 and CCL19 expression in CAR-T cells improves immune cell infiltration and CAR-T cell survival in the tumor. Nat Biotechnol. 2018;36(4):346–351. doi:10.1038/nbt.4086.