
ABSTRACT
The occurrence and development of gastric adenocarcinoma (gADC) is closely related to the interaction between tumor cells and immune cells in the tumor microenvironment (TME). Our objective was to characterize the repertoire of immune cells in the TME of gADC. To analyze the transcriptomic, immune, and spatial information of TME in gADC, we constructed single-cell RNA sequencing, 10 × Genomics V(D)J analysis, multiple immunofluorescence techniques, and OSCmap analysis of 49,765 single cells in seven samples from four gADC patients. Our integrative analysis of B cells demonstrated that a large number of mucosal associated lymphoid tissue (MALT)-B cells were detected in the gADC tissues, which have mature tertiary lymphatic structures (mTLSs), and almost no MALT-B cells in peripheral blood sample. Moreover, MALT-B cells are a class of IgA+ plasma cells, which are characterized with high expression of complement pathway activation-related genes. Next, natural killer T (NKT) cells mainly exist in gADC tissues accompanied by mTLSs. This study also classified monocytes/macrophages and epithelial cells into benign and malignant types. Interestingly, CSOmap (q < .05) and multiple immunofluorescence (p < .05) results indicated more types of immune cells can be enriched in tissues with mTLSs than normal TLSs, and the density of mTLSs were higher than normal TLSs. Our findings provide novel insights for the signature of immune cells and tumor cells in the TME of gADC with TLSs and highlight the potential importance of IgA-mediated humoral immunity in gADC patients with TLSs.
Introduction
Gastric cancer is one of the five most common tumors in the world and the third most deadly cancer worldwide.Citation1 Gastric adenocarcinoma (gADC) occurs frequently. Its growth, invasion, and metastasis are complex and dynamic processes involve not only the inherent genetic abnormalities in tumor tissues but also the interactions between tumor and immune cells in the local microenvironment.Citation2 Recently, single-cell RNA sequencing (scRNA-seq) has emerged as a powerful tool to reveal molecular properties of malignant tissue. The combination of scRNA-seq with tissue samples could provide computational solutions for reprogramming of the gastric TME.Citation2
Although the development of various immunotherapies has benefited for some cancer patients over the past decade,Citation3,Citation4 the complex tumor microenvironment (TME) severely diminishes the efficacy of antitumor immunity.Citation5–8 In addition, several strategies for predicting biomarkers and enhancing clinical responses have focused on T-cell action, but other immune cell subsets that may also contribute to anti-tumor immune responses have received less attention.Citation3,Citation9,Citation10
Tumor-infiltrating B cells (TIBs) are present in the tumor tissues, such as melanoma, sarcoma, and kidney cancer, and are a major component of tertiary lymphatic structures (TLSs).Citation11 TLSs are ectopic lymphoid organ formed in non-lymphoid tissues during chronic inflammation and tumorigenesis and composed of T cells, B cells, follicular dendritic cells, dendritic cells, and other cells.Citation12 The impacts of TIBs and TLSs on tumorigenesis and immunotherapeutic effects have recently received more attention, but their specific roles and mechanisms in tumors are still not fully understood.Citation13
The major objective of this study was to analyze the transcriptome, immune cell types, and spatial characteristics of the TME in gADC containing TIBs and TLSs. To achieve the purpose, we constructed an unbiased and systematic transcriptomic and immune repertoire landscape of the TME, para-cancerous tissues, and peripheral blood samples using scRNA-seq. Cellular Spatial Organization mapper (CSOmap) and multiple immunofluorescence techniques were performed to reconstruct cellular spatial organizations and quantify the statistical significance of cell–cell interactions from tissue samples. Here, we analyzed a total of 49,765 single cells from seven samples derived from four gADC patients providing a new explanation for the role of TIBs in TLSs and potential application in gADC immunotherapy.
Materials and methods
Sample acquisition
The study collected four cases of fresh gADC tissue samples and peripheral blood mononuclear cells (PBMCs) sample from Bayannur Hospital. All patients did not receive any other therapy before surgery, more details about samples please see Supplementary Table S1. Fifty cases tissue blocks were received from the department of Pathology at the Bayannur Hospital and Nanjing First Hospital between January 2008 and December 2010. Clinical pathology information includes gender, age, differentiation, and Tumor Node Metastasis (TNM) stage (Supplementary Table S2).
The study protocol was approved by the Human Research Ethic Committee of Bayannur Hospital and Nanjing First Hospital. Matched normal tissue was obtained from sites displaced at least 5 cm from the tumor and was confirmed to lack tumor cells on histopathology review. PBMCs sample was isolated from peripheral blood of gADC patients.
Tissue processing and single-cell sequencing
Tissue samples were immediately collected after resection and dissociated into a single-cell suspension. PBMCs were isolated using density gradient centrifugation. Single cells were selected using microfluidic technology based on 10 × Genomics platform. DNA libraries were amplified by PCR, and high-throughput sequencing was performed using Illumina sequencing platform’s double-terminal sequencing mode. Using 10 × Genomics official analysis software Cell Ranger (https://support.10× genomics.com/single-cell-gene-expression/software/overview/welcome) to identify the data filtering, alignment, quantitative of the original data. Cell gene expression matrix is obtained finally. Using the Seurat (https://satijalab.org/seurat/) for further filtration, standardization, the classification of the cells, each subgroup analysis and marker gene screening differentially expressed genes.Citation1,Citation14
Bio-informatics analysis
Sequencing results were converted to FASTQ format using Illumina bcl2fastq software. Sample demultiplexing, barcode processing, and single-cell 5ʹgene counting by using the Cell Ranger pipeline (https://support.10×genomics.com/single-cell-geneexpression/software/pipelines/latest/what-is-cell-ranger, version 3.1.0) and scRNA-seq data were aligned to Ensembl genome GRCh38/GRCm38 reference genome. A total of 49,765 single cell captured from 4 patients were processed using 10× Genomics Chromium Single-Cell V (D) J Solution. The Cell Ranger output was loaded into Seurat v3, which was used to dimensional reduction, clustering, and analysis of scRNA-seq data. Overall, cells passed the quality control threshold: genes expressed in less than one cell were removed, number of genes expressed per cell <150 as low and >5000 as high cutoff, UMI counts less than 150, the percent of mitochondrial-DNA derived gene-expression <50%Citation15 (Supplementary Figure S1).
To visualize the data, we further reduced the dimensionality of all 49,765 cells using Seurat and used t-SNE to project the cells into 2D space. Using the LogNormalize method of the “Normalization” function of the Seurat software to calculate the expression value of genes; Principal component analysis (PCA) analysis was performed using the normalized expression value. The top 10 principal components were selected from the results of PCA analysis for subsequent clustering and cluster analysis. Marker genes for each cluster were identified with the “bimod” (Likelihood-ratio test) with default parameters via the Find All Markers function in Seurat. Each selected marker gene is expressed in more than 10% of the cells in a cluster and average log (Fold Change) of greater than 0.26.
10× Genomics single cell V (D) J analysis
The Gel bead used in 10 × V (D) J library construction is composed of Gel beads and a segment of primers on Gel beads. Primers are mainly composed of full-length Illumina TruSeq Read 1 sequencing primer, 16nt 10 × Barcode sequence composed of primers are including full-length Illumina TruSeq Read 1 sequencing primers and 16nt 10 × Barcode sequences, 10nt unique molecular identifier (UMI), and 13nt template conversion Oligo (TSO). Qualified cell suspension was prepared, gel magnetic beads and oil droplets were added to different channels of Chromium Chip A respectively, and Gel Beads-in-emulsion (GEM) was formed through the micro-fluid “double cross” crossover system. After the GEM was formed and mixed, the cells were decomposed, and the gel beads were dissolved automatically and released a large number of primer sequences, which will be mixed with the cell lysates and reaction mixture. Reverse transcription generated cDNA with the information of 10 × Barcode and UMI. GEM was broken, magnetic beads were purified into cDNA, and then PCR amplification was performed. The full-length cDNA was divided into two parts. One was used for nested PCR to enrich the BCR region; the other was expanded to construct a 5ʹexpression library, which containing P5 and P7 connectors for PCR.Citation16
Immunohistochemistry, immunofluorescence, and digital image analysis
Four cases of gADC were excised and fixed into specimens, and then cut along the long axis in the deepest part of the tumor invasion. At least three pieces of tumor tissue were taken from each patient. One piece was the full-thickness tumor and the gastric wall tissue, and two pieces were the boundary of upper or lower edge tumor tissue and the para-cancerous tissue.
Gastric cancer paraffin sections were heated in the oven at 65°C for 1 h, xylene was dewaxed for 3 times, gradient alcohol hydration was performed, and antigens were repaired by microwave. Sections were pretreated and stained with monoclonal antibodies directed against CD79A (SP18, Abcam), J-chain (OTI2B1, Invitrogen), CD4 (EPR6855, Abcam), EpCAM (BX50051, BioLegend), CD8 (SP16, Abcam), CD14 (SP192, Abcam), Foxp3 (D2W8E, CST), C3b (ab11871, Abcam), C5b-9 (ab55811, Abcam) and C5aR1 ((PAB18321, Abnova) on a Leica-Bond III/max autostainer platform (Leica Biosystems). Stains were detected using anti-immunoglobulin-coupled horseradish peroxidase with 3,3ʹ-diaminobenzidine (DAB, OptiView Kit, Roche Diagnostics) as substrate. Nuclear counterstaining was performed with Mayer hematoxylin.
The cells were counterstained with DAPI (D3571, Thermo Fisher Scientific) for immunofluorescence and imaged using Automatic Multispectral Histopathological Quantitative Analysis System (Vectra 2.0.8) with HALO Digital Pathological Image Analysis Platform.Citation17,Citation18 Six markers of the TLSs in each field were quantified (not the whole field, but only the TLS area). The TLSs on each tissue image (marked by solid red lines) were manually circled (Supplementary Figure S2). Based on the Halo Highplex FL V4.0.4 algorithm (Indica Labs; Albuquerque, NM), the algorithm was adjusted according to the cell localization and staining characteristics of different antibodies. The number and proportion of positive cells labeled by six antibodies were quantitatively analyzed in the whole image and in the tertiary lymphatic structure, and the morphology of each cell was quantitatively analyzed.
Cellular Spatial Organization mapper (CSOmap)
Ren et al. (2020) developed a new approach named CSOmap that aims to reconstruct the cell spatial organization.Citation19 Three constraints were introduced to construct the computational model. Firstly, pre-define the minimum distance between cells, because all cells have a positive size and cannot be squeezed. Secondly, the total available space is also predefined by the parameters of the space radius to simulate the limited real space. Finally, the student’s – t distribution is introduced to solve the crowding problem of cell interactions, activated by visually stimulating the t-SNE algorithm, which allows cells to compete with other cells to form spatial tissues. Considering all these factors, CSOmap jointly proposes the following calculation model.Citation19 To estimate the cellular interacting potentials by integrating thousands of ligand-receptor pairs, resulting in a cell-by-cell affinity matrix. And embed the inherently high-dimensional affinity matrix into three-dimensional space. CSOmap requires three types of input data, which are ligand–receptor interaction data, scRNA-seq data and cell-type data. CSOmap use the human ligand–receptor interaction database FANTOM5 with incorporation of immune-relevant chemokines, cytokines, co-stimulators, co-inhibitors, and their receptors for estimating the cell–cell affinity matrix.
Results
scRNA-seq and cell typing of nonmalignant and tumor gADC samples
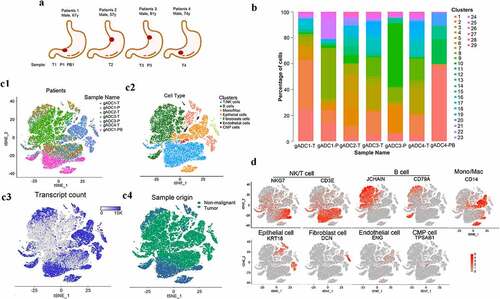
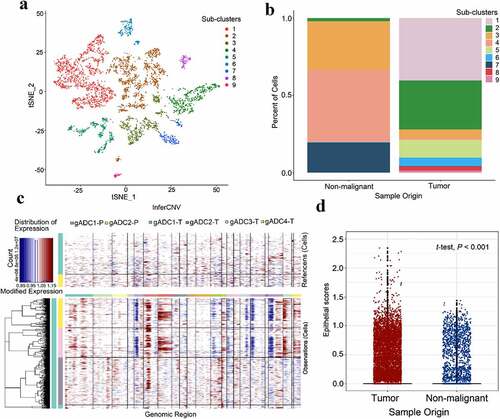
A total of 49,765 single cells were obtained from four gADC patients. These samples were non-metastatic and originated from surgical resections. Of these, 4,538 single cells were from para-carcinoma tissues, 38,182 were from cancer tissues, and 7,045 single cells were from PBMCs (, Supplementary Table S3). Using the 10 × Genomics official analysis software Cell Ranger, we grouped the cells via graph-based clustering based on the informative principal components (n = 7) (Supplementary Table S4). All cells were divided into 29 groups followed by the analyses of gene expression distinction with Seurat software in various cell populations, as well as screening the up-regulated genes in different cells (). A distribution of seven cell lineages in seven tissue samples was identified through a computational method with unbiased cell-type recognition (SingleR, Single-cell Recognition) (Supplementary Table S5). t-distributed stochastic neighbor embedding (t-SNE) of the 49,765 cells profiled, including originated from the corresponding patient (c1), the associated cell type (c2), the number of transcripts (c3) and its sample origin (c4). These seven cell clusters could be assigned based on marker genes: NK/T cells (NKG7, CD3E), B cells (J-chain, CD79A), monocyte, and macrophage (Mono/Mac) (CD14), epithelial cells (KRT18), fibroblasts (DCN), endothelial cells (ENG), and CMP cells (TPSAB1) (). The sequencing results showed that there were a large number of B cells in gADC tissues with TLSs, which suggested that B cells might play an important role in the formation of TLSs.
Figure 1. Overview of profiling of 49,765 single-cells from tumor and non-tumor of gastric adenocarcinoma (gADC) tissues
Dissection and subcluster of B cells in gADC
The 17, 302 B cells were re-clustered into 21 separate subsets using marker genes (). Of these, sub-cluster 1, 2, 6, 7, 9, 12, 13, 14, 16, 17, and 21 were defined as plasma cells (express Ig-related genes), sub-cluster 3, 15 were defined as mucosal associated lymphoid tissue (MALT) derived B cells (express J-chain and Ig), sub-cluster 8 was defined as naive B cells (express CD19, CD24, and CD38), sub-cluster 10 was defined as follicular B cells (express MS4A1, CD74, and HLA-DRA), subcluster 11, 18, and 19 were defined memory B cells (express HMGN2 and H2AFZ), sub-clusters 4 (CL4) was defined as inflammation-associated B cells (express FTH1, TYROBP, and FCER1G), and subcluster 5 (CL5) was defined as tumor-associated B cells (express AGR2, MT1G, and TSPAN8) (Supplementary Figure S3A). We further defined the B cell sub-type by analyzing the genes encoding the immunoglobulin sub-type and found that MALT-B cells are a class of IgA+ plasma cells (express IgHA1 and SDC1) (Supplementary Figure S3B). MALT-B cells are a main component of tissue samples, and they were abundant in the tissues of gADC with TLSs, while there were almost no MALT-B cells present in the peripheral blood. Memory B cells were divided into two groups according to the presence or absence of IgD (Supplementary Figure S3C). Further analysis found that CL4 and CL5 were also present in gADC tissues containing mTLSs, whereas Naive B cells mainly existed in PBMCs tissues ().
Figure 2. B cells clusters in gADC
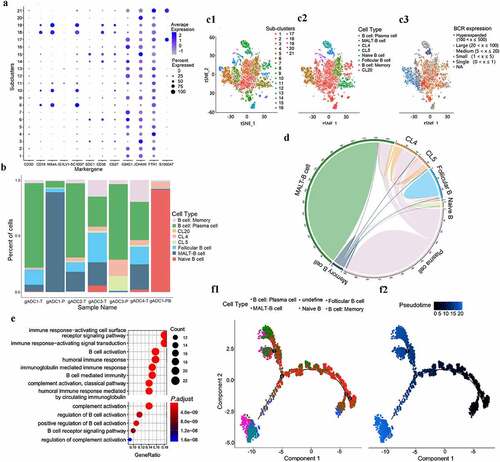
To obtain further insight into the clonal information about individual B cells, we reconstructed B cell receptor (BCR) sequences. Complementarity determining region (CDR) is correctly identified with the variable region of the antibody, which are consists of CDR1, CDR2, and CDR3. CDR3 is responsible for recognizing processed antigen and exhibits the highest diversity, which plays a vital role in against pathogens. The result of sequencing found the CDR3 sequence length distribution of BCR was diversity (Supplementary Figure S3D). Moreover, BCR clonetype in MALT-B cells were monoclonal expression but hyper-expanded in plasma B cells (c1-3). From the analysis of the BCR sharing in each sub-cluster, we found that Memory B cells could differentiate into various B cell sub-clusters ().
After performing enrichment analysis, we found that the main function of MALT-B cells might be related to complement activation, immune response, and B-cell activation (P < .001) (). This suggests that the B cell-mediated complement activation pathway plays an irreplaceable role in TLSs. Additionally, 50 cases of gastric cancer tissues with TLSs were collected and prepared as tissue chips. The expression of C3b, C5b-9, and C5aR1 were detected by IHC further confirmed the results (Supplementary Figure S3E1-2).
To better understand the function and relationships among these cells, we performed monocle 2 algorithm analysis according to the definition of sub-clusters.Citation20 Most cells from each sub-cluster were aggregated based on gene-expressed similarities, while different sub-clusters formed into a relative process in pseudotime that began with root 4. B cells were divided into Naive B cells/Memory B cells and plasma cells and then branch off into two terminal branches: MALT-B cells and inflammation/tumor-associated B cells. More interestingly, we also found two types of Memory B cell states that one is derived from Naive B cells and the other could be used as a node to differentiate into plasma cells ().
In this part of the results, a panoramic analysis of B cells in gADC tissues with TLSs was performed, demonstrating that MALT-B (IgA+) cells were abundant in the tissues of gADC with TLSs and might play an important role in the activation of complement pathways.
Dissection and subcluster of T cells in gADC
We detected 16, 233 T cells through t-SNE based on tissue specificity and sub-type markers. To explore the heterogeneity of intrinsic T cells, we re-clustered these T cells into 13 sub-clusters according to T cell marker genes (a1). Of these, sub-cluster 1 was activated T cells (express CD69), sub-cluster 2 and 7 were Naive T cells (express SELL, CCR7, and LEF1), sub-cluster 3 was regulatory T (Treg) cells (express FOXP3 and ICOS), sub-cluster 4 was CL4 (express IGH), sub-clusters 6 and 11 were cytotoxic CD8 + T (CTL) cells (CD8+ and express NKG7, GZMA, and GNLY), sub-cluster 8 was Natural killer T (NKT) cells (CD8+ and express NKG7, GZMA, and KLRD1), sub-clusters 10 and 13 were natural killer (NK) cells (CD8-, but express NKG7, GZMA), sub-cluster 12 was exhausted CD4 + T cells (CD4+, but express PDCD1 and CXCL13), sub-cluster 5 was proliferative T cells (express CCNB2, DLGAP5, and MKI67), and sub-cluster 9 (CL9) was undefined (a2, Supplementary Figure S4). Naive T cells were only enriched in PBMC cells, whereas T cell sub-clusters were more diverse in tumor tissues. More interestingly, we also found that NKT cells mainly existed in gADC tissues containing germinal centers, whereas CTL mainly existed in ordinary gADC tissues (). We compared the up/down-regulated gene expression between the NKT and CTL subsets through gene oncology (GO) and Gene set enrichment (GSEA) analyses. Many pathways of NKT cells were significantly up-regulated, such as cell–cell adhesion, lymphocyte mediated immunity, leukocyte activation, and cellular response to interferon-gamma (P < .001) ().
Figure 3. Dissection and subclusters of T cells in gastric adenocarcinoma (gADC)
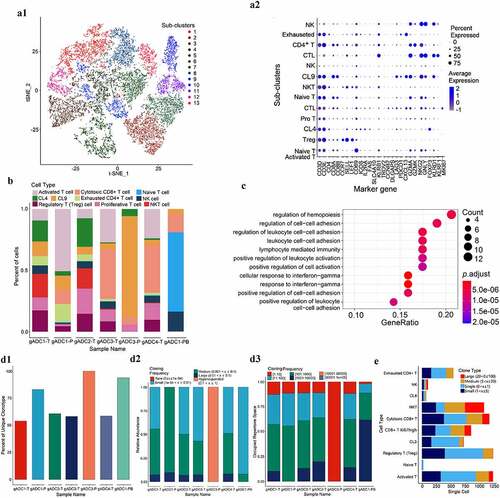
To determine the adaptive immune status of each sample, T cell receptors (TCR) libraries in tumor tissues, adjacent non-tumor tissues, and peripheral blood of patients with gADC were successfully analyzed by combination of the 5ʹRACE technique and scRNA sequencing. By comparing the unique clonetype (1), abundance (2) and the proportion of cloning frequency (3), TCR diversity of tumor tissues was higher than that of adjacent normal tissues and peripheral blood. The study further compared TCR amplification from different T sub-clusters, suggesting that large amounts of clone-type amplification occurred in NKT and CTL cells related to exhaustion of CD4+ T cells. We believe that these NKT and CTL cells may play a more important role in tumor immunity ().
In this part of the results, different T cell subtypes in mTLS and normal TLS samples were compared, and the functions of T cell subtypes in different samples were analyzed by bioinformatics analysis and TCR sequencing.
Dissection and subcluster of Mono/Mac in gADC
The 8,682 Mono/Mac were re-clustered into 12 separate sub-clusters (). Of these, sub-clusters 1, 4, 5, and 7 were defined as Mono/Mac-1 cells (express CD14, IFTM3, C1QC, and C1QB), according to Villani, AC et al. research.Citation21 Sub-clusters 3, 10, and 12 were defined as Mono/Mac-2 cells (express CD14, S100A8, FCN1, and S100A9), sub-cluster 9 was defined as Mono/Mac-3 cell (express CD14 and LGMN), sub-cluster 6 was defined as Mono/Mac-T cells (express CD14, genes associated with inflammatory responses, and T-cell bio-markers), sub-cluster 8 was defined as Dendritic Cell (DC) (expressing CD1C), subclusters 2 and 11 were undefined (, Supplementary Figure S5). We determined the Mono/Mac cells in tumor and nonmalignant cells by analyzing the proportion of sub-clusters in different samples (). The study also suggested that Mono/Mac-2 cells were the main subsets presenting in PBMCs and nonmalignant tissue samples, while the variety of Mono/Mac cells in tumor tissues were more abundant ().
Figure 4. Dissection and subclusters of Monocytes/Macrophages in gastric adenocarcinoma (gADC)
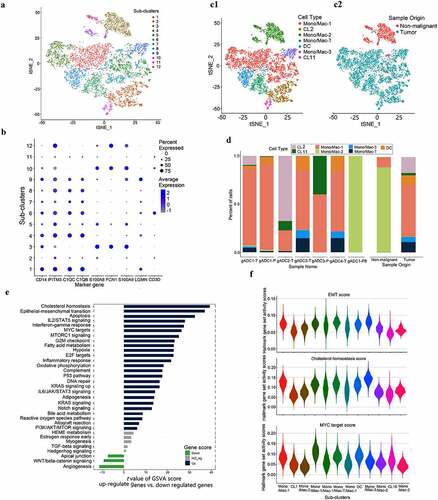
We further summarized the above mentioned three types of Mono/Mac cells and conducted gene set variation analysis (GSVA) between the tumor and nonmalignant tissues. Compared with conventional GSEA, GSVA was more accurate in annotating pathways in single cells.Citation14 We chose the hallmark data set in the MSigDB (molecular signatures database) for analysis. The results indicated that compared with nonmalignant gastric tissue samples, many pathways of tumor-derived cells were significantly activated such as the Epithelial-mesenchymal transition (EMT), Myc signaling, and other pathways (). Based on GSVA analysis, 50 pathways in all sub-clusters were by calculating hallmark scores and then the maps were exhibited (Figure XX). These results supported the re-clustering of Mono/Mac cells results and were consistent with the pathways of sub-cluster of cells ().
In this part of the results, we classified three kinds of Mono/Mac by several methods, and the results indicated that Mono/Mac-2 mainly existed in benign samples, while Mono/Mac-1 and −3 mainly existed in malignant tissue samples.
Classification of malignant and nonmalignant epithelial cells
We selected cell group 8, 9, 22, 23, and 26 for epithelial cell cluster analysis. Nine sub-clusters (5,036 epithelial cells) were obtained (), and the most highly expressed genes in each subgroup are shown in the Supplementary Figure S6. We divided the epithelial cells into benign and malignant cells by analyzing the proportion of sub-cluster in different samples. We found that subclusters 1, 2, 5, 6, 8, and 9 mainly existed in tumor samples, while sub-clusters 3, 4, and 3 are mainly present in non-tumor samples (). InferCNV is a relatively effective tool to determine changes in intracellular chromosome copy number variation (CNV). Therefore, InferCNV was used to explore tumor RNA-seq data to analyze somatic large-scale copy number alterations (CNA), such as the gain or loss of whole chromosomes and large segments of chromosomes.Citation22 In general, tumor cells are prone to be CNV mutations, and genes in the regions with CNV changes occurring are always characterized with over-expressed or down-expressed compared with normal cells (). We selected the cell population previously defined as epithelial cells, and inferred malignant cells and nonmalignant cells of cell population according to the expression matrix by InferCNV. Finally, we employed the average expression levels of “KRT14”, “KRT17”, “KRT6A”, “KRT5”, “KRT8”, “KRT18”, “KRT15”, “KRT6C”, “KRTCAP3”, “SFN”, “EpCAM”, and other genes as Epithelial scores between malignant tumor and cancer-adjacent tissue. Significant differences were found between the two groups (t-test, P < .001) ().
Figure 5. Classification of malignant and nonmalignant epithelium cells
GSVA analysis was performed to characterize the different sources of epithelial cells indicating a significant difference on the hallmark pathway. We found that many pathways in these two sources of epithelial cells showed some significant differences, such as KRAS signaling, EMT, allograft rejection, and more (Supplementary Figure S7).
In this part of the results, epithelial cells are divided into benign and malignant types through InferCNV and GSVA analysis.
The localization of immune cells in TLSs between tumor and nonmalignant tissues from gADC patients
Although the T cells and TLSs in the anti-tumor immune response have been explored based on numerous studies, the role of other immune cells is unclear. J-chain is not a member of the Ig superfamily and is assumed to be important for the formation of polymeric immunoglobulins. In addition, it plays an important role in the transporting immunoglobulin to mucosa.Citation23 It has been suggested that the density of TLSs in tumor tissues played an important role in the promotion of antitumor immune response.Citation12 According to scRNA profiling, J-chain and CD79A were chosen as B cells markers and then stained with IHC. As shown in the representative images (), CD79A was mainly expressed in the core of TLSs, while J-chain was mainly scattered within intercellular stroma. And the expression of CD79A, J-chain and CD3 in gADC1/2-T tissues was higher than that in gADC3/4-T tissues. Next, CSOmap analysis could be used to reconstruct cellular spatial organization for individual cells from scRNA-seq data.Citation19 As a result, CSOmap was applied to analyze the tumor infiltrating immune cells and gain novel insights into the role of regulatory immune cells in tumor immunity. In brief, five cell types, including CD79A/J-chain-B cells (marked by J-chain and CH79A), CD79A-B cells (marked by CD79A), NK T/T cells (marked by CD3E and NKG7), Mono/Mac cells (marked by CD14), and epithelial cells (marked by EPCAM) were recorded for evaluating the performance of CSOmap. Analyzing 1,963 ligand-receptor paired was carried out by 10 × Genomics sequencing. Through the analysis of q value (q < .05), more types of immune cells in gADC1/2-T tissues can be enriched than in /gADC3/4-T tissues ().
Figure 6. Localization of immune cells in tertiary lymphatic structures between malignant and nonmalignant tissues in gastric adenocarcinoma (gADC) patients
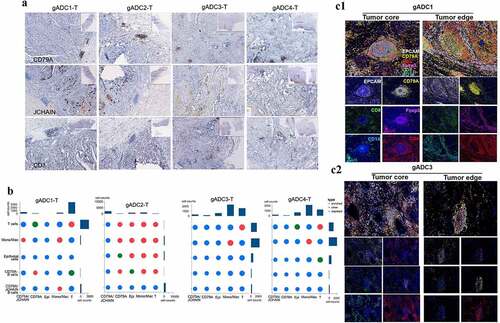
Then, histological assessment was performed to confirm the results of gene expression profiling and CSOmap that the density and distribution of B cells were within tumor samples (1-2). The density of TLSs in the tumor edge was higher than that in the tumor core, especially in patients gADC1/2-T (P < .05) (Supplementary Figure S8A), while no significant germinal center formation area was observed in either of the tumor center or the tumor edge in gADC3/4-T. Accordingly, the density of TLSs was significantly lower than that of gADC1/2-T tissue. Furthermore, the expression of CD79A in the core of TLSs that formed germinal centers (patients 1 and 2) was higher than that without germinal center (patients 3 and 4) (P < .001) (Supplementary Figure S8B).
Spatial information of the tissues furtherly enriched the results of from single-cell technology combining CSOmap analysis with immunofluorescence image analysis. The results demonstrated that more types of immune cells could be detected in tissues with mTLSs than that with normal TLSs, while the density of mTLSs was higher than normal TLSs.
Discussion
In this study, we generated a comprehensive cell map regarding the transcriptomic, immune repertoire and spatial characteristic of the TME in gADC containing TIBs and TLSs. Several studies have taken advantage of single-cell technology to determine cellular elements in the TME of the gastric cancer.Citation2,Citation24,Citation25 Sathe investigated the specific cellular and transcriptional features that distinguish the gastric cancer TME from normal gastric tissue.Citation2 Apart from tumor cells, the TME of gastric cancer was enriched for stromal cells, macrophages, DCs, and Tregs. Our dataset mainly focused on a cell panorama analysis for TIBs and TILs in gADC and identified seven cell clusters through scRNA sequencing ().
TIBs are involved in cellular and humoral immunity, but their role in anti-tumor immunity is still controversial. Some studies have shown that some immunosuppressive subtypes of TIBs cells could promote tumor progression,Citation26 while a counterargument suggested that TIBs promoted antitumor immunity and inhibited tumor growth by producing tumor-specific antibodies and presenting tumor antigens.Citation12 The germinal center is located at the follicular region of the secondary lymphoid organs,Citation27 and it is a special protective structure formed by the aggregation of B cells during humoral immune reactions.Citation28 The germinal center is a transient microanatomical structure and is the site of clonal expansion and affinity maturation of B cells.Citation29–31 In this study, we identified a class of monoclonal MALT-B cells with high expression of CD79A, J-chain, and Ig-related genes. It has been reported that IgA polymers could activate complement alternative pathway,Citation32,Citation33 therefore, we further confirmed the high expression levels of IgA and complement factors (C5aR1) in tissue samples with mature TLSs (containing germinal center) (Supplementary Figure SXXX). These results indicated that IgA and complement activation pathways might play an important role in the TME of gADC with TLSs.
Immune-related lymphoid tissues (TLSs) include MALT and skin-related lymphoid tissue.Citation11 MALT can be found in various submucosal membrane sites of the body, such as the gastrointestinal tract, nasopharynx thyroid, breast, lung, salivary glands, eyes, skin, and some organized lymphoid tissue with germinal center.Citation14 Tezuka H et al. reported that most of the MALT-B cells were IgA-producing cells, which played a local immune function by secreting sIgA directly to the nearby mucosa after being stimulated by antigen.Citation33 However, few studies have been conducted to focus on the panoramic analysis of cellular components in the TME of gastric cancer with mucosal immunity.
Further analysis revealed that NKT cells were mainly present in gADC tissues with mTLSs, whereas CTLs were distributed in ordinary gADCs tissues. Through TCR sequence analysis, more TCR clone type amplification occurred in NKT cells than CTLs. NKT cells are a subset of T cells that express both TCR and NK cell receptors. NKT cells can produce a large number of cytokines, which have been shown to play an important role in the elimination of viruses via the IgA-mediated humoral immunity.Citation34 There were more T cell subtypes distributed in tumor tissues with mTLSs. Interestingly, one subtype of T cells was characterized with higher expression level of Ig-related genes, indicating that the interaction between T and B cells could play an important role in the TILs of the tumor.
ScRNA-seq can be taken as a revolutionary approach to dissect single-cell compositions and characterize molecular properties of complex tissues.Citation35 However, spatial information of individual cells is lost during the process of tissue dissociation in single-cell sequencing. We took advantage of CSOmap method to make up for the lack of spatial location information.Citation19 The CSOmap method is an innovative bioinformatics technique that can be used to reconstruct cell spatial relationships de novo. Furthermore, it could help address the interactions of key ligand-receptor to determine cellular spatial relationships.Citation19 From CSOmap and immunohistochemistry results, we found that more types of immune cells in tissues with mTLSs can be enriched than that of normal TLSs, while the density of mTLSs were higher than normal TLSs. In some reports, IgA-mediated humoral immunity could attract circulating lymphocytes to stimulate immune response.Citation36–39 It is reasonable to speculate that IgA mediated humoral immunity in germinal centers plays an important role in stimulating anti-tumor immunity in gastric cancer patients.
One limitation of this study is that it is the difficult to collect more samples to construct single-cell RNA sequencing because germinal centers are transient microscopic structures that form lymph organs during an immune response. In the future, we will continue to study the anti-tumor immunity function of TIBs and TLSs through establishing animal models.
Conclusions
This study provided transcriptomic, immune repertoire, and spatial information regarding the mature TLSs and TIBs in gADC. Moreover, we demonstrated that IgA-mediated humoral immunity might play an important role in the formation of mTLSs. This work provided a novel role of B cells in tumor immunotherapy and might attribute to the development of immunotherapy.
Abbreviations
gADC, gastric adenocarcinoma; TME, tumor microenvironment; TLSs, tertiary lymphatic structures mTLSs, mature tertiary lymphatic structures MALT, mucosal associated lymphoid tissue scRNA-seq, single-cell RNA sequencing TIBs, tumor-infiltrating Blymphocytes CSOmap, Cellular Spatial Organization mapper; PBMCs, peripheral blood mononuclear cells BCR, B cell receptor; TCR, T cell receptor; Mono/Mac, monocyte/macrophage; DC, dendritic Cell; GSVA, gene set variation analysis; EMT, epithelial-mesenchymal transition; CNV, chromosome copy number variation; CNA, copy number alterations; UMI, unique molecular identifier;
Author contributions
W.Z., Z.Y., and H.Q. directed the research, provided financial support, and were responsible for study design and interpretation of results. L.J., T.W., and Y.Z. performed the respective project. W.Z., L.J., S.Z., T.B., and X.K. completed statistical analysis, built analysis model and performed bioinformatics analysis. L.J. and W.Z. were responsible for manuscript writing. L.J., Q.W., Y.Z., and B.W. collected subjects and conducted pathological analysis. L.J., X.K., and N.Z. coordinated the project. All of the authors reviewed, approved, and contributed to the final version of the manuscript.
Supplemental Material
Download ()Acknowledgments
We wish to thank LC-Bio for its single-cell sequencing technology services. We thank Yong Wang (Institute of Applied Mathematics, Academy of Mathematics and Systems Science, Chinese Academy of Sciences) for their technical discussions.
Availability of data and materials
All data included in this study are available upon request by contact with the corresponding author
Disclosure statement
The author(s) declare no competing financial interests.
Supplementary material
Supplemental data for this article can be accessed on the publisher’s website.
Additional information
Funding
References
- Bray F, Ferlay J, Soerjomataram I, Siegel RL, Torre LA, Jemal A. Global cancer statistics 2018: GLOBOCAN estimates of incidence and mortality worldwide for 36 cancers in 185 countries. CA Cancer J Clin. 2018;68:394–12. doi:10.3322/caac.21492.
- Sathe A, Grimes SM, Lau BT, Chen J, Ji HP, Huang RJ, Poultsides G, Ji HP. Single-cell genomic characterization reveals the cellular reprogramming of the gastric tumor microenvironment. Clin Cancer Res. 2020;26(11):2640–2653. doi:10.1158/1078-0432.CCR-19-3231.
- June CH, O’Connor RS, Kawalekar OU, Ghassemi S, Milone MC. CAR T cell immunotherapy for human cancer. Science. 2018;359(6382):1361–1365. doi:10.1126/science.aar6711.
- Gubin MM, Zhang X, Schuster H, Caron E, Ward JP, Noguchi T, Ivanova Y, Hundal J, Arthur CD, Krebber W-J. Checkpoint blockade cancer immunotherapy targets tumour-specific mutant antigens. Nature. 2014;515(7528):577–581. doi:10.1038/nature13988.
- Takeda Y, Kobayashi S, Kitakaze M, Yamada D, Ishii H, Asai A, Konno M, Arai T, Kitagawa T, Ofusa K. Immuno-surgical management of pancreatic cancer with analysis of cancer exosomes. Cells. 2020;9(7):1645. doi:10.3390/cells9071645.
- Finotello F, Eduati F. Multi-omics profiling of the tumor microenvironment: paving the way to precision immuno-oncology. Nature. 2018;8:430. doi:10.3389/fonc.2018.00430.
- Keane C, Tobin J, Gunawardana J, Francis F, Gifford G, Gill A, Gill A, Stevenson W, Talaulikar D, Gould C, et al. The tumour microenvironment is immuno‐tolerogenic and a principal determinant of patient outcome in EBV‐positive diffuse large B‐cell lymphoma. Eur J Haematol. 2019;103(3):200–207. doi:10.1111/ejh.13274.
- Kalinski P, Talmadge JE. Tumor immuno-environment in cancer progression and therapy. Adv Exp Med Biol. 2017;1036:1–18. doi:10.1007/978-3-319-67577-0_1.
- Dangaj D, Bruand M, Grimm AJ, Ranet C, Barras D, Duttagupta PA, Lanitis E, Duraiswamy J, Tanyi JL, Benencia F, et al. Cooperation between constitutive and inducible chemokines enables T cell engraftment and immune attack in solid tumors. Cancer Cell. 2019;35(6):885–900. doi:10.1016/j.ccell.2019.05.004.
- Keskin DB, Anandappa AJ, Sun J, Tirosh I, Mathewson ND, Li S, Oliveira G, Giobbie-Hurder A, Felt K, Gjini E. Neoantigen vaccine generates intratumoral T cell responses in phase Ib glioblastoma trial. Nature. 2019;565(7738):234–239. doi:10.1038/s41586-018-0792-9.
- Helmink BA, Reddy SM, Gao J, Zhang S, Basar R, Thakur R, Yizhak K, Sade-Feldman M, Blando J, Han G. B cells and tertiary lymphoid structures promote immunotherapy response. Nature. 2020;577(7791):1–7. doi:10.1038/s41586-019-1922-8.
- Cabrita R, Lauss M, Sanna A, Donia M, Skaarup Larsen M, Mitra S, Johansson I, Phung B, Harbst K, Vallon-Christersson J. Tertiary lymphoid structures improve immunotherapy and survival in melanoma. Nature. 2020;577(7791):561–565. doi:10.1038/s41586-019-1914-8.
- Wang SS, Liu W, Ly D, Xu H, Qu H, Zhang L. Tumor-infiltrating B cells: their role and application in anti-tumor immunity in lung cancer. Cell Mol Immunol. 2018;16:6–18. doi:10.1038/s41423-018-0027-x.
- Lambrechts D, Wauters E, Boeckx B, Aibar S, Thienpont B, Burton O, Bassez A, Decaluwé H, Pircher A, Van den Eynde K. Phenotype molding of stromal cells in the lung tumor microenvironment. Nat Med. 2018;24(8):1277–1289. doi:10.1038/s41591-018-0096-5.
- Bolger AM, Marc L, Bjoern U. Trimmomatic: a flexible trimmer for Illumina sequence data. Bioinformatics. 2014;30(15):2114–2120. doi:10.1093/bioinformatics/btu170.
- Azizi E, Carr AJ, Piltas G, Cornish AE, Konopacki C, Prabhakaran S, Nainys J, Wu K, Kiseliovas V, Setty M, et al. Single-cell map of diverse immune phenotypes in the breast tumor microenvironment. Cell. 2018;174(5):1293–1308. doi:10.1016/j.cell.2018.05.060.
- Thommen DS, Koelzer VH, Herzig P, Roller A, Trefny M, Dimeloe S, Kiialainen A, Hanhart J, Schill C, Hess C, et al. A transcriptionally and functionally distinct PD-1+ CD8+ T cell pool with predictive potential in non-small-cell lung cancer treated with PD-1 blockade. Nat Med. 2018;24(7):994–1004. doi:10.1038/s41591-018-0057-z.
- Weisberg SP, Carpenter DJ, Chait M, Dogra P, Farber DL, Chen AX, Campbell S, Liu W, Saraf P, Snyder ME. Tissue-resident memory T cells mediate immune homeostasis in the human pancreas through the PD-1/PD-L1 pathway. Cell Rep. 2019;29(12):3916–3932.e3915. doi:10.1016/j.celrep.2019.11.056.
- Ren X, Zhong G, Zhang Q, Zhang L, Sun Y, Zhang Z. Reconstruction of cell spatial organization from single-cell RNA sequencing data based on ligand-receptor mediated self-assembly. Cell Res. 2020;30(9):763–778. doi:10.1038/s41422-020-0353-2.
- Fan X, Bialecka M, Moustakas I, Lam E, Torrens-Juaneda V, Borggreven NV, et al. Single-cell reconstruction of follicular remodeling in the human adult ovary. Nat Commun. 2019;10(1):3164. doi:10.1038/s41467-019-11036-9.
- Villani AC, Satija R, Reynolds G, Sarkizova S, Shekhar K, Fletcher J, et al. Single-cell RNA-seq reveals new types of human blood dendritic cells, monocytes, and progenitors. Science. 2017;356(6335):eaah4573. doi:10.1126/science.aah4573.
- Puram SV, Tirosh I, Parikh AS, Patel AP, Yizhak K, Gillespie S, et al. Single-cell transcriptomic analysis of primary and metastatic tumor ecosystems in head and neck cancer. Cell. 2017;171(7):1611-1624.e24. doi:10.1016/j.cell.2017.10.044.
- Ermeng X, Yingqian L, Qing M, Chaoqun C, Jun L, Hong R, Lai N, Wang Y, Sun J, Matsumoto R, et al. MZB1 promotes the secretion of J-chain–containing dimeric IgA and is critical for the suppression of gut inflammation. PNAS. 2019;116(27):13480. doi:10.1073/pnas.1904204116.
- Zhang P, Yang M, Zhang Y, Xiao S, Lai X, Tan A, Du S, Li S. Dissecting the single-cell transcriptome network underlying gastric premalignant lesions and early gastric cancer. Cell Rep. 2020;30(12):4317. doi:10.1016/j.celrep.2020.03.020.
- Zhang M, Hu S, Min M, Ni Y, Liu Y, Sun X, Wu J, Liu B, Ying X, Liu Y. Dissecting transcriptional heterogeneity in primary gastric adenocarcinoma by single cell RNA sequencing. Gut. 2021;70(3):464–475. doi:10.1136/gutjnl-2019-320368.
- Xiao X, Lao XM, Chen MM, Liu RX, Kuang DM, Ouyang F-Z, Chen D-P, Zhao X-Y, Zhao Q, Li X-F. PD-1 hi identifies a novel regulatory B-cell population in human hepatoma that promotes disease progression. Cancer Discov. 2016;6(5):546. doi:10.1158/2159-8290.CD-15-1408.
- Lu Y, Zhao Q, Liao J-Y, Song E, Xia Q, Pan J, Li Y, Li J, Zhou B, Ye Y, et al. Complement signals determine opposite effects of B cells in chemotherapy-induced immunity. Cell. 2020;180(6):1081–1097.e1024. doi:10.1016/j.cell.2020.02.015.
- Mayer CT, Gazumyan A, Kara EE, Gitlin AD, Golijanin J, Viant C, Pai J, Oliveira TY, Wang Q, Escolano A, et al. The microanatomic segregation of selection by apoptosis in the germinal center. Science. 2017;358(6360):6360. doi:10.1126/science.aao2602.
- Lu P, Shih C, Qi H. Ephrin B1-mediated repulsion and signaling control germinal center T cell territoriality and function. Science. 2017;356(6339):eaai9264. doi:10.1126/science.aai9264.
- Wang Y, Shi J, Yan J, Xiao Z, Hou X, Lu P, Hou S, Mao T, Liu W, Ma Y, et al. Germinal-center development of memory B cells driven by IL-9 from follicular helper T cells. Nat Immunol. 2017;18(8):921–930. doi:10.1038/ni.3788.
- Daha MR, van Kooten C. Role of complement in IgA nephropathy. J Nephrol. 2016;29(1):1–4. doi:10.1007/s40620-015-0245-6.
- Tortajada A, Gutierrez E, Pickering MC, Praga TM, Medjeral-Thomas N. The role of complement in IgA nephropathy. Mol Immunol. 2019;114:123–132. doi:10.1016/j.molimm.2019.07.017.
- Tezuka H, Abe Y, Iwata M, Takeuchi H, Ishikawa H, Matsushita M, Shiohara T, Akira S, Ohteki T. Regulation of IgA production by naturally occurring TNF/iNOS-producing dendritic cells. Nature. 2007;448(7156):929–933. doi:10.1038/nature06033.
- Ishikawa H, Ino S, Yamochi T, Sasaki H, Kobayashi T, Kohda C, et al. NKT cells are responsible for the clearance of murine norovirus through the virus-specific secretory IgA pathway. NKT cells are responsible for the clearance of murine norovirus through the virus-specific secretory IgA pathway. 2020;21:100722. doi:10.1016/j.bbrep.2019.100722.
- Tang F, Barbacioru C, Wang Y, Nordman E, Surani MA, Xu N, Wang X, Bodeau J, Tuch BB, Siddiqui A. mRNA-Seq whole-transcriptome analysis of a single cell. Nat Methods. 2009;6(5):377–382. doi:10.1038/nmeth.1315.
- Chen SS, Li Q. Transforming growth factor-β1 (TGF-β1) is a bifunctional immune regulator for mucosal IgA responses. Cell Immunol. 1990;128(2):353–361. doi:10.1016/0008-8749(90)90032-m.
- Brandtzaeg P, Kiyono H, Pabst R, Russell MW. Terminology: nomenclature of mucosa-associated lymphoid tissue. Mucosal Immunol. 2009;1(1):31. doi:10.1038/mi.2007.9.
- Robles EF, Mena-Varas M, Barrio L, Merino-Cortes SV, Balogh P, et al. Homeobox NKX2-3 promotes marginal-zone lymphomagenesis by activating B-cell receptor signalling and shaping lymphocyte dynamics. Nat Commun. 2016;7:11889. doi:10.1038/ncomms11889.
- Veres TZ. Visualizing immune responses of the airway mucosa. Cell Immunol. 2018;350:103865. doi:10.1016/j.cellimm.2018.10.001.