
ABSTRACT
Apolipoprotein B mRNA editing enzyme catalytic polypeptide 3B (APOBEC3B) plays an important role in tumor mutagenesis. However, its clinical significance in gastric cancer (GC) remains largely unknown. We enrolled a total of 482 GC patients from Zhongshan Hospital, Fudan University for immunohistochemistry (IHC) staining to evaluate the prognostic and predictive values of APOBEC3B. Genomic and phenotypic datasets from the Cancer Genome Atlas (TCGA) and Asian Cancer Research Group (ACRG) cohort were downloaded for external validation and complementary bioinformatic analysis. Fresh specimens of additional 60 patients from Zhongshan Hospital, Fudan University were collected to detect CD8+ T cell phenotype with flow cytometry (FCM). The high expression of APOBEC3B indicated inferior overall survival (OS, P < .001 and P = .003) and disease-free survival (DFS, P < .001 and P < .001), yet superior therapeutic responsiveness to fluorouracil-based adjuvant chemotherapy (ACT) in TNM stage II patients. The tumor microenvironment (TME) of APOBEC3B-enriched tumors was characterized by reduced infiltration of tumor reactive CD8+ T cells expressing both effector molecules and immune checkpoints. APOBEC3B high CD8+ T cell high GC patients were most likely to benefit from ACT and PD-1 blockade. Our study demonstrates that APOBEC3B was an independent prognostic and predictive factor in GC. The potential interplay between APOBEC3B and CD8+ T cells merited further investigations.
Introduction
Gastric cancer (GC) is the fifth most frequently diagnosed cancer and the fourth leading cause of cancer-associated mortality worldwide.Citation1 GC is a heterogeneous malignancy, parts of which is closely associated with Epstein–Barr virus (EBV) infection. To date, virus infection has been identified as an important factor for the development of malignancies, such as chronic infection of hepatitis B virus (HBV), human papillomavirus (HPV), human T-cell lymphotropic virus-1 (HTLV-1), and EBV. Infection of these viruses was associated with 12–20% of the incidence of malignancies worldwide.Citation2,Citation3 The underlying mechanisms of virus-associated tumorigenesis might involve multiple processes which led to the acquisition of cancer hallmarks.Citation2,Citation3
However, the human body has evolved a profound antivirus system to protect us from infection, which reduces the replication of viruses through the modulation of specific host genes expression, as well as the activation of innate and adaptive immunity.Citation4–6 Additionally, cytokines secreted by the host as a response to virus infection could induce the expression of activation-induced cytidine deaminase/apolipoprotein B mRNA editing enzyme catalytic polypeptide (AID/APOBEC) family genes, including apolipoprotein B mRNA editing enzyme catalytic polypeptide 3B (APOBEC3B).Citation7–9 Mechanistically, APOBEC3B fuels mutagenic process via specifically catalyzing cytosine to thymine (C to T) deamination transition.Citation10 It favors typical TCW motifs (W: adenine [A] or thymine [T]), and preferentially catalyzes TCW to TTW or TGW.Citation11–13 APOBEC3B was primarily identified as a cellular defense system against retroviruses.Citation14,Citation15 Subsequent studies demonstrated that APOBEC3B participated in initiation and progression of several malignancies,Citation16–19 and played a significant role in genomic instabilityCitation20 and oncogene alteration.Citation13 Overexpression of APOBEC3B was frequently reported across various human tumor lesionsCitation21,Citation22 and cancer cell lines,Citation16,Citation19 and was closely associated with tumor stage, recurrence, distal metastasis, and prognosis.Citation11,Citation23–25 Interestingly, APOBEC3B played a paradoxical role in drug sensitivity, as some studies indicated that overexpression of APOBEC3B orchestrated therapeutic responsiveness to platinum-based chemotherapy,Citation21,Citation26 whereas others reported that APOBEC3B might promote therapeutic resistance to tamoxifen in estrogen receptor (ER)-positive breast cancer.Citation27 Furthermore, the potential multifaceted interplay between APOBEC3B and tumor immune microenvironment (TME) was also revealed. APOBEC3B could induce the accumulation of MDSCs and TAMs via the CCL2 pathway.Citation17 Other studies have also reported that APOBEC3B positively correlated with PD-L1 expression and T cell infiltration within TME, and APOBEC3B could even serve as a potential predictor for immunotherapy.Citation11
As for GC, prior studies have demonstrated that APOBEC3B expression is significantly elevated in EBV-positive subtype GC,Citation12 and correlates with unfavorable prognosis.Citation22 Nevertheless, it remains to be elucidated how APOBEC3B interacts with therapeutic targets in GC, which largely restricts the clinical use of APOBEC3B as a potential biomarker for the decision-making of adjuvant chemotherapy (ACT) or immunotherapy application. Consequently, this study aimed to explore the predictive value of therapeutic responsiveness of APOBEC3B in GC, and to disclose the immune evasive mechanism of GC with APOBEC3B enrichment. Our study underscored the clinical significance of APOBEC3B in GC and provided a rationale to stratify GC patients for individualized treatment.
Materials and methods
Patients and tissue samples
This study mainly contained four datasets Zhongshan Hospital (ZSHS) Cohort, TCGA Cohort, Asian Cancer Research Group (ACRG) Cohort and flow cytometry (FCM) cohort. These datasets comprised original 1296 patients, of which 1172 were eligible for further analysis (Supplementary Figure S1). The ZSHS Cohort enrolled 496 GC patients who underwent radical gastrectomy and standard D2 lymphadenectomy between August 2007 and December 2008 in Zhongshan Hospital, Fudan University (Shanghai, China). Fourteen patients were excluded due to data missing or dot loss. Consequently, the ZSHS Cohort contained 482 patients with fundamental clinical information, including age, sex, tumor location, tumor size, Lauren classification, tumor-node-metastasis (TNM) stage, and application of fluorouracil-based ACT (Supplementary Table S1). The endpoints of interest were overall survival (OS) and disease-free survival (DFS). Survival time was computed from the date of gastrectomy to the date of death or disease-recurrence, or the last follow-up. Patients were observed until April 2014 with the median follow-up time was 42 months. Tissue samples from the primary GC lesions and peritumoral counterparts were correspondingly obtained and constructed as tumor microarrays (TMAs, manufactured by Shanghai Outdo Biotech Co., Ltd.)Citation28 and preserved at 4°C. Subsequently, the ZSHS Cohort was randomly divided into two data sets, Discovery Set (n = 242) and Validation Set (n = 240). Additional two datasets from TCGA and ACRG were utilized for bioinformatic analysis. Clinical and genomic data from TCGA Cohort were downloaded from http://www.cbioportal.org and https://xenabrowser.net/ in August 2020. A total of 380 GC patients from TCGA database were analyzed in this study, while other 60 patients were excluded due to the lack of clinical information or genomic data. Clinical and genomic data from ACRG Cohort were downloaded from https://www.ncbi.nlm.nih.gov/geo/query/acc.cgi?acc=GSE62254 in April 2020. This cohort originally included 300 patients, whereas 50 patients were excluded due to lack of data or clinical information. FCM Cohort contained 60 GC patients who underwent radical gastrectomy and standard D2 lymphadenectomy from August 2018 to November 2018 in Zhongshan Hospital, Fudan University. Fresh tumor specimens of FCM cohort were collected for flow cytometry analysis, and the corresponding formalin-fixed and paraffin-embedded tissue blocks were also obtained and constructed as an independent TMA to evaluate the expression level of APOBEC3B in gastric cancer tissues. Our study was examined and approved by the Clinical Research Ethics Committee of Zhongshan Hospital, Fudan University, with the approval number Y2015-054. All patients were informed of our study purpose and the use of relevant data and samples.
Immunohistochemistry (IHC)
IHC was applied to detect the expression of APOBEC3B and the infiltration of immune cells on each TMA slide. The IHC procedure was performed as previously describedCitation29 and checked according to published criteria.Citation30 First, the TMA slides were baked at 60°C for 6 hours. Next, the TMA slides were deparaffinized in three washes of xylene, followed by rehydrated with graded alcohol sequentially from 100%, 95%, 85%, to 75%. Then, the slides were dipped in endogenous peroxidase blockers (ZSGB-BIO) for 30 minutes at 37°C. TMAs were heated with a pressure cooker in an appropriate buffer solution (according to manufacturer’s instructions) for 3 min as soon as the cooker had reached full pressure (around 100°C) for antigen retrieval, and then incubated with 10% goat serum (ZSGB-BIO) at 37°C for 2 hours to avoid nonspecific background staining. Subsequently, these slides were incubated with diluted primary antibody at 4°C overnight (Supplementary Table S2). After recovering at 37°C for 1 h, the slides were immersed in HRP-labeled secondary antibody (ZSGB-BIO) for 30 minutes, and subsequently stained with diaminobenzidine (DAB, ZSGB-BIO). TMA slides were placed in hematoxylin (Servicebio) for counterstaining. Finally, slides were immersed in three washes of xylene, and then mounted with a coverslip and mounting medium (ZSGB-BIO). Negative control for IHC staining excluded primary antibody incubation, while remaining procedures were the same as the experimental group. Antibodies and other reagents with source and catalog numbers were listed (Supplementary Table S2 and S3).
Evaluation of IHC score
All IHC evaluations in this study were performed independently by two experienced pathologists, both of whom were blinded to clinical information. The IHC score of APOBEC3B was defined according to the cellular staining intensity and the proportion of stained epithelial cells. The staining intensity of APOBEC3B were classified into four grades, 0 (negative), 1 (slightly staining), 2 (moderate staining), and 3 (strong staining), while the proportion was defined as the percentage of positive epithelial cells (0–100%). As a result, the APOBEC3B IHC score ranged from 0 to 300. Briefly, the APOBEC3B IHC score was defined as the average of scores suggested by the two independent pathologists. Minimal-P-value-method provided by X-tile (Version 3.6.1, Yale University) was used to automatically find cutoff for APOBEC3B IHC score, which was 130. Samples with contradictory disposition in APOBEC3B expression level (APOBEC3B high or APOBEC3B low) received second round evaluations from both the pathologists (Supplementary Table S4, second round Kappa score: 0.808, Spearman correlation coefficients: 0.808, P < .001). Finally, 221 gastric tissues were defined as APOBEC3B high (IHC score ≥ 130), remaining 261 samples were regarded as APOBEC3B low (IHC score <130). In addition, the third quartile (>190) and the first quartile (<45) were used to define the APOBEC3Bup and APOBEC3B down subgroups as previously described.Citation11 The two independent pathologists evaluated the IHC scores for immune cells in a blinded fashion, as well. To evaluate the density of stained immune cells, the pathologists chose three representative areas of intratumor and peritumor dots and screened and measured each dot under a microscope at × 200 magnification, respectively. IHC-stained cells in each area were quantified and calculated as the number of cells per field. The antibodies utilized for IHC were listed (Supplementary Table S2).
FCM
After surgery, fresh specimens of GC tissues were collected. The fresh specimens were digested with collagenase IV (Sigma Aldrich) and incubated with BD GolgiStop Protein Transport Inhibitor (Containing Monensin, BD Biosciences, San Diego, CA, USA) for 2 hours at 37°C. After that, tumor suspensions were filtered through 70 mm cell strainer (BD Falcon) and gently centrifuged at 450 rcf for 6 minutes, supernatants were thereby removed. Subsequently, cells were incubated with lysing buffer (BD Biosciences) on ice for 10 minutes to remove mixed red blood cells. Cells were stained by surface markers in cell staining buffer for 30 minutes at 4°C in the dark. If necessary, a Fixation/Permeabilization Solution Kit (BD Biosciences) was applied. Intracellular cytokine staining was then performed with the corresponding antibodies for 30 minutes at 4°C in the dark. Stained cells were washed, re-suspended in phosphate-buffered saline/0.1% bovine serum albumin (BSA) plus azide. Finally, FCM was performed by FACSCelesta flow cytometer (BD Biosciences) and analyzed using FlowJo Software (Tree Star). Antibodies and other reagents utilized for FCM were listed (Supplementary Tables S3 and S5).
Statistical analysis
Student’s t test or Mann–Whitney U-test was applied for continuous variables. One-way ANOVA followed by Tukey’s multiple comparison tests was used to analyze datasets containing more than two groups. Chi-square test or Fisher’s exact test was used to analyze categorical variables. Kaplan–Meier curves, log-rank test, and Cox proportional hazard regression were applied to evaluate the clinical significance of clinicopathological parameters. Correlation tests were performed using Pearson and Spearman correlation coefficients. Interaction tests were applied to estimate the interaction between APOBEC3B and ACT. For each statistical test, patients with missing data were excluded. Chi-square test or Fisher’s exact test was performed by MedCalc Statistical Software version 15.6.1 (MedCalc Software bvba, Ostend, Belgium). The remaining statistical analyses were analyzed with SPSS software version 23.0 (IBM SPSS). GraphPad Prism 9.0 (GraphPad Software, La Jolla, CA) and R-4.0.3 (R Foundation for Statistical Computing, http://www.r-project.org/) were applied for data visualization. Heatmaps were obtained online using Morpheus (https://software.broadinstitute.org/morpheus). All software and R packages used in this study were listed (Supplementary Table S6). All tests were two-tailed, and P < .05 was considered as statistically significant. Detailed statistical methods were shown in Supplementary Table S7.
Results
APOBEC3B was elevated in GC and correlated with tumor progression
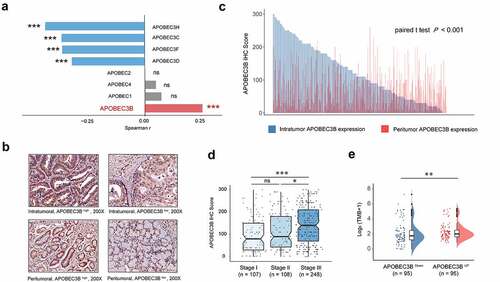
As APOBEC family members (APOBECs) are potentially involved in tumorigenesis, we first studied their correlations with the fraction of copy number altered (CNA) genome in GC. Of all APOBECs, APOBEC3B was the only member to show positive correlation with the fraction of CNA ( and Supplementary Figure S2). As a result, IHC staining of APOBEC3B was performed ( and Supplementary Figure S3A and B). Gastric tumors displayed significantly higher expression of APOBEC3B, compared with peritumor tissues (P < .001; ). Consequently, we mainly focused on intratumoral APOBEC3B in our subsequent study. The association between APOBEC3B and tumor-node-metastasis (TNM) stage was also inspected. Notably, APOBEC3B was significantly accumulated in TNM stage III tumors, compared with stage II or stage I tumors (). Specifically, APOBEC3B was positively correlated with either tumor invasion or regional lymph node metastasis (Supplementary Figures S3C and D). These results together indicate that APOBEC3B may be involved in tumor progression of GC. Additionally, as a driver of tumorigenesis, tumor mutation burden (TMB) has been reported in a series of solid tumors, which could potentially indicate the therapeutic responsiveness to immunotherapy.Citation31 In the present study, we found that higher expression of APOBEC3B indicated higher TMB (). Taken together, our findings suggest that APOBEC3B is elevated in GC and might be involved in tumor progression.
Figure 1. APOBEC3B expression was elevated in GC and correlated with tumor progression. a, Correlation between APOBEC family members and the fraction of copy number altered genome. Spearman rank test, *P < .05, **P < .01, ***P < .001, ns refers to not significant. b, Representative IHC staining of APOBEC3B in GC intratumor and peritumor tissues. APOBEC3B positive cells were stained by brown. Original magnification: × 200. c, Bar chart displayed the distribution of intratumoral (blue) and peritumoral (red) APOBEC3B IHC scores (n = 482). Paired t test P < .001. d, APOBEC3B expression in gastric cancer positively correlated with TNM stage. One-way ANOVA followed by Tukey multiple comparisons, *P < .05, **P < .01, ***P < .001, ns refers to not significant. e, Tumor mutation burden defined as non-silent mutations per Mb was elevated in APOBEC3B-enriched patients. Mann–Whitney U test, *P < .05, **P < .01, ***P < .001, ns refers to not significant. All presented P values were two-tailed
Features of molecular characteristics based on APOBEC3B expression in GC
Since APOBEC3B was associated with increased CNA and TMB (), tumor driver genes were also inspected. Among the 10 most frequently mutated genes in GC, TP53 was the only one that showed a remarkable association with APOBEC3B (Supplementary Figure S4A, B).
Recent work has revealed the potential of molecular subtyping to support patient stratification and individualized therapy in GC.Citation32,Citation33 In ZSHS Cohort, APOBEC3B expression was elevated in Epstein–Barr virus (EBV)-positive, microsatellite unstable (MSI), and chromosomal instable (CIN) subtype GC, compared with genomic stable (GS) subtype (Supplementary Figure S4C-E). We also found that EBV-positive GC held significantly higher APOBEC3B expression than EBV-negative ones (Supplementary Figure S4D), which was in accordance with a previous study.Citation12 Collectively, these results suggested that APOBEC3B was associated with genomic instability and driver gene mutation in GC, and might be particularly implicated in the promotion of EBV-positive tumors.
APOBEC3B predicted unfavorable prognosis in GC
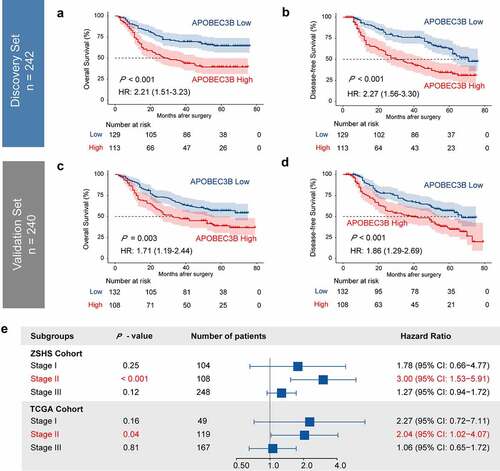
Prognostic value of APOBEC3B was examined in ZSHS Cohort and TCGA Cohort. In either Discovery Set (n = 242) or Validation Set (n = 240) of ZSHS Cohort, higher expression of APOBEC3B predicted significant inferior OS and DFS (). The five-year survival rate of APOBEC3B high GC was 47.4% in Discovery Set, and 47.2% in Validation Set. Correspondingly, the five-year survival rate of APOBEC3B low GC was 66.9% in Discovery Set, and 60.6% in Validation Set. Among all patient subgroups, APOBEC3B appeared to be a stronger prognosticator in TNM stage II GC patients in both our internal ZSHS Cohort and external TCGA Cohort (). We subsequently performed univariate and multivariate Cox analysis to determine whether APOBEC3B can function as an independent predictor in GC. Multivariate Cox analysis incorporated APOBEC3B and six recognized clinicopathological parameters (), and suggested APOBEC3B as an independent prognosticator for both OS and DFS. Conclusively, these results indicated that APOBEC3B can predict unfavorable prognosis in GC.
Table 1. Univariate and multivariate analysis for clinicopathological parameter in GC
Figure 2. Elevated expression of APOBEC3B predicted poor prognosis in GC. Four hundred and eighty-two patients in ZSHS Cohort were randomly divided into discovery set (n = 242) and validation set (n = 240). a-d, Kaplan–Meier curves indicated poor OS and DFS in patients with APOBEC3B-enriched tumors from discovery set (a, b) and validation set (c, d). e, Forest plot to show hazard ratio (HR) and 95% confidential interval (CI) of APOBEC3B expression in different TNM stages. Elevated APOBEC3B indicated poor OS in TNM stage II patients in both ZSHS Cohort and TCGA Cohort. All P values were two-sided
Decreased infiltration of CD8+ T cells suggested immune evasion in APOBEC3B-enriched tumors
Considering that APOBEC3B was related to increased genomic instability, APOBEC3B might thereby have a potential impact on antitumor immunity. Consequently, we applied CIBERSORTxCitation34 to investigate the association between APOBEC3B and immune landscape within the tumor microenvironment. APOBEC3B up tumors were found to harbor decreased infiltration of CD8+ T cells and CD4+ T cells, yet elevated infiltration of the M0 macrophages ().
Figure 3. APOBEC3B indicated decreased infiltration of CD8+ T cells in GC. a, The comprehensive immune contexture containing 16 kinds of immune cells was generated by CIBERSORT. Accumulated M0 polarized macrophages whereas decreased CD8+ T cells and CD4+ T cells were observed in APOBEC3B-enriched tumors. b, Flow cytometry analysis detected a trend toward negative association between CD8+ T cells proportion and APOBEC3B. c, Kaplan–Meier curves demonstrated that the infiltration of CD8+ T cells only indicated prolonged OS in APOBEC3B-enriched subgroups. d, Heatmap displayed associations between APOBEC3B expression and CD8+ T cell activation or exhaustion scores. CD8+ T cell phenotypic scores were calculated as corresponding mRNA level divided by CD8A expression. e, Flow cytometry detected the phenotype of CD8+ T cells in APOBEC3B-enriched tumors. Statistical analysis was performed with unpaired t test, *P < .05, **P < .01, ***P < .001. All shown P values were two-tailed
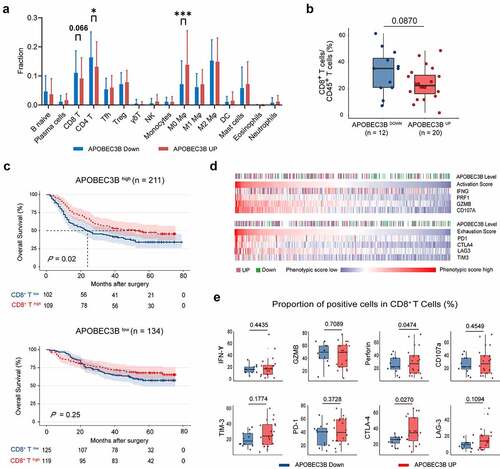
CD8+ T cells infiltration was used to be considered as a positive prognosticator in most cancer types as they could recognize and attack cancer cells.Citation35 However, emerging studies have reported that CD8+ T cells fail to control tumor growth due to a dysfunctional state.Citation36 Recent studies have proposed two primary mechanisms of tumor immune evasion regarding CD8+ T cells: the induction of T cell dysfunction in tumors with high infiltration of CD8+ T cells and the prevention of T cell infiltration in tumors with low CD8+ T cell level.Citation37 Since CD8+ T cells was the predominant effector cells in antitumor immunity, we sought to validate the association between APOBEC3B and CD8+ T cells with the use of flow cytometry. Accordingly, the results of flow cytometry also showed a potential negative association between APOBEC3B and CD8+ T cell infiltration (). Survival analysis demonstrated that CD8+ T cell enrichment could only identify prolonged OS in APOBEC3B high patients, rather than APOBEC3B low patients (), indicating that the CD8+ T cells in APOBEC3B-enriched tumors might be functionally activated. These results motivated us to investigate the differences of CD8+ T cell phenotype in the tumors with distinct APOBEC3B expression. Interestingly, we observed that in APOBEC3B-enriched tumors, CD8+ T cells showed a specific phenotype with both a high activation signature and an exhaustion signature ( and Supplementary Figure S5). FCM analysis also showed that the APOBEC3B-enriched tumors were featured by CD8+ T cells with elevated expression of perforin and cytotoxic T-lymphocyte-associated protein 4 (CTLA-4; ). Conclusively, these results indicate that immune evasion in APOBEC3B-enriched tumors might result from decreased infiltration of CD8+ T cells, rather than T cell dysfunction.
APOBEC3B indicated therapeutic responsiveness in GC patients
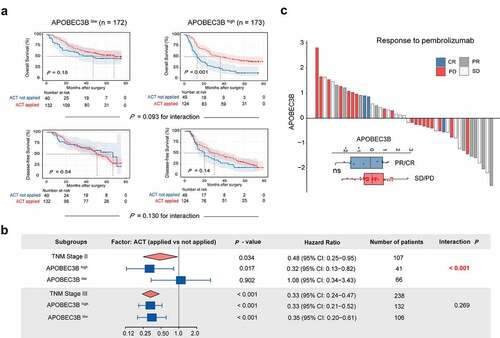
To further explore the clinical significance of APOBEC3B, we sought to determine whether APOBEC3B was predictive of therapeutic responsiveness in GC. First, GC patients in stage II or III with APOBEC3B-enriched tumors tended to have superior responsiveness to fluorouracil, regarding OS (). Furthermore, the stage II patients with APOBEC3B-enriched tumors showed significant chemotherapeutic responsiveness ( and Supplementary Figure S6A). However, no difference of chemotherapeutic responsiveness was observed between APOBEC3B high and APOBEC3B low subgroups in stage III patients (Supplementary Figure S6B).
Figure 4. Association between APOBEC3B expression and therapeutic responsiveness in gastric cancer. A, For stage II or III patients (n = 345), Kaplan–Meier curves with univariate Cox analysis displayed responsiveness to fluorouracil-based adjuvant chemotherapy (ACT) in subgroups stratified by APOBEC3B expression. B, Forest plots showed the prognostic impact of ACT in different subgroups. Univariate Cox analysis was applied. ACT prolonged overall survival of TNM stage II GC patients with APOBEC3B enrichment (P = .017, HR: 0.32), and GC patients in TNM stage III (P < .001, HR: 0.33). Receiving ACT did not significantly impact OS in TNM stage II GC patients with low APOBEC3B expression (P = .902, HR: 1.08) C, Waterfall plot showed responsiveness to pembrolizumab according to APOBEC3B expression (unpaired t test). PR: partial response, CR: complete response, SD: stable disease, PD: progressive disease. *P < .05, **P < .01, ***P < .001, ns refers to not significant. All presented P values were two-tailed
In recent years, targeted therapies, including Trastuzumab, Ramucirumab, and Bemarituzumab,Citation38,Citation39 have drawn growing attention in the adjuvant treatment of GC. Herein, we inspected the association between APOBEC3B and the corresponding pathways in GC. Known as promising therapeutic targets in gastric cancer, human epidermal growth factor receptor 2 (HER2) and vascular endothelial growth factor (VEGF) signaling score were both elevated in APOBEC3B-enriched tumors, whereas no association was observed between CLDN18.2 or fibroblast growth factor receptor 2 (FGFR2) and APOBEC3B in GC (Supplementary Figure S6C). Additionally, we also inspected the potential value of APOBEC3B in predicting immunotherapeutic responsiveness to programmed cell death protein 1 (PD-1) blockade in GC. However, no association between immunotherapeutic responsiveness and APOBEC3B was observed in our current study (), which might result from the relatively small size of the ICB Cohort.Citation40
Association between CD8+ T infiltration and therapeutic responsiveness in GC with APOBEC3B enrichment
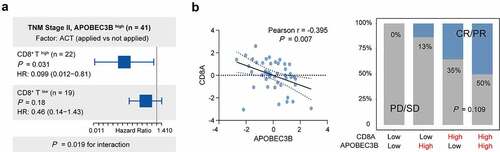
To provide insights into the underlying effect of CD8+ T cells within APOBEC3B enriched tumors, we next investigated the linkage between CD8+ T infiltration and therapeutic responsiveness in GC with APOBEC3B enrichment. First, for patients in TNM stage II with APOBEC3B enrichment, subgroup analysis was used to study the association between CD8+ T cells infiltration and ACT sensitivity (). Only patients with higher CD8+ T cells infiltration showed superior responsiveness to fluorouracil-based ACT. Moreover, in the ICB Cohort, patients in APOBEC3B high CD8A high subgroup held the largest population of ICB responders (CR or PR, 50%), while CD8A negatively correlated with APOBEC3B expression (). Contrastingly, only 13% of the patients in APOBEC3B high CD8A low subgroup responded to pembrolizumab. Conclusively, CD8+ T cell abundance within APOBEC3B high tumors indicated favorable responsiveness to both fluorouracil-based ACT and PD-1 blockade, again highlighting the antitumor role of those CD8+ T cells.
Figure 5. Association between CD8+ T infiltration and therapeutic responsiveness in GC with APOBEC3B enrichment. a, In TNM stage II GC with APOBEC3B enrichment, the infiltration of CD8+ T affected the clinical significance of ACT. For patients with high CD8+ T cells, application of ACT indicated superior OS (P = .031, HR: 0.099). However, the survival benefit of ACT was not statistically significant in GC with CD8+ T low infiltration (P = .18, HR: 0.46). b, In ICB Cohort, APOBEC3B negatively correlated with CD8A (Pearson r = −0.395, P = .007). The cutoff values of APOBEC3B and CD8A were both zero. Patients in APOBEC3B and CD8A double-high subgroup held the largest population of ICB responder (CR or PR, 50%). Only 13% of patients in APOBEC3B high CD8A low subgroup showed response to ICB. Chi-square test P = .109. All presented P values were two-tailed
Discussion
Genomic instability is a hallmark of cancer. Our study provided a comprehensive view of the interaction between APOBEC3B and molecular identities. Of note, APOBEC3B was positively associated with the overall TMB, CNA fraction, and oncogene TP53 mutation. Increased TMB or genomic instability is a double-edged sword. This might promote cancer progression, while also increasing neoantigen release, followed by recognition and activation of the host immune system.Citation31 Consequently, genomic instability is generally associated with poor prognosis, but confers sensitivity to immunotherapy and DNA damaging agents.Citation41–45 Consistent with these theories, our study revealed that the patients with APOBEC3B-enriched GC exhibited poor prognosis yet superior responsiveness to fluorouracil-based chemotherapy. In addition, given that APOBEC3B indicated increased HER2 and VEGF signaling scores, patients with APOBEC3B-enriched tumors might benefit more from these targeted therapies.
ICB is a mainstay of cancer immunotherapy.Citation46 Existing ICB therapies principally aim to reverse T cell exhaustion and unleash antitumor potential. Therefore, sufficient infiltration of tumor reactive CD8+ T cell is a precondition of ICB response.Citation35 Our study unraveled that CD8+ T cells in APOBEC3B-enriched tumors displayed both cytotoxic and exhausted phenotypes, indicating a pre-exhausted state that persisted in durable response to ICB.Citation47 Consistently, CD8+ T cells in APOBEC3B-enriched tumors are correlated with both prolonged OS and favorable therapeutic responsiveness. However, no significant association between immunotherapeutic responsiveness and APOBEC3B was observed in our current study, which might partially result from the negative correlation between APOBEC3B and CD8+ T cell infiltration. As patients with APOBEC3B enrichment and CD8+ T cell abundance appeared to benefit most from ACT and PD-1 blockades in this study, more aggressive treatments might be rewarding. In addition, strategies to increase CD8+ T cell infiltration might improve clinical outcomes of APOBEC3B-enriched GC.
Overall, our study demonstrated that APOBEC3B was an independent adverse prognosticator, yet predicted favorable responsiveness to fluorouracil-based ACT in TNM stage II GC. In addition, association with immune inactivation and targetable genomic alterations revealed APOBEC3B as a potential biomarker for immunotherapy and targeted therapy. Collectively, these findings provide a rationale for APOBEC3B-guided treatment selection in GC.
There are several limitations in this study. First, our study was primarily observational. Although we suggested APOBEC3B high GC might be immune-inactive due to decreased infiltration of CD8+ T cells, the underlying mechanisms for the lack of CD8+ T cells within APOBEC3B-enriched tumors remain unclear. In addition, the application of minimal-P-value-method to find the cutoff value for APOBEC3B IHC score in ZSHS Cohort might partly impede the reproducibility. Future studies in different cohorts are encouraged to deliberate the optimal cutoff of APOBEC3B expression for clinical use. Moreover, the immunotherapy cohort analyzed in this study is relatively small. Therefore, we also advocated to validate the predictive value of APOBEC3B in immunotherapy in larger, multi-centered, and randomized clinical trials.
Consent for publication
Not applicable.
Ethics approval and consent to participate
The study was approved by the Clinical Research Ethics Committee of Zhongshan Hospital, Fudan University, with the approval number Y2015-054. Written informed consent was obtained from each patient included and this study was performed in accordance with the Declaration of Helsinki.
Authors contributions
S. Xia, Y. Gu, H. Zhang, and Y. Fei for the acquisition of data, analysis, and interpretation of data, statistical analysis, and drafting of the manuscript; Y. Cao, H. Fang, J. Wang, C. Lin, H. Zhang, H. Li, H. He, and J. Xu for technical and material support; R. Li, H. Liu, and W. Zhang for study concept and design, analysis, and interpretation of data, drafting of the manuscript, obtained funding and study supervision. All authors read and approved the final manuscript.
Supplemental Material
Download ()Acknowledgments
We thank Dr. Lingli Chen (Department of Pathology, Zhongshan Hospital, Fudan University, Shanghai, China) and Dr. Yunyi Kong (Department of Pathology, Shanghai Cancer Center, Fudan University, Shanghai, China) for their excellent pathological technology help. The results of our study are in part based upon data generated by the TCGA Research Network: https://www.cancer.gov/tcga.
Disclosure statement
The authors declare no conflict of interest.
Availability of data and materials
Clinical and genomic data from the Cancer Genome Atlas (TCGA-STAD) were downloaded from http://www.cbioportal.org and https://xenabrowser.net/. Somatic mutation data of TCGA-STAD Cohort was downloaded from https://portal.gdc.cancer.gov/. Clinical and genomic data of GSE62254 (ACRG Gastric Cohort) were downloaded from https://www.ncbi.nlm.nih.gov/geo/query/acc.cgi?acc=GSE62254. Clinical and genomic data from the ICB cohort were downloaded from http://tide.dfci.harvard.edu/download/. Data from ZSHS Cohort are available from the corresponding author upon reasonable request.
Supplementary material
Supplemental data for this article can be accessed on the publisher’s website
Additional information
Funding
References
- Sung H, Ferlay J, Siegel RL, et al. Global cancer statistics 2020: GLOBOCAN estimates of incidence and mortality worldwide for 36 cancers in 185 countries. CA Cancer J Clin. 2021;71(3):209–10. doi:10.3322/caac.21660.
- White MK, Pagano JS, Khalili K. Viruses and human cancers: a long road of discovery of molecular paradigms. Clin Microbiol Rev. 2014;27(3):463–481. doi:10.1128/CMR.00124-13.
- Luo GG, Ou JH. Oncogenic viruses and cancer. Virol Sin. 2015;30(2):83–84. doi:10.1007/s12250-015-3599-y.
- Teixeira AA, Marchiò S, Dias‐Neto E, Nunes DN, Da Silva IT, Chackerian B, Barry M, Lauer RC, Giordano RJ, Sidman RL, et al. Going viral? Linking the etiology of human prostate cancer to the PCA3 long noncoding RNA and oncogenic viruses. EMBO Mol Med. 2017;9(10):1327–1330. doi:10.15252/emmm.201708072.
- Saez-Cirion A, Manel N. Immune Responses to Retroviruses. Annu Rev Immunol. 2018;36(1):193–220. doi:10.1146/annurev-immunol-051116-052155.
- Albanese M, Tagawa T, Buschle A, Hammerschmidt W. MicroRNAs of Epstein-Barr virus control innate and adaptive antiviral immunity. J Virol. 2017;91(16). doi:10.1128/JVI.01667-16.
- Siriwardena SU, Chen K, Bhagwat AS. Functions and malfunctions of mammalian DNA-Cytosine deaminases. Chem Rev. 2016;116(20):12688–12710. doi:10.1021/acs.chemrev.6b00296.
- Seplyarskiy VB, Soldatov RA, Popadin KY, Antonarakis SE, Bazykin GA, Nikolaev SI. APOBEC-induced mutations in human cancers are strongly enriched on the lagging DNA strand during replication. Genome Res. 2016;26(2):174–182. doi:10.1101/gr.197046.115.
- Roberts SA, Sterling J, Thompson C, Harris S, Mav D, Shah R, Klimczak L, Kryukov G, Malc E, Mieczkowski P, et al. Clustered mutations in yeast and in human cancers can arise from damaged long single-strand DNA regions. Mol Cell. 2012;46(4):424–435. doi:10.1016/j.molcel.2012.03.030.
- Swanton C, McGranahan N, Starrett GJ, Harris RS, Enzymes: APOBEC, Enzymes: APOBEC, Enzymes: APOBEC. Mutagenic fuel for cancer evolution and heterogeneity. Cancer Discov. 2015;5(7):704–712. doi:10.1158/2159-8290.CD-15-0344.
- Wang S, Jia M, He Z, Liu XS. APOBEC3B and APOBEC mutational signature as potential predictive markers for immunotherapy response in non-small cell lung cancer. Oncogene. 2018;37(29):3924–3936. doi:10.1038/s41388-018-0245-9.
- Bobrovnitchaia I, Valieris R, Drummond RD, Lima JP, Freitas HC, Bartelli TF, Amorim MG, Nunes DN, Dias‐Neto E, Silva IT, et al. APOBEC-mediated DNA alterations: a possible new mechanism of carcinogenesis in EBV-positive gastric cancer. Int J Cancer. 2020;146(1):181–191. doi:10.1002/ijc.32411.
- Roberts SA, Lawrence MS, Klimczak LJ, Grimm SA, Fargo D, Stojanov P, Kiezun A, Kryukov GV, Carter SL, Saksena G, et al. An APOBEC cytidine deaminase mutagenesis pattern is widespread in human cancers. Nat Genet. 2013;45(9):970–976. doi:10.1038/ng.2702.
- Koito A, Ikeda T. Intrinsic immunity against retrotransposons by APOBEC cytidine deaminases. Front Microbiol. 2013;4:28. doi:10.3389/fmicb.2013.00028.
- Venkatesan S, Rosenthal R, Kanu N, McGranahan N, Bartek J, Quezada SA, Hare J, Harris RS, Swanton C. Perspective: APOBEC mutagenesis in drug resistance and immune escape in HIV and cancer evolution. Ann Oncol. 2018;29(3):563–572. doi:10.1093/annonc/mdy003.
- Burns MB, Lackey L, Carpenter MA, Rathore A, Land AM, Leonard B, Refsland EW, Kotandeniya D, Tretyakova N, Nikas JB, et al. APOBEC3B is an enzymatic source of mutation in breast cancer. Nature. 2013;494(7437):366–370. doi:10.1038/nature11881.
- Wang D, Li X, Li J, Lu Y, Zhao S, Tang X, Chen X, Li J, Zheng Y, Li S, et al. APOBEC3B interaction with PRC2 modulates microenvironment to promote HCC progression. Gut. 2019;68(10):1846–1857. doi:10.1136/gutjnl-2018-317601.
- Roper N, Gao S, Maity TK, Banday AR, Zhang X, Venugopalan A, Cultraro CM, Patidar R, Sindiri S, Brown A-L, et al. APOBEC mutagenesis and Copy-Number alterations are drivers of proteogenomic tumor evolution and heterogeneity in metastatic thoracic tumors. Cell Rep. 2019;26(10):2651–2666 e2656. doi:10.1016/j.celrep.2019.02.028.
- Leonard B, Hart SN, Burns MB, Carpenter MA, Temiz NA, Rathore A, Vogel RI, Nikas JB, Law EK, Brown WL, et al. APOBEC3B upregulation and genomic mutation patterns in serous ovarian carcinoma. Cancer Res. 2013;73(24):7222–7231. doi:10.1158/0008-5472.CAN-13-1753.
- Shinohara M, Io K, Shindo K, Matsui M, Sakamoto T, Tada K, Kobayashi M, Kadowaki N, Takaori-Kondo A. APOBEC3B can impair genomic stability by inducing base substitutions in genomic DNA in human cells. Sci Rep. 2012;2(1):806. doi:10.1038/srep00806.
- Serebrenik AA, Argyris PP, Jarvis MC, Brown WL, Bazzaro M, Vogel RI, Erickson BK, Lee S-H, Goergen KM, Maurer MJ, et al. The DNA cytosine deaminase APOBEC3B is a molecular determinant of platinum responsiveness in clear cell ovarian cancer. Clin Cancer Res. 2020;26(13):3397–3407. doi:10.1158/1078-0432.CCR-19-2786.
- Zhang J, Wei W, Jin HC, Ying RC, Zhu AK, Zhang FJ. The roles of APOBEC3B in gastric cancer. Int J Clin Exp Pathol. 2015;8:5089–5096.
- Sieuwerts AM, Willis S, Burns MB, Look MP, Gelder MEMV, Schlicker A, Heideman MR, Jacobs H, Wessels L, Leyland-Jones B, et al. Elevated APOBEC3B correlates with poor outcomes for estrogen-receptor-positive breast cancers. Horm Cancer. 2014;5(6):405–413. doi:10.1007/s12672-014-0196-8.
- Cescon DW, Haibe-Kains B, Mak TW. APOBEC3B expression in breast cancer reflects cellular proliferation, while a deletion polymorphism is associated with immune activation. Proc Natl Acad Sci U S A. 2015;112(9):2841-2846. doi:10.1073/pnas.1424869112.
- Sieuwerts AM, Schrijver WA, Dalm SU, et al. Progressive APOBEC3B mRNA expression in distant breast cancer metastases. PLoS One. 2017;12(1):e0171343. doi:10.1371/journal.pone.0171343.
- Nikkila J, Kumar R, Campbell J, Brandsma I, Pemberton HN, Wallberg F, Nagy K, Scheer I, Vertessy BG, Serebrenik AA, et al. Elevated APOBEC3B expression drives a kataegic-like mutation signature and replication stress-related therapeutic vulnerabilities in p53-defective cells. Br J Cancer. 2017;117(1):113–123. doi:10.1038/bjc.2017.133.
- Law EK, Sieuwerts AM, LaPara K, Leonard B, Starrett GJ, Molan AM, Temiz NA, Vogel RI, Meijer-van Gelder ME, Sweep FCGJ, et al. The DNA cytosine deaminase APOBEC3B promotes tamoxifen resistance in ER-positive breast cancer. Science Advances. 2016;2(10):e1601737. doi:10.1126/sciadv.1601737.
- Cao Y, Liu H, Li H, Lin C, Li R, Wu S, Zhang H, He H, Zhang W, Xu J, et al. Association of O6-Methylguanine-DNA Methyltransferase protein expression with postoperative prognosis and adjuvant chemotherapeutic benefits among patients with stage II or III gastric cancer. JAMA Surg. 2017;152(11):e173120. doi:10.1001/jamasurg.2017.3120.
- Cao Y, He H, Li R, Liu X, Chen Y, Qi Y, Yu K, Wang J, Lin C, Liu H, et al. Latency-associated peptide identifies immunoevasive subtype gastric cancer with poor prognosis and inferior chemotherapeutic responsiveness. Ann Surg. 2020. doi:10.1097/SLA.0000000000003833.
- Howat WJ, Lewis A, Jones P, Kampf C, Pontén F, Van Der Loos CM, Gray N, Womack C, Warford A. Antibody validation of immunohistochemistry for biomarker discovery: recommendations of a consortium of academic and pharmaceutical based histopathology researchers. Methods. 2014;70(1):34–38. doi:10.1016/j.ymeth.2014.01.018.
- Chan TA, Yarchoan M, Jaffee E, Swanton C, Quezada SA, Stenzinger A, Peters S. Development of tumor mutation burden as an immunotherapy biomarker: utility for the oncology clinic. Ann Oncol. 2019;30(1):44–56. doi:10.1093/annonc/mdy495.
- Cancer Genome Atlas Research N. Comprehensive molecular characterization of gastric adenocarcinoma. Nature. 2014;513(7517):202–209. doi:10.1038/nature13480.
- Cristescu R, Lee J, Nebozhyn M, Kim K-M, Ting JC, Wong SS, Liu J, Yue YG, Wang J, Yu K, et al. Molecular analysis of gastric cancer identifies subtypes associated with distinct clinical outcomes. Nat Med. 2015;21(5):449–456. doi:10.1038/nm.3850.
- Newman AM, Steen CB, Liu CL, Gentles AJ, Chaudhuri AA, Scherer F, Khodadoust MS, Esfahani MS, Luca BA, Steiner D, et al. Determining cell type abundance and expression from bulk tissues with digital cytometry. Nat Biotechnol. 2019;37(7):773–782. doi:10.1038/s41587-019-0114-2.
- Bruni D, Angell HK, Galon J. The immune contexture and Immunoscore in cancer prognosis and therapeutic efficacy. Nat Rev Cancer. 2020;20:662–680.
- Wherry EJ, Kurachi M. Molecular and cellular insights into T cell exhaustion. Nat Rev Immunol. 2015;15(8):486–499. doi:10.1038/nri3862.
- Jiang P, Gu S, Pan D, Fu J, Sahu A, Hu X, Li Z, Traugh N, Bu X, Li B, et al. Signatures of T cell dysfunction and exclusion predict cancer immunotherapy response. Nat Med. 2018;24(10):1550–1558. doi:10.1038/s41591-018-0136-1.
- Nakamura Y, Kawazoe A, Lordick F, Janjigian YY, Shitara K. Biomarker-targeted therapies for advanced-stage gastric and gastro-oesophageal junction cancers: an emerging paradigm. Nat Rev Clin Oncol. 2021;18(8):473–487. doi:10.1038/s41571-021-00492-2.
- FGFR Inhibitor Stymies Gastric Cancer. Cancer Discov. 2021;11(5):OF3. doi:10.1158/2159-8290.CD-NB2021-0312.
- Kim ST, Cristescu R, Bass AJ, Kim K-M, Odegaard JI, Kim K, Liu XQ, Sher X, Jung H, Lee M, et al. Comprehensive molecular characterization of clinical responses to PD-1 inhibition in metastatic gastric cancer. Nat Med. 2018;24(9):1449–1458. doi:10.1038/s41591-018-0101-z.
- Wang F, Wei XL, Wang FH, Xu N, Shen L, Dai GH, Yuan XL, Chen Y, Yang SJ, Shi JH, et al. Safety, efficacy and tumor mutational burden as a biomarker of overall survival benefit in chemo-refractory gastric cancer treated with toripalimab, a PD-1 antibody in phase Ib/II clinical trial NCT02915432. Ann Oncol. 2019;30(9):1479–1486. doi:10.1093/annonc/mdz197.
- Cao D, Xu H, Xu X, Guo T, Ge W. High tumor mutation burden predicts better efficacy of immunotherapy: a pooled analysis of 103078 cancer patients. Oncoimmunology. 2019;8(9):e1629258. doi:10.1080/2162402X.2019.1629258.
- Yarchoan M, Hopkins A, Jaffee EM. Tumor mutational burden and response rate to PD-1 inhibition. N Engl J Med. 2017;377(25):2500–2501. doi:10.1056/NEJMc1713444.
- Andor N, Maley CC, Ji HP. Genomic instability in cancer: teetering on the limit of tolerance. Cancer Res. 2017;77(9):2179–2185. doi:10.1158/0008-5472.CAN-16-1553.
- Davoli T, Uno H, Wooten EC, Elledge SJ. Tumor aneuploidy correlates with markers of immune evasion and with reduced response to immunotherapy. Science. 2017;355(6322):eaaf8399. doi:10.1126/science.aaf8399.
- Topalian SL, Drake CG, Pardoll DM. Immune checkpoint blockade: a common denominator approach to cancer therapy. Cancer Cell. 2015;27(4):450–461. doi:10.1016/j.ccell.2015.03.001.
- van der Leun AM, Thommen DS, Schumacher TN. CD8(+) T cell states in human cancer: insights from single-cell analysis. Nat Rev Cancer. 2020;20(4):218–232. doi:10.1038/s41568-019-0235-4