
ABSTRACT
Diffuse large B-cell lymphoma (DLBCL) is an aggressive malignancy arising from germinal center or post-germinal center B-cells that retain many of the properties of normal B-cells. Here we show that a subset of DLBCL express the cytokine IL-10 and its receptor. The genetic ablation of IL-10 receptor signaling abrogates the autocrine STAT3 phosphorylation triggered by tumor cell-intrinsic IL-10 expression and impairs growth of DLBCL cell lines in subcutaneous and orthotopic xenotransplantation models. Furthermore, we demonstrate using an immunocompetent Myc-driven model of DLBCL that neutralization of IL-10 signaling reduces tumor growth, which can be attributed to reduced Treg infiltration, stronger intratumoral effector T-cell responses, and restored tumor-specific MHCII expression. The effects of IL-10R neutralization were phenocopied by the genetic ablation of IL-10 signaling in the Treg compartment and could be reversed by MHCII blockade. The BTK inhibitor ibrutinib effectively blocked tumor cell-intrinsic IL-10 expression and tumor growth in this Myc-driven model. Tumors from patients with high IL-10RA expression are infiltrated by higher numbers of Tregs than IL-10RAlow patients. Finally, we show in 16 cases of DLBCL derived from transplant patients on immunosuppressive therapy that IL-10RA expression is less common in this cohort, and Treg infiltration is not observed.
Introduction
Diffuse large B-cell lymphoma (DLBCL) is the most common B-cell malignancy and accounts for approximately 35% of newly diagnosed adult B-cell lymphoma cases worldwide and for almost 30% of lymphoma-associated mortality. The two main molecular subtypes were initially classified as germinal center B-cell like (GCB) DLBCL and activated B-cell like (ABC) DLBCL based on their gene expression profiles; these subtypes have more recently been further stratified into four to five distinct subsets according to their mutation patterns, somatic copy number alterations, and structural variants.Citation1–4DLBCL originates from antigen-activated B-cells that are arrested at distinct maturation stages of the germinal center (GC) reaction. DLBCL cells are known to hijack various pathways essential for normal B-cell development and maturation, and rely especially on transcription factors, signaling molecules and enzymes required for proliferation and differentiation during the GC reaction.Citation5 Examples include MYC, BCL-6, NF-кB, FoxP1 and STAT3, all of which are expressed at distinct stages of the GC reaction, and are aberrantly over-expressed or chronically activated in specific subsets of DLBCL.Citation5–7 The standard first-line therapy regimen for DLBCL, R-CHOP, consists of a combination of chemotherapeutic and cytotoxic agents with the anti-CD20 monoclonal antibody rituximab. Although the majority of patients on R-CHOP are cured, over a third will develop recurrent or refractory, and ultimately fatal disease for which targeted therapies are not yet available.Citation8,Citation9
Constitutive activation of the transcription factor signal transducer and activator of transcription (STAT) 3 is linked to a particularly poor prognosis in DLBCL patients.Citation10–13 We have shown recently that a constitutively active IL-6/STAT3 signaling axis is a critical driver of, and negative prognostic factor in DLBCL.Citation10 Several cytokines activate STAT3 in addition to IL-6; these include type I interferons, EGF and IL-10/IL-22 family cytokines.Citation14 STAT3 was recently shown to counteract, rather than promote type I interferon signaling in ABC-DLBCLCitation15 and EGF fails to activate STAT3 in vitro in DLBCL cell lines.Citation16 We thus focused here on IL-10 as it is well known to activate STAT3 in vitro in DLBCL, high serum levels of IL-10 correlate strongly with poor survival,Citation16 and the loci encoding both chains of the IL-10 receptor (IL10RA and IL10RB) are amplified in a substantial fraction (21 and 10%, respectively) of DLBCL.Citation17 High IL-10 expression of is believed to be one of the consequences of the particularly detrimental co-occurrence of activating mutations in MYD88 and components of the B-cell receptor signaling axis, such as CD79A, CD79B and CARD11.Citation18,Citation19 IL-10 dimerizes and binds to the hetero-tetrameric IL-10R complex composed of two ligand-binding IL-10RA and two accessory IL-10RB subunits. We show here that the expression of IL-10 and its receptor is strongly biased toward the ABC-DLBCL subtype, and is linked to o-occurring MYD88/CARD11 or MYD88/CD79A/B mutations. Constitutive IL-10/IL-10R expression correlates tightly with STAT3 activation, and antibody-mediated neutralization, or genetically engineered loss of IL-10 signaling abrogates lymphoma growth in genetic, serial transplantation and xenotransplantation models of DLBCL through a combination of lymphoma cell-intrinsic as well as -extrinsic mechanisms.
Materials and methods
Cell culture
We used 13 DLBCL cell lines including six of the GCB subtype (SU-DHL4-4, SU-DHL5, SU-DHL6, SU-DHL8, SU-DHL10, and SU-DHL16), six of the ABC subtype (HBL-1, OCI-Ly3, OCI-Ly10, SU-DHL2, RIVA and U-2932) and one unclassified DLBCL cell line (RC-K8) that have been previously described.Citation10,Citation20,Citation21 Treatments with IL-10 and IL-6, anti-IL-10RA and anti-IL-6R antibody and the BTK inhibitor ibrutinib are described in the supplemental methods, as are procedures assessing proliferation, apoptosis and cell viability, cytokine production by ELISA, and Western blotting. The construction of IL-10R knock-out cell lines through a lentiviral approach, and the analysis of TCGA RNA-Seq and whole exome sequencing data is also described in detail in the supplement.
Animal experimentation
M-CSFh;IL-3/GM-CSFh;hSIRPAtg;TPOh;Rag2–γc−IL-6h (MISTRG6) miceCitation22 as well as NSG mice were obtained from a local repository. For the subcutaneous and orthotopic xenotransplantation models, 1 × 10⁷ OCI-Ly3 or HBL-1 cells were injected subcutaneously into both flanks, or intravenously into 6-8 weeks old mixed-gender NSG and MISTRG6 mice. For patient‐derived xenograft transplantation, primary DLBCL cells (obtained from the Clinic of Hematology‐Oncology at the University of Zürich) were transplanted by i.v. injection (1 × 10⁶ cells) to MISTRG6 mice as previously described.Citation10 Ethical approval for work with primary DLBCL cells was obtained from the Ethical Commission of the Canton of Zurich (KEK-ZH-Nr. 2009–0062/1). IL-10 in serum was assessed using a human IL-10 ELISA kit (BD Biosciences). For the syngeneic serial transplantation model of Myc-expressing lymphoma cells, 1 × 10⁶ cryopreserved splenic tumor cells were injected intravenously into 6-8 weeks old mixed-gender mice; all host strains are described in the supplement. Anti-mouse IL-10RA (1B1.3A), anti-mouse MHCII (M5/114), anti-mouse PD-L1 (10 F.9G2), and isotype control antibodies were purchased from BioXCell. Mice were administered an initial 500 µg dose i.p. on the day of tumor cell injection, followed by twice weekly injections of 300 µg. Mice were monitored for disease symptoms including enlarged lymph nodes, weight loss, and hind leg paralysis. Ibrutinib was administered twice weekly at 25 mg/kg via oral gavage. For longitudinal monitoring of Myc-transgenic mice, mice were immunized i.p. at 14-day intervals with 10% sheep red blood cells (Innovative Research) and monitored for clinical symptoms and enlarged lymph nodes. All flow cytometry, immunohistochemistry, qRT-PCR procedures and primer sequences are described in the supplemental methods. All animal studies were reviewed and approved by the Zurich Cantonal Veterinary Office (licenses 235/2015, 132/2019 with their amendments, to A.M.).
Immunohistochemistry of DLBCL patient cohorts
DLBCL patient cohorts were stained for IL-10RA utilizing the Cell Signaling antibody clone D3A7 mAb9145 at 1:50 dilution, for FoxP3 using the Abcam clone ab20034 at 1:50 dilution and for the IL-6R subunit gp130 using the Abcam polyclonal antibody ab170257 at 1:200 dilution. Cut‐offs were determined as described previously.Citation23 For co-immunofluorescence microscopy, cryosections from two patients were stained for CD4 using the Abcam monoclonal antibody ab133616 (clone EPR6855), and for Foxp3 using the Santa Cruz antibody (sc-53876) (clone 2A11 G9), each at 1:100 dilution. Images were recorded using a Leica DM6 B Microscope. Informed consent was obtained from all subjects, and all experiments using human material conformed to the principles set out in the WMA Declaration of Helsinki and the Department of Health and Human Services Belmont Report.
Statistics
All statistical analyses were performed using GraphPad Prism software. Graphs represent means plus standard deviation of at least two independent experiments, and statistical analysis was performed using two-tailed Mann–Whitney test, or one-way ANOVA (in the case of normal data distribution) or by non-parametric ANOVA (Kruskal–Wallis test, in the case of non-normal data distribution) with Tukey’s multiple comparisons correction.
Results
STAT3 is a driver of experimentally induced lymphomagenesis and positively correlates with IL-10 receptor expression in ABC-DLBCL patients
To address experimentally whether Stat3 contributes to lymphomagenesis, we took advantage of Eµ-Myc mice, which harbor a transgene allowing for c-Myc expression under the immunoglobulin heavy chain enhancer and develop lymphomas in the lymph nodes and spleen.Citation24 Murine Myc-driven lymphomas are positive for the B-cell markers CD19 and CD20, and express intermediate levels of CD45; they are further positive for the activation marker CD44 and the ABC-DLBCL markers CD138 and MUM1/IRF4, and negative for the GCB-DLBCL marker BCL-6 (Supplementary Fig. S1a). Approximately 90% of lymphoma cells are positive for Ki67, and all cells express high levels of BCL-2; in contrast to normal B-cells, only very few lymphoma cells express IgD (Supplementary Fig. S1a). The resulting immunophenotype is most consistent with a diagnosis of DLBCL of the ABC subtype.Citation25 Eµ-Myc mice were crossed with Aid-Cre x Stat3fl/fl mice to generate a triple composite strain that allows for GC B-cell-specific ablation of Stat3 upon immunization with sheep red blood cells (SRBCs). All Stat3wt/wt mice developed lymphomas and had to be euthanized within 100 days, whereas the majority of Stat3fl/fl littermates were still alive at this time point (). Heterozygous Stat3fl/wt mice showed an intermediate phenotype (). The spleen and lymph node weights recorded at the study endpoint confirmed the critical role of Stat3 expression in GC B-cells in Myc-induced lymphomagenesis ().
Figure 1. STAT3 promotes experimentally induced lymphomagenesis and germinal center B-cell proliferation and is activated in IL-10RA-expressing ABC-DLBCL patients. a-c, Disease-specific mortality and lymphoma burden of cohorts of 8–25 mice each of the indicated genotypes (n is indicated in the figure). Mice were immunized every two weeks i.v. with sheep red blood cells to induce AID-Cre expression. Pooled weights of the axillary and inguinal lymph nodes are shown in b, and spleen weights are shown in c for all mice of the study. d-f, Mice of the indicated genotypes were immunized once i.v. with sheep red blood cells and assessed 10 days later for their lymph node weights (combined axillary and inguinal; d) and by flow cytometry of splenocytes for their frequencies of GC B-cells (e) and centroblasts (f). g,h, 122 DLBCL cases were stained for IL-10RA and pSTAT3; G reports the number of pSTAT3+ cells per mm2 of all 102 IL-10RA+ and 20 IL-10RA− cases. Representative stainings of IL-10RA and pSTAT3 are shown in h; scale bar, 100 µm. Ii, Correlation of STAT3 with IL10 and IL10RA expression, respectively, plotted for 206 DLBCL patients for whom RNA-seq-based transcriptomic data is available via TCGA. The color codes and symbols indicate genetic subtype as assigned by Schmitz et al.Citation4 Data in a-c are pooled from four cohorts of littermates; data in d-f are pooled from three independent studies. Horizontal lines indicate medians throughout. Statistical comparisons were performed either by one-way ANOVA (in the case of normal data distribution) or by non-parametric ANOVA (Kruskal–Wallis test, in the case of non-normal data distribution) with Tukey’s multiple comparisons correction, or by log rank test (in i). n is indicated in each figure panel. ns, not significant, *p < .05, **p < .01, ***p < .005, ****p < .0001
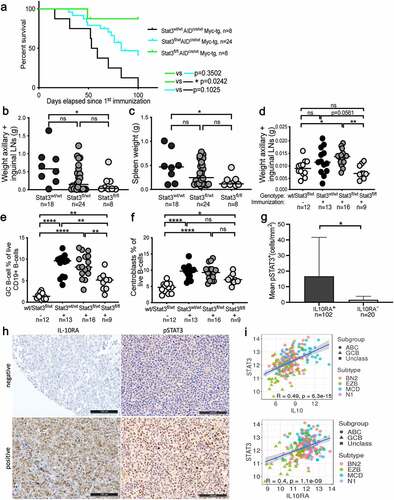
To examine whether the loss of Stat3 predisposes to GC B-cell hyperproliferation, we immunized the above-mentioned Aid-Cre x Stat3fl/fl mice (not expressing Myc) with a single dose of SRBCs to induce GCs and Aid-Cre expression. SRBC immunization resulted in larger inguinal and axillary lymph nodes and an increase of splenic CD19+CD95+CD38low GC B-cell frequencies and CXCR4hiCD86low centroblast frequencies in Stat3wt/wt and Stat3fl/wt mice as determined by flow cytometry; these effects were reduced in Stat3fl/fl mice (). Centrocyte frequencies were unchanged (Supplementary Fig. S1b). Spleens of Stat3fl/fl mice exhibited fewer GCs than the other two genotypes, and individual GCs were smaller as assessed by staining spleen sections for the proliferation marker Ki67 (Supplementary Fig. S1c-f). The combined results implicate Stat3 in driving the hyperproliferation of murine GC B-cells in a cell-intrinsic manner.
Activation of the IL-10 receptor (IL-10R) is known to drive STAT3 phosphorylation upon binding of the ligand to its dimeric receptor. We therefore asked whether the genetic loss of IL-10R signaling in Aid-Cre x Il10rfl/fl mice, or blockade of IL-10 signaling by a neutralizing antibody to IL-10R would phenocopy the effects of Stat3 ablation in the germinal center compartment. This was indeed the case, as the lymph nodes of Aid-Cre x Il10rfl/fl mice were much smaller than those of their wild type littermates after immunization, and IL-10R neutralization also reduced lymph node sizes to base line (non-immunized) levels (Supplementary Fig. S1g,h). We next asked whether IL-10R expression correlates with phosphorylated STAT3 in patients. We stained tissue microarrays containing 122 well-annotated DLBCL cases with available information for the expression of gp130,Citation10 which also signals via STAT3, to study the expression of IL-10Rα chain (IL-10RA) and pSTAT3. 91 of the 122 cases originated from a published historic cohort,Citation26,Citation27 and 31 were from a prospective clinical trial cohort that has additionally been characterized for 68 recurrently mutated genes in DLBCL.Citation28 Of the 122 cases, 13 (10.6%) expressed gp130, 13 (10.6%) expressed IL-10RA, and 89 (73%) expressed both receptors (Supplementary Fig. S1i); only 7 (5.7%) were negative for both. The correlation between both receptors was statistically significant (Rho = 0.247, p = .018). The expression of IL-10RA was more common in the ABC-DLBCL subtype, which accounted for 74% of IL-10R-positive, but only 58% of IL-10R-negative cases. IL-10RA expression correlated with STAT3 phosphorylation (Rho = 0.258, p = .005); the mean pSTAT3-positivity in the 102 IL-10R-positive DLBCL patients was 16.64 ± 24.99 cells per mm2, whereas this number was 1.57 ± 2.28 cells per mm2 in the 20 IL-10R-negative DLBCL patients (p = .027; ). The expression of STAT3 further correlated well with the expression of both IL10RA and IL10 in a transcriptomic dataset of 206 DLBCL patients available through the Cancer Genome Atlas (TCGA)Citation4 (). The combined results implicate STAT3 in driving DLBCL pathogenesis in a Myc-driven experimental model, and are consistent with the hypothesis that IL-10 signaling contributes to STAT3 activation in this malignancy.
IL-10 is expressed by IL-10R-positive ABC-DLBCL cell lines in a BTK-dependent manner
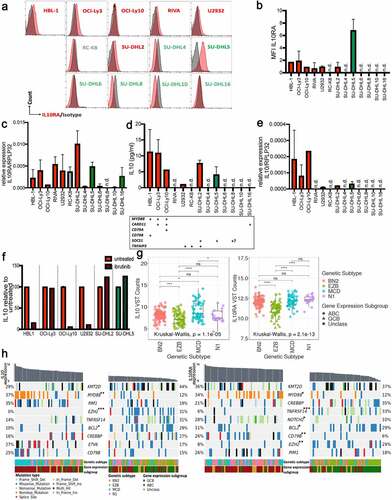
We next examined the expression of IL-10 and its receptor in a panel of 13 DLBCL cell lines. Of six ABC-DLBCL cell lines, all were at least moderately positive for IL-10RA as determined by flow cytometry; in contrast, the majority (i.e. five of six) of GCB-DLBCL cell lines and one unclassified DLBCL cell line (RC-K8) were all negative (,b). IL-10RA expression at the transcript level largely confirmed the surface expression of IL-10RA (). Six of the seven IL-10RA-expressing cell lines were also positive for its ligand IL-10 as determined by ELISA and qRT-PCR (). We were able to link IL-10/IL-10RA expression to two types of mutational patterns, i.e. inactivating SOCS1 mutations on the one hand, and MYD88 mutations on the other; in some cell lines, the MYD88 mutations co-occurred with either CARD11, CD79A or CD79B mutations (), which results in chronic active B-cell receptor signaling. Indeed, blocking BCR signaling with the Bruton’s tyrosine kinase (BTK) inhibitor ibrutinib prevented IL-10 expression by cell lines with co-occurring MYD88/CD79B or MYD88/CD79A (HBL-1, OCI-Ly10), or a TNFAIP3 mutation (U2932) but not MYD88/CARD11 (OCI-Ly3) or single MYD88 (SU-DHL2) or SOCS1 (SU-DHL5) mutations (). We next used the combined transcriptomic and exome sequencing TCGA data of the 206 patients mentioned above to examine at a larger scale the expression of IL10RA and of IL10 in the context of mutational landscape and gene expression subtype. Interestingly, we found IL10 transcript levels to be highest in ABC-DLBCL cases assigned to the “MCD” genetic subtype of DLBCL (), which features co-occurrence of MYD88L265P and CD79B mutations, and an ABC-DLBCL gene expression signature.Citation4 The lowest IL10 expression was observed in the “EZB” subtype (), which is characterized by translocations juxtaposing BCL2 to the IGH enhancer in combination with frequent mutations in the chromatin modifier EZH2.Citation4 Intermediate IL10 expression was observed in the two remaining subtypes, “BN2” and “N1”. High IL10 expression was more tightly linked to “MCD” genetic subtype than to ABC-DLBCL gene expression subgroup, as non-“MCD” ABC-DLBCL cases did not stand out as particularly IL10-high (Supplementary Fig. S2a). The expression of IL10RA was also lowest in the “EZB” subtype, but comparable in the other three genetic subtypes (); an enrichment was clearly seen within the highest relative to the lowest quartile of IL10- and IL10R-expressing cases for the ABC-DLBCL gene expression subtype (, Supplementary Fig. S2b). In summary, the expression of both the cytokine and the unique chain of its receptor is highly variable in DLBCL, strongly biased toward the ABC subtype of the disease, and highest in cases with co-occurring MYD88 and CD79B mutations and -in the case of IL-10- can be effectively suppressed by BTK inhibition.
Figure 2. IL-10 expression is highest in ABC-DLBCL with co-occurring MYD88/BCR mutations and can be blocked by BTK inhibition. a-c, IL-10RA expression was assessed by flow cytometry (a,b) and at the transcript level by qRT–PCR (c), normalized to RPLP32, for a panel of 13 DLBCL cell lines. ABC- and GCB-DLBCL cell lines are color-coded in red and green; RC-K8 is depicted in gray, as it shares features with both subtypes; bold labeling indicates the IL-10RA-positive cell lines in a. b shows the means + SD of at least two and up to three independent measurements, except for HBL-1 and OCI-Ly10, which were analyzed only once. d,e, IL-10 production of the indicated cell lines (color code as in a-c) as quantified by ELISA and normalized to cell number (shown per 1,000 cells, d), and by qRT–PCR, normalized to RPLP32 (e). n.d., not detectable. The mutational status of the indicated genes is shown below the bar graphs in d; + indicates that the gene is mutated; ? indicates that the SOCS1 status of the SU-DHL8 cell line is a matter of debate. f, IL-10 production of the indicated cell lines, as assessed by ELISA after 48 hours of incubation with or without 0.01 µM ibrutinib. Pooled data from two to three sets of samples/experiments are shown in c-f. g, IL10 and IL10RA gene expression of 206 DLBCL cases, stratified based on genetic subtype as assigned by Schmitz et al.Citation4 h, Co-oncoplots showing the mutational landscape of IL10hi and IL10low (left panels), as well as IL10RAhi and IL10RAlow (right panels) DLBCL cases (highest and lowest quartile, respectively, representing ~50 cases each, cases sorted by decreasing expression of the gene of interest). Nine genes with most variants between the lowest and highest quartiles are shown; color codes indicate genetic and gene expression subtypes and type of mutation. Note that a missense mutation is a non-synonymous mutation that changes a codon, and a nonstop mutation is a type of missense mutation but occurs specifically within the stop codon. p-values (*p < .05, **p < .01, ***p < .005, determined by log-rank test) next to gene symbols indicate that that gene is significantly differentially affected by mutations in the lowest vs. highest quartile of IL10/IL10RA expression. See also Supplementary Fig. S2 for comprehensive oncoplots of all 206 patients
Endogenous IL-10 expression drives constitutive STAT3 phosphorylation
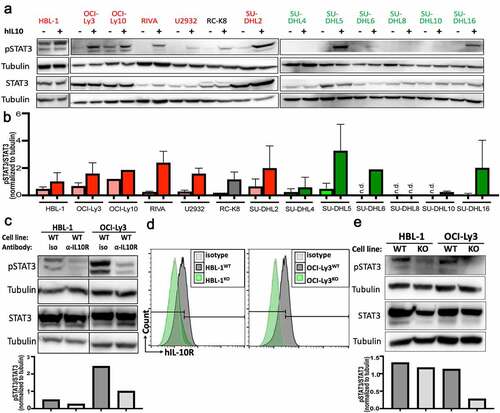
As we had observed a strong positive correlation between IL-10RA expression and STAT3 phosphorylation in our cohort of 122 patients (), we subjected our cell lines to pSTAT3 Western blotting. All IL-10-expressing, but none of the IL-10-negative cell lines were at least modestly positive for pSTAT3 (Tyr705) at steady state (,b; examples: HBL-1, OCI-Ly10, SU-DHL2); in these IL-10-expressing, as well as two cell lines with surface expression of IL-10RA but no endogenous IL-10 expression (RIVA, SU-DHL16), exogenously added recombinant IL-10 induced STAT3 phosphorylation (). Moreover, IL-10 was more efficient than IL-6 at inducing STAT3 phosphorylation (Supplementary Fig. S3a,b) in two cell lines, SU-DHL5 and OCI-Ly3, that express both cytokine receptors ( and shown previously).Citation10 Conversely, the neutralization of endogenously expressed IL-10 by a specific antibody reduced STAT3 phosphorylation (); IL-10R blockade was even more efficient than IL-6R blockade at reducing STAT3 phosphorylation (Supplementary Fig. S3c,d). The genetic ablation of IL10RA in two IL-10R-positive cell lines by genome editing also strongly reduced STAT3 phosphorylation (). The combined results suggest that STAT3 activation is linked to IL-10R expression in DLBCL cell lines, and that a subset of (mainly ABC-) DLBCLs produce IL-10 to maintain high levels of pSTAT3.
Figure 3. IL-10 induces STAT3 phosphorylation in IL-10RA-positive DLBCL cell lines. a,b, STAT3 phosphorylation as determined by Western blotting of the indicated ABC-DLBCL and GCB-DLBCL cell lines, with and without 2 hours of exposure to 30 ng/mL hIL-10. A representative Western blot is shown in a, and the densitometric quantification of pSTAT3/STAT3, normalized to tubulin, of one to three Western blots per cell line is shown as means + SD in b. c, STAT3 phosphorylation as assessed by Western blotting and quantified by densitometry, of two representative ABC-DLBCL cell lines, with or without 2 hours of exposure to 10 µg/mL IL-10RA-neutralizing antibody (clone 37607). d,e, Genetic deletion of IL10RA by CRISPR/Cas9 in the two indicated ABC-DLBCL cell lines results in loss of IL-10RA expression as determined by flow cytometry (d) and in reduced STAT3 phosphorylation as assessed by Western blotting (e) (WT, wild type; KO, IL-10RAKO). Data are representative of two clones per cell line, generated with two different single guide RNAs
IL-10 signaling is essential for lymphoma growth in vivo
Having generated DLBCL cell lines that lack IL-10R signaling due to IL10RA genetic ablation, we asked whether this manipulation impaired their growth and survival in vitro and in vivo. No growth defects were observed in two IL-10RAKO cell lines relative to their parental lines as judged by cell counts over time, cell viability and apoptosis (Supplementary Fig. S4a-c). The addition of recombinant IL-10 did not increase viability (Supplementary Fig. S4a,b). Although one of two commercially available IL-10-neutralizing antibodies reduced cell viability, this effect was observed with both IL-10RA-proficient and -deficient cells (Supplementary Fig. S4d), which makes the results difficult to interpret. The proliferation of IL-10RA-proficient and -deficient cells was comparable as judged by CFSE dilution and competitive proliferation assay (Supplementary Fig. S4e,f).
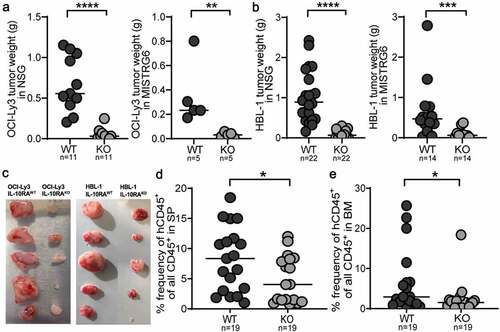
We next asked whether IL-10 signaling is essential for in vivo growth. To this end, we subcutaneously transplanted IL-10RA-proficient and -deficient OCI-Ly3 and HBL-1 cells onto the flanks of immunocompromised NSG and MISTRG6 mice; IL-10RA-proficient tumors were substantially heavier and larger than those formed by IL-10RA-deficient cells of both cell lines (). The same difference was observed in an orthotopic model of engraftment in the spleen and bone marrow of MISTRG6 mice (,e). Given the cell-intrinsic relevance of active IL-10/IL-10R/STAT3 signaling in vivo, we asked whether this pathway could be exploited for treatment purposes. An extensive drug screen failed to reveal differences between the genotypes (Supplementary Fig. S4g). Similarly, no major transcriptional differences between IL-10RA-proficient and -deficient HBL-1 and OCI-Ly3 cells were detected by RNA sequencing (Supplementary Fig. S4h); not unexpectedly, however, we found that numerous known STAT3 target genes -as identified by ChIP-seq and other methodsCitation29,Citation30- were downregulated in both cell lines upon IL-10RA loss (Supplementary Fig. S4i), lending further support to the notion that IL-10 signals via STAT3 in this setting. Interestingly, alternative STATs that have been described in the literature as downstream of IL-10 signaling, such as STAT1, STAT5 and STAT6,Citation31 were up- rather than downregulated in both IL-10RA-deficient cell lines (Supplementary Fig. S4i), arguing against a major role of these STATs in lymphoma engraftment and growth. These combined results suggest that the IL-10/IL-10R/STAT3 axis, while essential in vivo, is not relevant for in vitro growth of DLBCL cells, at least under the investigated conditions.
Figure 4. The IL-10 signaling axis is essential for lymphoma growth in vivo in xenotransplantation models. a-c, NSG and MISTRG6 mice were subcutaneously injected with 1 × 10⁷ IL-10RA-proficient and -deficient OCI-Ly3 (a) or HBL-1 cells (b) on each flank at 6–8 weeks of age; tumor weights were determined at the study end point (5–6 weeks for NSG and 3 weeks for MISTRG6 mice). Data are pooled from two to four independent studies per graph, except for OCI-Ly3 in MISTRG6, which was done only once. The image in c shows tumors from MISTRG6 mice. d,e, MISTRG6 mice were intravenously injected with 1 × 10⁷ IL-10RA-proficient or -deficient HBL-1 cells at 6 weeks of age; the lymphoma burden was quantified in the spleen (SP, d) and bone marrow (BM, e) by flow cytometric staining for hCD45 and by ZsGreen expression at the study endpoint (5 weeks post injection). Data in d and e are pooled from three independent experiments. Horizontal lines indicate medians. *p < .05, ***p < .005, ****p < .001, as determined by Mann-Whitney test
Antibody-mediated neutralization of IL-10 signaling reduces lymphoma growth in a serial transplantation model
Having shown in xenotransplantation models that IL-10 signaling cell-autonomously boosts tumor growth, we turned to a syngeneic serial transplantation model of Myc-driven lymphomagenesis that allowed us to determine both cell-intrinsic and -extrinsic effects of IL-10 signaling on tumor growth. To this end, splenic lymphoma cells from Myc-transgenic mice were transplanted into immunocompetent wild type recipients. IL-10R neutralization strongly reduced lymph node weights and the frequencies of CD19+ CD45int tumor B-cells in the lymph nodes (); tumor B-cells could be readily distinguished from normal B-cells by their intermediate CD45 expression and strongly positive Ki67 staining (, Supplementary Fig. S5a,b). IL-10R neutralization increased the lymph node frequencies of TCRα/β+ T-cells, equally affecting CD4+ and CD8+ T-cell populations (,d, Supplementary Fig. S5c). Among CD4+ and CD8+ T-cells, TNF-α-producing, activated cells were somewhat increased as a result of IL-10R neutralization (Supplementary Fig. S5d); in contrast, FoxP3+ regulatory T-cells (Tregs), which represent a major component of the lymphoma microenvironment, were reduced under IL-10R neutralization (, Supplementary Fig. S5c). Treg depletion by diphtheria toxin (DT) administration to Foxp3-iDTR-transgenic mice phenocopied the effects of IL-10R neutralization, and the latter failed to further improve tumor control in the absence of Tregs (, Supplementary Fig. S5e). The reduction in the tumor burden of Treg-depleted mice coincided with strongly increased intratumoral CD4+ and CD8+ T-cell frequencies (, Supplementary Fig. S5f). We also asked whether the adoptive transfer of 100.000 flow cytometrically sorted intratumoral Tregs into tumor-bearing recipients would further compromise lymphoma immunity and boost tumor growth; this was not the case (,g, Supplementary Fig. S5e,f). Tregs in the tumor microenvironment expressed the surface marker Neuropilin-1, attesting to their thymic origin (Supplementary Fig. S5g).
Figure 5. Neutralization of IL-10R signaling reduces the lymphoma burden in a syngeneic transplantation model and reduces the intratumoral frequencies of regulatory T-cells. a-e, C57BL/6 mice were intravenously injected with 1 Mio >90% pure lymphoma cells isolated from the spleens of Eµ-Myc-transgenic donors, and examined at the study endpoint (10–15 days post injection) with respect to their lymph node weights and the frequencies and surface marker expression of various lymph node leukocyte populations by flow cytometry. An initial dose of 500 µg anti-IL-10RA neutralizing or control IgG antibody was i.p. injected shortly before tumor cell inoculation, followed by twice weekly injections of 300 µg antibody. Control mice did not receive tumor cells. (a) Combined axillary and inguinal lymph node weights of anti-IL-10RA- or control IgG antibody-treated mice. (b) Tumor B-cell frequencies in axillary and inguinal lymph node preparations as determined by staining for CD19 and CD45, of the mice shown in A, alongside representative FACS plots of one mouse per group. The Ki67 signal of the tumor B-cells is shown as well. See suppl. Figure 5a for the complete gating strategy. (c,d) Frequencies of TCRβ+ T-cells, of CD4+ T-cells and of CD8+ T-cells among all leukocytes, as determined by flow cytometry. See suppl. Figure 5c for the gating strategy. (e) Frequencies of FoxP3+ Tregs among all CD4+ T-cells, as determined by intracellular staining for FoxP3; representative FACS plots of one mouse per group are shown alongside the summary plot for all mice. f,g, Frequencies of tumor B-cells and of CD4+ T-cells in axillary and inguinal lymph node preparations as determined by staining for CD19, CD4 and CD45, of anti-IL-10R- or control IgG antibody-treated WT and Foxp3-iDTR mice. Mice received twice weekly i.p. doses of 20 ng/g diphtheria toxin (DT) to deplete Tregs, starting from one day before tumor cell injection. Treg depletion efficiency was >90%. Four mice were each injected i.v. with 100ʹ000 Tregs that had been sorted from the tumors of Foxp3-iDTR mice based on their GFP expression, on day four post tumor cell transplantation. h, MHCII expression as determined by flow cytometry, of a subset of the mice shown in a-e. A representative histogram of the MHCII signal of two representative mice is shown alongside the summary plot of all mice. i-k, C57BL/6 mice were intravenously injected with 1 Mio >90% pure lymphoma cells and examined at the study endpoint (10–15 days post injection) with respect to their lymph node weights (i), tumor B-cell frequencies (j) and CD4+/CD8+ T-cell frequencies (k). An initial dose of 500 µg anti-IL-10RA neutralizing and/or MHCII-blocking or control IgG antibody was i.p. injected shortly before tumor cell inoculation, followed by twice weekly injections of 300 µg antibody. Control mice did not receive tumor cells. Data in a-e are pooled from four independent experiments; data in f,g are pooled from one to six experiments, Treg transfer was only performed once. Data in hare from three experiments and data in i-k are from two experiments; note that several mice were lost to follow-up by flow cytometry. Horizontal lines indicate medians. Statistical comparisons were performed either by one-way ANOVA (in the case of normal data distribution) or by non-parametric ANOVA (Kruskal–Wallis test, in the case of non-normal data distribution) with Tukey’s multiple comparisons correction. ns, not significant, *p < .05, **p < .01 ***p < .005, ****p < .001
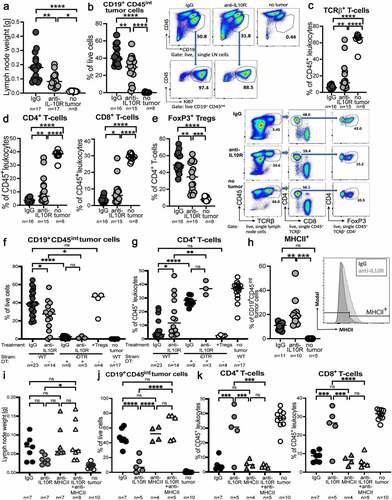
When staining tumor B-cells for the expression of various surface markers, we found that surface MHCII expression differed as a function of Treg presence (). As this piece of circumstantial evidence pointed to the restoration of MHCII expression as a possible mechanism underlying improved lymphoma control due to IL-10 neutralization, we combined IL-10R neutralization with MHCII blockade using a specific antibody. Indeed, MHCII blockade completely reversed the effects of IL-10R neutralization and restored lymph node and spleen weights, and the lymphoma burden back to isotype control levels (,j, Supplementary Fig. S5h). The increase in both the intratumoral CD4+ and CD8+ T-cell frequencies observed upon IL-10R neutralization was reduced upon simultaneous MHCII blockade (, Supplementary Fig. S5i). IL-10R neutralization was approximately as efficient as, but not synergistic with checkpoint inhibition using a PD-L1 blocking antibody (Supplementary Fig. S5j), indicating that IL-10R and PD-L1 blockade act in the same pathway to boost T-cell immunity to Myc-driven lymphomagenesis. The combined data suggest that tumor-derived IL-10 serves to recruit Tregs and to thereby suppress tumor immunity.
IL-10 acting cell-intrinsically on Tregs drives the accumulation and proliferation of Tregs in the lymphoma microenvironment
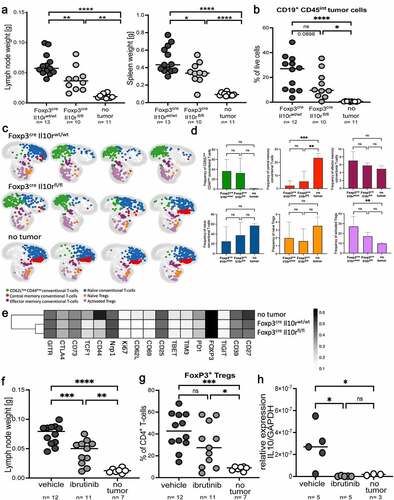
To examine whether the accumulation of Tregs in the lymphoma microenvironment and their suppressive activity on lymphoma control are Treg-intrinsically controlled by IL-10, we ablated the Il10r gene in the Treg compartment by creating Foxp3-Cre x Il10rfl/fl mice. Upon injection of Myc-expressing lymphoma cells, Foxp3-Cre x Il10rfl/fl mice controlled their tumors more efficiently than their Cre-negative littermates (,b). Improved tumor control coincided with higher frequencies of intratumoral cytokine-producing CD4+ and CD8+ T-cells and fewer Tregs (Supplementary Fig. S6a,b). To characterize the tumor-infiltrating Tregs of Foxp3-Cre x Il10rfl/f l mice and their WT littermates in more detail, we designed a 24-parameter panel for use in spectral flow cytometry (of which 17 markers are expressed on T-cells) and applied it to a group of mice that was representative of the overall phenotype of this strain (Supplementary Fig. S6c-e). Differential expression of canonical naïve/memory and Treg markers (FoxP3, CD4, CD44, CD62L) allowed us to separate Tregs (naïve and activated) from conventional T-cells (naïve, CD62LlowCD44low, effector memory and central memory), and to examine not only the abundance of each subset, but also the expression in each subset of various activation, exhaustion and stem-like markers (Supplementary Fig. S6f). The T-cell compartment of tumor-bearing lymph nodes differed from that of non-tumor bearing lymph nodes, with major shifts observed from naïve and central memory T-conventional cells and naïve Tregs (the dominant populations in control lymph nodes) toward CD62LlowCD44low conventional T-cells and activated Tregs (,d). The differences between Foxp3-Cre x Il10rfl/fl mice and their WT littermates were quantitative rather than qualitative (,e); the expression of the examined markers clearly segregated Tregs from tumor-bearing and control lymph nodes, but did not reveal dramatic differences resulting from Il10r ablation (). The combined data suggest that IL-10 drives the proliferation and accumulation of activated intratumoral Tregs, but does not affect their immunophenotype. As our cell culture experimentation had shown IL-10 production by lymphoma B-cells to be driven by BTK signaling, we treated lymphoma-bearing mice with twice-weekly oral doses of ibrutinib. This treatment impaired lymphoma growth as evidenced by reduced lymph node and spleen weights (); the tumors of mice under ibrutinib showed lower frequencies of intratumoral Tregs (). The IL-10 expression of lymphoma cells was completely blocked by ibrutinib (). Similarly, IL-10 expression was reduced by ibrutinib in a patient-derived orthotopic xenotransplantation model of lymphomaCitation10 using primary cells from a DLBCL patient (Supplementary Fig. S6g). The combined results suggest that ibrutinib acts at least in part by favorably affecting the composition of the lymphoma microenvironment by blocking IL-10 expression.
Figure 6. Genetic ablation of Treg-intrinsic IL-10 signaling reduces lymphoma growth. a-e, Foxp3-Cre x Il10rfl/fl mice and their Foxp3-Cre x Il10rwt/wt littermates were intravenously injected with 1 Mio >90% pure lymphoma cells isolated from the spleens of Eµ-Myc-transgenic donors, and examined at the study endpoint (10–15 days post injection) with respect to their lymph node and spleen weights (a) and tumor B-cell frequencies (b); control mice did not receive tumor cells. A subset of mice was subjected to multi-dimensional flow cytometry using a panel of 24 intracellular and surface markers that allowed the identification and quantification of the six indicated conventional and regulatory T-cell populations. A UMAP showing the FlowSOM-guided manual metaclustering of the six indicated CD4+ T-cell subsets is shown for four mice per group, and for all three experimental groups in c, along with the quantification of the six T-cell populations in d. The heatmap in E shows the median marker expression (value range: 0–1) of Tregs in each experimental group. Data in a and b are pooled from three studies; data in c-e are from one study. f-h, C57BL/6 mice were intravenously injected with 1 Mio lymphoma cells, and examined at the study endpoint (10–15 days post injection) with respect to their lymph node weights (f) and intratumoral Treg frequencies (g). Mice were treated orally with twice weekly doses of ibrutinib (25 mg/kg body weight) from day 4 post tumor cell injection onwards. IL-10 expression was analyzed by qRT-PCR of sorted tumor or normal B-cells, and normalized to GAPDH. Two pooled studies are shown in f and g; data in h are from one study. Statistical comparisons were performed either by one-way ANOVA (in the case of normal data distribution) or by non-parametric ANOVA (Kruskal–Wallis test, in the case of non-normal data distribution) with Tukey’s multiple comparisons correction. ns, not significant, *p < .05, **p < .01 ***p < .005, ****p < .001
IL-10RA expression correlates with Treg infiltration in DLBCL
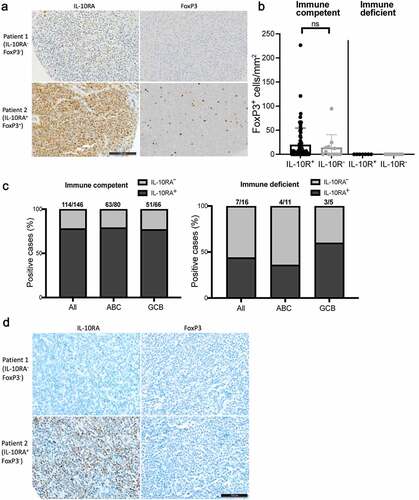
Having obtained experimental evidence for a functional role of IL-10 in Treg recruitment or retention in the lymphoma microenvironment, we asked whether IL-10RA expression – as a surrogate marker of IL-10 expression – would correlate with Treg infiltration in our cohort of DLBCL patients. Interestingly, of 82 patients on the TMA that were evaluable for their FoxP3 reactivity, cases that expressed IL-10RA had a somewhat higher density of FoxP3+ Tregs than the tumors that showed little or no IL-10RA expression (,b). FoxP3+ Tregs were positive for CD4 as assessed by co-immuno-fluorescence microscopy (Supplementary Fig. S7). We next asked whether the ability to express IL-10RA (and, by extension, also IL-10) and to recruit Tregs through IL-10 is a hallmark of DLBCL arising in immunocompetent relative to immunocompromised individuals. To this end, we stained a cohort of 16 cases of monomorphic post-transplant lymphoproliferative disorders (PTLD) with a phenotype of DLBCL that had all been diagnosed in solid organ transplant recipients on immunosuppressive treatmentCitation32 for IL-10RA and FoxP3. None of the 16 DLBCL from immunodeficient patients had any evidence of presence of FoxP3-positive Tregs (), and a smaller fraction of cases (7/16; 44%) expressed IL-10RA compared to immunocompetent patients (114/146; 78%) (,d). IL-10RA expression did not differ in ABC- and GCB-DLBCL of this cohort (), which was unexpected given the clear ABC-DLBCL bias observed in our cell lines (,b), in the TCGA data (,h), and in our other, independent cohort of 122 patients (in which the ABC-DLBCL subtype accounted for 74% of IL-10R-positive, but only 58% of IL-10R-negative cases). The combined data provide circumstantial evidence from human patient cohorts for the hypothesis that the expression of a functional IL-10/IL-10R axis serves to escape T-cell-driven immune control and may involve the recruitment and/or local maintenance of Tregs.
Figure 7. IL-10RA expression and Treg infiltration are more pronounced in DLBCL from immunocompetent relative to immunosuppressed patients. a,b, IL-10RA and FoxP3 expression, as determined by immunohistochemistry of 146 immunocompetent and 16 immunosuppressed DLBCL patients. Representative pairs of stainings are shown in a for two immunocompetent cases, of whom one was IL-10RA−FoxP3− and one was IL-10RA+FoxP3+ (scale bar, 100 µm). FoxP3+ cells/mmCitation2 are shown in b for all patients; each symbol represents one patient. c, Fraction (in %) of IL-10RA-positive among all cases in an immunocompetent (left panel) and an immunosuppressed (right panel) DLBCL patient cohort, as determined by immunohistochemistry. Positivity was further stratified by gene expression subtype (ABC, GCB) that was assigned based on the Hans classification. d, Representative pairs of stainings for IL-10RA and FoxP3, performed on two immunosuppressed cases, of whom one was IL-10RA−FoxP3− and one was IL-10RA+FoxP3− (scale bar, 100 µm)
Discussion
In this work, we demonstrate that (1) the expression of IL-10 and IL-10R is a hallmark of DLBCL and strongly correlated with STAT3 phosphorylation and with MYD88/BCR mutations in DLBCL cell lines and DLBCL patients, that (2) IL-10 signaling is cell-intrinsically required for DLBCL growth in ectopic and orthotopic xenotransplantation models and that (3) the tumor-cell-intrinsic expression of IL-10 serves the additional purpose of suppressing immunity through a mechanism likely involving the recruitment or local retention of regulatory T-cells. Having identified a subset of ABC-DLBCL cell lines with co-occurring MYD88/BCR mutations as expressing the largest quantities of IL-10 among all of our 13 cell lines, we queried the available TCGA data published by Schmitz et al. to extract common mutational signatures of IL-10-positive DLBCL cases. This analysis indeed confirmed that the top IL-10-expressing quartile of cases (and especially the top 15 cases) is strongly enriched for the MCD subtype exhibiting co-occurring MYD88/CD79B mutations. In cell lines with the MYD88/CD79B combination, we found the expression of IL-10 to be dependent on BCR/BTK signaling.
Constitutive STAT3 phosphorylation, which is one of the strongest negative prognostic factors in DLBCL,Citation10–12 is tightly linked to IL-10 expression. pSTAT3 is correlated with IL-10RA expression in DLBCL patients in our cohort, and STAT3 knock-down by RNAi was shown previously to reduce ABC-DLBCL proliferation.Citation33,Citation34 We show here in various xenotransplantation models that the genetic ablation of IL10RA efficiently prevents lymphoma engraftment and growth, at least of DLBCL cell lines. It is a clear limitation of this study that we faced technical difficulties in genetically manipulating primary DLBCL cells, and therefore could not confirm their IL-10 dependence in patient-derived xenograft settings. Furthermore, the genetic ablation of Stat3 in GC B-cells delays lymphomagenesis in a genetic lymphoma model that is driven by Myc, and prevents or reduces GC B-cell hyper-proliferation, a very early pre-malignant event in lymphomagenesis; both findings support a cell-intrinsic role for STAT3 in DLBCL pathogenesis.
In addition to the now well-established autocrine activity of IL-10, our data from syngeneic lymphoma transplantation models indicate that there is a second, tumor cell-extrinsic benefit associated with IL-10 production within the tumor microenvironment. IL-10R neutralization with a suitable antibody strongly reduced the lymphoma burden in lymph nodes, spleen and bone marrow, which coincided with stronger intratumoral CD4+ and CD8+ T-cell responses, a reduction of intratumoral Tregs and an increase in tumor-cell-specific MHCII expression. Tregs rely on IL-10 signaling for their maintenance of FoxP3 expression, survival and suppressive activity,Citation35.Citation36 Indeed, the specific ablation of IL-10 signaling in the Treg compartment phenocopied the effects of IL-10R neutralization, confirming that Tregs represent a relevant cellular target of tumor-derived IL-10. Staining of our DLBCL tissue microarray for Tregs confirmed that IL-10RA-positive DLBCL cases are infiltrated by FoxP3+ Tregs, whereas this is less the case in IL-10RA-negative DLBCLs. IL-10 emerges from this work as an attractive target in IL-10-expressing DLBCL subtypes; however, IL-10’s pleiotropic functions, and the recently presented clinical evidence suggesting that systemic administration of pegylated IL-10 may have beneficial effects on tumor immune control of solid tumors,Citation37 preclude clinical testing of IL-10 antibodies in DLBCL patients. Instead, we propose that ibrutinib should be considered in patients with IL-10-expressing DLBCL, and possibly combined with other targeted therapies.
We propose here that tumor cell-intrinsically produced IL-10 provides the signal that drives Treg differentiation and recruitment. Circumstantial evidence for this model comes from DLBCL arising in immunosuppressed patients, whose tumors are largely devoid of Tregs and less likely to express IL-10RA. Our previous work conducted on the same cohort of DLBCL patients has revealed that DLBCLs from immunosuppressed patients exhibit fewer driver mutations, and lack mutations in the immune escape pathways listed above, such as B2M mutations.Citation38 Interestingly, we found no mutations in either MYD88 nor CD79B or CARD11 in any of the 16 patients, further supporting the idea that high levels of IL-10 (due to constitutive BCR activation) are more relevant in immunocompetent than in immunodeficient hosts. In summary, we show here that the IL-10 production that is a hallmark of a particularly aggressive subset of DLBCL serves two purposes, boosting tumor cell proliferation via STAT3 activation on the one hand, and promoting immune escape via Treg recruitment on the other.
Author contributions
K.S. designed, performed and analyzed experiments and co-wrote the manuscript. K.B., C.B., N.G.N. and D.W. helped with experiments and provided critical tools and advice. T.Z. and B.B. provided access to the drug profiling and spectral flow cytometry platforms and advice. P.L. performed bioinformatic analyses. E.V. provided the BAEVTR plasmid. T.M. and A.T. stained and analyzed patient samples and A.M. supervised the study and co-wrote the manuscript.
Supplemental Material
Download ()Acknowledgments
We thank Mélanie Favre and Margot Thome for the kind gift of the HBL-1 and OCI-Ly10 cell lines.
Funding
This work was funded by the Clinical Research Priority Program “Precision Oncology” of the University of Zurich, and the Swiss National Science Foundation project grant 310030_192490 (to A.M.). Additional support was provided by the Forschungskredit of the University of Zurich (to K.B.) and the Comprehensive Cancer Center Zurich (grants to C.B. and P.L.).
Disclosure statement
No potential conflict of interest was reported by the author(s).
Supplementary material
Supplemental data for this article can be accessed on the publisher’s website
References
- Alizadeh AA, Eisen MB, Davis RE, Ma C, Lossos IS, Rosenwald A, Boldrick JC, Sabet H, Tran T, Yu X, et al. Distinct types of diffuse large B-cell lymphoma identified by gene expression profiling. Nature. 2000;403(6769):503–13. doi:10.1038/35000501.
- Chapuy B, Stewart C, Dunford AJ, Kim J, Kamburov A, Redd RA, Lawrence MS, Roemer MGM, Li AJ, Ziepert M, et al. Molecular subtypes of diffuse large B cell lymphoma are associated with distinct pathogenic mechanisms and outcomes. Nature Medicine. 2018;24(5):679–690. doi:10.1038/s41591-018-0016-8.
- Rosenwald A, Wright G, Chan WC, Connors JM, Campo E, Fisher RI, Gascoyne RD, Muller-Hermelink HK, Smeland EB, and Giltnane JM , et al. The use of molecular profiling to predict survival after chemotherapy for diffuse large-B-cell lymphoma. Lymphoma/Leukemia Molecular Profiling. The New England Journal of Medicine. 2002;346(25), 1937–1947. DOI: 10.1056/NEJMoa012914.
- Schmitz R, Wright GW, Huang DW, Johnson CA, Phelan JD, Wang JQ, Roulland S, Kasbekar M, Young RM, Shaffer AL, et al. Genetics and Pathogenesis of Diffuse Large B-Cell Lymphoma. The New England Journal of Medicine. 2018;378(15):1396–1407. doi:10.1056/NEJMoa1801445.
- Basso K, Dalla-Favera R. Germinal centres and B cell lymphomagenesis. Nature Reviews Immunology. 2015;15(3):172–184. doi:10.1038/nri3814.
- Pasqualucci L, Dalla-Favera R. SnapShot: diffuse large B cell lymphoma. Cancer Cell. 2014;25(132–132):e131. doi:10.1016/j.ccr.2013.12.012.
- Pasqualucci L, Dalla-Favera R. The genetic landscape of diffuse large B-cell lymphoma. Semin Hematol. 2015;52(2):67–76. doi:10.1053/j.seminhematol.2015.01.005.
- Coiffier B, Thieblemont C, Van Den Neste E, Lepeu G, Plantier I, Castaigne S, Lefort S, Marit G, Macro M, Sebban C, et al. Long-term outcome of patients in the LNH-98.5 trial, the first randomized study comparing rituximab-CHOP to standard CHOP chemotherapy in DLBCL patients: a study by the Groupe d’Etudes des Lymphomes de l’Adulte. Blood. 2010;116(12):2040–2045. doi:10.1182/blood-2010-03-276246.
- Crump M, Neelapu SS, Farooq U, Van Den Neste E, Kuruvilla J, Westin J, Link BK, Hay A, Cerhan JR, Zhu L, et al. Outcomes in refractory diffuse large B-cell lymphoma: results from the international SCHOLAR-1 study. Blood. 2017;130(16):1800–1808. doi:10.1182/blood-2017-03-769620.
- Hashwah H, Bertram K, Stirm K, Stelling A, Wu CT, Kasser S, Manz MG, Theocharides AP, Tzankov A, Muller A. The IL −6 signaling complex is a critical driver, negative prognostic factor, and therapeutic target in diffuse large B-cell lymphoma. EMBO Molecular Medicine. 2019;11(10):e10576. doi:10.15252/emmm.201910576.
- Meier C, Hoeller S, Bourgau C, Hirschmann P, Schwaller J, Went P, Pileri SA, Reiter A, Dirnhofer S, Tzankov A. Recurrent numerical aberrations of JAK2 and deregulation of the JAK2-STAT cascade in lymphomas. Modern Pathology: An Official Journal of the United States and Canadian Academy of Pathology, Inc. 2009;22(3):476–487. doi:10.1038/modpathol.2008.207.
- Ok CY, Chen J, Xu-Monette ZY, Tzankov A, Manyam GC, Li L, Visco C, Montes-Moreno S, Dybkaer K, Chiu A, et al. Clinical Implications of Phosphorylated STAT3 Expression in De Novo Diffuse Large B-cell Lymphoma. Clinical Cancer Research: An Official Journal of the American Association for Cancer Research. 2014;20(19):5113–5123. doi:10.1158/1078-0432.CCR-14-0683.
- Tzankov A, Leu N, Muenst S, Juskevicius D, Klingbiel D, Mamot C, Dirnhofer S. Multiparameter analysis of homogeneously R-CHOP-treated diffuse large B cell lymphomas identifies CD5 and FOXP1 as relevant prognostic biomarkers: report of the prospective SAKK 38/07 study. Journal of Hematology & Oncology. 2015;8(1):70. doi:10.1186/s13045-015-0168-7.
- Buchert M, Burns CJ, Ernst M. Targeting JAK kinase in solid tumors: emerging opportunities and challenges. Oncogene. 2016;35(8):939–951. doi:10.1038/onc.2015.150.
- Lu L, Zhu F, Zhang M, Li Y, Drennan AC, Kimpara S, Rumball I, Selzer C, Cameron H, and Kellicut A, et al. () Gene regulation and suppression of type I interferon signaling by STAT3 in diffuse large B cell lymphoma. Proceedings of the National Academy of Sciences of the United States of America. 2018;115: E498–E505
- Gupta M, Han JJ, Stenson M, Maurer M, Wellik L, Hu G, Ziesmer S, Dogan A, Witzig TE. Elevated serum IL-10 levels in diffuse large B-cell lymphoma: a mechanism of aberrant JAK2 activation. Blood. 2012;119(12):2844–2853. doi:10.1182/blood-2011-10-388538.
- Beguelin W, Sawh S, Chambwe N, Chan FC, Jiang Y, Choo JW, Scott DW, Chalmers A, Geng H, Tsikitas L, et al. IL10 receptor is a novel therapeutic target in DLBCLs. Leukemia. 2015;29(8):1684–1694. doi:10.1038/leu.2015.57.
- Ngo VN, Young RM, Schmitz R, Jhavar S, Xiao W, Lim KH, Kohlhammer H, Xu W, Yang Y, Zhao H, et al. Oncogenically active MYD88 mutations in human lymphoma. Nature. 2011;470(7332):115–119. doi:10.1038/nature09671.
- Phelan JD, Young RM, Webster DE, Roulland S, Wright GW, Kasbekar M, Shaffer AL 3rd, Ceribelli M, Wang JQ, Schmitz R, et al. A multiprotein supercomplex controlling oncogenic signalling in lymphoma. Nature. 2018;560(7718):387–391. doi:10.1038/s41586-018-0290-0.
- Hashwah H, Schmid CA, Kasser S, Bertram K, Stelling A, Manz MG, and Muller A. () Inactivation of CREBBP expands the germinal center B cell compartment, down-regulates MHCII expression and promotes DLBCL growth. Proceedings of the National Academy of Sciences of the United States of America. 2017;114: 9701–9706
- Stelling A, Hashwah H, Bertram K, Manz MG, Tzankov A, Muller A. The tumor suppressive TGF-beta/SMAD1/S1PR2 signaling axis is recurrently inactivated in diffuse large B-cell lymphoma. Blood. 2018;131(20):2235–2246. doi:10.1182/blood-2017-10-810630.
- Das R, Strowig T, Verma R, Koduru S, Hafemann A, Hopf S, Kocoglu MH, Borsotti C, Zhang L, Branagan A, et al. Microenvironment-dependent growth of preneoplastic and malignant plasma cells in humanized mice. Nature Medicine. 2016;22(11):1351–1357. doi:10.1038/nm.4202.
- Menter T, Ernst M, Drachneris J, Dirnhofer S, Barghorn A, Went P, Tzankov A. Phenotype profiling of primary testicular diffuse large B-cell lymphomas. Hematological Oncology. 2014;32(2):72–81. doi:10.1002/hon.2090.
- Harris AW, Pinkert CA, Crawford M, Langdon WY, Brinster RL, Adams JM. The E mu-myc transgenic mouse. A model for high-incidence spontaneous lymphoma and leukemia of early B cells. The Journal of Experimental Medicine. 1988;167(2):353–371. doi:10.1084/jem.167.2.353.
- Hans CP, Weisenburger DD, Greiner TC, Gascoyne RD, Delabie J, Ott G, Muller-Hermelink HK, Campo E, Braziel RM, Jaffe ES, et al. Confirmation of the molecular classification of diffuse large B-cell lymphoma by immunohistochemistry using a tissue microarray. Blood. 2004;103:275–282. doi:10.1182/blood-2003-05-1545.
- Obermann EC, Csato M, Dirnhofer S, Tzankov A. Aberrations of the MYC gene in unselected cases of diffuse large B-cell lymphoma are rare and unpredictable by morphological or immunohistochemical assessment. Journal of Clinical Pathology. 2009;62(8):754–756. doi:10.1136/jcp.2009.065227.
- Tzankov A, Heiss S, Ebner S, Sterlacci W, Schaefer G, Augustin F, Fiegl M, Dirnhofer S. Angiogenesis in nodal B cell lymphomas: a high throughput study. Journal of Clinical Pathology. 2007;60:476–482. doi:10.1136/jcp.2006.038661.
- Juskevicius D, Jucker D, Klingbiel D, Mamot C, Dirnhofer S, Tzankov A. Mutations of CREBBP and SOCS1 are independent prognostic factors in diffuse large B cell lymphoma: mutational analysis of the SAKK 38/07 prospective clinical trial cohort. Journal of Hematology & Oncology. 2017;10(1):70. doi:10.1186/s13045-017-0438-7.
- Carpenter RL, Lo HW. STAT3 Target Genes Relevant to Human Cancers. Cancers. 2014;6(2):897–925. doi:10.3390/cancers6020897.
- Snyder M, Huang XY, Zhang JJ. Identification of novel direct Stat3 target genes for control of growth and differentiation. The Journal of Biological Chemistry. 2008;283(7):3791–3798. doi:10.1074/jbc.M706976200.
- Ouyang W, O’Garra A. IL-10 Family Cytokines IL-10 and IL-22: from Basic Science to Clinical Translation. Immunity. 2019;50(4):871–891. doi:10.1016/j.immuni.2019.03.020.
- Menter T, Dickenmann M, Juskevicius D, Steiger J, Dirnhofer S, Tzankov A. Comprehensive phenotypic characterization of PTLD reveals potential reliance on EBV or NF-kappaB signalling instead of B-cell receptor signalling. Hematological Oncology. 2017a;35(2):187–197. doi:10.1002/hon.2280.
- Ding BB, Yu JJ, Yu RY, Mendez LM, Shaknovich R, Zhang Y, Cattoretti G, Ye BH. Constitutively activated STAT3 promotes cell proliferation and survival in the activated B-cell subtype of diffuse large B-cell lymphomas. Blood. 2008;111(3):1515–1523. doi:10.1182/blood-2007-04-087734.
- Rongvaux A, Willinger T, Martinek J, Strowig T, Gearty SV, Teichmann LL, Saito Y, Marches F, Halene S, Palucka AK, et al. Development and function of human innate immune cells in a humanized mouse model. Nature Biotechnology. 2014;32(4):364–372. doi:10.1038/nbt.2858.
- Chaudhry A, Samstein RM, Treuting P, Liang Y, Pils MC, Heinrich JM, Jack RS, Wunderlich FT, Bruning JC, Muller W, et al. Interleukin-10 signaling in regulatory T cells is required for suppression of Th17 cell-mediated inflammation. Immunity. 2011;34(4):566–578. doi:10.1016/j.immuni.2011.03.018.
- Murai M, Turovskaya O, Kim G, Madan R, Karp CL, Cheroutre H, Kronenberg M. Interleukin 10 acts on regulatory T cells to maintain expression of the transcription factor Foxp3 and suppressive function in mice with colitis. Nature Immunology. 2009;10(11):1178–1184. doi:10.1038/ni.1791.
- Naing A, Infante JR, Papadopoulos KP, Chan IH, Shen C, Ratti NP, Rojo B, Autio KA, Wong DJ, Patel MR, et al. PEGylated IL-10 (Pegilodecakin) Induces Systemic Immune Activation, CD8(+) T Cell Invigoration and Polyclonal T Cell Expansion in Cancer Patients. Cancer Cell. 2018;34(775–791):e773. doi:10.1016/j.ccell.2018.10.007.
- Menter T, Juskevicius D, Alikian M, Steiger J, Dirnhofer S, Tzankov A, and Naresh KN. Mutational landscape of B-cell post-transplant lymphoproliferative disorders. British Journal of Haematology. 2017;178:48–56.