
ABSTRACT
Numerous studies have found that chronic stress could promote tumor progression and this may be related to inhibtion of immune system. Myeloid-derived suppressor cells (MDSCs) are a heterogeneous population of cells with immunosuppressive activity. MDSCs may represent a key link between chronic stress and tumor progression. However, the role of stress-induced MDSCs in breast cancer progression is unclear. The present study showed that pre-exposure of chronic stress could lead to MDSCs elevation and facilitated breast cancer metastasis in tumor-bearing mice. Adoptive transfer of MDSCs could significantly increase lung metastatic foci. In contrast, lung metastasis could be alleviated by depleting endogenous MDSCs with Gr-1 antibody. The concentration of norepinephrine in serum and the expression of tyrosine hydroxylase in bone marrow could be significantly elevated by chronic stress. Moreover, propranolol, an inhibitor of β-adrenergic signaling, could inhibit breast carcinoma metastasis and prevent the expansion of chronic stress-induced MDSCs. Further study revealed that the expressions of IL-6 and JAK/STAT3 signaling pathways were upregulated by chronic stress in mice, and this upregulation could be inhibited by propranolol. Blocking the IL-6 signal or inhibiting the activation of the JAK/STAT3 signaling pathway could reduce tumor growth and metastasis by attenuating the accumulation of MDSCs in vivo. Besides, propranolol inhibited the expression of IL-6 in supernatant of 4T1 cells induced by isoproterenol and reduced the proportion of inducible MDSCs in vitro. Taken together, these data indicated that chronic stress may accumulate MDSCs via activation of β-adrenergic signaling and IL-6/STAT3 pathway, thereby promoting breast carcinoma metastasis.
KEYWORDS:
1. Introduction
Breast cancer is the most common malignancy in females and the leading cause of mortality among women population worldwide.Citation1 Accumulating evidence indicated that chronic stress could affect several physiological functions and lead to breast cancer progression and metastasis.Citation2–5 The sympathetic nervous system and hypothalamic–pituitary–adrenal axis activation release stress hormones (such as norepinephrine and corticosterone), which might positively affect the process of tumor development.Citation4 Additionally, β-adrenergic receptor activation was implicated as the key mediator, which modulates several growth factors, such as vascular endothelial growth factor, proinflammatory cytokines, and matrix metalloproteases.Citation6,Citation7 Furthermore, these proinflammatory cytokines (interleukin (IL)-6 and IL-1β) were associated with the induction of suppressor cell populations that may further inhibit immune responses.Citation8,Citation9
Myeloid-derived suppressor cells (MDSCs) are a diverse population of immature myeloid cells with potent immunosuppressive activity.Citation10,Citation11 These cells are generated in bone marrow (BM) from hematopoietic stem cells and represent <1% of circulating cells in normal individuals.Citation12 In mice, MDSCs are characterized by the co-expression of myeloid markers, Gr1, and CD11b, and further classified into monocytic (M-MDSC) and granulocytic (G-MDSC) subsets based on the expression of Ly6G and Ly6C, respectively.Citation13 In most patients and experimental animals with cancer, MDSCs may accumulate in blood, spleen, BM and at tumor sites, and the cell number was correlated to tumor burden.Citation14 Evidence suggests that immune suppressor cells could blunt the ability of the innate and adaptive immune system to eliminate the developing tumor.Citation15,Citation16 The depletion of MDSCs reduced tumor growth and enhanced the anti-tumor effects of immunotherapeutic regimens in mice.Citation17,Citation18
Interestingly, inflammation may drive the accumulation of MDSCs and increase their suppressive activity in tumor-bearing mice.Citation19,Citation20 Thus, MDSCs may represent a key link between chronic stress and tumor progression since many proinflammatory cytokines induced by chronic stress are associated with the generation and/or expansion of MDSCs.Citation21 However, the correlation between MDSCs and chronic stress was equivocal. Previous studies reported that chronic-restraint stress promoted hepatocellular tumor progression and redistribution of splenic myeloid cells through β-adrenergic signaling.Citation22 Studies using temperature modulation and β2-AR-deficient mice demonstrated that β2-AR activation during chronic cold-stress prolongs MDSC survival via phosphorylation of STAT3.Citation23 Further study confirmed that limiting adrenergic stress with β-blocker decreased MDSC accumulation and tumor growth.Citation24 Experiments with human peripheral blood mononuclear cells also demonstrated that β2-AR agonists stimulate the generation of MDSC.Citation24 However, another clinical study showed that breast cancer patients with high stress level showed a decrease in the number of myeloid-derived suppressor cells compared to patients with lower stress.Citation25 Recent preclinical studies demonstrated that experimental stressors by social isolation suppressed breast cancer growth and reduced MDSCs frequency in the spleen and lung in a spontaneous model of mammary adenocarcinoma.Citation26 Thus, the role of chronic stress-induced MDSCs in breast cancer progression still need to be elucidated.
In present study, the effect of chronic stress on metastatic colonization of breast cancer was checked in a mouse model of chronic unpredictable mild stress. Furthermore, we investigated the effects of MDSCs on tumor metastasis induced by chronic stress. In addition, we explored β-adrenergic signaling and IL-6/STAT3 pathways involved in chronic stress-induced MDSCs accumulation in mice bearing breast carcinoma.
2. Materials and Methods
2.1 Mice and cell lines
6–8 week old female BALB/c mice were purchased from SPF Biotechnology (Beijing, China). Mice were housed 5 animals per cage, the size of the cage was 290 × 178 × 160 mm, and the cage was cleaned twice a week. All mice were housed under a controlled temperature (25°C) in a 12 h light/dark cycle. The mice were housed under standard conditions for 7 days before the experiment. The animal care and experimental protocols were approved by the Institute Research Ethics Committee of Nankai University (Permit number: NKYY-DWLL-2020-102). All of the animal experiments were conducted according to the guidelines for laboratory animals in Nankai University.
EMT6 and 4T1 cells were purchased from the American Type Culture Collection (ATCC CRL-2755, CRL-2539) and cultured in RPMI-1640 culture medium supplemented with 10% fetal bovine serum (FBS) and 1% penicillin-streptomycin.
2.2 Chronic Unpredictable Stress (CUS)
After acclimation for one week, the mice were exposed to chronic unpredictable stressors for five consecutive days before injected with tumor cells. The CUS procedures was described previously.Citation5 Animals were administered the following stressors in random order: sleep deprivation for 12 h, cage shaking for two hours, damp bedding for six hours, isolation or crowding for six hours, and overnight illumination for 12 h (Table S1). After the mice were injected with 4T1 cells, the stimulation was repeated, but the intensity was changed to once every two days. The stimulus cycle lasted 21–28 days according to the needs of the experiment.
2.3 Construction of 4T1 breast cancer-bearing mice models
For the tumor growth model, after five days of pre-stimulation, 5 × 10⁵ 4T1 cells were orthotopically injected in a total volume of 100 µL into the region of the first right inguinal mammary gland. The tumor volume was measured using a caliper every two days until the lump could be touched by hand. Tumor-bearing mice were enrolled randomly into experimental groups when tumors reached 0.5 to 1.0 cm in diameter. The tumor volume was calculated using the formula V = (a × b2)/2, where “a” represents the length and “b” represents the width of the tumor. The number of metastatic nodules in the lungs was calculated, as described previously.Citation27 For the caudal vein metastasis model, mice were also pre-stimulated for five days and then were injected with 5 × 10⁵ 4T1 cells via the caudal vein. After 6–8 days, the animals were euthanized. The lungs were removed from the mice then were stained with Indian ink (Solarbio Biotechnology Co., Ltd., China) to observe lung metastasis.
2.4 In vivo treatment experiments
For drug treatments, mice were randomly assigned to the cohorts. After inoculating the tumor cells, mice were injected with Propranolol (10 mg/kg/day, Sigma, USA) intraperitonelly. Gr-1 antibody (0.5 mg/ml, Invitrogen, USA) was injected via the caudal vein. Each mice was injected with 100 μl twice. Isoproterenol (5 mg/kg/day, Sigma, USA) was dissolved in PBS and injected intraperitonelly. In vivo IL6 blocking trial, tocilizumab (A2012, Selleck, USA) at 20 mg/kg were intraperitoneally injected twice a week for 2 weeks; WPI066 (30 mg/kg, MCE, USA), an inhibitor of JAK2 and STAT3, was used to inhibit the STAT3 pathway in vivo. WP1066 was administered via o.g. in a vehicle of DMSO/polyethylene glycol (PEG) 300 (1:4 ratio) on a once every other day.
2.5 MDSCs isolation
MDSCs were isolated from mouse spleen at 28 days after 4T1 cell implantation orthotopically, as described previously.Citation28 Briefly, mouse splenocytes were fractionated by Percoll (tbd science, Hao Yang, Tianjin) density gradient centrifugation. GR1+ MDSCs were isolated using Myeloid Derived Suppressor Cell Isolation Kit (Miltenyi Biotec, Bergisch Gladbach, Germany) according to the manufacturer’s instructions. The purity of MDSCs was >95% according to the flow cytometry results.
2.6 MDSCs depletion and adoptive transfer
MDSCs depletion was carried out as described previously.Citation17 An equivalent of 200 μg/mouse of an anti-Gr1 antibody (RB6-8 C5, eBioscience) that recognizes and depletes the cells with both Ly6G1 and Ly6C1 antigens was injected intravenously into the mice on days 1 and 3 after 4T1 tumor cell injected. The same volume of anti-IgG antibodies was injected as control.
For adoptive transfer, splenic MDSCs (5 × 10⁶) from 4T1 and CUS + 4T1 tumor-bearing mice were injected through the tail vein into the recipient mice on days 3 and 6 after 4T1 inoculation. An equivalent volume of PBS was injected as control.
2.7 RNA extraction and real-time PCR analysis
The protocol for qPCR was described previously.Citation29 Briefly, total RNA was isolated using TRIzol reagent (Solarbio Biotechnology, China) from mouse lung tissues. An equivalent of 1 µg RNA was used to reverse transcribed into cDNA using Hifair II 1st Strand cDNA Synthesis SuperMix for qPCR (Yeasen Biotech, China). qPCR was carried out using Hieff qPCR Green Master Mix (Yeasen Biotech, China). The specific primer sequences were synthesized in Sangon Biotech (China). Primer sequences were listed in Supplementary Table 2. Ct values were measured during the exponential amplification phase. The relative expression level (defined as fold change) of the target gene was given by 2 ΔΔCt and normalized to the internal control.
2.8 Transwell migration assay
In order to verify whether MDSCs could attract 4T1 cells, the in vitro experiment were carried out with 0.8 μm transwell membrane inserts. MDSCs were isolated from mouse spleen. Then, 5 × 10⁴ MDSCs were plated in the lower chamber and 1 × 10⁵ 4T1 cells were placed in the upper chamber. After 24 h, the cells were fixed with paraformaldehyde and stained with 5% crystal violet. Finally, five different fields of vision were photographed with a confocal microscope and the images were analyzed with Image J software.
2.9 Flow cytometry
Single-cell suspension was obtained from the spleens, tumors, peripheral blood, BM and lungs, as described previously.Citation30 Specifically, spleens were ground and directly passed through a 70-μm nylon cell strainer. Red blood cells were lysed using ACK buffer (Biological Industries, USA). The bone marrow cells washed out from the tibia and passed through a 70 μm nylon cell strainer (Biosharp, China). Red blood cells were lysed using ACK buffer. For the isolation of mononuclear cells in the lung, we follow the instructions of the Organ Tissue Mononuclear Cell Separation kit (Haoyang Bio, Tianjin). First of all, we grind the lung into a single-cell suspension and filter it with a 70um filter. After centrifugation, erythrocyte lysate was used to lyse red blood cells. Then the cell suspension was placed on the upper layer of the lymphocyte separation solution for centrifugation. The cells in the middle layer were stained. Peripheral blood mononuclear cells (PBMC) were isolated from the fresh heparinized peripheral blood of BALB/c mice used Mouse Peripheral Blood Mononuclear Cell Separation Solution KIT (Haoyang Bio, Tianjin) following the kit instructions. The cell suspension was incubated with FITC-conjugated anti-mouse CD11b, PE-conjugated anti-mouse Gr-1 (Biolegend, USA). To detect the recruitment of T cells, B cells, and macrophages in the metastatic lung, single-cell suspension obtained from lung tissue was incubated with FITC-conjugated anti-mouse CD4, PE-conjugated anti-mouse CD8a, PE-conjugated anti-mouse CD19, PE-conjugated anti-mouse F4/80 (Biolegend, USA), cells were sorted by BD FACSCalibur and the data were analyzed by Flowjo 7.6.1 software.
2.10 Cytokine array and ELISA
For the cytokine array, serums from the 4T1 and CUS + 4T1 mice were measured by a Cytokine Array Kit (ARY006, R&D, USA). Briefly, the antibody array membranes were blocked in blocking reagent for one hour at room temperature. Then, the serums were cultured with antibody array membranes overnight at 4°C. After being washed three times, the membrane was incubated with Streptavidin-HRP for 30 minutes at room temperature. Finally, the signals were detected by the chemiluminescence method with the ECL solution system (SparkJade, China). The data were quantified using the Image J software. Blood samples from mice were collected and place at room temperature for 3 hours, then centrifuged for 15 min at 4000 × g after serum precipitation. The resultant serum was maintained at −80°C until testing. The levels of IL-6 (Thermo Scientific, USA) and NE (LP-MO3817, China) in serum and the level of IFN-γ (eBioScience, USA) in cell supernatant were measured by ELISA kits according to the manufacturer’s instructions. Each sample was analyzed in triplicate. The cytokines were calculted based on the standard curves.
2.11 Induction and differentiation of MDSCs in Vitro
BM cells were harvested from 6 to 8 week old female BALB/c mice. 4T1 cells were treated with 10 μM ISO in the presence or absence of 10 ng/mL propranolol, 3 μM WP1066 for 24 h and the supernatants were collected. The extracted BM cells were co-incubated with different supernatants for 48 h to induce MDSCs (iMDSCs). After incubation, the percentage of MDSCs was detected by flow cytometry.
2.12 Western blot analysis
Cells and tissue lysates were resolved using 8–12% SDS-PAGE, transferred to nitrocellulose membranes, and blocked with 5% nonfat milk-TBST buffer for 1 h at room temperature. The membranes were blocked with 5% BSA and incubated overnight at 4°C with anti-SOCS3, anti-STAT3, anti-p-STAT3, anti-ERK, anti-p-ERK antibodies from Cell Signaling Technology (USA), anti-S100A8, anti-S100A9 antibodies were from Invitrogen (USA) or anti-β-actin antibodies from Santa Cruz Biotechnology (USA). The membranes were then incubated with horseradish peroxidase-conjugated secondary antibody for 1 h at room temperature. The target bands were detected by the ECL solution system (SparkJade, China) and were analyzed using ImageJ.
2.13 Immunofluorescent tissue staining
Frozen lung tissue sections seeded on coverslips were permeabilized with 0.4% Triton X-100 for 15 min at room temperature, then were blocked with 5% goat serum for one hour at room temperature and incubated with Gr1 antibodies (Abcam, UK) and CD11b antibodies (R&D, USA) overnight at 4°C. Samples were then washed by PBS and incubated with appropriate Alexa Fluor 488- or Alexa Fluor 594-conjugated secondary antibodies (CST, USA) for one hour at room temperature. Nuclei were stained with DAPI (Solarbio Biotechnology, China) for 4 min at room temperature. Images were acquired with a FV1000 confocal microscope (Olympus, USA).
2.14 Histopathology and immunohistochemistry
Lung and heart tissues were fixed with 4% paraformaldehyde, embedded in paraffin, and then sliced into sections 5μm thick. Lung tissue sections were stained with hematoxylin and eosin (HE) according to standard protocols. For immunohistochemical staining, the tissue sections were baked at 65°C for 2 h, deparaffinized and rehydrated, performed to antigen retrieval in 0.01 M citrate buffer (Solarbio biotechnology Beijing, China). Then, tumor tissues were blocked with 5% goat serum for 1 h and then incubated with IL-6 antibody (1:200, santa, USA) at 4°C overnight. After washing, HRP-secondary antibody was added at room temperature for 1 h. At last, antibody slides were counterstained with hematoxylin. The image was captured through microscope (Nikon, Shinagawa, Tokyo, Japan).
2.15 Statistical analysis
All data are shown as the mean ± SEM. Statistical analysis was performed using SPSS 20.0 and GraphPad Prism version 5.0a. Normal distribution of data was checked by means of the Shapiro–Wilk test, and a Levene statistic test was performed to check the homogeneity of variances. Mann-Whitney test or unpaired t-test was used to analyze the differences between two groups. One-way analysis of variation (ANOVA) followed by multiple comparisons performed with LSD test was used to analyze the differences among three or more groups. Correlations between different parameters were analyzed using Spearman’s rank test. P < .05 was considered statistically significant.
3. Results
3.1 Chronic unpredictable stress facilitated tumor metastasis
To investigate the role of chronic unpredictable stress on tumor progression, mice were subjected to CUS (Chronic unpredictable stress) for five consecutive days and then were orthotopically inoculated with 4T1 or EMT6 cells in the flanks to establish a tumor growth model. According to our reprevious study,Citation27 lung metastasis was evaluated 28 days after tumor cell implantation (, upper). As shown in , moderately fast tumor growth was observed in CUS + 4T1 group than in 4T1 group at day 15 and 17 (P < .05, ). Lung ink staining and quantitation revealed that the mice exposed to CUS developed more severe lung metastasis than the non-stressed 4T1 mice (P < .01, ). Meanwhile, histological evaluation confirmed that the pulmonary metastatic nodules in CUS + 4T1 group were more extensive than those in 4T1 group (P < .001, ). Consistent results were obtained in the EMT6 model (Supplementary ).
Figure 1. Chronic unpredictable stress promoted the metastasis of breast cancer cells. (a) Schematic representation of CUS exposure and tumor cell inoculation. BALB/c mice were exposed to CUS for 5 days and then were orthotopically injected with 4T1 cells on day 6. For the tumor growth model (upper), mice were further stressed from days 7–35 every other day after tumor injection and sacrificed on day 35. For the tumor metastasis model (down), mice were further stressed from days 7–14 every other day after tumor intravenous injection and sacrificed on day 14. (b) Tumor growth curve. n = 8 mice/group. *P < .05, Mann-Whitney test. (c) Representative images of ink-stained lungs. (d) The number of lung nodules per mouse. 4T1 group, n = 13. CUS + 4T1 group, n = 14. **P < .01, unpaired t-test. (e) Representative images of lung H&E staining, arrows indicated metastases. (f) Lung nodule area per mouse using NIH Image J (n = 22 sections/group, two sections per mouse lung tissue, ***P < .001, Mann-Whitney test). (g-j) 5 × 10⁵ 4T1 cells were injected intravenously into non-stressed (n = 10) or stressed (n = 12) mice; lung metastasis was evaluated 8 days post-injection. (g) Representative images of ink staining lungs. (h) The number of lung nodules per mouse. ***P < .001, unpaired t-test. (i) Representative images of lung H&E staining, arrows indicate metastases. (j) Lung nodule area per mouse using NIH Image J (n = 20 sections/group, two sections per mouse lung tissue, ***P < .001, Mann-Whitney test)
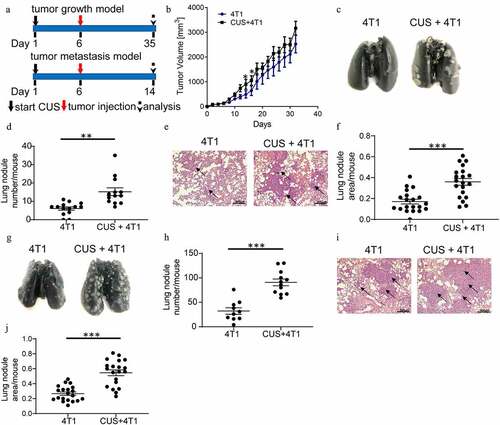
To investigate whether chronic stress affects pre-metastatic organs, an experimental metastasis model was established by tumor cell tail vein injection, which primarily resulted in pulmonary metastasis. Mice were exposed to CUS for five consecutive days before intravenous injection of 4T1 cells, as outlined schematically in (bottom). Lung metastasis was evaluated eight days after tumor cell implantation. Similar to the above results, the number of lung nodules was significantly increased in stressed mice compared to non-stressed mice (P < .001, ). The histological evaluation confirmed that the micrometastatic involvement of the lungs was more extensive in CUS + 4T1 group than in 4T1 group (P < .001, ). These observations indicated that chronic unpredictable mild stress may promote tumor metastasis.
3.2 Chronic unpredictable stress caused MDSCs elevation in tumor-bearing mice
To investigate the contribution of dysregulated immune responses in tumor metastasis in CUS mice, MDSCs levels were evaluated in the animals. According to previous study,Citation17 CD11b+Gr1high and CD11b+Gr1int populations corresponded to the G-MDSC (Cllb+Ly6G+Ly6Clo) and M-MDSC (CDllb + Ly6G–Ly6Chi) subsets, respectively. As expected, flow cytometric analysis demonstrated that 4T1 cell inoculation expanded MDSCs in spleen (SP), BM, peripheral blood (PB) and lung (LU) compared to non-stressed tumor-free (). Furthermore, the proportion of G-MDSCs and M-MDSCs increased significantly in multiple immune organs and lungs in CUS + 4T1 group compared to non-stressed 4T1 group (). The further elevation of G-MDSCs and M-MDSCs was also observed in CUS-treated tumor-metastasis models (). In addition, the enhanced infiltration of MDSCs in the metastatic lungs from CUS mice was further confirmed by immunofluorescence staining in both tumor growth and tumor metastasis models (). Notably, in the absence of tumor inoculation, the percentage of MDSCs in CUS-treated mice was not increased obviously compared to control group (Supplementary ).
Figure 2. CUS caused MDSCs elevation in 4T1 tumor-bearing mice. Tumor-growth model or tumor metastasis model was established in BALB/c mice as shown in . The percentages of MDSCs were analyzed by flow cytometry in tumor-growth model (a) and in tumor metastasis model (b), analyzed by flow cytometry. PB, peripheral blood. SP, spleen. BM, bone marrow. LU, lung. Representative results (left) and mean ± SEM from 4–6 mice (right) were shown. (c) Representative immunofluorescence staining of MDSCs infiltration in lung metastatic site in tumor growth model and tumor metastasis model (right, 800 × magnification) and quantitative analysis of MDSCs (left). *P < .05, **P < .01, 4T1 vs. con, #P < .05, ##P < .01, CUS + 4T1 vs. 4T1, Mann-Whitney test
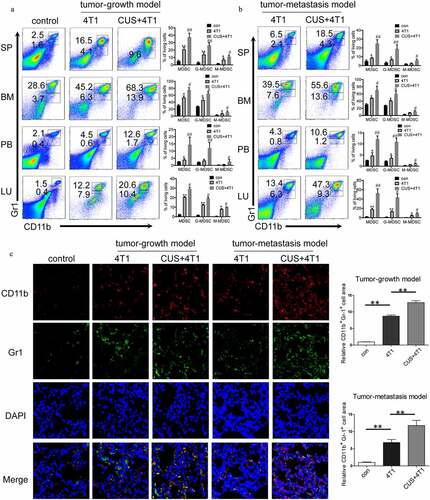
Moreover, the percentage of other immune cells in the lungs was detected by flow cytometry. It was noticeably that with the increase in MDSCs, the proportion of other immune cells, including T cells, B cells and macrophages, decreased in tumor mice compared to control mice. In addition, the percentage of CD4+, CD8+ T cells, and macrophages were further reduced in CUS + 4T1 group when compared to 4T1 group (Supplementary ). However, no changes were observed in the levels of regulatory T cells between 4T1 and CUS + 4T1 group (Supplementary ). Taken together, these observations suggested that chronic unpredictable stress could further promote the generation of MDSCs in tumor-bearing mice.
Figure 3. MDSCs mediated CUS-induced tumor metastasis. Splenic MDSCs from 4T1 and CUS + 4T1 tumor-bearing mice were intravenously injected into recipient mice (n = 7) at 3 and 6 days after 4T1 inoculation. PBS was used as a control. Mice were sacrificed 10 days later. (a) Representative images of lung tissue. (b) The number of lung nodules per mouse. **P < .01, unpaired t-test. (c) Lung nodule area per mouse using NIH Image J (n = 12 sections/group, three sections in lung tissue per mouse, ***P < .001, Mann-Whitney test). (d) Representative images of H&E staining, arrows indicate metastases. (e-h) Mice (n = 4) were intravenously injected with anti-Gr-1 mAb (0.2 mg/mouse or anti-IgG control at 1 and 3 days after 4T1 tumor cell intravenously injected. Lung metastasis was evaluated at 10 days after tumor injection. (e) Representative images of lung tissue. (f) The number of lung nodules per mouse. *P < .05, unpaired t-test. (g) Lung nodule area per mouse using NIH Image J. (n = 8 sections/group, two sections per mouse lung tissue, *P < .05, **P < .01, Mann-Whitney test). (h) Representative images of lung H&E staining, arrows indicate metastasis
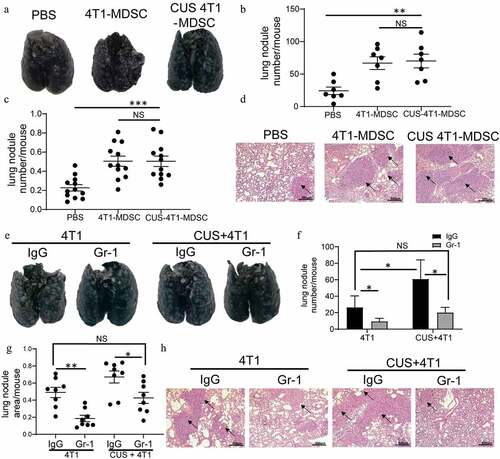
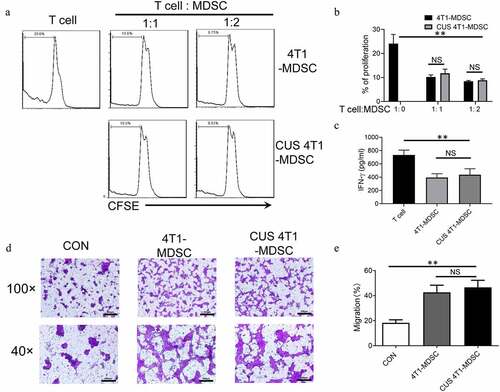
Figure 4. The function of CUS-induced MDSCs. Purified MDSCs isolated from 4T1 mice (4T1-MDSC) or CUS + 4T1 mice (CUS-MDSC) were cocultured with carboxyfluorescein succinimidyl ester-labeled splenic cells at a ratio of 2:1 or 1:1 in the presence of anti-CD3/anti-28 Dynabeads for 72 h. The proliferation of CD3+ T cells was analyzed by flow cytometry. (a) Representative data from a single experiment, (b) Mean ± SEM from three independent experiments. (c) IFN-γ in the supernatants was detected by ELISA. Data represent mean ± SEM from three independent experiments. **P < .01, Mann-Whitney test. NS, no significant difference. (d-e) 4T1-MDSCs or CUS+4T1-MDSCs were grown in the lower compartment of transwell chambers. 4T1 cells were seeded in the upper compartment of the same chambers. The cells were incubated at 37°C for 48 h, and then, 4T1 cells that migrated to the lower surface were determined by crystal violet staining. (d). Representative images from a single experiment (e). Mean ± SEM from three independent experiments. **P < .01, Mann-Whitney test. NS, no significant difference
3.3 Effect of CUS on tumor metastasis was mediated by MDSCs
Adoptive transfer experiments were performed to determine the possibility of a causal correlation between elevated MDSC levels and enhanced tumor metastasis. Briefly, splenic MDSCs from the tumor-growth model were isolated in 4T1 and CUS + 4T1 tumor-bearing mice on day 28, and the purity was >95% as determined by FACS (Supplementary ). The isolated MDSCs were injected into BALB/c recipients on days 3 and 6 after 4T1 cell inoculation by tail vein injection. The control mice were injected with 4T1 cells via tail vein, followed by PBS injection as control (Supplementary ). A significant increase of metastatic foci was observed in the MDSCs-transferred tumor-bearing mice compared with the PBS-treated tumor-bearing mice (P < .01, ). However, no differences in metastasis rates were detected between the mice that received 4T1-MDSCs or CUS −4T1-MDSC.
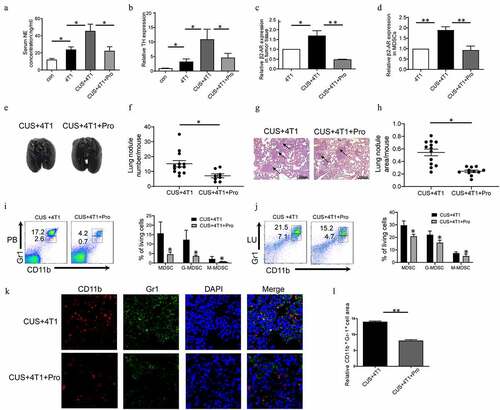
Figure 5. The effect of CUS on activating β1-AR/β2-AR. Mice were given propranolol (10 mg/kg) 1 h prior to each CUS treatment in the tumor growth model. (a) The levels of NE in the serum were determined by ELISA. n = 6–8/group. *P < .05, unpaired t-test. (b-d) The mRNA level of TH in BM, β2-AR in tumor tissues and β2-AR in MDSCs were determined by qRT-PCR. n = 6–8/group. *P < .05, **P < .01, unpaired t-test. (e) Representative images of lung tissue. (f) The number of lung nodules per mouse. CUS + 4T1 group, n = 12, CUS + 4T1 + Pro group, n = 8. *P < .05, unpaired t-test. (g) Representative images of lungs HE staining, arrows indicate metastases. (h) Lung nodule area per mouse using NIH Image J. (n = 12–16 sections/group, 3 sections per mouse lung tissue, **P < .01, Mann-Whitney test). (i,j) The percentages of MDSCs were analyzed by flow cytometry. PB, peripheral blood; LU, lung. (k) Representative immunofluorescent staining of MDSC infiltration in the lung metastatic site. (l) Quantitative analysis of MDSCs in Figure K by Image pro plus. ** P < .01, unpaired t-test
To further determine the role of MDSCs in tumor metastasis, the anti-Gr-1 antibody was used to deplete endogenous Gr-1+ MDSCs. Consequently, the mAb treated mice exhibited decreased Gr-1+ MDSCs in both PB and SP (Supplementary ). As shown in , significantly more metastases were observed in CUS-treated tumor-bearing mice than in 4T1 group (P < .05, P < .01). The depletion of MDSCs by anti-Gr-1+ antibody alleviated lung metastasis in CUS + 4T1 group, reaching levels comparable to those in 4T1 group. It is noticeable that depleting MDSCs also reduced tumor metastasis in non-stress conditions. Furthermore, Pearson’s correlation analysis revealed a positive correlation between the tumor metastasis and the percentage of MDSCs in spleen (Supplemented ). These results suggested that the elevation of tumor metastasis was mediated by CUS-induced MDSCs expansion.
3.4 Suppressive activity of MDSCs was not affected by CUS
The immunosuppressive function is the most essential characteristic of MDSCs. Next, we evaluated the function of CUS-induced MDSCs. Briefly, splenic MDSCs from 4T1 mice (4T1-MDSC) and CUS + 4T1 mice (CUS-MDSC) were isolated independently using GR1 microbeads, followed by coculture with carboxyfluorescein succinimidyl ester-labeled autologous T cells at a ratio of 2:1 or 1:1 in the presence of anti-CD3/anti-CD28 antibodies. The T-cell proliferation was evaluated by flow cytometry, and the IFN-γ concentration was detected by ELISA. This phenomenon showed that both 4T1-MDSCs and CUS-4T1-MDSCs strongly inhibited the proliferation of autologous CD3+ T cells (P < .01, ) and their production of IFN-γ (P < .01, ). Also, no differences were detected between the two groups. These results indicated that the function of MDSCs was not affected by CUS.
In addition to their immunosuppressive activity, previous studies reported that tumor-derived MDSCs directly promote tumor cell invasion and metastasis.Citation31 Next, we investigated whether CUS could affect the ability of MDSCs to promote tumor cell invasion. Splenic MDSCs were cocultured with 4T1 tumor cells, and tumor cell invasion was examined in transwell plates. Consequently, we observed that MDSCs from 4T1 and CUS + 4T1 mice displayed significantly higher capability in enhancing tumor cell invasion than those from control mice (P < .01, , e). However, no differences were observed between the two groups. These data indicated that MDSCs from tumor-bearing mice might directly promote tumor metastasis, and CUS treatment did not improve the effect of MDSCs on metastasis further.
3.5 CUS induced distant metastasis and MDSC expansion by activating β1-AR/β2-AR
In order to elucidate the mechanism underlying MDSCs expansion in tumor-bearing mice, β1-AR/β2-AR blocker propranolol (Pro) and β3-AR inhibitor SR59230A (SR) were used to test whether β-ARs activation was involved in CUS-exacerbated inflammatory response. To assess the activation of the sympathetic nervous system, the level of norepinephrine (NE) in serum was measured by ELISA, and the expression of tyrosine hydroxylase (TH) in BM was determined by RT-PCR. As shown in , the concentrations of NE and mRNA levels of TH were significantly elevated in the 4T1 group compared to control group and further promoted by CUS treatment. In addition, the upregulation of NE and TH in 4T1 + CUS mice was reversed by propranolol. At the same time, the expression of β2-AR in tumor tissues and MDSCs isolated from spleen of mice in 4T1, 4T1 + CUS and 4T1 + CUS + Pro groups were analyzed. The results showed that the expression of β2-AR in tumor tissue and splenic MDSCs of CUS + 4T1 mice was significantly higher than that of 4T1 group. Propranolol significantly reduced the expression level of β2-AR in tumor tissue and splenic MDSCs in CUS treated group to comparable levels with those in 4T1 treated group (P < .05, P < .01, ). Additionally, the severity of lung metastasis enhanced by CUS was significantly ameliorated in CUS + 4T1 + Pro group (P < .05, ). In addition, the number of CUS-generated MDSCs elevated in peripheral blood and lung was reversed by propranolol treatment (P < .05, ). Correspondingly, the number of infiltrated MDSCs in lung tissues was also significantly reduced by propranolol compared to CUS + 4T1 group, as assessed by confocal microscopy (). On the other hand, the inhibition of β3-AR did not affect CUS-induced tumor metastasis (Supplementary , d-e). Simultaneously, the expression of IL-6 in the serum and the number of MDSCs in peripheral blood and lung in CUS + 4T1 mice was not inhibited by SR59230A (Supplementary , g). These data supported that CUS may promote tumor metastasis and accumulate MDSCs by activating β1-AR/β2-AR signaling.
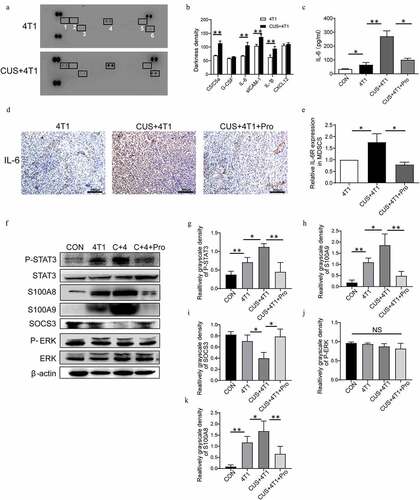
Figure 6. STAT3 signaling pathway in NE/IL-6-induced MDSC development. (a) The expression profiles of various cytokines in serum of 4T1 and CUS + 4T1 tumor-bearing mice were assessed by cytokine array (1: C5/C5a; 2: G-CSF; 3: IL-6; 4: sCIAM-1; 5: IL-1β; 6: CXCL12); (b): quantification of the staining density. (c) The level of IL-6 in serum was detected by ELISA. (d) Representative IHC images for IL-6 expression in tumor tissues. (e) The mRNA level of IL-6 R in MDSCs was determined by qRT-PCR. n = 6/group. *P < .05, unpaired t-test. (f) The expression of STAT3, phosphorylated STAT3, ERK, phosphorylated ERK, S100A8, S100A9, and SOCS3 in spleen tissues was detected by Western blots. (g-k) Quantification of phosphorylated STAT3, phosphorylated ERK, S100A8, S100A9, and SOCS3 in spleen tissues. Data are reported as mean ± SEM., *P < .05, **P < .01, Mann-Whitney test
3.6 CUS induced distant metastasis and MDSCs expansion via IL-6/STAT3 pathway
To determine the cytokines that could induce MDSCs expansion, a mouse cytokine array was examined in the serum isolated from 4T1 and 4T1 + CUS groups. The results showed that the levels of cytokines, such as C5/C5a, IL-6, IL-1β, and sICAM-1, were increased significantly (P < .01, ). Emerging data suggested that IL-6 was critical for the induction of MDSCs, and therefore, influenced tumor progression.Citation32 Thus, IL-6 in serum was further measured in stressed and control mice. As shown in , the concentrations of IL-6 in serum were significantly elevated in the 4T1 group, whereas CUS further promoted the expression of IL-6. In addition, the upregulation of IL-6 in 4T1 + CUS mice was reversed by propranolol. Meanwhile, the expression of IL-6 in tumor tissue of CUS + 4T1 group was significantly higher than that of 4T1 group. Propranolol also decreased the expression of IL-6 in tumor tissues of CUS + 4T1 group (). Furthermore, RT-PCR results showed that the expression of IL-6 R in splenic MDSCs of CUS + 4T1 mice was significantly higher than that of 4T1 group. Propranolol significantly reduced the expression of IL-6 R in splenic MDSCs in CUS treated group to comparable levels with those in 4T1 treated group (). Next, the expression and phosphorylation of multiple functional proteins induced by IL-6, including JAK/STAT and MAPK signaling pathways, were evaluated by Western blot ( F). The results showed that the phosphorylation level of STAT3 was increased in the spleen of 4T1 mice compared to control mice, whereas the STAT3 phosphorylation was more intensive in CUS + 4T1 group (P < .05, P < .01, ). In addition, the expression of S100 calcium-binding proteins, A8 (S100A8) and S100A9, has a crucial role in regulating MDSCs expansion; this was also upregulated in 4T1 mice and was further enhanced in CUS + 4T1 group (P < .05, P < .01,, k). SOCS3, a negative regulatory protein, was significantly decreased in CUS + 4T1 group compared to 4T1 mice. All the changes induced by CUS were reversed by propranolol treatment (P < .05, ). However, phosphorylated extracellular regulated protein kinases (p-ERK) did not change significantly in CUS + 4T1 group compared to 4T1 group (). The above data showed that JAK/STAT, rather than MAPK signaling pathway, participates in IL-6-related MDSCs accumulation.
To further identify the effect of NE and IL-6 on MDSCs expansion, 4T1 cells were treated with β-AR agonist isoproterenol (ISO), and the supernatants were used to induce MDSCs (iMDSCs) in vitro. Moreover, IL-6 in the supernatants was detected by ELISA. The concentrations of IL-6 were increased significantly after ISO treatment compared to control group (P < .01, ). Also, this upregulation of IL-6 was reversed by propranolol, indicating that ISO could stimulate IL-6 expression in 4T1 cells via β1-AR/β2-AR signaling. The in vitro results showed that tumor supernatant could promote MDSCs differentiation since the percentage of MDSCs incubated with 4T1 supernatant increased significantly compared to control group. Also, the percentage of MDSCs incubated with 4T1-ISO supernatant increased significantly compared to 4T1 group (P < .01, , c). The rise in the number of MDSCs induced by ISO was blocked by propranolol, which was in agreement with the in vivo results. Pearson’s correlation analysis revealed a positive correlation between the expression of IL-6 and the percentage of MDSCs in vitro (). Furthermore, in 4T1 supernatant-stimulated BM cells, the levels of phosphorylated STAT3 proteins increased at 15 min, decreased at 30 min, and disappeared at two hours. The sustained phosphorylation of STAT3 proteins were observed in 4T1 + ISO group, which was maintained for a longer time than in 4T1 supernatant-stimulated BM cells (2 h vs. 0.5 h). In propranolol incubation supernatant, the phosphorylation levels of STAT3 reduced at one hour (). The quantification of phosphorylated STAT3 is shown in . This study found an aberrantly activated JAK/STAT signaling pathway during the IL-6-initiated development of MDSCs, which demonstrated by a significant upregulation of the phosphorylated STAT3 proteins. After inhibiting the phosphorylation of STAT3 via the specific antagonist WP1066, a considerable decrease in the proportion of CD11b+Gr-1+ MDSCs in vitro was confirmed (Supplementary ).
Figure 7. IL-6/STAT3 mediated the effects of NE on MDSC development. (a) 4T1 cells were treated with 10 μM ISO in the presence or absence of 10 ng/mL propranolol. The expression of IL-6 in the supernatants was analyzed by ELISA. (b, c) BM cells isolated from tumor-free BALB/c mice were cocultured with tumor cell supernatant to induce iMDSCs in vitro. The percentage of MDSCs was detected by flow cytometry. (b) Representative images from a single experiment. (c) Mean ± SEMs from three independent experiments. (d) The correlation analysis between the concentration of IL-6 and the proportion of MDSCs (R2 = 0.8207, P < .001). (e) BM cells isolated from tumor-free BALB/c mice were cocultured with different tumor cell supernatant. The expressions of STAT3 and phosphorylated STAT3 were detected at different time points by Western blots. (f) Quantification of phosphorylated STAT3 at different time points. The levels of phosphorylated STAT3 (p-STAT3) was compared using the density ratio of phosphorylated protein to total protein (p-STAT3/STAT3). Data were reported as mean ± SEM., *P < .05, **P < .01, Mann-Whitney test
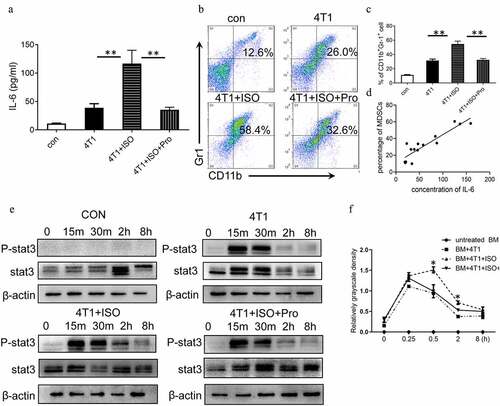
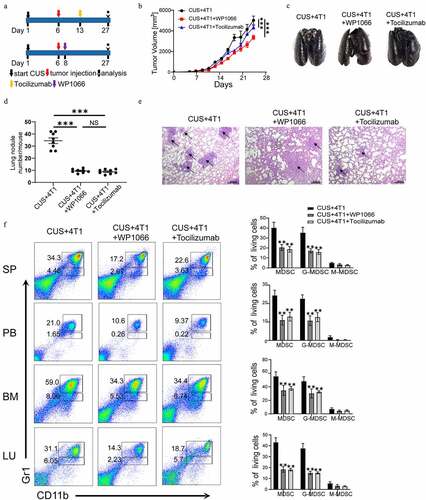
Figure 8. Targeting IL-6/STAT3 pathway suppresses MDSCs and inhibits lung metastasis in CUS-treated mice. (a) Model diagram of targeting IL6 with tocilizumab (anti-IL-6 R) and targeting STAT3 with WP1066 in CUS-treated mice. (b) Tumor growth curve. n = 6 mice/group. (c) Representative images of ink-stained lungs. (d) The number of lung nodules per mouse. CUS + 4T1 group, n = 6. CUS + 4T1 + tocilizumab group, n = 6. CUS + 4T1 + WP1066 group, n = 6. **P < .01, unpaired t-test. (e) Representative images of lung H&E staining, arrows indicated metastases. (f) Flow cytometry was used to analyze the percentage of MDSCs in tumor growth models of targeting IL-6 R and STAT3 mice. PB, peripheral blood. SP, spleen. BM, bone marrow. LU, lung. Representative results (left) and mean ± SEM from 6 mice (right) were shown
3.7 Targeting IL-6/STAT3 pathway suppresses MDSCs and inhibits lung metastasis in CUS-treated mice.
In addition, IL-6 receptor antibody (tocilizumab) and STAT3 antagonist (WP1066) were used to inhibit IL-6-induced activation of the JAK/STAT signaling pathway in vivo (). The results showed that targeting IL-6 receptor and STAT3 significantly reduced tumor growth rate compared to 4T1 + CUS group (). Simultaneously, the number and size of metastatic lung nodules were also significantly decreased by tocilizumab and WP1066 treatment (). Flow cytometry analysis showed that the number of MDSCs in spleen, peripheral blood, bone marrow and lung tissue was also significantly lower in mice treated with IL-6 R Ab and WP1066 than that of untreated CUS + 4T1 group (P < .01, ). These results implied that blocking the IL-6 signal or inhibiting the activation of the JAK/STAT signaling pathway could dramatically reduce tumor growth and metastasis by attenuating the accumulation of MDSCs in vivo.
4. Discussion
Accumulating evidence indicated that chronic psychological stress is associated with poor outcomes in breast cancer patients. However, the underlying mechanism is still inconclusive. In the present study, we demonstrated a critical role of the MDSCs in tumor metastasis induced by CUS. First, we have shown that CUS promoted lung metastasis and elevated the proportion of MDSCs in tumor-bearing mice. Second, adoptive transfer of MDSCs aggravated tumor metastatic colonization and MDSCs depletion alleviated lung metastasis. Third, propranolol could prevent tumor metastasis and the increase of MDSCs induced by CUS. Finally, we found that blocking the IL-6 signal or inhibiting the activation of the JAK/STAT signaling pathway could reduce tumor metastasis by attenuating the accumulation MDSCs ().
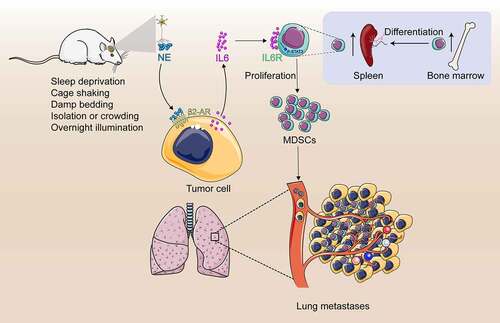
Figure 9. Study model schematic. Chronic stress causes the sympathetic nerve to release norepinephrine (NE). High levels of NE induce tumor cells to secrete large amount of IL-6 through β2-adrenergic receptor signal pathway. IL-6 promotes MDSCs differentiation by activating IL-6/STAT3 signal pathway. Increased MDSCs promotes lung metastasis of breast cancer
Interestingly, tumor invasion and metastasis are not the exclusively internal functions of tumors but require the involvement of immune cells and molecules. The role of MDSCs in the promotion of metastasis were proved in animal models as well as in several clinical studies.Citation11,Citation14,Citation31 In present study, regardless of the presence of CUS, MDSCs from 4T1 tumor-bearing mice displayed similar ability in promoting tumor cell invasion and suppressing T-cell responses in vitro. This phenomenon indicated that MDSCs directly promote tumor cell invasion and metastasis. However, adoptive transfer of the same number of MDSCs from non-stressed or stressed tumor-bearing mice did not show any significant differences in tumor metastasis, indicating that the enhanced tumor metastasis observed in CUS mice could be attributed to the elevated MDSCs levels but not their enhanced functional activity. Besides, we noted that the proportion of T and B cells and macrophages systematically decreased in the lung in tumor mice with the increase in the proportion of MDSCs. Thus, the inhibitory effect on the immune system may also be a major reason for MDSCs to promote metastasis.
It was reported that IL-6 played critical roles in MDSCs’ expansion and activation in several tumor types, such as hepatocellular carcinoma, prostate cancer, and breast cancer.Citation33–35 In this study, we found that ISO, a β-AR agonist, could stimulate the expression of IL-6 in 4T1 cells. Consistently, a previous study reported that β-AR stimulation could enhance IL-6 production by divergent pathways in breast cancer cell lines.Citation36 Moreover, we found that tumor-derived IL-6 promoted the differentiation of MDSCs in vitro and there was a positive correlation between the expression of IL-6 and the percentage of MDSCs by Pearson’s correlation analysis. In CUS-treated tumor-bearing mice, there was a significant increase of IL-6 levels in serum and tumor tissues. Meanwhile, we found that the expression of IL-6 R in splenic MDSCs of CUS + 4T1 mice was significantly higher than that of 4T1 group. Correspondingly, the proportion of MDSCs increased significantly in CUS + 4T1 mice compared to non-stressed 4T1 mice. In addition, when IL-6 R Ab was administrated, there was a significant decrease of MDSCs in spleen, peripheral blood, bone marrow and lung. These results implied that tumor-derived IL-6 was the key trigger, which could regulate the development of MDSCs.
Recent reports showed that catecholamines could regulate MDSCs’ development, mobilization, and trafficking through β-ARs.Citation37,Citation38 In current study, treatment with β3-AR selective blocker SR59230A failed to alleviate stress-induced tumor metastasis and MDSCs’ response in tumor-bearing mice; however, treatment with β1-AR/β2-AR inhibitor propranolol could reduce the number of CD11b+Gr-1+ cells in circulation, suppress MDSCs infiltration into lung tissues and attenuate tumor metastasis caused by chronic stress. There may be a close link between β1/β2-AR activation and MDSCs’ trafficking in tumor-bearing mice. Propranolol also abolished CUS-induced upregulation of proinflammatory cytokines and norepinephrine. In agreement with our results, a recent report confirmed that β2 adrenergic receptor was activated during chronic stress via phosphorylation of STAT3, which increased MDSCs’ accumulation and their suppressive potency.Citation24 Consistently, we found an aberrantly activated JAK/STAT signaling pathway during the development of MDSCs in this study, which demonstrated significant upregulation of the phosphorylated STAT3 both in vivo and in vitro. In addition, tumor-derived IL-6 was the key trigger that regulated the development of MDSCs, since treatment with IL-6 R antibody inhibited tumor growth and metastasis by attenuating MDSCs’ accumulation. These data indicated that chronic stress-induced IL-6 expression and MDSCs’ development through catecholamines-mediated activation of β1-AR/β2-AR signaling pathways in tumor-bearing mice.
Previous studies had shown that the expansion and activation of MDSCs were influenced by several different factors, including prostaglandins, stem-cell factor (SCF), M-CSF, IL-6, and granulocyte/macrophage CSF (GM-CSF).Citation39,Citation40 IL-6 stimulated the JAK/STAT signaling pathway, which played a crucial role in the amplification and function of MDSCs in multiple tumors.Citation41 This study found an aberrantly activated JAK/STAT signaling pathway during the IL-6-initiated development of MDSCs, which demonstrated by a significant upregulation of the phosphorylated STAT3 proteins. After inhibiting the phosphorylation of STAT3 via the specific antagonist WP1066, a considerable decrease in the proportion of CD11b+Gr-1+ MDSCs in vitro was confirmed. A consistent phenomenon was observed in human breast cancer, wherein the sustained activation of the JAK/STAT signaling pathway dominated the amplification and immunosuppressive capacity of the MDSCs.Citation15 These findings in both humans and mice implied that tumor-derived IL-6 involved in the hyperactivation of the JAK/STAT signaling pathway was the leading cause of the development of competent MDSCs in breast cancer.
Sympathetic nerves regulation of MDSCs mobilization may provide potential cellular and molecular mechanisms for clinical studies linking chronic stress to increased breast cancer progression in humans. Although there is evidence that history of stressful life events could be associated with a moderate increase in the risk of breast cancer,Citation42 there are more evidences have linked chronic stress to increased progression of established breast cancer.Citation43,Citation44 Those observations are consistent with data from the present experimental model in which stress-induced activation of the SNS showed moderately fast tumor growth of primary tumors, but reliably enhanced metastatic spread in the lung. The present findings also suggest that other physiologic or pharmacologic influences on SNS activity might potentially influence cancer progression. Such results would be consistent with epidemiologic findings linking beta-blocker usage to reduced distance metastasis and breast cancer-specific mortality.Citation45 It is noteworthy that there was no difference of MDSC between the tumor-free mice with and without CUS, suggesting the ability of CUS to increase MDSC requires the presence of tumors. Although the chronic stress evoked a short-lasting increase of tyrosine hydroxylase and β2-AR expression, the MDSC level did not change significantly with prolonged exposure to stress (Supplementary ), implicating the development of adaptation to chronic stress. Also, it is important to remember that chronic stress is a physiological perturbation and therefore unlikely to lead to major immunological changes.
5. Conclusions
In conclusion, the current study revealed that chronic psychological stress upregulated the levels of proinflammatory cytokines, stimulated MDSCs accumulation, and promoted lung MDSCs infiltration through catecholamine-mediated β-adrenergic signaling in breast tumor-bearing mice. The current data provided a new insight into the mechanisms underlying the association of Chronic stress with excessive inflammatory response and pathophysiological consequences in tumor-bearing mice. The findings also suggested a potential application of neuroprotective agents to prevent relapse of immune activation in treating tumor patients.
Supplemental Material
Download ()Acknowledgments
This research was supported by the National Natural Science Foundation of China (No.81971887, 81772252, 31971194, 81801949, and 81802091), Tianjin Natural Science Foundation (No.16JCYBJC28100, No. 18JCQNJC13400, No. 17JCQNJC10700), Key Laboratory of Emergency and Trauma (Hainan Medical University), Ministry of Education (No. KLET-201906) and Fundamental Research Funds for the Central Universities (No. 63191175).
Disclosure statement
No potential conflict of interest was reported by the author(s).
Supplementary Material
Supplemental data for this article can be accessed on the publisher’s website.
Additional information
Funding
References
- DeSantis, C., Ma, J., and Bryan, L. et al. Breast cancer statistics, 2013. CA Cancer J Clin. 2014;64(1):52–15. doi:10.3322/caac.21203.
- Hinzey, A., Gaudier-Diaz, M. M., and Lustberg, M. B., et al. Breast cancer and social environment: getting by with a little help from our friends. Breast Cancer Res. 2016;18(1):54. doi:10.1186/s13058-016-0700-x.
- Sloan, E.K., Priceman, S. J., and Cox, B. F., et al. The sympathetic nervous system induces a metastatic switch in primary breast cancer. Cancer Res. 2010;70(18):7042–7052. doi:10.1158/0008-5472.CAN-10-0522.
- Hermes, G.L., Delgado, B., and Tretiakova, M., et al. Social isolation dysregulates endocrine and behavioral stress while increasing malignant burden of spontaneous mammary tumors. Proc Natl Acad Sci U S A. 2009;106(52):22393–22398. doi:10.1073/pnas.0910753106.
- Chen, H., Liu, D., and Guo, L., et al. Chronic psychological stress promotes lung metastatic colonization of circulating breast cancer cells by decorating a pre-metastatic niche through activating beta-adrenergic signaling. J Pathol. 2018;244(1):49–60. doi:10.1002/path.4988.
- Shi, M., Liu, D., and Yang, Z., et al. Central and peripheral nervous systems: master controllers in cancer metastasis. Cancer Metastasis Rev. 2013;32(3–4):603–621. doi:10.1007/s10555-013-9440-x.
- Le, C.P., Nowell, C. J., and Kim-Fuchs, C., et al. Chronic stress in mice remodels lymph vasculature to promote tumour cell dissemination. Nat Commun. 2016;7(1):10634. doi:10.1038/ncomms10634.
- Thaker, P.H., Han, L. Y., and Kamat, A. A., et al. Chronic stress promotes tumor growth and angiogenesis in a mouse model of ovarian carcinoma. Nat Med. 2006;12(8):939–944. doi:10.1038/nm1447.
- Armaiz-Pena, G.N., Cole, S. W., and Lutgendorf, S. K., et al. Neuroendocrine influences on cancer progression. Brain Behav Immun. 2013;30:S19–25. doi:10.1016/j.bbi.2012.06.005.
- Gabrilovich DI, Nagaraj S. Myeloid-derived suppressor cells as regulators of the immune system. Nat Rev Immunol. 2009;9(3):162–174. doi:10.1038/nri2506.
- Solito, S., Pinton, L. , and Mandruzzato, S. In Brief: myeloid-derived suppressor cells in cancer. J Pathol. 2017;242(1):7–9. doi:10.1002/path.4876.
- Zhao, Y., Wu, T. , and Shao, S. et al. Phenotype, development, and biological function of myeloid-derived suppressor cells. Oncoimmunology. 2016;5(2):e1004983. doi:10.1080/2162402X.2015.1004983.
- Budhwar, S., Verma, P. , and Verma, R. et al. The Yin and Yang of Myeloid Derived Suppressor Cells. Front Immunol. 2018;9:2776. doi:10.3389/fimmu.2018.02776.
- Safarzadeh, E., Orangi, M., and Mohammadi, H., et al. Myeloid-derived suppressor cells: important contributors to tumor progression and metastasis. J Cell Physiol. 2018;233(4):3024–3036. doi:10.1002/jcp.26075.
- Zhang, W., Jiang, M., and Chen, J., et al. SOCS3 Suppression Promoted the Recruitment of CD11b(+)Gr-1(-)F4/80(-)MHCII(-) Early-Stage Myeloid-Derived Suppressor Cells and Accelerated Interleukin-6-Related Tumor Invasion via Affecting Myeloid Differentiation in Breast Cancer. Front Immunol. 2018;9:1699. doi:10.3389/fimmu.2018.01699.
- Safarzadeh, E., Hashemzadeh, S., and Duijf, P. H. G., et al. Circulating myeloid-derived suppressor cells: an independent prognostic factor in patients with breast cancer. J Cell Physiol. 2019;234(4):3515–3525. doi:10.1002/jcp.26896.
- Yang, Q., Li, X., and Chen, H., et al. IRF7 regulates the development of granulocytic myeloid-derived suppressor cells through S100A9 transrepression in cancer. Oncogene. 2017;36(21):2969–2980. doi:10.1038/onc.2016.448.
- Stromnes, I.M., Brockenbrough, J. S., and Izeradjene, K., et al. Targeted depletion of an MDSC subset unmasks pancreatic ductal adenocarcinoma to adaptive immunity. Gut. 2014;63(11):1769–1781. doi:10.1136/gutjnl-2013-306271.
- Ostrand-Rosenberg, S., and Sinha, P. Myeloid-derived suppressor cells: linking inflammation and cancer. J Immunol. 2009;182(8):4499–4506. doi:10.4049/jimmunol.0802740.
- Powell, N.D., Tarr, A.J. , and Sheridan, J. F. Psychosocial stress and inflammation in cancer. Brain Behav Immun. 2013;30:S41–7. doi:10.1016/j.bbi.2012.06.015.
- Ostrand-Rosenberg, S., Sinha, P., and Chornoguz, O., et al. Regulating the suppressors: apoptosis and inflammation govern the survival of tumor-induced myeloid-derived suppressor cells (MDSC). Cancer Immunol Immunother. 2012;61(8):1319–1325. doi:10.1007/s00262-012-1269-6.
- Jiang, W., Li, Y., and Li, Z.Z., et al. Chronic restraint stress promotes hepatocellular carcinoma growth by mobilizing splenic myeloid cells through activating beta-adrenergic signaling. Brain Behav Immun. 2019;80:825–838. doi:10.1016/j.bbi.2019.05.031.
- Ostrand-Rosenberg, S. Myeloid-Derived Suppressor Cells: facilitators of Cancer and Obesity-Induced Cancer. Annual Review of Cancer Biology. 2021;5(1):17–38. doi:10.1146/annurev-cancerbio-042120-105240.
- Mohammadpour, H., MacDonald, C. R., and Qiao, G., et al. beta 2 adrenergic receptor-mediated signaling regulates the immunosuppressive potential of myeloid-derived suppressor cells. J Clin Invest. 2019;129(12):5537–5552. doi:10.1172/JCI129502.
- Mundy-Bosse, B.L., Thornton, L. M., and Yang, H. C., et al. Psychological stress is associated with altered levels of myeloid-derived suppressor cells in breast cancer patients. Cell Immunol. 2011;270(1):80–87. doi:10.1016/j.cellimm.2011.04.003.
- Dawes, R.P., Burke, K. A., and Byun, D. K., et al. Chronic Stress Exposure Suppresses Mammary Tumor Growth and Reduces Circulating Exosome TGF-beta Content via beta-Adrenergic Receptor Signaling in MMTV-PyMT Mice. Breast Cancer (Auckl). 2020;14:1178223420931511. doi:10.1177/1178223420931511.
- Jin, F., Wu, Z., and Hu, X., et al. The PI3K/Akt/GSK-3beta/ROS/eIF2B pathway promotes breast cancer growth and metastasis via suppression of NK cell cytotoxicity and tumor cell susceptibility. Cancer Biol Med. 2019;16(1):38–54. doi:10.20892/j.2095-3941.2018.0253.
- Zhou, L., Miao, K., and Yin, B, et al. Cardioprotective Role of Myeloid-Derived Suppressor Cells in Heart Failure. Circulation. 2018;138(2):181–197. doi:10.1161/CIRCULATIONAHA.117.030811.
- Li, G., Yang, L., and Feng, L., et al. Syringaresinol Protects against Type 1 Diabetic Cardiomyopathy by Alleviating Inflammation Responses, Cardiac Fibrosis. And Oxidative Stress. Mol Nutr Food Res. 2020;64(18):e2000231. doi:10.1002/mnfr.202000231.
- Li, Y., Feng, L., and Li, G., et al. Resveratrol prevents ISO-induced myocardial remodeling associated with regulating polarization of macrophages through VEGF-B/AMPK/NF-kB pathway. Int Immunopharmacol. 2020;84:106508. doi:10.1016/j.intimp.2020.106508.
- Shi, H., Zhang, J., and Han, X., et al. Recruited monocytic myeloid-derived suppressor cells promote the arrest of tumor cells in the premetastatic niche through an IL-1beta-mediated increase in E-selectin expression. Int J Cancer. 2017;140(6):1370–1383. doi:10.1002/ijc.30538.
- Tobin, R.P., Jordan, K. R., and Kapoor, P., et al. IL-6 and IL-8 Are Linked With Myeloid-Derived Suppressor Cell Accumulation and Correlate With Poor Clinical Outcomes in Melanoma Patients. Front Oncol. 2019;9:1223. doi:10.3389/fonc.2019.01223.
- Lin, Y., Yang, X., and Liu, W., et al. Chemerin has a protective role in hepatocellular carcinoma by inhibiting the expression of IL-6 and GM-CSF and MDSC accumulation. Oncogene. 2017;36(25):3599–3608. doi:10.1038/onc.2016.516.
- Oh, K., Lee, O. Y., and Shon, S. Y., et al. A mutual activation loop between breast cancer cells and myeloid-derived suppressor cells facilitates spontaneous metastasis through IL-6 trans-signaling in a murine model. Breast Cancer Res. 2013;15(5):R79. doi:10.1186/bcr3473.
- Wu, C.T., Hsieh, C. C., and Lin, C. C., et al. Significance of IL-6 in the transition of hormone-resistant prostate cancer and the induction of myeloid-derived suppressor cells. J Mol Med (Berl). 2012;90(11):1343–1355. doi:10.1007/s00109-012-0916-x.
- Madden, K.S., Szpunar, M.J. , and Brown, E. B. β-Adrenergic receptors (β-AR) regulate VEGF and IL-6 production by divergent pathways in high β-AR-expressing breast cancer cell lines. Breast Cancer Res Treat. 2011;130(3):747–758. doi:10.1007/s10549-011-1348-y.
- Cao, M., Huang, W., and Chen, Y., et al. Chronic restraint stress promotes the mobilization and recruitment of myeloid-derived suppressor cells through β-adrenergic-activated CXCL5-CXCR2-Erk signaling cascades. Int J Cancer. 2021;149(2):460–472. doi:10.1002/ijc.33552.
- Jiang, W., Li, Y., and Li, Z. Z., et al. Chronic restraint stress promotes hepatocellular carcinoma growth by mobilizing splenic myeloid cells through activating β-adrenergic signaling. Brain Behav Immun. 2019;80:825–838.
- Bunt, S.K., Yang, L., and Sinha, P., et al. Reduced inflammation in the tumor microenvironment delays the accumulation of myeloid-derived suppressor cells and limits tumor progression. Cancer Res. 2007;67(20):10019–10026. doi:10.1158/0008-5472.CAN-07-2354.
- Pan, P.Y., Wang, G. X., and Yin, B., et al. Reversion of immune tolerance in advanced malignancy: modulation of myeloid-derived suppressor cell development by blockade of stem-cell factor function. Blood. 2008;111(1):219–228. doi:10.1182/blood-2007-04-086835.
- Jiang, M., Chen, J., and Zhang, W., et al. Interleukin-6 Trans-Signaling Pathway Promotes Immunosuppressive Myeloid-Derived Suppressor Cells via Suppression of Suppressor of Cytokine Signaling 3 in Breast Cancer. Front Immunol. 2017;8:1840. doi:10.3389/fimmu.2017.01840.
- Bahri, N., Fathi Najafi, T., and Homaei Shandiz, F., et al. The relation between stressful life events and breast cancer: a systematic review and meta-analysis of cohort studies. Breast Cancer Res Treat. 2019;176(1):53–61. doi:10.1007/s10549-019-05231-x.
- Chida, Y., Hamer, M., and Wardle, J., et al. Do stress-related psychosocial factors contribute to cancer incidence and survival? Nat Clin Pract Oncol. 2008;5(8):466–475. doi:10.1038/ncponc1134.
- Graham, J., Ramirez, A., and Love, S., et al. Stressful life experiences and risk of relapse of breast cancer: observational cohort study. BMJ. 2002;324(7351):1420. doi:10.1136/bmj.324.7351.1420.
- Phadke, S., and Clamon, G. Beta blockade as adjunctive breast cancer therapy: a review. Crit Rev Oncol Hematol. 2019;138:173–177. doi:10.1016/j.critrevonc.2019.04.006.