
ABSTRACT
Kynurenine (Kyn) is a key inducer of an immunosuppressive tumor microenvironment (TME). Although indoleamine 2,3-dioxygenase (IDO)-selective inhibitors have been developed to suppress the Kyn pathway, the results were not satisfactory due to the presence of various opposing mechanisms. Here, we employed an orally administered novel Kyn pathway regulator to overcome the limitation of anti-tumor immune response. We identified a novel core structure that inhibited both IDO and TDO. An orally available lead compound, STB-C017 (designated hereafter as STB), effectively inhibited the enzymatic and cellular activity of IDO and TDO in vitro. Moreover, it potently suppressed Kyn levels in both the plasma and tumor in vivo. STB monotherapy increased the infiltration of CD8+ T cells into TME. In addition, STB reprogrammed the TME with widespread changes in immune-mediated gene signatures. Notably, STB-based combination immunotherapy elicited the most potent anti-tumor efficacy through concurrent treatment with immune checkpoint inhibitors, leading to complete tumor regression and long-term overall survival. Our study demonstrated that a novel Kyn pathway regulator derived using deep learning technology can activate T cell immunity and potentiate immune checkpoint blockade by overcoming an immunosuppressive TME.
Introduction
Impressive progress in cancer immunotherapy has been made since the emergence of immune checkpoint inhibitors (ICIs), such as antibodies against PD-1, PD-L1, and CTLA-4.Citation1–5 However, these new therapeutics are still associated with limitations, including moderate response rates, adaptive and intrinsic resistance, especially in solid malignancies.Citation2,Citation3,Citation6–8
Following the success of ICIs, kynurenine (Kyn) signaling pathway has attracted increased attention and has been intensively investigated as a central regulator of immune tolerance in cancer.Citation9,Citation10 Kyn acts as a major suppressor of anti-tumor immunity by inducing T-cell dysfunction, accumulating myeloid-derived suppressor cells (MDSCs) and promoting aberrant tumor angiogenesis.Citation11–16 Two major enzymes, indoleamine 2,3-dioxygenase (IDO) and tryptophan 2,3-dioxygenase (TDO) regulate the rate-limiting step of Kyn metabolism by catalyzing tryptophan (Trp) conversion to Kyn.Citation17–19 IDO and TDO are frequently upregulated in various human malignancies and facilitate the accumulation of Kyn within the tumor microenvironment (TME).Citation20,Citation21 Increased Kyn concentration and Kyn/Trp ratio in TME or systemic circulation are associated with tolerogenic immune phenotype and correlated with poor survival outcome in patients with advanced cancers.Citation22–24 Recent studies also demonstrated that a high serum Kyn/Trp ratio correlates with reduced clinical benefit from ICIs in several cancer types, including lung cancer, kidney cancer, and melanoma.Citation25–27 Furthermore, inhibiting the Kyn signaling pathway reverses Kyn-mediated cancer immune suppression and enhances the efficacy of anti-PD-1 and anti-CTLA-4 immunotherapy in preclinical tumor models.Citation28–30
Therefore, extensive efforts have been devoted to develop a selective and potent inhibitor of the Kyn signaling pathway, leading to the development of the IDO-selective inhibitor, epacadostat.Citation10,Citation19,Citation31 Epacadostat acts as a competitive inhibitor of IDO and it effectively suppresses intratumoral Kyn levels, restores anti-tumor immunity, and synergizes with ICIs in preclinical studies.Citation32,Citation33 Based on the encouraging preclinical results, a large Phase III trial (ECHO-301/KEYNOTE-252) was conducted where epacadostat was combined with the anti-PD-1 antibody, pembrolizumab, in patients with advanced melanoma.Citation34,Citation35 However, the addition of epacadostat did not prolong the overall survival compared with pembrolizumab monotherapy.Citation36
There could be several reasons for this pivotal failure such as suboptimal suppression of the Kyn pathway in vivo, bypass activation of other Kyn pathway enzymes, and absence of predictive biomarkers for patient selection.Citation24,Citation37,Citation38 Therefore, further studies need to address the in-depth mechanisms of Kyn-mediated immunologic dysregulation to develop more effective ways to block the Kyn pathway within the tumor.
Here, we hypothesized that this unsatisfactory result obtained for IDO-selective inhibitors is attributed to pathway redundancies through bypass activation of TDO, resulting in the suboptimal suppression of Kyn synthesis. To overcome these challenges, we employed deep learning model to rationally design and discover a novel Kyn pathway regulator with potent immunotherapeutic efficacy.
Materials and methods
Deep learning model construction and hit prediction
We used bioactivity data measured from 2,268 unique small compounds against IDO to construct our initial convolution neural network (CNN) classification model. The data were aggregated from four different sources, including patent documents (579 compounds), peer-reviewed literature (62 compounds), PubChem database (442 compounds), and the proprietary screening data (1,185 compounds).
We used RDKit (www.rdkit.org) to extract a 1,024-bit molecular descriptor from individual compounds in the datasets, where bioactivity data was available in varied forms, ranging from binary classification (i.e., active or inactive) to IC50, according to the data source. We thus encoded bioactivity data as a binary feature with 0 and 1 indicating inactive and active enzyme activity, respectively, instead of continuous data values.
We used 5-fold cross-validation to train and evaluate the prediction model. We split the training dataset into five equal-sized, non-overlapping subgroups. Of the five subgroups, one randomly selected subgroup was set aside as a test dataset, and the remaining four subgroups were combined and used to train the CNN-based as a training dataset. The same process was repeated four additional times with a different test dataset being used each time. We optimized the parameters until the trained model achieved a receiver operating characteristic curve-area under the curve of greater than 0.9 for the test data (Supplementary Figure 1).
The TDO model was trained with the same method except that the initial training data consisted of bioactivity data of 1,710 unique compounds.
We aimed to enhance the generalization of the prediction model, and thus performed four iterative cycles of predictions followed by in vitro validation. IDO and TDO models were employed to screen a chemical library of 270,000 commercially available small compounds. A panel of 189 compounds were curated from the top-ranked potential IDO or TDO inhibitors, followed by experimental validation. The newly produced assay results were then combined with the initial training data to retrain each model. This process was repeated a total of four times.
Compounds that exhibited bioactivity against both IDO and TDO were consolidated from four rounds of iterative training and validation. Of these, three unique structural scaffolds were derived by clustering compounds by structural similarity and selecting a representative set. Derivatives of the selected scaffolds were designed, and subsequent in vitro assays led to one lead compound.
Mice and cell lines
Male BALB/c mice were purchased from Orient Bio Inc. (Seongnam, Korea). Mice were housed in a specific pathogen-free facility (Seongnam, Korea). All animal experiments were approved by the Institutional Animal Care and Use Committee (IACUC, #2000174) of CHA University and carried out following the approved protocols. The CT26 murine colon cancer cell line was obtained from the Korean Cell Line Bank (KCLB, Seoul, Korea, #80009). Human cancer cell lines, HeLa and A172 were also originally obtained from ATCC (#CCL-2 and #CRL-1620). These cells were maintained in DMEM or RPMI 1640 medium, each supplemented with 10% FBS and 1% penicillin/streptomycin, and incubated at 37°C, 5% CO2.
Establishment of a TDO-overexpressing CT26 cell line
For viral transduction, 5 × 10⁵ CT26 cells were incubated with 10 MOI TDO2 lentiviral particles (Origene) supplemented with 10 μg/ml Polybrene (Sigma) for 6 h, following which fresh complete medium was added. The transduced cells were cultured with 2 μg/ml puromycin 3 days after transduction to eliminate the nontransduced cells. Two weeks after transduction, the cell clones were isolated and used in the study.
In vitro enzyme- and cell-based assay for IDO and TDO activity
For the determination of enzymatic and cellular IDO and TDO activity, an in vitro assay (BPS Bioscience) was performed according to the manufacturer’s instructions. For the enzyme-based assay, STB-C017 was dissolved in dimethylsulfoxide (DMSO) and added at a variable concentration to a 384-well plate containing the reaction solution, followed by the addition of IDO or TDO. After incubation at room temperature for 1 h, a fluorescence-activating solution was added and continuously incubated for 4 h. For the cell-based assay, HeLa and A172 cells were seeded in a 96-well plate at a density of 3 × 10⁴ cells per well and grown overnight. The next day, 50 ng/ml IFNγ and serial dilutions of STB-C017 were added into cells and incubated at 37°C in a 5% CO2 incubator. After an additional 24 h of incubation, supernatants were mixed with 6.1 N trichloroacetic acid (Sigma) at 50°C for 30 min. Then, the mixture was centrifuged at 3,500 rpm for 5 min, and supernatants were transferred and mixed with the detection solution for 10 min. After the final incubation of enzyme- and cell-based assay, absorbance was read at 400 and 480 nm using a Synergy Neo microplate reader (BioTek).
In vivo lipopolysaccharide (LPS) administration
BALB/c mice were intraperitoneally injected with 0.8 mg/kg LPS and/or orally administrated 100 mg/kg STB-C017. After treatment for 24 h, mouse blood was obtained via retro-orbital puncture.
Measurement of Trp/Kyn levels using ELISA
The biological activity of IDO and TDO was evaluated via measuring Trp and Kyn levels in the plasma, tumors, and cell lines. Mouse blood was centrifuged at 13,000 rpm for 10 min and the plasma was aspirated. Tumor samples were homogenized in PBS for 5 min and debris were removed by centrifugation at 13,000 rpm. Cells were seeded in a 24-well plate and treated with 50 ng/ml IFN-γ with serial dilutions of either STB-C017 or epacadostat, and the supernatants were harvested after 48 h. Trp and Kyn concentrations were measured using the ELISA kit (ImmuSmol, Pessac, France), according to the manufacturer’s instructions.
Tumor models and treatment regimens
Tumors were implanted via subcutaneous injection of 2 × 10⁵ CT26 or CT26-TDO cells into the right flank of wild type BALB/c mice. When tumor volume reached >50 mm3, mice were orally administrated STB-C017 twice daily. Mice in the control group were orally treated with the same volume of PBS. For combination therapy, we also administered epacadostat orally (100 mg/kg, EPA, LEAPChem) twice daily. For the cell depletion study, the mice received an intraperitoneal injection of 200 μg of anti-CD8 (clone 53–6.72, BioXCell) antibody every 3 days. For immune checkpoint blockade, each mouse received an intraperitoneal injection of anti-PD-1 (8 mg/kg, clone J43, BioXCell) or anti-CTLA-4 (4 mg/kg, clone 9D9, BioXCell) antibody at the given time points. The surviving mice with complete tumor regression were rechallenged with 2 × 10⁵ CT26 or Renca cells in the left flank, and the tumor growth was monitored. The tumors were measured with a digital caliper, and tumor volumes were calculated using the following modified ellipsoid formula: 1/2 × (length × widthCitation2). For survival analysis, the mice were euthanized when the tumor volume exceeded 2000 mm3 or when the mice became moribund.
RNA isolation and NanoString gene expression analysis
For NanoString gene expression analysis, we extracted total RNA from whole tumor tissues using TRIzol (Invitrogen) and purified it with ethanol. RNA concentration and quality were confirmed using a Fragment Analyzer (Advanced Analytical Technologies, IA, USA). Immune profiling was performed with a digital multiplexed NanoString nCounter PanCancer Immune Profiling mouse panel (NanoString Technologies) using 100 ng of total RNA isolated from tumor samples, as per our previously established protocol.Citation8,Citation39
Quantitative reverse transcriptase PCR
Total RNA was extracted using the TRIzol reagent (Invitrogen) to evaluate Ido1 and Tdo2 expression. The GoScript Reverse Transcription kit (Promega) was used to synthesize cDNA, and qPCR was performed using the FastStart Essential DNA Green Master (Roche). The primer sequences used for qPCR are listed in Supplementary Table 1. LightCycler 96 (Roche) was used for qPCR, and the results were analyzed using the LightCycler 96 SW 1.1 software (Roche). Relative fold differences in the expression levels were determined using the ΔCt method.
Flow cytometry analysis
For flow cytometry analysis, the harvested tumors from each group were minced and incubated for 1 h at 37°C in a digestion buffer comprising 2 mg/ml collagenase D (Roche) and 40 μg/ml DNase I (Roche). Cell suspensions were filtered through a 70 μm cell strainer (Corning) and incubated for 3 min at room temperature in ACK lysis buffer (Gibco) to remove the cell clumps and red blood cells. After washing with FACS buffer (1% FBS in PBS), the cells were filtered through a nylon mesh. Next, the cells were incubated on ice for 30 min in Fixable Viability Dye eFluorTM 450 (Invitrogen) to exclude the dead cells before antibody staining. Then, the cells were washed with FACS buffer and incubated on ice for 30 min in FACS buffer with surface antibodies targeting CD45 (30-F11, Invitrogen), CD3 (17A2 or 145–2C11, Invitrogen), CD8a (53–6.7, Invitrogen), CD4 (RM4-5, Invitrogen), PD-1 (J43, Invitrogen), CD25 (PC61.5, Invitrogen), ICOS (7E.17G9, Invitrogen), CD49b (DX5, Invitrogen), EpCAM (G8.8, Invitrogen), CD11b (M1/70, Invitrogen), CD11 c (N418, Invitrogen), CD86 (GL1, Invitrogen), Ly-6 G (RB6-8C5, Invitrogen), F4/80 (BM8, Invitrogen), or Ly-6 C (HK1.4, Invitrogen). Cells were further permeabilized using a Foxp3 Staining Buffer kit (Invitrogen) and stained for Foxp3 (FJK-16s, Invitrogen), Granzyme B (NGZB, Invitrogen), iNOS (CXNFT, Invitrogen), or Arginase 1 (A1exF5, Invitrogen). Tumor cells (EpCAM+CD45−), stromal cells (EpCAM−CD45−), myeloid cells (CD45+CD11b+CD11c−), DCs (CD45+CD11b+CD11c+), and other immune cells (EpCAM−CD45+) were isolated from tumors using MoFlo XDP cell sorter (Beckman Coulter). The stained cells were analyzed using a CytoFLEX flow cytometer (Beckman Coulter), and the data were analyzed with the FlowJo software (Tree Star Inc.).
Cytometric bead array (CBA)
To measure the levels of cytokines, including IL-2, IL-4, IL-6, IFNγ, TNF, IL-17A, and IL-10 in the plasma, the CBA Mouse Th1/Th2/Th17 Cytokine Kit (BD Biosciences) was performed according to the manufacturer’s instructions. In brief, the prepared capture beads and detection reagents were incubated with the standards or the plasma samples for 2 h at room temperature. After a wash, these complexes were detected using flow cytometry to identify particles with fluorescence characteristics.
Histological analyses via immunofluorescence
For immunofluorescence staining, the tumor samples were fixed in 1% PFA, dehydrated overnight in 20% sucrose solution, and frozen (Leica). The frozen blocks were sectioned into 50 μm-thick slices, which were permeabilized with 0.3% PBS-T (Triton X-100 in PBS), and blocked with 5% normal goat serum in 0.1% PBS-T for 30 min at room temperature. Next, the samples were incubated overnight with the following primary antibodies: Anti-PD-L1 (rabbit, clone 28–8, Abcam), anti-CD8 (rat, clone 53–6.7, BD Pharmingen), anti-CD31 (hamster, clone 2H8, Millipore; rabbit, Abcam), anti-L-Kyn (mouse, clone 3D4-F2, ImmuSmol), anti-Granzyme B (rat, clone NGZB, Invitrogen), anti-Ki67 (rabbit, Abcam), or anti-Caspase3 (rabbit, R&D Systems). After several washes, the samples were incubated for 2 h at room temperature with the following secondary antibodies: FITC- or Cy3-conjugated anti-rabbit IgG (Jackson ImmunoResearch), FITC- or Cy3-conjugated anti-rat IgG (Jackson ImmunoResearch), Cy3-conjugated anti-hamster IgG (Jackson ImmunoResearch), or FITC-conjugated anti-mouse IgG (Jackson ImmunoResearch). Cell nuclei were counterstained with 4ʹ,6-diamidino-2-phenylindole (DAPI, Invitrogen). Finally, samples were mounted with fluorescent mounting medium (DAKO), and images were acquired using a Zeiss LSM 880 microscope (Carl Zeiss).
Morphometric analyses
Density measurements of blood vessels, T lymphocytes, Ki67+ proliferating cells, apoptotic cells, Kyn+ cell area, GzB+ cell area, and PD-L1+ cell area, were performed using ImageJ software (http://rsb.info.nih.gov/ij). Blood vessel density was determined by calculating the CD31+ area per random 0.49 mm2 field on the tumor sections. The degree of cytotoxic T lymphocyte infiltration was calculated as the percentage of CD8+ area per random 0.49 mm2 field. The density of proliferating cells was measured by calculating the percentage Ki67+ area in random 0.49 mm2 fields. The extent of apoptosis was shown as the percentage Caspase3+ area per random 0.49 mm2 fields. To determine the level of Kyn expression, the Kyn+ area per random 0.49 mm2 field was calculated in tumor sections. To define the activation of T lymphocyte, GzB+ area per random 0.49 mm2 field was calculated in intratumoral regions. The density of PD-L1+ cells was quantified as the percentage of PD-L1+ area per random 0.49 mm2 fields. All analyses were performed on at least five fields per mouse.
Statistical analysis
Statistical analyses were performed using GraphPad Prism 7.0 software (GraphPad Software, La Jolla, California, USA) and PASW statistics 18 (SPSS). Values are presented as the mean ± SD unless otherwise indicated. The Shapiro–Wilk normality test was performed for all datasets to analyze whether each dataset followed a normal distribution pattern. If the dataset followed normal distribution, we applied parametric tests, such as the Student’s t-test and one-way analysis of variance. If the dataset did not follow normal distribution owing to a small sample size, we used non-parametric tests, such as the Mann-Whitney U test and Kruskal–Wallis test. Pearson’s correlation analysis was performed to investigate the relationship between CD8+ T cell expression and intratumoral Kyn expression. Survival curves were generated using the Kaplan-Meier method, and statistical differences between curves were analyzed using the log-rank test. The level of statistical significance was set at P < .05.
Results
Screening for an active Kyn pathway inhibitor via deep learning
We developed a deep learning model to rapidly search for compounds that exhibit inhibitory activity against both IDO and TDO (see Method section for further details). We employed three steps () as follows: First, IDO- and TDO-inhibitor prediction models were trained using data for 2,283 and 1,710 compounds with known bioactivity; second, the initial IDO and TDO models were used to screen ZINC-15 chemical library, and top-ranked compounds were experimentally validated; finally, newly generated data were combined with the initial training data to retrain the models. Four rounds of iterative cycles led to the identification of three unique scaffolds.
Figure 1. Deep learning screening identified a novel compound that inhibits IDO and TDO. IDO and TDO dual inhibitor, STB-C017 (STB), was identified through a deep learning model and validated both in vitro and in vivo. (a) Diagram depicting the identification and optimization of the lead compound, STB, through deep learning model. (b) Measurement of IDO and TOD enzyme kinetics using an enzyme-based assay. (c) Measurement of IDO and TDO cellular activity using a cell-based assay. (d) Mice were treated with vehicle or STB 24 h after a single intraperitoneal injection of LPS (0.8 mg/kg). Comparison of plasma kynurenine (Kyn) levels. (e) Comparison of mRNA expression levels of IDO and TDO, and comparison of Kyn levels in CT26 and CT26-TDO cell lines. (f) Comparison of Kyn levels in CT26 cell line in vitro and CT26 tumor growth in vivo treated with EPA or STB. (g) Comparison of Kyn levels in CT26-TDO cell line in vitro and CT26-TDO tumor growth in vivo treated with EPA or STB. Values are presented as the mean ± SD. *p < .05 versus control; #p < .05 versus LPS. One-way ANOVA (d) and two-tailed Student’s t-test (e-g) were used. IDO, Indoleamine 2,3-dioxygenase; TDO, Trp 2,3-dioxygenase; STB, STB-C017; LPS, Lipopolysaccharide
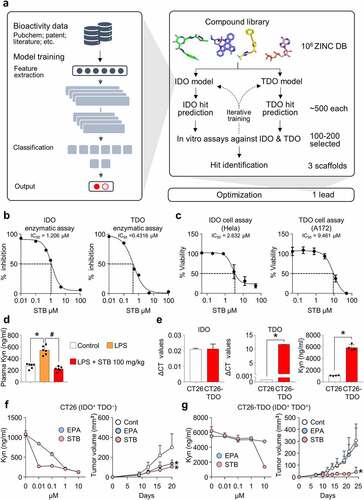
A lead compound, STB-C017 (designated hereafter as STB) was derived from the verified core structure through structural modification and subsequent in vitro assays. STB actively inhibited IDO and TDO, detected via an in vitro enzyme-based assay (). Moreover, STB suppressed IDO cellular activity in HeLa cervical cancer cells and TDO cellular activity in A172 glioblastoma cells, reducing Kyn production in a dose-dependent manner (). To confirm the in vivo activity of STB, mice were intraperitoneally injected with LPS and subsequently treated with STB orally. While the plasma level of Kyn was markedly increased upon intraperitoneal LPS injection, STB treatment normalized plasma Kyn levels ().
Next, we evaluated the levels of IDO, TDO, and Kyn in CT26 colon cancer cells. CT26 colon cancer cells showed high IDO expression, but did not show TDO expression (). We also isolated various cells types from CT26 tumor tissue and analyzed the levels of IDO and TDO expression. IDO expression was predominant in tumors cells, but non-significant in other cell types and TDO was minimally detected in dendritic cells (Supplementary Figure 2).
When CT26 cells were treated with either epacadostat or STB, both agents effectively suppressed Kyn production (, left). Both agents also suppressed CT26 tumor growth in vivo (, right). Because CT26 cancer cells do not express TDO, we generated a TDO-overexpressing CT26 cell line (CT26-TDO) using the lentiviral system. CT26-TDO cells produced very high levels of TDO and Kyn compared with original CT26 cells (). Although epacadostat failed to suppress Kyn expression in CT26-TDO cells, STB markedly suppressed Kyn production in vitro (, left). Moreover, STB suppressed the growth of CT26-TDO tumors in vivo, whereas epacadostat did not (, right). Therefore, TDO inhibition by STB could provide additional therapeutic benefit in TDO-overexpressing tumors compared with epacadostat.
Collectively, a novel compound identified via deep learning-based drug screening demonstrated remarkable Kyn suppression in vivo and in vitro.
Dose and schedule optimization of STB treatment
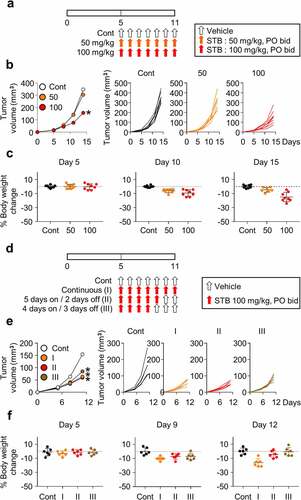
To confirm the anti-tumor efficacy of STB, mice injected with CT26 cells were orally administered with various concentrations of STB twice daily (). STB treatment showed a dose-dependent suppression of CT26 tumors with 55% tumor growth inhibition at a dose of 100 mg/kg (). However, continuous treatment with STB at 100 mg/kg for more than 1 week resulted in asthenia, anorexia, and weight loss in treated mice (). Therefore, to optimize STB treatment, mice were treated following various schedules as follows: Continuous (I), 5 days of treatment followed by 2 days off (II), and 4 days of treatment followed by 3 days off (III) (). In terms of efficacy, schedule I and II showed almost comparable tumor-suppressing effects (). In terms of toxicity, schedule I showed cumulative weight loss and asthenia. On the contrary, schedule II and III showed transient weight loss, which was fully reversed after days without any drug administration (). Therefore, based on these findings, STB at 100 mg/kg twice a day for 5 days followed by 2 days off was selected as an optimal regimen for further experiments.
Figure 2. Dose and schedule optimization of STB treatment. CT26 tumor cells were subcutaneously implanted into mice, which were treated orally with vehicle or STB. (a) Diagram of the treatment schedule. Arrows indicate treatment. (b) Comparison of CT26 tumor growth in mice treated with vehicle or STB using different doses. (c) Comparison of body weight in mice treated with vehicle or STB. (d) Diagram of the treatment schedule. Black arrows indicate vehicle and red arrows indicate STB treatment. (e) Comparison of tumor growth in mice treated with vehicle or STB using different treatment schedules. (f) Comparison of CT26 mouse weight upon treatment with vehicle or STB. Values are presented as the mean ±SD. *p < .05 versus control. A two-tailed Student’s t-test (b, e) was used
STB suppresses Kyn accumulation and infiltrates CD8+ T cells within the tumor
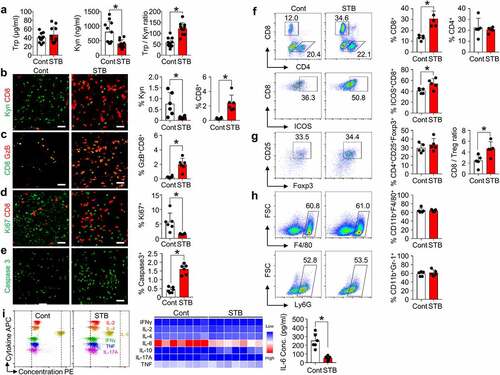
To further investigate the effects of STB on TME, histological and flow cytometry analyses were performed on tumor samples treated with vehicle or STB. STB treatment effectively reduced tumoral Kyn level in CT26 colon cancer, thereby increasing intratumoral Trp/Kyn ratio and facilitating intratumoral infiltration of CD8+ T cells (, b). Moreover, there were more abundant GzB+-activated CD8+ T cells within STB-treated tumors compared with control tumors (). Furthermore, the proliferation of tumor cells decreased by 72% and intratumoral apoptosis increased by 3.8 folds in STB-treated tumors compared with control tumors (, e). Flow cytometric analyses showed consistent findings in STB-treated tumors: an increase in the percentage of CD8+ T cells and higher ICOS levels on the surface of CD8+ T cells within tumors (). There were no significant changes in the percentage of CD4+CD25+FoxP3+ regulatory T cells, CD11b+F4/80+ tumor-associated macrophages, and CD11+Gr1+ myeloid suppressor cells (). Finally, among various plasma cytokines, IL-6 level was markedly reduced in STB-treated mice compared to that in control mice, while there were no significant changes in the levels of other cytokines (). Taken together, STB treatment reduced intratumoral Kyn accumulation and elicited anti-tumor T-cell immunity.
Figure 3. STB suppresses Kyn accumulation and infiltrates CD8+ T cells within tumor microenvironment. Mice were subcutaneously implanted with CT26 tumor cells and orally treated with vehicle or STB. (a) Comparison of intratumoral tryptophan (Trp) and Kyn level. (b-e) Representative images and comparisons of Kyn expression, CD8+ T cell numbers (b), GzB+ T cell activation (c), cell proliferation (d) and cell apoptosis (e) within tumors. (f) Representative flow cytometry plot and comparisons of CD8+ T cell, CD4+ T cell and CD8+ICOS+ cell fractions. (g) Comparisons of CD4+Foxp3+CD25+ Treg fraction and CD8/Treg ratio in tumors. (h) Comparisons of CD11b+F4/80+ TAMs and CD11b+Ly6G+ MDSCs fractions in tumors. (i) Representative flow cytometry plot showing the level of multiple cytokines in the plasma. Values are presented as the mean ±SD. *p < .05 versus control. A two-tailed Student’s t-test (a -i) was used. Scale bars, 50 μm. GzB, granzyme B; Treg, regulatory T cell; TAM, tumor-associated macrophage; MDSC, myeloid-derived suppressor cell
STB induces widespread activation of T cell immunity
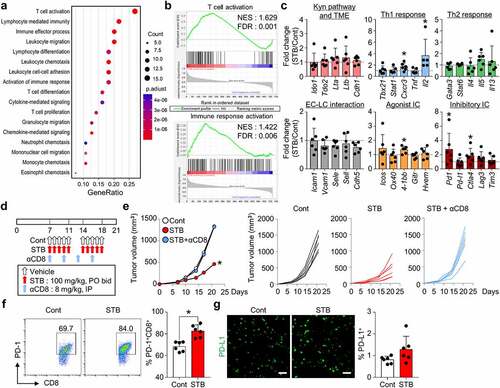
To further dissect STB-induced TME remodeling, tumors were analyzed via Nanostring PanCancer Immune Profiling. STB treatment had a great impact on T cell immunity, by inducing T cell activation, lymphocyte-mediated immunity, and lymphocyte differentiation, whereas it did not have a significant impact on myeloid cells (). Moreover, STB treatment upregulated genes related to Th1 response (especially Il2) and immune checkpoints (especially Pd1 and Ctla-4) (). To confirm the importance of T-cell-mediated immunity during STB treatment, we treated tumor-bearing mice with STB in the absence or presence of the CD8 neutralizing antibody (). CD8 depletion completely abrogated the anti-tumor effects of STB, indicating that CD8+ T cells are indispensable for STB anti-tumor efficacy (). Intriguingly, STB-mediated adverse events, such as asthenia and anorexia, were alleviated upon CD8+ T cell depletion. Finally, flow cytometry analyses revealed increased PD-1 expression on CD8+ T cells following STB treatment, while there were no significant changes in tumoral PD-L1 expression (). Overall, STB treatment activated T cell immunity and suppressed tumor growth in a CD8+ T cell-dependent manner.
Figure 4. STB induced widespread transcriptional programs that activate T cell immunity. CT26 tumor cells were implanted subcutaneously into mice, which were treated orally with vehicle or STB and the depleting antibody for CD8 (αCD8). (a) Dot plot showing enrichment of GO biological processes for NanoString immune-related genes in mice treated with vehicle or STB. 17 GO biological processes with the largest gene ratios are plotted in order of gene ratio. The size of each dot represents the number of genes significantly related to immunity associated with the GO term and the color of the dots represent the P-adjusted value. (b) GESA of gene sets involved in T cell and immune response activation. (c) Comparisons of gene expression related to the Kyn pathway and TME, Th1 response, Th2 response, endothelial cell (EC)-lymphocyte (LC) interaction, agonistic immune checkpoints, and inhibitory immune checkpoints. (d) Diagram of the treatment schedule. Arrows indicate treatment. (e) Comparison of CT26 tumor growth in mice. Mean and individual tumor growth curves over time. (f) Representative flow cytometry plot showing PD-1 expression in CD8+ T cells. (g) Representative images and comparisons of tumoral PD-L1+ cell numbers. Values are presented as the mean ±SD. *p < .05 versus control. One-tailed Student’s t-test (c) and two-tailed Student’s t-test (e-g) were used. Scale bars, 50 μm. GO, Gene Ontology; GESA, Gene Set Enrichment Analysis; PD-1, program cell death protein 1; PD-L1, program cell death ligand 1
STB differentially remodels the tumor immune microenvironment compared with epacadostat
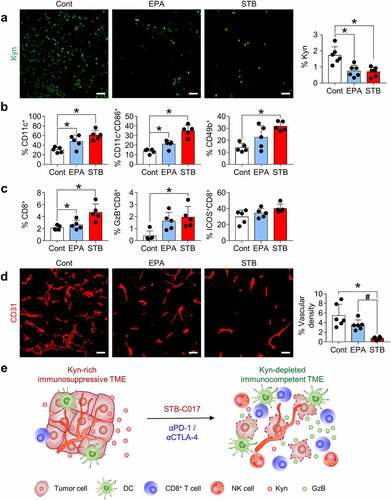
We hypothesized that STB would affect the TME differently than epacadostat, and we compared the TME changes induced by the two drugs. Although both epacadostat and STB suppressed Kyn expression within the tumors (), STB remarkably activated innate immunity by activating CD11c+ DCs and infiltrating CD49b+ natural killer (NK) cells in the TME (). Moreover, STB induced stronger GzB+ CD8 T cell infiltration into the tumor compared with epacadostat (). Because Kyn signaling is involved in aberrant tumor angiogenesis,Citation11–16 we also examined CD31+ tumor vasculatures and found that CD31+ tumor vascular density was also suppressed more strongly upon STB treatment than upon epacadostat treatment (). Taken together, STB transforms Kyn-abundant immunosuppressive tumors to Kyn-depleted immunocompetent tumors in a way different from epacadostat ().
Figure 5. STB differentially remodels the tumor immune microenvironment compared with epacadostat. Mice were subcutaneously implanted with CT26 tumor cells and orally treated with vehicle, STB, and epacadostat. (a) Representative images and comparisons of intratumoral Kyn expression in tumors. (b) Comparisons of CD11b+CD11c+ DC, CD11c+CD86+ DC, and CD3−CD49b+ NK cell fractions in tumors. (c) Comparisons of CD8+ T cell, CD8+GzB+ T cell and CD8+ICOS+ T cell fractions in tumors. (d) Representative images and comparisons of CD31+ tumor blood vessels. (e) Diagram depicting the mechanism by which STB-C017 facilitates T-cell-mediated immunity within TME. Values are presented as the mean ±SD. *p < .05 versus control; #p < .05 versus epacadostat. A two-tailed Student’s t-test (a-d) was used. Scale bars, 50 μm. DC, dendritic cell; NK, natural killer
STB synergizes with ICIs to suppress tumor growth
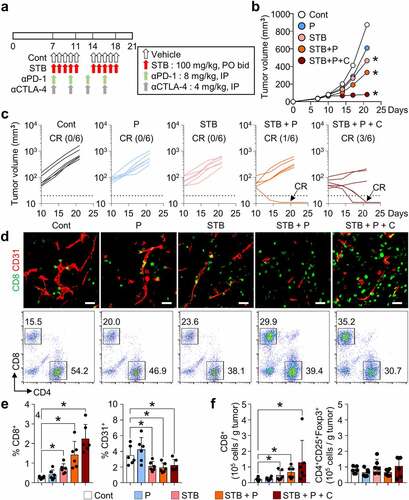
Because STB treatment upregulated inhibitory immune checkpoints, such as PD-1 and CTLA-4, these checkpoints could serve as a negative regulatory mechanism against STB-induced anti-tumor immunity. Therefore, we treated CT26 tumors with STB in combination with anti-PD-1 and/or anti-CTLA-4 antibodies (). While STB alone exhibited modest suppression of CT26 tumors, dual or triple combination immunotherapy induced stronger suppression of CT26 tumors, inducing complete regression (CR) (). Moreover, tumors treated with combination immunotherapy of STB and ICIs showed robust CD8+ T cell infiltration, while reducing the tumor vascular density (). Flow cytometry analysis showed consistent results with increased intratumoral CD8+ T cell percentage in mice treated with STB-based combination immunotherapy compared with control mice (). Overall, combining STB with anti-PD-1 and/or anti-CTLA-4 antibodies could potentiate the immunotherapeutic efficacy of STB by further augmenting T-cell-mediated immunity within TME.
Figure 6. STB synergizes with immune checkpoint inhibitors (ICIs) to enhance cancer immunity and suppress tumor growth. Mice were subcutaneously implanted with CT26 tumor cells and treated with STB and anti-PD-1 and/or anti-CTLA-4 antibodies. (a) Diagram of the treatment schedule. Arrows indicate treatment. (b, c) Comparison of CT26 tumor growth in mice. The number of tumor-free mice (complete response, CR) is indicated for each group. (d, e) Representative images (d) and comparisons (e) of intratumoral CD8+ T cells and CD31+ tumor blood vessels. (d, f) Representative flow cytometry analysis plot (d) and comparisons (f) of CD8+ T cell and CD4+Foxp3+CD25+ (Treg) in tumor. Values are presented as the mean ±SD. *p < .05 versus control. A one-tailed Student’s t-test (b, e, f) was used. Scale bars, 50 μm
STB-based combination immunotherapy induces durable protective anti-tumor immunity
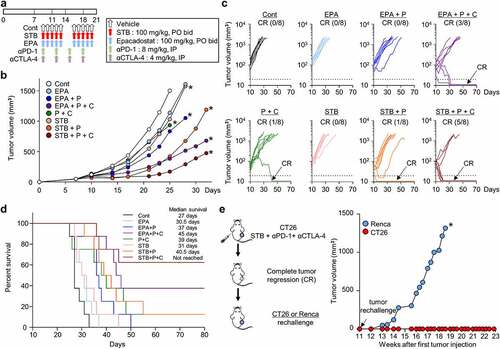
Because STB showed a potent suppression of the Kyn pathway and tumor growth, we then compared the efficacy of STB with epacadostat, the most advanced IDO inhibitor in clinical development, either as a monotherapy or combination therapy with PD-1 and/or CTLA-4 inhibitors (). While STB monotherapy did not differ significantly from epacadostat monotherapy, combination therapy of STB, anti-PD-1, and/or anti-CTLA-4 showed better tumor control and CR rate when compared with epacadostat-based combination therapy (). Moreover, STB-based triple combination immunotherapy showed superior overall survival, in which over 60% of treated animals survived without recurrence compared with other groups (). Finally, when mice that experienced CR after STB-based combination therapy were rechallenged with CT26 or Renca tumor cells, they were completely immune to CT26 tumors, but not to Renca tumors, indicating tumor-specific protective immunity (). Overall, we demonstrated that STB in combination with immune checkpoint blockade was more efficient than epacadostat-based combinations, inducing more durable and protective anti-tumor immunity.
Figure 7. STB in combination with ICIs was more efficient than epacadostat-based combinations, inducing more durable and protective anti-tumor immunity. Mice were subcutaneously implanted with CT26 tumor cells and treated with STB, epacadostat, and anti-PD-1 and/or anti-CTLA-4 antibodies. (a) Diagram of the treatment schedule. Arrows indicate treatment. (b, c) Comparison of CT26 tumor growth in mice. Mean (b) and individual (c) tumor growth curves over time. The number of tumor-free mice (CR) is indicated for each group. (d) Kaplan-Meier plot for overall survival. (e) Comparison of tumor growth after injection of CT26 or Renca tumor cells into mice with complete tumor regression. Values are presented as the mean ±SD. *p < .05 versus control. Two-tailed Student’s t-test (b, e) and log-lank test (d) were used
Discussion
While ICIs have revolutionized the treatment paradigm of advanced cancers, many preclinical and clinical studies have suggested that the efficacy of immunotherapy is hampered by immunosuppressive TME, which impairs T cell effector function and even induces T cell death.Citation40–46 Kyn is a major suppressor of T cell immunity in TME and it is produced via conversion of Trp by two major enzymes, IDO and TDO.Citation17,Citation47
Here, we screened a novel small molecule inhibitor of the Kyn pathway from a chemical library using our deep learning model for IDO and TDO inhibition. Despite the shared role in the Kyn pathway, the protein structures are significantly different between IDO and TDO.Citation48,Citation49 Moreover, structural flexibility of the IDO active site also poses major challenges in obtaining reliable binding poses necessary for structure-based virtual screening.Citation50 In addition, the presence of a heme iron at the active site of IDO and TDO also makes the docking studies difficult.Citation50 Previous studies have employed molecular docking, which led to identification of small molecule inhibitors which showed high specificity toward IDO over TDO.Citation51 In the present study, we chose to employ a ligand-based screening approach when designing the deep learning model to overcome the difficulties accompanying structure-based identification of IDO and TDO dual inhibitors. Our lead compound, STB, suppressed both IDO and TDO and demonstrated a potent suppression of Kyn synthesis in vitro and in vivo. STB accumulated and activated tumor-infiltrating CD8+ T cells, thereby inducing a strong T-cell-mediated immunity within TME. These STB-activated CD8+ T cells upregulated granzyme B and induced extensive tumor cell death within TME.
Previously, epacadostat was developed as a highly potent and selective inhibitor of IDO in preclinical studies.Citation10,Citation31,Citation33 However, it failed to demonstrate an overall survival benefit in combination with pembrolizumab in the phase III ECHO trial in patients with melanoma.Citation34–36 This pivotal failure raised skepticism about single IDO blockade in cancer treatment and triggered further research to unveil the in-depth resistance mechanisms of IDO inhibition. First, IDO inhibition alone cannot sufficiently suppress Kyn synthesis because TDO has a redundant function in Kyn synthesis even in the absence of IDO activity.Citation17,Citation52–54 Moreover, within TME, IDO enzymatic activity is sustained via an autocrine AhR-IL-6-STAT3 signaling axis.Citation13,Citation55 While epacadostat suppresses IDO activity, it is also known to activate AhR, thereby inducing AhR-mediated reactivation of the Kyn signaling pathway. Therefore, epacadostat may not be sufficient to disrupt this vicious loop and induce a durable suppression of IDO activity within TME.
STB remodeled the TME in a different manner from epacadostat. First, STB suppressed Kyn pathway by targeting both IDO and TDO. Therefore, it is effective in tumors that simultaneously express IDO and TDO as well as in those that only express IDO. Next, it inhibited IL-6 and Stat3 expression in tumor-bearing mice, thereby disrupting the immunosuppressive AhR-IL-6-STAT3 circuit at multiple levels, which improved the control of the Kyn pathway compared with epacadostat. Moreover, STB enhanced innate immunity by regulating not only DCs but also NK cells. STB also activated CD8 T cells more strongly than epacadostat. Finally, STB also suppressed Kyn-driven aberrant angiogenesis within the TME. Accordingly, STB-based combination immunotherapy showed deeper and more durable response and consequently improved overall survival compared with epacadostat-based combination immunotherapy in tumor-bearing mice.
In the present study, in addition to the efficacy evaluation, we also identified STB-related adverse events. Continuous STB administration induced asthenia and weight loss in tumor-bearing mice. These toxicities are presumed to be immune-mediated because they were alleviated upon CD8+ T cell depletion. These immune-related adverse events were reversible and all mice fully recovered after adjusting the drug administration schedule (5 days on and 2 days off). Therefore, optimized scheduling will be critical to maintain therapeutic efficacy and tolerability of STB in future clinical development.
In conclusion, we rationally developed a potent inhibitor of the Kyn pathway, STB-C017, which can activate T-cell-mediated immunity and potentiate the efficacy of ICIs. The clinical development of this agent is expected to provide an effective strategy to overcome immunosuppressive TME.
List of abbreviations
CBA Cytometric Bead Array
CNN Convolution neural network
CR Complete regression
ICI Immune checkpoint inhibitors
KCLB Korean Cell Line Bank
MDSC Myeloid-derived suppressor cell
LPS Lipopolysaccharide
Author contributions
JHK, WSL, HJC, and CK were responsible for the study concept and design. JHK, WSL, HJL, HY, SJL, SJK, HJC, and CK conducted the experiments. JHK, WSL, HJY, HY, SJL, SJ, HJY, JJ, JC, BK, HJC, and CK performed data analysis. JHK, WSL, HJY, HJC, and CK generated the figures and wrote and reviewed the manuscript. CK and HJC supervised the study, obtained funding, and drafted the manuscript. All authors read and approved the final manuscript.
Ethics approval and consent to participate
This study was approved by the Institutional Animal Care and Use Committee of CHA University (#2000174).
Availability of Data and Materials
The datasets used and/or analyzed during the current study are available from the corresponding author on reasonable request.
Supplemental Material
Download ()Disclosure statement
No potential conflicts of interest were disclosed.
Supplementary material
Supplemental data for this article can be accessed on the publisher’s website
Additional information
Funding
References
- Ribas A, Wolchok JD. Cancer immunotherapy using checkpoint blockade. Science. 2018;359(6382):1350–14. doi:10.1126/science.aar4060.
- Gajewski TF. The Next Hurdle in Cancer Immunotherapy: overcoming the Non-T-Cell-Inflamed Tumor Microenvironment. Semin. Oncol. 2015;42(4):663–671. doi:10.1053/j.seminoncol.2015.05.011.
- Sharma P, Hu-Lieskovan S, Wargo JA, Ribas A. Primary, Adaptive, and Acquired Resistance to Cancer Immunotherapy. Cell. 2017;168(4):707–723. doi:10.1016/j.cell.2017.01.017.
- Lau J, Cheung J, Navarro A, Lianoglou S, Haley B, Totpal K, Sanders L, Koeppen H, Caplazi P, McBridee J, et al. Tumour and host cell PD-L1 is required to mediate suppression of anti-tumour immunity in mice. Nat. Commun 2017;8:14572. doi:10.1038/ncomms14572.
- Jung J, Kim HY, Kim D-G, Park SY, Ko AR, Han J-Y, Kim HT, Lee JS, Lee Y. Sequential Treatment with an Immune Checkpoint Inhibitor Followed by a Small-Molecule Targeted Agent Increases Drug-Induced Pneumonitis. Cancer Res. Treat. 2021;53(1):77–86. doi:10.4143/crt.2020.543.
- Gajewski TF, Schreiber H, Fu YX. Innate and adaptive immune cells in the tumor microenvironment. Nat. Immunol. 2013;14(10):1014–1022. doi:10.1038/ni.2703.
- Lee WS, Yang H, Chon HJ, Kim C. Combination of anti-angiogenic therapy and immune checkpoint blockade normalizes vascular-immune crosstalk to potentiate cancer immunity. Exp. Mol. Med. 2020;52(9):1475–1485. doi:10.1038/s12276-020-00500-y.
- Lee YS, Lee WS, Kim CW, Lee SJ, Yang H, Kong SJ, Ning J, Yang KM, Kang B, Kim WR, et al. Oncolytic vaccinia virus reinvigorates peritoneal immunity and cooperates with immune checkpoint inhibitor to suppress peritoneal carcinomatosis in colon cancer. J. Immunother. Cancer. 2020;8(2):e000857. doi:10.1136/jitc-2020-000857.
- Qian F, Villella J, Wallace PK, Mhawech-Fauceglia P, Tario JD Jr., Andrews C, Matsuzaki J, Valmori D, Ayyoub M, Frederick PJ, et al. Efficacy of levo-1-methyl tryptophan and dextro-1-methyl tryptophan in reversing indoleamine-2,3-dioxygenase-mediated arrest of T-cell proliferation in human epithelial ovarian cancer. Cancer Res. 2009;69(13):5498–5504. doi:10.1158/0008-5472.
- Koblish HK, Hansbury MJ, Bowman KJ, Yang G, Neilan CL, Haley PJ, Burn TC, Waeltz P, Sparks RB, Yue EW, et al. Hydroxyamidine inhibitors of indoleamine-2,3-dioxygenase potently suppress systemic tryptophan catabolism and the growth of IDO-expressing tumors. Mol. Cancer Ther. 2010;9(2):489–498. doi:10.1158/1535-7163.MCT-09-0628.
- Holmgaard RB, Zamarin D, Li Y, Gasmi B, Munn DH, Allison JP, Merghoub T, Wolchok JD. Tumor-Expressed IDO Recruits and Activates MDSCs in a Treg-Dependent Manner. Cell Rep. 2015;13(2):412–424. doi:10.1016/j.celrep.2015.08.077.
- Li F, Zhao Y, Wei L, Li S, Liu J. Tumor-infiltrating Treg, MDSC, and IDO expression associated with outcomes of neoadjuvant chemotherapy of breast cancer. Cancer Biol. Ther. 2018;19(8):695–705. doi:10.1080/15384047.2018.1450116.
- Litzenburger UM, Opitz CA, Sahm F, Rauschenbach KJ, Trump S, Winter M, Ott M, Ochs K, Lutz C, Liu X, et al. Constitutive IDO expression in human cancer is sustained by an autocrine signaling loop involving IL-6, STAT3 and the AHR. Oncotarget. 2014;5(4):1038–1051. doi:10.18632/oncotarget.1637.
- Wei L, Zhu S, Li M, Li F, Wei F, Liu J, Ren X. High Indoleamine 2,3-Dioxygenase Is Correlated With Microvessel Density and Worse Prognosis in Breast Cancer. Front. Immunol 2018:9:724. doi:10.3389/fimmu.2018.00724.
- Li Y, Tredget EE, Ghaffari A, Lin X, Kilani RT, Ghahary A. Local expression of indoleamine 2,3-dioxygenase protects engraftment of xenogeneic skin substitute. J. Invest. Dermatol. 2006;126(1):128–136. doi:10.1038/sj.jid.5700022.
- Nonaka H, Saga Y, Fujiwara H, Akimoto H, Yamada A, Kagawa S, Takei Y, Machida S, Takikawa O, Suzuki M. Indoleamine 2,3-dioxygenase promotes peritoneal dissemination of ovarian cancer through inhibition of natural killercell function and angiogenesis promotion. Int. J. Oncol. 2011;38(1):113–120. doi:10.3892/ijo_00000830.
- Klar R, Michel S, Schell M, Hinterwimmer L, Zippelius A, Jaschinski F. A highly efficient modality to block the degradation of tryptophan for cancer immunotherapy: locked nucleic acid-modified antisense oligonucleotides to inhibit human indoleamine 2,3-dioxygenase 1/tryptophan 2,3-dioxygenase expression. Cancer Immunol. Immunother. 2020;69(1):57–67. doi:10.1007/s00262-019-02438-1.
- Bishnupuri KS, Alvarado DM, Khouri AN, Shabsovich M, Chen B, Dieckgraefe BK, Ciorba MA. IDO1 and Kynurenine Pathway Metabolites Activate PI3K-Akt Signaling in the Neoplastic Colon Epithelium to Promote Cancer Cell Proliferation and Inhibit Apoptosis. Cancer Res. 2019;79(6):1138–1150. doi:10.1158/0008-5472.CAN-18-0668.
- Labadie BW, Bao R, Luke JJ. Reimagining IDO Pathway Inhibition in Cancer Immunotherapy via Downstream Focus on the Tryptophan-Kynurenine-Aryl Hydrocarbon Axis. Clin. Cancer Res. 2019;25(5):1462–1471. doi:10.1158/1078-0432.CCR-18-2882.
- Liu Q, Hua S, Wang X, Chen F, Gou S. The introduction of immunosuppressor (TDO inhibitor) significantly improved the efficacy of irinotecan in treating hepatocellular carcinoma. Cancer Immunol. Immunother. 2021;70(2):497–508. doi:10.1007/s00262-020-02697-3.
- Hwu P, Du MX, Lapointe R, Do M, Taylor MW, Young HA. Indoleamine 2,3-dioxygenase production by human dendritic cells results in the inhibition of T cell proliferation. J. Immunol. 2000;164(7):3596–3599. doi:10.4049/jimmunol.164.7.3596.
- Riess C, Schneider B, Kehnscherper H, Gesche J, Irmscher N, Shokraie F, Classen CF, Wirthgen E, Domanska G, Zimpfer A, et al. Activation of the Kynurenine Pathway in Human Malignancies Can Be Suppressed by the Cyclin-Dependent Kinase Inhibitor Dinaciclib. Front. Immunol. 2020;11:55. eCollection 2020. doi:10.3389/fimmu.2020.00055.
- Bekki S, Hashimoto S, Yamasaki K, Komori A, Abiru S, Nagaoka S, Saeki A, Suehiro T, Kugiyama Y, Beppu A, et al. Serum kynurenine levels are a novel biomarker to predict the prognosis of patients with hepatocellular carcinoma. PLoS One. 2020;15(10):e0241002. doi:10.1371/journal.pone.0241002.
- Opitz CA, Litzenburger UM, Sahm F, Ott M, Tritschler I, Trump S, Schumacher T, Jestaedt L, Schrenk D, Weller M, et al. An endogenous tumour-promoting ligand of the human aryl hydrocarbon receptor. Nature. 2011;478(7368):197–203. doi:10.1038/nature10491.
- Li H, Ning S, Ghandi M, Kryukov GV, Gopal S, Deik A, Souza A, Pierce K, Keskula P, Hernandez D, et al. The landscape of cancer cell line metabolism. Nat. Med. 2019;25(5):850–860. doi:10.1038/s41591-019-0404-8.
- Ferns DM, Kema IP, Buist MR, Nijman HW, Kenter GG, Jordanova ES. Indoleamine-2,3-dioxygenase (IDO) metabolic activity is detrimental for cervical cancer patient survival. Oncoimmunology. 2015;4(2):e981457. doi:10.4161/2162402X.2014.981457.
- Botticelli A, Cerbelli B, Lionetto L, Zizzari I, Salati M, Pisano A, Federica M, Simmaco M, Nuti M, Marchetti P. Can IDO activity predict primary resistance to anti-PD-1 treatment in NSCLC? J. Transl. Med. 2018;16(1):219. doi:10.1186/s12967-018-1595-3.
- Liu Y, Liang X, Dong W, Fang Y, Lv J, Zhang T, Fiskesund R, Xie J, Liu J, Yin X, et al. Tumor-Repopulating Cells Induce PD-1 Expression in CD8(+) T Cells by Transferring Kynurenine and AhR Activation. Cancer Cell. 2018;33(3):480–94 e7. doi:10.1016/j.ccell.2018.02.005.
- Wainwright DA, Chang AL, Dey M, Balyasnikova IV, Kim CK, Tobias A, Cheng Y, Kim JW, Qiao J, Zhang L, et al. Durable therapeutic efficacy utilizing combinatorial blockade against IDO, CTLA-4, and PD-L1 in mice with brain tumors. Clin. Cancer Res. 2014;20(20):5290–5301. doi:10.1158/1078-0432.CCR-14-0514.
- Spranger S, Koblish HK, Horton B, Scherle PA, Newton R, Gajewski TF. Mechanism of tumor rejection with doublets of CTLA-4, PD-1/PD-L1, or IDO blockade involves restored IL-2 production and proliferation of CD8(+) T cells directly within the tumor microenvironment. J. Immunother. Cancer 2014:2:3. doi:10.1186/2051-1426-2-3.
- Yue EW, Sparks R, Polam P, Modi D, Douty B, Wayland B, Glass B, Takvorian A, Glenn J, Zhu W, et al. INCB24360 (Epacadostat), a Highly Potent and Selective Indoleamine-2,3-dioxygenase 1 (IDO1) Inhibitor for Immuno-oncology. ACS Med. Chem. Lett. 2017;8(5):486–491. doi:10.1021/acsmedchemlett.6b00391.
- Campesato LF, Budhu S, Tchaicha J, Weng CH, Gigoux M, Cohen IJ, Redmond D, Mangarin L, Pourpe S, Liu C, et al. Blockade of the AHR restricts a Treg-macrophage suppressive axis induced by L-Kynurenine. Nat. Commun. 2020;11(1):4011. doi:10.1038/s41467-020-17750-z.
- Liu X, Shin N, Koblish HK, Yang G, Wang Q, Wang K, Leffet L, Hansbury MJ, Thomas B, Rupar M, et al. Selective inhibition of IDO1 effectively regulates mediators of antitumor immunity. Blood. 2010;115(17):3520–3530. doi:10.1182/blood-2009-09-246124.
- Mullard A. IDO takes a blow. Nat. Rev. Drug Discov. 2018;17(5):307. doi:10.1038/nrd.2018.67.
- Muller AJ, Manfredi MG, Zakharia Y, Prendergast GC. Inhibiting IDO pathways to treat cancer: lessons from the ECHO-301 trial and beyond. Semin. Immunopathol. 2019;41(1):41–48. doi:10.1007/s00281-018-0702-0.
- Long GV, Dummer R, Hamid O, Gajewski TF, Caglevic C, Dalle S, Arance A, Carlino MS, Grob JJ, Kim TM, et al. Epacadostat plus pembrolizumab versus placebo plus pembrolizumab in patients with unresectable or metastatic melanoma (ECHO-301/KEYNOTE-252): a phase 3, randomised, double-blind study. Lancet Oncol. 2019;20(8):1083–1097. doi:10.1016/S1470-2045(19)30274-8.
- Puccetti P, Fallarino F, Italiano A, Soubeyran I, MacGrogan G, Debled M, Velasco V, Bodet D, Eimer S, Veldhoen M, et al. Accumulation of an endogenous tryptophan-derived metabolite in colorectal and breast cancers. PLoS One. 2015;10(4):e0122046. doi:10.1371/journal.pone.0122046.
- Pilotte L, Larrieu P, Stroobant V, Colau D, Dolusic E, Frederick R, De Plaen E, Uyttenhove C, Wouters J, Masereel B, et al. Reversal of tumoral immune resistance by inhibition of tryptophan 2,3-dioxygenase. Proc. Natl. Acad. Sci. U. S. A. 2012;109(7):2497–2502. doi:10.1073/pnas.1113873109.
- Yang H, Lee WS, Kong SJ, Kim CG, Kim JH, Chang SK, Kim S, Kim G, Chon HJ, Kim C. STING activation reprograms tumor vasculatures and synergizes with VEGFR2 blockade. J. Clin. Invest. 2019;129(10):4350–4364. doi:10.1172/JCI125413.
- Topalian SL, Drake CG, Pardoll DM. Immune checkpoint blockade: a common denominator approach to cancer therapy. Cancer Cell. 2015;27(4):450–461. doi:10.1016/j.ccell.2015.03.001.
- Chon HJ, Lee WS, Yang H, Kong SJ, Lee NK, Moon ES, Choi J, Han EC, Kim JH, Ahn JB, et al. Tumor Microenvironment Remodeling by Intratumoral Oncolytic Vaccinia Virus Enhances the Efficacy of Immune-Checkpoint Blockade. Clin. Cancer Res. 2019;25(5):1612–1623. doi:10.1158/1078-0432.CCR-18-1932.
- Kim CG, Kim C, Yoon SE, Kim KH, Choi SJ, Kang B, Kim HR, Park S-H, Shin E-C, Kim -Y-Y, et al. Hyperprogressive disease during PD-1 blockade in patients with advanced hepatocellular carcinoma. J. Hepatol. 2021;74(2):350–359. doi:10.1016/j.jhep.2020.08.010.
- Chon HJ, Kim H, Noh JH, Yang H, Lee WS, Kong SJ, Lee SJ, Lee YS, Kim WR, Kim JH, et al. STING signaling is a potential immunotherapeutic target in colorectal cancer. J. Cancer. 2019;10(20):4932–4938. doi:10.7150/jca.32806.
- Oh C-M, Chon HJ, Kim C. Combination Immunotherapy Using Oncolytic Virus for the Treatment of Advanced Solid Tumors. Int. J. Mol. Sci. 2020;21(20):7743. doi:10.3390/ijms21207743.
- Go E-J, Yang H, Chon HJ, Yang D, Ryu W, Kim D-H, Han DK, Kim C, Park W. Combination of irreversible electroporation and sting agonist for effective cancer immunotherapy. Cancers (Basel). 2020;12(11):3123. doi:10.3390/cancers12113123.
- Park HS, Kim YM, Kim S, Lee WS, Kong SJ, Yang H, Kang B, Cheon J, Shin S-J, Kim C, et al. High endothelial venule is a surrogate biomarker for T-cell inflamed tumor microenvironment and prognosis in gastric cancer. J. Immunother. Cancer. 2021;9(10):e003353. doi:10.1136/jitc-2021-003353.
- Shi J, Chen C, Ju R, Wang Q, Li J, Guo L, Ye C, Zhang D. Carboxyamidotriazole combined with IDO1-Kyn-AhR pathway inhibitors profoundly enhances cancer immunotherapy. J. Immunother. Cancer. 2019;7(1):246. doi:10.1186/s40425-019-0725-7.
- Meininger D, Zalameda L, Liu Y, Stepan LP, Borges L, McCarter JD, Sutherland CL. Purification and kinetic characterization of human indoleamine 2,3-dioxygenases 1 and 2 (IDO1 and IDO2) and discovery of selective IDO1 inhibitors. Biochim. Biophys. Acta. 2011;1814(12):1947–1954. doi:10.1016/j.bbapap.2011.07.023.
- Zhang Y, Kang SA, Mukherjee T, Bale S, Crane BR, Begley TP, Ealick SE. Crystal structure and mechanism of tryptophan 2,3-dioxygenase, a heme enzyme involved in tryptophan catabolism and in quinolinate biosynthesis. Biochemistry. 2007;46(1):145–155. doi:10.1021/bi0620095.
- Rohrig UF, Majjigapu SR, Vogel P, Zoete V, Michielin O. Challenges in the Discovery of Indoleamine 2,3-Dioxygenase 1 (IDO1) Inhibitors. J. Med. Chem. 2015;58(24):9421–9437. doi:10.1021/acs.jmedchem.5b00326.
- Zhang G, Xing J, Wang Y, Wang L, Ye Y, Lu D, Zhao J, Luo X, Zheng M, Yan S. Discovery of Novel Inhibitors of Indoleamine 2,3-Dioxygenase 1 Through Structure-Based Virtual Screening. Front. Pharmacol 2018:9:277. doi:10.3389/fphar.2018.00277.
- Uyttenhove C, Pilotte L, Theate I, Stroobant V, Colau D, Parmentier N, Boon T, Van Den Eynde BJ. Evidence for a tumoral immune resistance mechanism based on tryptophan degradation by indoleamine 2,3-dioxygenase. Nat. Med. 2003;9(10):1269–1274. doi:10.1038/nm934.
- Balog A, Lin TA, Maley D, Gullo-Brown J, Kandoussi EH, Zeng J, Hunt JT. Preclinical Characterization of Linrodostat Mesylate, a Novel, Potent, and Selective Oral Indoleamine 2,3-Dioxygenase 1 Inhibitor. Mol. Cancer Ther. 2021;20(3):467–476. doi:10.1158/1535-7163.MCT-20-0251.
- Schramme F, Crosignani S, Frederix K, Hoffmann D, Pilotte L, Stroobant V, Preillon J, Driessens G, Van Den Eynde BJ. Inhibition of Tryptophan-Dioxygenase Activity Increases the Antitumor Efficacy of Immune Checkpoint Inhibitors. Cancer Immunol. Res. 2020;8(1):32–45. doi:10.1158/2326-6066.CIR-19-0041.
- Jonescheit H, Oberg HH, Gonnermann D, Hermes M, Sulaj V, Peters C, Kabelitz D, Wesch D. Influence of Indoleamine-2,3-Dioxygenase and Its Metabolite Kynurenine on gammadelta T Cell Cytotoxicity against Ductal Pancreatic Adenocarcinoma Cells. Cells. 2020;9(5):1140. doi:10.3390/cells9051140.