
ABSTRACT
CTLA4-CD28 gene fusion has been reported to occur in diverse types of T cell lymphoma. The fusion event is expected to convert inhibitory signals to activating signals and promote proliferation and potentially transformation of T cells. To test the function of the CTLA4-CD28 fusion gene in vivo, we generated a murine model that expresses the gene in a T cell-specific manner. The transgenic mice have shorter life spans and display inflammatory responses including lymphadenopathy and splenomegaly. T cells in turn show higher levels of activation and infiltrate various organs including the lung and skin. T cells, in particular CD4+ helper T cells, were also readily transplantable to immunocompromised mice. Transcriptomic profiling revealed that the gene expression pattern in CD4 + T cells closely resembles that of adult T cell leukemia/lymphoma (ATLL) and that of angioimmunoblastic T cell lymphoma (AITL) tissues. Consistently, we detected supernumerary FOXP3+ cells and PD-1+ cells in transgenic and transplanted mice. This is the first report demonstrating the transforming activity of the CTLA4-CD28 fusion gene in vivo, and this murine model should be useful in dissecting the molecular events downstream to this mutation.
KEYWORDS:
Introduction
CTLA4 and CD28 are well-known cell surface transmembrane proteins expressed in T cells.Citation1 They respectively mediate inhibitory and activating signals for T cells. The two opposing signals are critical for tight regulation of T cell activities. Insufficiency in T cell activation can result in infections and malignancies, whereas over-activation can lead to autoimmunity. Animal models generated by gene targeting of CTLA4 and CD28 loci have provided consistent phenotypes. Specifically, CTLA4-knockout mice display a massive and rapid lymphoproliferation and organ destruction, and CD28 null mice show reduced helper T cell activity, low serum immunoglobulin levels and lack of response to lectin stimulation.Citation2–4
Remarkably, cases of the fusion of these two genes have been reported in various types of T cell lymphoma. Yoo and coworkers reported that CTLA4-CD28 fusion is found among various types of lymphoma in variable rates, which included angioimmunoblastic T cell lymphoma (AITL), peripheral T cell lymphoma not otherwise specified and extranodal NK/T cell lymphoma.Citation5 Adult T cell leukemia/lymphoma (ATLL) is a distinct type of lymphoma that is induced by infection with human T cell leukemia virus type 1 (HTLV-1) in which CTLA4-CD28 fusion has also been reported.Citation6 Of note, Yoshida and coworkers recently reported a high incidence (37.5%) of CTLA4-CD28 fusion among young (<50 years) ATLL patients. They appear to constitute a separate group from the typical patients who are over 70 years old at the time of ATLL presentation.Citation7
The resulting fusion gene encodes a protein featuring the extracellular domain of CTLA4 and intracellular domain of CD28. It has been proposed that this protein thus converts the inhibitory signals into activating signals. Consistently, ectopic expression of the CTLA4-CD28 fusion gene in various T cell lymphoma cells including Jurkat and H9 cells led to enhanced proliferation in turn raising a strong possibility that this fusion gene could be a driver mutation for various types of T cell lymphoma.Citation5 Clearly, an animal model carrying the fusion gene and displaying relevant phenotypes would be of great value not only for demonstrating its function in promoting T cell proliferation but also in dissecting molecular mechanisms of lymphomagenesis mediated by the fusion gene. Here, we describe a novel mouse model that expresses the CTLA4-CD28 fusion gene in a T cell-specific manner under the control of the murine lck distal promoter.Citation8,Citation9 The mouse displays phenotypes consistent with T cell lymphoma originating from CD4+ population. Interestingly, gene expression profiling indicates that the resultant disease closely approximates ATLL as well as AITL. Consistently, we show that two distinct populations of T cells, one being FOXP3+ and the other PD-1+, were expanded in number and could be transplanted to immunocompromised mice.
Materials and Methods
Generation of transgenic mouse
The protocol for this study was approved by the Institutional Animal Care and Use Committee (IACUC) of Ewha Womans University. The murine lck distal promoter region from −3037 to +41 was PCR-amplified from the pw120 plasmid.Citation8,Citation9 This was ligated to a DNA fragment containing CTLA4-CD28 fusion gene-coding sequence with the HA epitope at the C-terminus. Further details of the cloning procedure are available upon request. Pronuclear injection was performed on FVB/NJ mice eggs, and a transgenic line was established based on genotyping results. The oligonucleotide primers used for confirmation of transgene and genotyping were the primers lck-F, lck-R and ctla4-R whose sequences are 5ʹ-CCTCCCTCAGTATGAGTAGAAGC-3ʹ, 5ʹ-CCGTCGTAGTCACCACCTG-3ʹ and 5ʹ-GCTTTGCAGAAGACAGGGATG-3ʹ respectively.
Isolation of lymphocytes, RNA preparation and RT-PCR
Lymphocytes were isolated from the thymus and lymph nodes. After staining with antibodies for CD4 (clone GK1.5, Cat. 552051, BD Biosciences, San Jose, CA) and CD8 (clone 53–6.7, Cat. 553031, BD Biosciences), cells were sorted using BD FACSAria (BD Biosciences). RNA was extracted using Trizol reagent, and cDNA was synthesized using GoScript Reverse Transcriptase PCR kit (Promega, Madison, WI). The oligonucleotide primers used to detect transgene expression were 5ʹ-GAGCAAAATGGTGAGGAGTAAG-3ʹ and 5ʹ-AGCGTAGTCTGGGACGTCG-3ʹ. For quantitative real-time PCR, SYBR select master mix (Cat. 4472908, Applied Biosystems, Foster City, CA) was used in combination with CFX96 Touch Real-Time PCR Detection System (BioRad, Hercules, CA).
Examination of T cell clonality
T cell receptor (TCR) β-chain diversity was examined by nested 5ʹ RACE PCR. Total RNA was isolated from lymph nodes of 12-month-old mice using Trizol reagent. RNA was processed for reverse-transcription using GeneRacer kit (Invitrogen, Waltham, MA) according to the manufacturer’s protocol. TCR β-chain was amplified by GeneRacer 5ʹ oligonucleotide primer (5ʹ-CGACTGGAGCACGAGGACACTGA-3ʹ) and an oligonucleotide primer (5ʹ-GTGGAGCTGAGCTGGTGGG TGAATGG-3ʹ) from the constant region of β-chain. Second amplification was performed with GeneRacer 5ʹ nested oli-gonucleotide primer (5ʹ-GGACACTGACATGGACTGAAG GAGTA-3ʹ) and a fluorescent nested oligonucleotide primer (5ʹ- CTTCCCTGACCACGTGGAGCTGAGC-3ʹ), also from the constant region of β-chain. Final PCR products were analyzed by capillary electrophoresis using ABI PRISM 3730XL DNA analyzer and Gene Scan Version 1.2 software (Applied Biosystems, Foster City, CA).
Immunoblotting and immunoprecipitation
Tissues isolated from 2-week-old transgenic mice were lysed in RIPA buffer (50 mM Tris-HCl pH 8.0, 150 mM NaCl, 2 mM EDTA, 1% Nonidet P-40, 0.5% sodium deoxycholate, 0.1% SDS and 10 mM NaF) containing protease inhibitors (Sigma-Aldrich, St. Louis, MO). Anti-HA (Cat. 2117, Cell Signaling Technology, Beverly, MA), anti-AKT (Cat. 9272, Cell Signaling Technology), anti-p-AKT (Cat. 4060, Cell Signaling Technology), anti-ERK (Cat. 9102, Cell Signaling Technology), anti-p-ERK (Cat. 9101, Cell Signaling Technology) and anti-Tubulin (Cat. SAB3501072, Sigma-Aldrich) antibodies were used to detect proteins, which were visualized using an enhanced chemiluminescence detection kit (Amersham-Pharmacia Biotech, Piscataway, NJ). For immunoprecipitation, spleen lysate from a transgenic mouse was used. After preclearing for 4 hours at 4°C by protein A/G, the supernatant was incubated with anti-HA antibody or control IgG overnight at 4°C and subsequently for 2 hours with protein A/G beads. The beads were washed with RIPA buffer and boiled in SDS buffer. The supernatants were used for immunoblotting with anti-CTLA4 antibody (Cat. ab134090, Abcam, Cambridge, MA) and anti-HA antibody.
Histology and immunohistochemistry
Lymph nodes were fixed in 10% neutral-buffered formalin and embedded in paraffin. Tissue sections were typically 4-μm thick and were examined after staining with hematoxylin and eosin (H&E). For immunohistochemistry, the sections were first boiled in a citrate-based solution to retrieve antigens and subsequently quenched in 3% hydrogen peroxide. The antibodies used included anti-FOXP3 (Cat. MAB8214, R&D systems, Minneapolis, MN), anti-PD-1 (Cat. AF1021, R&D systems), anti-CD3 (Cat. ab5690, Abcam, Cambridge, MA), anti-PAX5 (Cat. sc-1974, Santa Cruz Biotechnology, Dallas, TX), anti-CD4 (Cat. 14–0042, eBioscience, San Diego, CA), anti-CD8 (Cat. 14–0081, eBioscience), anti-CD21 (Cat. Ab75985, Abcam), MECA79 (Cat. 53–6036-80, eBioscience) and anti-HA (Cat. 3724, Cell Signaling Technology) antibodies. After biotinylated secondary antibody treatment, visualization was carried out with Vectastain ABC-HRP kit (Vector Laboratories, Burlingame, CA) or ABC-AP kit (Vector Laboratories) in combination with DAB or with VectorRed (Vector Laboratories) respectively.
Flow cytometry
For flow cytometric analyses of T cell and B cell populations, single cells were first prepared from affected lymph nodes. Briefly, after grinding with sieve and lysing red blood cells, single cell suspensions were incubated with Zombie dye (Cat. 423101, BioLegend, San Diego, CA) to exclude dead cells. After an Fc block (Cat. 553142, BD Biosciences) step, surface antigens were stained for 1 hr at 4°C. In order to stain for Treg cells, surface antibodies were applied first, and the cells were subsequently fixed, permeabilized and stained for FOXP3. Treg and Tfh cells were gated following previous reported procedures.Citation10,Citation11 Antibodies for CD3 (Clone 17A2, Cat. 555276, BD Biosciences), CD19 (clone 1D3, Cat. 557398, BD Biosciences), CD25 (Clone 7D4, Cat. 553071, BD Biosciences), CD44 (Clone IM7, Cat. 561859, BD Biosciences), CD69 (Clone H1.2F3, Cat. 557392, BD Biosciences), CD62L (Clone MEL-14, Cat. 561917, BD Biosciences), FOXP3 (Clone MF23, Cat. 562996, BD Biosciences), CD4 (clone GK1.5, Cat. 552051, BD Biosciences), B220 (clone RA3-6B2, Cat. 562290, BD Bioscience), CD11b (clone M1/70, Cat. 563015, BD Biosciences), PD-1 (clone J43, Cat. 562584, BD Biosciences) and CXCR5 (clone 2G8, Cat. 560615, BD Biosciences) were used. Cells were counted with BD LSRFortessa (BD Biosciences) and analyzed using BD FACSDiva software (BD Biosciences) and FlowJo software (FlowJo, Ashland, OR).
Cell transplantation
Typically, 1 × 10⁶ cells from enlarged spleens of transgenic mice were injected to NSG (NOD.Cg-PrkdcscidIl2rgtm1Wjl/SzJ) or FVB/NJ mice via tail vein. Injected cells were either total splenocytes or cells isolated with either CD4 + T cell isolation kit (Cat. 130–104-454, Miltenyi Biotec, Bergisch Gladbach, Germany) or CD8a+ T cell isolation kit (Cat. 130–104-075, Miltenyi). Mice were sacrificed in 2-month post-transplantation, and their spleens were examined by immunohistochemistry and H&E staining.
Transcriptome analysis
RNA was extracted from the isolated CD4 + T cells, and mRNA libraries were prepared using the TruSeq Stranded mRNA Preparation kit (Illumina, San Diego, CA) according to the manufacturer’s instructions. RNA sequencing (RNA-Seq) was performed with Illumina NovaSeq 6000 sequencing platform for 101-mer paired-end reads. Fastx_toolkit was used for trimming adapter sequences and discarding low-quality reads. The reads were mapped to the reference mouse genome (mm10) using STAR alignment program (version 2.6.1d).Citation12 RSEM (version 1.3.3) was used to quantify the transcriptome abundance.Citation13 Transcriptome data of transgenic and wild type mice were fed to Gene Set Enrichment Analysis (GSEA) program (version 4.1)Citation14 to identify the differential biological functions. We calculated the enrichment scores for the Hallmark gene sets of the MSigDB.Citation15 GSEA was also applied to test for the enrichment of Treg gene signatureCitation16 and Tfh gene signature.Citation17The RNA-Seq data have been deposited in the Gene Express Omnibus (GEO) database [GEO: GSE161035].
Clustering and correlation analyses
Transcriptome data of lymphoma patients including ATLL, AITL, PTCL-NOS, ENKTL and anaplastic large-cell lymphoma (ALCL) were collected from the GEO database. Specifically, RNA-Seq data were downloaded from six different studies (SRP243673, SRP029591, SRP099016, SRP039591, SRP049695, and SRP044708), which constituted a collection of 8 ATLL, 9 AITL, 10 PTCL-NOS, 17 ENKTL and 23 ALCL patient samples. Sequencing data were processed with the same pipeline for our mouse transcriptome data except using the human reference genome (hg19). Subsequently, we performed the between-study normalization to remove batch effect using ComBat algorithm in the Bioconductor sva package.Citation18 Correlation analysis of transcriptome data between transgenic mice and human samples was performed using 1,523 differentially expressed genes between transgenic and wild type mice (FDR < 0.05 with DESeq2 software).Citation19 These genes were converted to the human orthologues according to the MGI Vertebrate Homology database.Citation20 Pearson correlation coefficient was calculated for all pairs of mouse and human samples.
Results
Generation of CTLA4-CD28 transgenic mouse
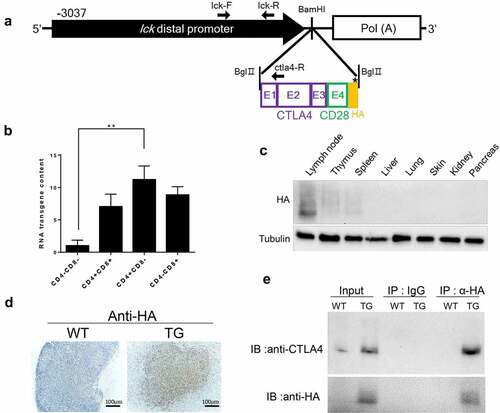
We generated a murine model that expresses human CTLA4-CD28 in a T cell-specific manner, utilizing the distal promoter of mouse lymphocyte-specific protein-tyrosine kinase (lck) gene. The murine lck distal promoter becomes active as thymocytes mature into peripheral T cells and has been used to express candidate oncogenes for induction of T cell lymphoma.Citation8,Citation9 The span of the genomic region used (−3037 to +41) is known to encompass the essential cis-elements for proper expression of a transgene during development and differentiation of T cells. We used this promoter to express the fusion gene, which contains the exons 1, 2 and 3 of human CTLA4 and the exon 4 of human CD28 (). When this fusion gene is translated into a protein, the extracellular domain and transmembrane domain would be from CTLA4 and the intracellular domain from CD28 with the HA tag at the C-terminus. Notably, the transgenic CTLA4-CD28 fusion gene was most highly expressed in CD4+CD8− cells although expression was also seen in CD4−CD8+ and CD4+CD8+ cells as well as at a low level in CD4−CD8− cells (). This is consistent with that transgenic mice expressing the fusion gene more strongly as T cells mature, particularly into CD4+ cells. At the 2-week point, transgenic protein was detected only in lymphoid organs such as thymus, lymph node and spleen (). Transgene expression was confirmed by immunohistochemistry in lymph nodes of transgenic mice but not in the wild type mice (). Co-staining for CD3 and HA epitope indicated that >50% of the T cells expressed the transgene at detectable levels in the lymph node and spleen (Supplemental A, B). We also carried out immunoprecipitation using anti-HA antibody and examined the precipitate by immunoblotting with anti-CTLA4 antibody and confirmed specific expression of HA-tagged CTLA4- containing gene in the spleen of transgenic mice ().
Figure 1. Generation and characterization of CTLA4-CD28 transgenic mice. (a) A schematic representation of the structure of CTLA4-CD28 fusion gene driven by the lck distal promoter. The arrows indicate positions of oligonucleotide primers used for genotyping by PCR. (b) Real-time PCR analysis of the transgene expression. Thymocytes from 2 week-old mice were sorted for indicated populations by staining with anti-CD4 and CD8 (n = 3). (**) represents P-value <0.01 from t-test. (c) Immublotting showing expression of the transgenic protein in lymphoid and non-lymphoid organs of a 2 week-old mouse. (d) Immunostaining of lymph nodes from a wild type (WT) littermate and transgenic (TG) mouse with anti-HA antibody. (e) Immunoblotting (IB) with indicated antibodies following immunoprecipitation (IP) with anti-HA antibody. IgG was used in control immunoprecipitation.
Histopathological and immunological examination of CTLA4-CD28 transgenic mice
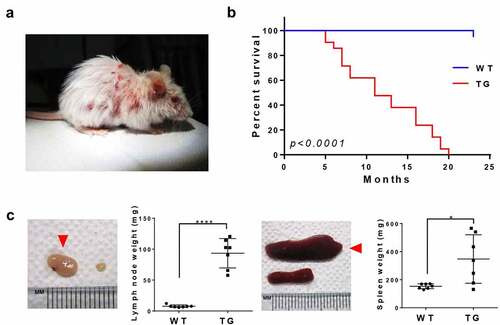
CTLA4-CD28 transgenic mice developed skin lesions by 12 weeks of age (). The average life span of transgenic mice was 12.8 months, which is significantly shorter than that of wild-type mice from littermate groups (). Notably, virtually all transgenic mice developed splenomegaly and lymphadenopathy by this stage. We compared the weight of the largest lymph nodes from transgenic and wild-type mice and found the weight difference of >10-fold (). Spleen also showed significant differences in size and weight ().
Figure 2. Gross pathological phenotypes of CTLA4-CD28 transgenic mice. (a) A 12 week-old CTLA4-CD28 transgenic mouse with typical skin lesions. (b) Kaplan-Meier survival curves of wild-type littermates (n = 19) and CTLA4-CD28 transgenic mice (n = 19). P-value <0.0001 from log-rank test. (c) Lymph node (left) and spleen (right) of TG mice (n = 7; red arrow heads) compared with organs from age-matched WT littermates (n = 7). (****) represents P-value <0.0001, and (*) represents P-value <0.05 from t-test.
We examined the clonality of T cells by amplifying the TCR β chain using 5ʹRACE and nested PCR techniques in combination with GeneScan analysis. In contrast to a highly diverse T cell population present in the wild-type lymph nodes, a far more limited repertoire of TCR was observed in transgenic lymph nodes consistent with oligo-clonality of the T cells (). Given that the fusion gene is expected to activate T cells, we examined activation status of the T cells. The proportions of CD3+ CD25+, CD3+ CD44+ and CD3+ CD69+ cells which represent activated T cells were elevated and that of CD3+ CD62L+ cells which represent naïve T cells was diminished in transgenic mice in comparison with proportions of corresponding cells from wild-type littermates (). B cells, examined by CD19 expression, also showed an increase in proportion among lymph node cells (). We also examined if CTLA4-CD28 activates the CD28 signaling pathway. Consistently, levels of phosphorylated AKT and ERK were increased in CD4+ cells of transgenic mice (Supplemental ). RT-PCR analyses also revealed up-regulation of CTLA4, IFN-γ, IL2 and PDCD1 (Supplemental , c). These changes are consistent with well-established down-stream responses to activation of CD28 signaling as well as with our RNA-Seq data (Supplemental tables 1, 2), which show upregulation of the four genes examined by RT-PCR.Citation21–24
Figure 3. Immunoproliferation in CTLA4-CD28 transgenic mice. (a) Lymph nodes from 2 WT and TG mice were used for examination of TCR β chain diversity. 5ʹRACE PCR amplification of rearranged TCR β chain was followed by Gene Scan analyses. (b) Flow cytometric analyses with pan T cell marker (CD3) in combination with T cell activation markers (CD25, CD44 or CD69) or with a naïve T cell marker (CD62L). CD19 was used as a B cell marker. In the case of T cells, numbers represent mean percentage + SD of double positive cells from three independent experiments. For B cells, numbers represent mean percentage + SD of CD19+ cells from three independent experiments. In all cases, the differences between WT littermates and TG mice were statistically significant (P-value < 0.05). (c) H&E and immunostaining for CD3, CD4, CD8 and PAX5 in the lymph node and spleen of a 12 week-old TG mouse. (d) H&E and immunostaining for CD3, CD4, CD8 and PAX5 in the skin and lung of a TG mouse.
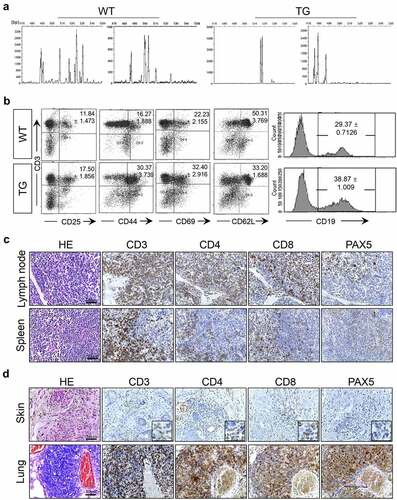
In the lymph node and spleen of the transgenic mice, we noticed general structural disorganizations marked by abnormal follicles which in turn showed mixed cortical and paracortical hyperplasia with increased numbers of lymphocytes some of which were found outside the follicular areas as well (; Supplemental , b). Consistently, histological analyses revealed the presence of T cells in organs other than lymphoid organs (). Lung and skin in particular were infiltrated with CD3+, CD4+ and CD8 + T cells (). B cells, marked by PAX5, were also present increased numbers in the lymph node and spleen () as well as in the lung but not extensively in the skin ().
Allogenic transplantation of cells from CTLA4-CD28 transgenic mice
We carried out transplantation of spleen cells from the transgenic mice to NSG mice in order to examine the transformation status of the lymphocytes. By the 9-week point, all recipient mice developed skin lesions () and showed significant enlargement of their spleen compared to the wild-type NSG mice (). HA expressing cells were found throughout the spleen throughout white pulp areas in variable densities but mostly forming small clusters consistent with clonal expansion (Supplemental ). To determine the cell types that induced these symptoms from the NSG mice, we examined the marker expression of the lymphocytes. Cells positive for T cell markers, CD3, CD4 and CD8, were readily detected, but virtually no PAX5 positive B cells were seen (). Also, infiltrating cells in the affected skin area appeared to be T cells (). Of note, in both the spleen and skin, CD4+ cells clearly outnumbered CD8+ cells, indicating that CD4 + T cells were the major transplantable population from CTLA4-CD28 transgenic mice. Interestingly, transplantation of same cells to syngeneic FVB/NJ mice did not lead to enlargement of the lymph nodes or spleen (Supplemental ). We also could not detect HA expressing cells in the spleen of the transplanted FVB/NJ mice (Supplemental ). These observations suggest a possible immune reaction to human CTLA4-CD28 fusion gene in these immunocompetent mice.
Figure 4. Histopathology of NSG mice transplanted with spleen cells from CTLA4-CD28 transgenic mice. (a) An NSG mouse with typical skin lesions in 9 weeks post transplantation. (b) Size and weight of spleen from NSG control and transplanted mice (n = 3 each). (*) represents P-value <0.05 from t-test. (c) H&E and immunostaining for CD3, CD4, CD8 and PAX5 in the spleen. Areas in the yellow box are shown in enlarged forms in the lower panels. (d) H&E and immunostaining for CD3, CD4, CD8 and PAX5 in the skin.
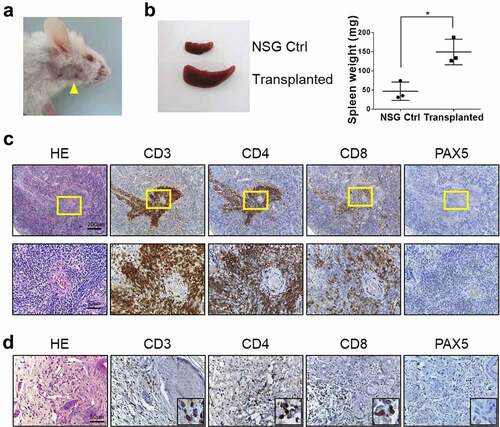
Figure 5. Histopathology of NSG mice transplanted with CD4+ or CD8 + T cells from CTLA4-CD28 transgenic mice. (a) Skin lesions (yellow arrowhead) seen in an NSG mouse injected with CD4+ cells (top); a mouse injected with CD8 + T cells is shown below. (b) The spleen from a NSG mouse injected with CD4+ cells compared to that from a mouse injected with CD8 + T cells. The graph on the right side summarizes results from multiple samples (n = 3). (*) represents P-value <0.05 from t-test. (c) Spleens from mice transplanted with CD4+ or CD8+ cells were stained for CD3, CD4 and CD8. (d) H&E and immunostaining for CD4 and CD8 in the liver and skin of mice transplanted with CD4+ or CD8 + T cells.
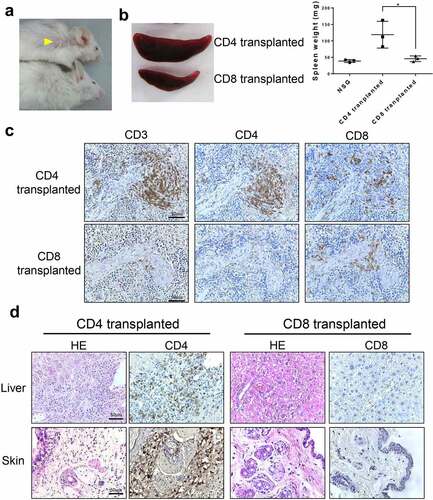
To further examine the role of CD4 + T cells and CD8 + T cells, we isolated each cell type from the transgenic mice and injected them to NSG mice. When observed 10 weeks afterward, skin lesions were found only in mice injected with CD4 + T cells (), and spleens of the CD4 + T cells injected NSG mice were larger than those of CD8 + T cell injected NSG mice (). There were some cross contamination of cells, as some CD8+ cells were found in CD4+ cell-transplanted mice and vice versa (). It is possible that multiple populations are co-expanding in the transgenic and NSG mice some of which may be non-transformed. This raises the issue of the identity of transformed T cell subtype. Of note, we found more CD4+ cells in CD4+ cell-injected mice than CD8+ cells in CD8+ cell-injected mice suggesting that at least CD4+ cells expanded in number when transplanted. Consistently, when the T cells were co-stained for ki67, a marker for cellular proliferation, we were able to readily identify CD4+ ki67+ cells while virtually no CD8+ cells were ki67+ (Supplemental ). In addition, infiltration of lymphocytes was observed only in the liver and skin of CD4 + T cell-injected NSG mice ().
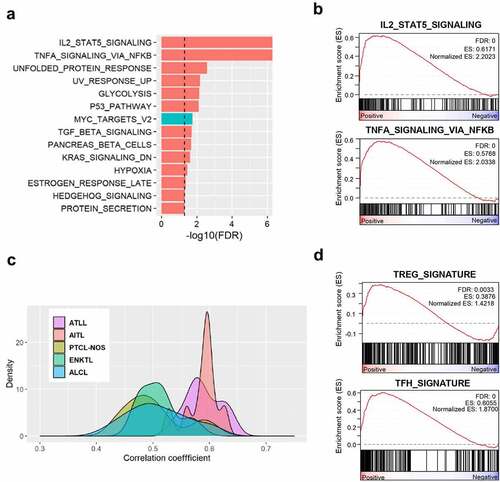
Figure 6. Transcriptome analysis of CD4 + T cells from CTLA4-CD28 transgenic mice. (a) Gene set enrichment analysis (GSEA) result using the hallmark gene sets of MSigDB. Significant gene sets with FDR < 0.05 are shown in the bar plot. Gene sets with positive and negative enrichment scores were indicated in red and blue colors, respectively. (b) Enrichment plots of representative gene sets for the indicated pathways. (c) Distribution of pairwise correlation coefficients between gene expression profiles of CD4+ cells from TG mice and T cell lymphoma patients of 5 tumor subtypes. (d) Enrichment plots of representative gene sets for the indicated cell types.
ATLL-like and AITL-like features of CTLA4-CD28 transgenic mice
To characterize CD4 + T cells at the molecular level, we carried out transcriptome sequencing of CD4+ cells isolated from transgenic and wild-type littermate mice in duplicates. Biological functions different between transgenic and wild-type mice were identified by applying a gene set enrichment analysis (GSEA) method on the hallmark gene sets in the MSigDB. We found 14 significant gene sets (FDR < 0.05) including ‘IL2-STAT5 signaling’, and ‘TNF-α signaling via NF-κB’ (). These two top-scoring categories have been implicated in development and regulation of T cells.Citation25,Citation26
Next, we explored which subtypes of human T cell lymphoma show pathological profile closest to that of our transgenic mice. For this purpose, we identified the differentially expressed genes between the transgenic and wild-type mice (876 up- and 647 down-regulated genes at FDR < 0.05; Supplemental Tables 1), which were converted into 1,245 orthologous human genes. Then, we compared the expression profile of these genes between the transgenic mice and 67 human T cell lymphoma samples that included 8 ATLL, 9 AITL, 10 PTCL-NOS, 17 ENKTL, and 23 ALCL cases (see Materials and Methods). The distribution of pairwise correlation coefficients showed that the expression profile of our transgenic mice was the most similar to those of ATLL and AITL patients (). Treg cell and Tfh cells have been proposed to be the transformed cells of ATLL and AITL respectively.Citation27–30 Consistently, GSEA indicated both Treg and Tfh signatures were enriched ().
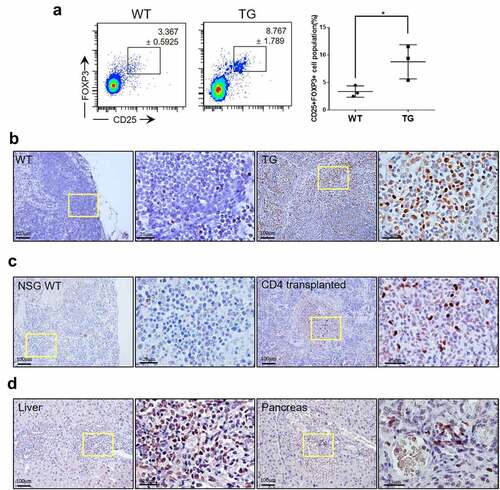
FOXP3 expression in tumor cells is one of the key features of a significant subset of ATLL cases.Citation27 We used flow cytometry to examine if Treg cells were found in increased numbers consistent with induction of ATLL-like lymphoma. To this end, CD3+ CD4+ cells were examined for expression of CD25 and FOXP3. Indeed, the proportion of CD25+ FOXP3+ cells among CD4 + T cells was elevated by more than 2.5-fold in the transgenic mice compared to wild-type littermates (). FOXP3+ cells were also readily detectable by antibody staining of the lymph nodes (). While a few positive cells were seen within the follicles of wild type littermates, transgenic mice showed numerous FOXP3+ cells throughout their lymph nodes. FOXP3+ cells were also found in clusters in the spleen () and in the liver and pancreas () of NSG mice transplanted with CD4+ cells indicating that FOXP3+ cells were indeed transformed cells.
Figure 7. ATLL-like phenotypes in CTLA4-CD28 transgenic mice. (a) Flow cytometric analysis for CD25+ FOXP3+ Treg cells among CD3+ CD4+ cells from WT littermates and TG mice. The graph on the right side summarizes results from multiple samples (n = 3). (*) represents P-value <0.05 from t-test. Lymph nodes from a WT mouse and TG mouse (b), spleens from a wild type NSG (NSG WT) mouse and CD4 + T cell-transplanted NSG mouse (c), liver and pancreas of a CD4 + T cell-transplanted NSG mouse (d) immunostained for FOXP3. Areas in the yellow box are shown in enlarged forms in the panels to the right.
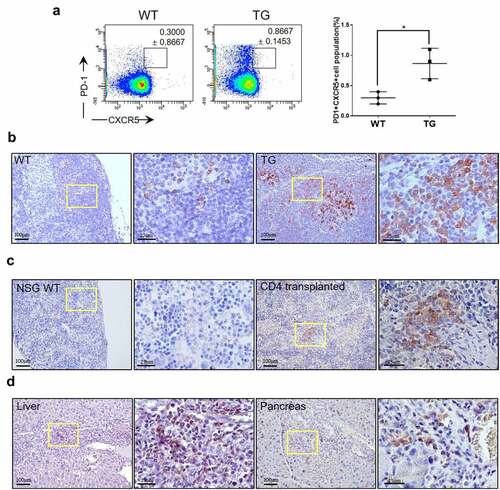
AITL is proposed to be a cancer of Tfh cells.Citation28,Citation29 Flow cytometric analyses showed a clear increase in the proportion of PD-1+ cells among CD4+ B220- CD11b- cells from transgenic mice compared to wild-type littermates (). However, these cells were not strongly positive for CXCR5 despite the seeming statistical significance. In addition, there was no massive proliferation of CD21+ cells or endothelial venules in transgenic mice indicating AITL-like phenotype was limited in extent (Supplemental ). The CD21+ cells were also not seen in the spleen of NSG mice transplanted with CD4+ cells from transgenic mice again consistent with limited AITL-like phenotype (Supplemental ). Still, histological examination clearly showed an increase in the number of PD-1+ cells in the lymph nodes of transgenic mice (). In fact, PD-1+ cells were found outside the follicles indicating an abnormal growth. We were also able to readily identify PD-1+ cells in the spleen () and in the liver and pancreas () of NSG mice transplanted with CD4+ cells indicating that PD-1+ cells were also transformed cells not dependent on other cell types or particular milieu for survival. Finally, we examined the overlap of the FOXP3+ cells and PD-1+ cells using serial sections from a lymph node of a transgenic mouse (Supplemental ). It was readily observed that most of the FOXP3+ cells were outside the germinal center while most of the PD-1+ cells were inside the germinal center indicating that the two types of cells represent distinct populations.
Figure 8. AITL-like phenotypes in CTLA4-CD28 transgenic mice. (a) Flow cytometric analysis for PD-1+ CXCR5+ cells among CD4+ B220- CD11b- cells from WT littermates and TG mice. The graph on the right side summarizes results from multiple samples (n = 3). (*) represents P-value <0.05 from t-test. Lymph nodes from a WT mouse and TG mouse (b), spleens from a wild type NSG (NSG WT) mouse and CD4 + T cell-transplanted NSG mouse (c), liver and pancreas of a CD4 + T cell-transplanted NSG mouse (d) immunostained for PD-1. Areas in the yellow box are shown in enlarged forms in the panels to the right.
Discussion
High throughput sequencing has led to the discovery of numerous candidate oncogenes in various types of cancer cells in the form of mutated and differentially expressed genes. Yoo and coworkers reported isolation of the CTLA4-CD28 fusion gene from their RNA-Seq analyses of multiple types of lymphoma including AITL, PTCL-NOS and ENKTL.Citation5 In addition, the fusion was also discovered in a significant subset of young ATLL patients who have presumably undergone distinct genetic alterations from typical septuagenarian patients of this cancer type.Citation7 A case involving a single patient suffering from Sezary syndrome with the CTLA4-CD28 fusion has also been reported.Citation31 That the patient responded temporarily to Ipilinumab, an anti-CTLA4 antibody strongly suggests that this fusion mutation was the driver mutation of the pathology. Our study presents consistent results in that the expression of CTLA4-CD28 fusion in a T cell-specific manner leads to T cell lymphoma. Inflammatory pathological features including lymphadenopathy and splenomegaly as well as skin lesions were seen with high penetrance.
Most curiously, our data indicate that the cancer cells are CD4+ cells whose gene expression profile closely and equally resembles those of ATLL and AITL among the diverse types of T cell lymphoma. ATLL is a type of T cell lymphoma known to result from infection by HTLV-1.Citation6 Mechanistic analyses of the pathogenesis included generation of murine models that express viral oncogenes in T cell-specific manners. Hasegawa and coworkers expressed viral regulatory protein Tax, which has an in vitro transforming activity, under the control of the lck proximal promoter.Citation32 These mice developed pre-T cell (CD4-CD8-) lymphoma that only partially simulates ATLL in that T cells associated with clinical cases of this lymphoma are generally of a mature T cell type phenotype. Driving the expression of the same gene under the control of the lck distal promoter also induced lymphoma, and in this case the cells were of more mature phenotype being either CD4+ or CD8 + .Citation33 This disparity likely reflects the choice of the promoter as the lck proximal promoter and the lck distal promoter are respectively active in early and late periods of T cell development. The latter model still falls short of fully replicating the ATLL phenotype in that the cancer cells were not CD25 + . Another viral protein HTLV-1 bZIP, when expressed in a CD4-specific manner, also could induce ATLL-like phenotype.Citation34 In fact, as in the case of a large majority of ATLL cases, the murine model featured an increase in CD4+ FOXP3+ Treg cells thus better replicating the disease phenotypes. Interestingly however, CD25+ FOXP3+ cells decreased in proportion in this transgenic mice. Our transgenic mice expressing the CTLA4-CD28 fusion gene under the control of the lck-distal promoter represent the first model for ATLL that uses no viral oncogenes. Given that we have an increased number of both mature T cells and CD25+ FOXP3+ cells, our transgenic mice appears to be an excellent model for ATLL.
AITL is a cancer of Tfh cells.Citation28,Citation29 Multiple recent studies have revealed somatic mutations associated with this lymphoma type.Citation35–37 The most highly recurrent and specific mutation appears to be a missense mutation in RHOA encoding p.Gly17Val. Transgenic mice expressing this mutant gene show variable inflammatory and immunoproliferative phenotypes.Citation38–40 Once again, the choice of promoters seems to affect the severity of the disorder, but in all cases expression of the mutant gene alone does not seem to suffice for induction of full-blown lymphoma which was seen only after combining with a loss-of-function mutation with Tet2.Citation38,Citation40 It is therefore somewhat surprising that expression of CTLA4-CD28 alone was able to generate transplantable PD-1+ cells. It should be noted that these cells are CXCR5- and may not have all the salient features of Tfh cells. These observations raise the possibility that the PD-1+ cells are not Tfh cells but simply exhausted T cells, also known to express PD-1 at high levels. Of note, the number of CD21+ dendritic cells and the extent of endothelial venules were similar between the transgenic mice and the wild-type littermates indicating that a full blown AITL is not occurring here. On the other hand, transcriptomic analysis indicated that Tfh-specific genes were highly expressed in CD4+ cells which is consistent with at the least a partial progression of transformation. It is possible that as in the case of RHOA p.Gly17Val model, additional mutations are needed for a closer simulations of AITL and settle the identity issue of the PD-1+ cells.
In summary, we present a transgenic murine model that partly recapitulates ATLL and AITL among the diverse lymphoma types in which CTLA4-CD28 fusion is found. It is interesting that the phenotypes associated with two distinct types of lymphoma coexist in this model. Clearly, the CTLA4-CD28 fusion gene can drive proliferation of both PD-1 + T cells and FOXP3 + T cells which is the basis of the lymphoma-like phenotypes. Furthermore, it appears that the transformation of the both types of T cells has occurred in the absence of additional mutations as evidenced by their transplantable phenotypes. This murine model therefore should be useful in finely dissecting the molecular function of the CTLA4-CD28 fusion gene in different types of T cells implicated in different types of lymphoma.
Authorship
GJL and YJ performed experiments and analyzed data; YKJ analyzed data; DL designed the study and performed experiments, SL and JK initiated and designed the study and wrote the paper.
ORCID profiles: GJL, 0000-0002-3830-9594; YJ, 0000-0002-4025-7164; YKJ, 0000-0001-8466-9681; DL, 0000-0001-8130-2059; SL, 0000-0001-9230-7461; JK, 0000-0002-7659-4242.
Supplemental Material
Download PDF (1.6 MB)Disclosure statement
No potential conflict of interest was reported by the author(s).
Supplementary material
Supplemental data for this article can be accessed on the publisher’s website
Correction Statement
This article has been republished with minor changes. These changes do not impact the academic content of the article.
Additional information
Funding
References
- Rudd CE, Taylor A, Schneider H. CD28 and CTLA-4 coreceptor expression and signal transduction. Immunol Rev. 2009;229(1):12–12. doi:10.1111/j.1600-065X.2009.00770.x.
- Shahinian A, Pfeffer K, Lee KP, Kundig TM, Kishihara K, Wakeham A, Kawai K, Ohashi PS, Thompson CB, Mak TW. Differential T cell costimulatory requirements in CD28-deficient mice. Science. 1993 Jul 30;261(5121):609–612. Epub 1993/ 07/30. doi:10.1126/science.7688139.
- Tivol EA, Borriello F, Schweitzer AN, Lynch WP, Bluestone JA, Sharpe AH. Loss of CTLA-4 leads to massive lymphoproliferation and fatal multiorgan tissue destruction, revealing a critical negative regulatory role of CTLA-4. Immunity. 1995;3(5):541–547. doi:10.1016/1074-7613(95)90125-6.
- Waterhouse P, Penninger JM, Timms E, Wakeham A, Shahinian A, Lee KP, Thompson CB, Griesser H, Mak TW. Lymphoproliferative disorders with early lethality in mice deficient in Ctla-4. Science. 1995;270(5238):985–988. doi:10.1126/science.270.5238.985.
- Yoo HY, Kim P, Kim WS, Lee SH, Kim S, Kang SY, Jang HY, Lee JE, Kim J, Kim SJ, et al. Frequent CTLA4-CD28 gene fusion in diverse types of T-cell lymphoma. Haematologica. 2016 Jun;101(6):757–763. doi:10.3324/haematol.2015.139253.
- Kataoka K, Nagata Y, Kitanaka A, Shiraishi Y, Shimamura T, Yasunaga J, Totoki Y, Chiba K, Sato-Otsubo A, Nagae G, et al. Integrated molecular analysis of adult T cell leukemia/lymphoma. Nat Genet. 2015 Nov;47(11):1304–1315. doi:10.1038/ng.3415.
- Yoshida N, Shigemori K, Donaldson N, Trevisani C, Cordero NA, Stevenson KE, Bu X, Arakawa F, Takeuchi M, Ohshima K, et al. Genomic landscape of young ATLL patients identifies frequent targetable CD28 fusions. Blood. 2020 Apr 23;135(17):1467–1471. doi:10.1182/blood.2019001815.
- Wildin RS, Garvin AM, Pawar S, Lewis DB, Abraham KM, Forbush KA, Ziegler SF, Allen JM, Perlmutter RM. Developmental regulation of lck gene expression in T lymphocytes. J Exp Med. 1991 Feb 1;173(2):383–393. doi:10.1084/jem.173.2.383.
- Wildin RS, Wang HU, Forbush KA, Perlmutter RM. Functional dissection of the murine lck distal promoter. J Immunol. 1995 Aug 1;155(3):1286–1295.
- Baumjohann D, Kageyama R, Clingan JM, Morar MM, Patel S, de Kouchkovsky D, Bannard O, Bluestone JA, Matloubian M, Ansel KM, et al. The microRNA cluster miR-17 approximately 92 promotes TFH cell differentiation and represses subset-inappropriate gene expression. Nat Immunol. 2013 Aug;14(8):840–848. doi:10.1038/ni.2642.
- Zhang NN, Chen JN, Xiao L, Tang F, Zhang ZG, Zhang YW, Feng ZY, Jiang Y, Shao CK. Accumulation Mechanisms of CD4(+)CD25(+)FOXP3(+) Regulatory T Cells in EBV-associated Gastric Carcinoma. Sci Rep. 2015 Dec 17;5:18057. doi:10.1038/srep18057.
- Dobin A, Davis CA, Schlesinger F, Drenkow J, Zaleski C, Jha S, Batut P, Chaisson M, Gingeras TR. STAR: ultrafast universal RNA-seq aligner. Bioinformatics. 2013 Jan 1;29(1):15–21. doi:10.1093/bioinformatics/bts635.
- Li B, Dewey CN. RSEM: accurate transcript quantification from RNA-Seq data with or without a reference genome. BMC Bioinform. 2011 Aug 4;12:323. doi:10.1186/1471-2105-12-323.
- Subramanian A, Tamayo P, Mootha VK, Mukherjee S, Ebert BL, Gillette MA, Paulovich A, Pomeroy SL, Golub TR, Lander ES, et al. Gene set enrichment analysis: a knowledge-based approach for interpreting genome-wide expression profiles. Proc Natl Acad Sci U S A. 2005 Oct 25;102(43):15545–15550. doi:10.1073/pnas.0506580102.
- Liberzon A, Subramanian A, Pinchback R, Thorvaldsdottir H, Tamayo P, Mesirov JP. Molecular signatures database (MSigDB) 3.0. Bioinformatics. 2011 Jun 15;27(12):1739–1740. doi:10.1093/bioinformatics/btr260.
- Ferraro A, D’Alise AM, Raj T, Asinovski N, Phillips R, Ergun A, Replogle JM, Bernier A, Laffel L, Stranger BE, et al. Interindividual variation in human T regulatory cells. Proc Natl Acad Sci U S A. 2014 Mar 25;111(12):E1111–20. doi:10.1073/pnas.1401343111.
- Chtanova T, Tangye SG, Newton R, Frank N, Hodge MR, Rolph MS, Mackay CR. T follicular helper cells express a distinctive transcriptional profile, reflecting their role as non-Th1/Th2 effector cells that provide help for B cells. J Immunol. 2004 Jul 1;173(1):68–78. doi:10.4049/jimmunol.173.1.68.
- Johnson WE, Li C, Rabinovic A. Adjusting batch effects in microarray expression data using empirical Bayes methods. Biostatistics. 2007 Jan 8;(1):118–127. doi:10.1093/biostatistics/kxj037.
- Love MI, Huber W, Anders S. Moderated estimation of fold change and dispersion for RNA-seq data with DESeq2. Genome Biol. 2014;15(12):550. doi:10.1186/s13059-014-0550-8.
- Blake JA, Eppig JT, Kadin JA, Richardson JE, Smith CL, Bult CJ. the Mouse Genome Database G. Mouse Genome Database (MGD)-2017: community knowledge resource for the laboratory mouse. Nucleic Acids Res. 2017 Jan;45(D1):D723–D729. doi:10.1093/nar/gkw1040.
- Boomer JS, Green JM. An enigmatic tail of CD28 signaling. Cold Spring Harb Perspect Biol. 2010 Aug;2(8):a002436. doi:10.1101/cshperspect.a002436.
- Esensten JH, Helou YA, Chopra G, Weiss A, Bluestone JA. CD28 Costimulation: from Mechanism to Therapy. Immunity. 2016 May 17;44(5):973–988. doi:10.1016/j.immuni.2016.04.020.
- Kane LP, Andres PG, Howland KC, Abbas AK, Weiss A. Akt provides the CD28 costimulatory signal for up-regulation of IL-2 and IFN-gamma but not TH2 cytokines. Nat Immunol. 2001 Jan 2;2(1):37–44. doi:10.1038/83144.
- Krishna S, Zhong XP. Regulation of Lipid Signaling by Diacylglycerol Kinases during T Cell Development and Function. Front Immunol. 2013;4:178. doi:10.3389/fimmu.2013.00178.
- Ross SH, Cantrell DA. Signaling and Function of Interleukin-2 in T Lymphocytes. Annu Rev Immunol. 2018 Apr 26;36:411–433. doi:10.1146/annurev-immunol-042617-053352.
- Webb LV, Ley SC, Seddon B. TNF activation of NF-kappaB is essential for development of single-positive thymocytes. J Exp Med. 2016 Jul 25;213(8):1399–1407. doi:10.1084/jem.20151604.
- Roncador G, Garcia JF, Garcia JF, Maestre L, Lucas E, Menarguez J, Ohshima K, Nakamura S, Banham AH, Piris MA. FOXP3, a selective marker for a subset of adult T-cell leukaemia/lymphoma. Leukemia. 2005 Dec;19(12):2247–2253. doi:10.1038/sj.leu.2403965.
- de Leval L, Rickman DS, Thielen C, Reynies A, Huang YL, Delsol G, Lamant L, Leroy K, Briere J, Molina T, et al. The gene expression profile of nodal peripheral T-cell lymphoma demonstrates a molecular link between angioimmunoblastic T-cell lymphoma (AITL) and follicular helper T (TFH) cells. Blood. 2007 Jun 1;109(11):4952–4963. doi:10.1182/blood-2006-10-055145.
- Grogg KL, Attygalle AD, Macon WR, Remstein ED, Kurtin PJ, Dogan A. Angioimmunoblastic T-cell lymphoma: a neoplasm of germinal-center T-helper cells? Blood. 2005 Aug 15;106(4):1501–1502. doi:10.1182/blood-2005-03-1083.
- Wang J, Ke XY. The four types of Tregs in malignant lymphomas. J Hematol Oncol. 2011 Dec 9;4:50. doi:10.1186/1756-8722-4-50.
- Sekulic A, Liang WS, Tembe W, Izatt T, Kruglyak S, Kiefer JA, Cuyugan L, Zismann V, Legendre C, Pittelkow MR, et al. Personalized treatment of Sézary syndrome by targeting a novel CTLA4:CD28 fusion. Mol Genet Genomic Med. 2015 Mar 3;3(2):130–136. doi:10.1002/mgg3.121.
- Hasegawa H, Sawa H, Lewis MJ, Orba Y, Sheehy N, Yamamoto Y, Ichinohe T, Tsunetsugu-Yokota Y, Katano H, Takahashi H, et al. Thymus-derived leukemia-lymphoma in mice transgenic for the Tax gene of human T-lymphotropic virus type I. Nat Med. 2006 Apr;12(4):466–472. doi:10.1038/nm1389.
- Ohsugi T, Kumasaka T, Okada S, Urano T. The Tax protein of HTLV-1 promotes oncogenesis in not only immature T cells but also mature T cells. Nat Med. 2007 May;13(5):527–528. doi:10.1038/nm0507-527.
- Satou Y, Yasunaga J, Zhao T, Yoshida M, Miyazato P, Takai K, Shimizu K, Ohshima K, Green PL, Ohkura N, et al. HTLV-1 bZIP factor induces T-cell lymphoma and systemic inflammation in vivo. PLoS Pathog. 2011 Feb 10;7(2):e1001274. doi:10.1371/journal.ppat.1001274.
- Palomero T, Couronne L, Khiabanian H, Kim MY, Ambesi-Impiombato A, Perez-Garcia A, Carpenter Z, Abate F, Allegretta M, Haydu JE, et al. Recurrent mutations in epigenetic regulators, RHOA and FYN kinase in peripheral T cell lymphomas. Nat Genet. 2014 Feb;46(2):166–170. doi:10.1038/ng.2873.
- Sakata-Yanagimoto M, Enami T, Yoshida K, Shiraishi Y, Ishii R, Miyake Y, Muto H, Tsuyama N, Sato-Otsubo A, Okuno Y, et al. Somatic RHOA mutation in angioimmunoblastic T cell lymphoma. Nat Genet. 2014 Feb;46(2):171–175. doi:10.1038/ng.2872.
- Yoo HY, Sung MK, Lee SH, Kim S, Lee H, Park S, Kim SC, Lee B, Rho K, Lee JE, et al. A recurrent inactivating mutation in RHOA GTPase in angioimmunoblastic T cell lymphoma. Nat Genet. 2014;46(4):371–375. doi:10.1038/ng.2916.
- Cortes JR, Ambesi-Impiombato A, Couronne L, Quinn SA, Kim CS, Da Silva Almeida AC, West Z, Belver L, Martin MS, Scourzic L, et al. RHOA G17V Induces T Follicular Helper Cell Specification and Promotes Lymphomagenesis. Cancer Cell. 2018 Feb 12;33(2):259–273e7. doi:10.1016/j.ccell.2018.01.001.
- Lee GJ, Jun Y, Yoo HY, Jeon YK, Lee D, Lee S, Kim J. Angioimmunoblastic T-cell lymphoma-like lymphadenopathy in mice transgenic for human RHOA with p.Gly17Val mutation. Oncoimmunology. 2020 May 13;9(1):1746553. doi:10.1080/2162402X.2020.1746553.
- Ng SY, Brown L, Stevenson K, deSouza T, Aster JC, Louissaint A Jr., Weinstock DM. RhoA G17V is sufficient to induce autoimmunity and promotes T-cell lymphomagenesis in mice. Blood. 2018 Aug 30;132(9):935–947. doi:10.1182/blood-2017-11-818617.