
ABSTRACT
Intratumoral immunotherapies are entering clinical use but concerns remain regarding their effects on non-injected tumors. Here, we studied the impact of local treatment with an adenovirus coding for TNFa and IL-2 on systemic antitumor response in animals receiving aPD-1 (anti-programmed cell death protein 1) therapy. Using bilateral murine melanoma models, we tested systemic tumor response to combined therapy with anti-PD-1 and an adenovirus coding for TNFa and IL-2 (“virus”). Virus was given intratumorally (to one of the two tumors only) and aPD-1 monoclonal antibody systemically. We evaluated both tumors’ response to treatment, overall survival, metastasis development, and immunological mechanisms involved with response. Consistent tumor control was observed in both injected and non-injected tumors, including complete response in all treated animals receiving aPD-1+ virus therapy. Mechanistically, virus injections enabled potent effector lymphocyte response locally, with systemic effects in non-injected tumors facilitated by aPD-1 treatment. Moreover, adenovirus therapy demonstrated immunological memory formation. Virus therapy was effective in preventing metastasis development. Local treatment with TNFa and IL-2 coding adenovirus enhanced systemic response to aPD-1 therapy, by re-shaping the microenvironment of both injected and non-injected tumors. Therefore, our pre-clinical data support the rationale for a trial utilizing a combination of aPD-1 plus virus for the treatment of human cancer.
Introduction
Encouraging results have been achieved with immune checkpoint inhibitors (ICIs) in patients with many types of advanced cancers including melanoma.Citation1,Citation2 Randomized phase III trials have reported promising results with improved overall survival using aPD-1 as a monotherapy,Citation1,Citation2 or aPD-L1 (anti-programmed death ligand 1) together with BRAF and MEK inhibitors at stage IIIc-IV patients.Citation3 Nevertheless, nearly 60% of patients with metastatic melanoma do not survive over five years.Citation4
The limitations of ICIs in promoting effective response in advanced patients can be partially due to their inability to revert immunosuppression in the tumor microenvironment (TME).Citation5 Conventionally, ICI therapies are able to reestablish anti-tumor response by effector T cells in immune-infiltrated tumors, and to a less extent in immune-excluded or immune deserted tumors.Citation6,Citation7 Presently, the point of inflection is how improve the benefits of ICI in patients with no active immune-response, i.e. lacking a T-cell infiltrate.Citation8 To this end, immunotherapeutics given locally into tumors, that offer potential to re-shape the TME, are being postulated as potential combination agents, that could further leverage ICI benefits to patients.Citation9,Citation10
In this regard, oncolytic viruses (OV) stand as an appealing class of agents with demonstrated efficacy as single-agent treatments or in combination with other immunotherapies, including ICI.Citation10–13 OVs comprise different families of viruses that hold natural or genetically modified cancer tropism and cell lytic capability.Citation14 Additionally, some OVs are permissive to insertion of human immunomodulatory transgenes into their genome, which upon infection allow progressive transgene expression in the TME.Citation15,Citation16 From a clinical view, OVs have shown favorable results when used in combination with aPD-1.Citation10 In a phase Ib trial in advanced melanoma patients, treatments with the EMA/FDA-approved OV talimogene laherparepvec (T-Vec) and pembrolizumab (aPD-1) showed considerable systemic tumor control with volume reduction in 82% of injected, 43% of non-injected non-visceral, and 33% of non-injected visceral lesions.Citation10
From the perspective of eliciting anti-tumor responses, oncolytic adenoviruses constitute promising candidates.Citation17,Citation18 Particularly, adenoviruses possess inherent immunogenic capabilities for stimulation of the host immune system by direct cell lysis, and through anti-viral response, elicited by the viral infection stimulating the host immune system.Citation19,Citation20 Further immune boosting is achieved when the adenoviruses are armed with cytokines.Citation21 Indeed, adenoviruses coding for GMCSF, OX40L, and TNFa and IL-2 have shown remarkable effector cell infiltration, partial or complete tumor shrinkage, and durable response in preclinical models and in patients.Citation21,Citation22
Previously, we have validated the ability of an adenovirus coding for TNFa and IL-2 to support melanoma debulking in injected lesions.Citation23 Here, we investigate the potential of a non-replicating adenovirus expressing murine TNFa and IL-2 cytokines to elicit systemic response in the context of melanoma metastasis in animals treated with PD-1 blockade.
Materials and methods
Cell lines and viruses
Murine melanoma cell line B16.OVA is derived from the B16.F1 melanoma cell line and it was kindly provided by Professor Richard Vile (Mayo Clinic, MN, USA).Citation24 The murine melanoma cell line expressing luciferase, B16.F10-Red-Luc, was purchased from PerkinElmer (MA, USA), B16.F10 from ATCC (VA, USA), and the murine colon cancer MC-38 cell line was acquired from Kerafast (MA, USA).). Cells were cultured either in RPMI 1640 (B16.OVA and B16.F10-Red-Luc) or DMEM 30030 (MC-38) and supplemented with 10% FBS, 2 mM L-Glutamine, 100 U/mL penicillin, and 100 mg/mL streptomycin. B16.OVA cells were further supplemented with G-418 (5.0 mg/mL) and B16.F10-Red-Luc cells with Amphotericin B (fungizone) (0.25 µg/ml) for cell positive selection. Cell lines were incubated at +37°C and 5% CO2, and were passaged in vitro three to four times prior to in vivo use. Ad5-CMV-mTNFa and Ad5-CMV-mIL2 adenoviruses constructs have been described before.Citation25 As mice are non-permissive to human adenoviruses, non-oncolytic viruses coding for murine transgenes were used here.
Murine melanoma models
Immunocompetent female C57BL/6JOlaHsd mice, 4 to 5 week old (Envigo, IN, USA) were used in the in vivo studies. To establish subcutaneous bilateral melanoma tumors, mice were engrafted with melanoma cells on their lower back in the left and right flanks, and the tumor engraftments were performed three days apart.
In the first survival study, mice were engrafted subcutaneously with 2.5 × 10⁵ B16.OVA cells. Tumors were allowed to grow for 11 days (time counted from the first tumor engraftment), when the primary tumors reached 4–5 mm and the secondary 2–3 mm in the longest diameter. Animals bearing tumors were then randomly assigned into one of the groups (n = 10 per group), and a total of 15 rounds of treatments were administered.
For the mechanism of action experiment, animals received 5 × 10⁵ B16.F10 cells injections and tumors developed for 9 days (counted from the first tumor engraftment) when the longest diameter was approximately 8–9 mm in the primary, and 5–6 mm in the secondary tumor. After randomization, animals were assigned into different treatment groups (n = 5 per group), and three rounds of treatment were administrated. Tumor progression was measured daily utilizing a digital caliper, and tumor volume was calculated with the formula (length × width2)/2. Tumor volumes in percentage were obtained from the daily tumor volumes normalized to their respective day 0 tumor volume.
Animals were euthanized whenever the combined length from bilateral tumors in the longest diameter reached 23 mm, the study endpoint was met, or when the animal´s wellbeing was compromised.
Bioluminescence animal experiment
Murine melanoma cells expressing luciferase (B16.F10-Red-Luc, 5 × 10⁵ cells) were inoculated, five days apart, on the lower and upper middle back of 4 to 5 week old immunocompetent female C57BL/6BrdCrHsd-Tyrc albino mice (n = 9 per group). On day 7, when approximately 8 mm and 4 mm longest diameter in the primary and secondary tumors (respectively) were reached, animals were randomized into the treatment groups. Prior to live imaging, mice were injected intraperitoneally with 200 μl of D-luciferin (150 mg/kg, PerkinElmer, MA, USA). Luminescence from growing tumors was detected with live luminescence detection with SPECTRAL Lago (Spectral Instruments Imaging, AZ, USA) imaging system at different days.
Animals were euthanized whenever the combined length from both tumors in the longest diameter reached 23 mm, or whenever the animal´s wellbeing was compromised.
Treatments
Anti-mouse PD-1 (Clone RMPI-14, BE0146, Bio-XCell, NH, USA) was given intraperitoneally (i.p.) as 0.1 mg per dose. Equal amounts of virus (Ad5-CMV-mTNFa and Ad5-CMV-mIL2), 5 × 10⁷ virus particles (vp) per virus, were injected intratumorally (i.t.) into the primary tumors only. To mimic the mechanical disruption promoted by local injections, mock and aPD-1 groups received i.t. injections with phosphate buffer saline (PBS) into the primary tumors. Detailed treatment schedules are described in their respective figures.
Re-Challenge in vivo experiment
Complete responders from the bioluminescence survival study; mock (n = 1), aPD-1 (n = 5), virus (n = 7), and aPD-1+ virus (n = 9) were eligible for this experiment. Animals were re-challenged with another B16.F10-Red-Luc (5x10⁵ cells) melanoma cells inoculation on their upper left back. Additionally, mice were engrafted contra laterally with a new cancer cell line MC-38 (1.4 × 10⁵ cells). Naïve mice (n = 3) to both cell lines and treatments were included as controls for the experiment. When tumors were visible (day 8), measurements were taken with a digital caliper every three days to monitor the tumor progression. Tumor volumes were calculated as aforementioned. On day 21, all animals were euthanized and had tumors and spleens collected for further immunological studies.
Mouse tumor processing and flow cytometry
Mice tissues and tumors collected were mechanically grinded with a tissue homogenizer OMNI Tissue Master 125 W (Omni, GA, USA) into single cell suspensions, and stored in freezing media (90% FBS and 10% DMSO) at −80°C. Samples were then processed for flow cytometry analysis for cell surface staining following the manufacturer´s recommendations. For intracellular staining, cells were first cultured for 5 hours with brefeldin A (BD GolgiPlug™ containing Brefeldin A, Cat.No.555028, BD, NJ, USA) for inhibiting protein transport. Followed by cell permeabilization and antibody staining according to manufacturer protocols (BD Cytofix/Cytoperm™ Plus Fixation/Permeabilization Kit, Cat.No.555028, BD, NJ, USA). Cell fluorescence was detected with Sony SH800Z cytometer (Sony, Japan) or BD FACS Aria II flow cytometer (BD, NJ, USA), upon acquisition of 14,000 to 100,000 events per sample. Cell data processing and gating were performed with FlowJo v.10.6.1 (FlowJo LLC, OR, USA). A list of the antibodies and pentamer used can be found in Supplementary Table 1.
Enzyme-linked immunospot (ELISpot) assay
Effector cells were splenocytes collected from re-challenged mice euthanized on day 21. Target MC-38 cells were treated with 500 U/ml mouse IFN-γ (Peprotech, NJ, USA) for 24 h, then irradiated (120 Gy) utilizing the gamma irradiator OB29/4 (STS, BS, DE). A mouse ELISpot IFN-γ kit (EL485, R&D Systems, MN, USA) was used. Target MC-38 cells were seeded at 25,000 cells per well, and co-cultured with effector splenocytes at 106 cells per well. Plate was cultured at 37°C for 48 h, then developed following the manufacturer´s instructions. Results were scanned with the ImmunoCapture Software and spots counted with the ImmunoSpot Professional Software in the SmartCount™ mode.
Tumor cytokine analysis
Tumor fragments were snap-frozen and stored at −80°C. Later, tumors were thawed and 20–22 mg of tissue were collected in 500 µl of a protease inhibitory cocktail (SIGMAFast, Merck, HE, Germany) and mechanically grinded with a tissue homogenizer OMNI Tissue Master 125 W. Tumor suspensions were pelleted and the supernatants were used for Cytometric Bead Array Mouse Th1/Th2/Th17 Cytokine kit (560485, BD, NJ, USA), according to manufacturer´s instructions. Data was acquired using BD Accuri C6 Cytometer (BD, NJ, USA) and analyzed with FCAP Array Software (BD, NJ, USA).
Histopathology of lymph nodes
Inguinal lymph nodes collected were fixed in 10% formalin, and histologically processed into paraffin blocks. Slides sections of 5 μm thickness were stained with hematoxylin and eosin. The presence of melanoma metastases in the lymph nodes was evaluated by a veterinarian pathologist in a blind manner.
Statistical analysis
One-way ANOVA with post-hoc Tukey and linear mixed-model analyses were utilized to evaluate differences on tumor progression using GraphPad Prism v.8.4.2, (GraphPad Software Inc, CA, USA) and SPSS v.25 (IBM, IL, USA), respectively. GraphPad Prism v.8.4.2, was also used for log rank Mantel-Cox on Kaplan–Meier survival curve, and unpaired t-test with Welch´s correction, and for the graphical representation of the data. Results were considered statistically significant when p <0.05.
Ethical statement
All animals experiments here described have been approved and performed in accordance to the Experimental Animal Experimental Board (ELLA) of the University of Helsinki and the Provincial Government of Southern Finland.
Results
Local virus treatment improves survival of animals with bilateral tumors receiving aPD-1 therapy
To evaluate the therapeutic potential of combining aPD-1+ virus therapy to elicit tumor control in non-injected tumors, we used mice bearing two B16.OVA melanoma tumors (). Virus treatments were administrated following the prime and boost therapy approach previously described.Citation23 Briefly, animals in virus treated groups received intratumoral virus injections on days 0 and 1. Local virus treatments enabled the best tumor control in injected melanoma compared to mock (p < .00001; virus vs mock, p < .00001; aPD-1+ virus vs mock), and aPD-1 (p < .00001; virus vs aPD-1, p < .00001; aPD-1+ virus vs aPD-1) groups (). Likewise, in the combined treatment group, systemic aPD-1 treatment improved the virus’ local tumor control in injected lesions versus virus monotherapy (p = .0002). In non-injected tumors (), both aPD-1 and virus monotherapies presented better control than mock control group (p < .001; aPD-1 vs mock, p = .015; virus vs mock). Yet, aPD-1 monotherapy promoted better tumor control in non-injected tumors than virus alone (p = .007). Interestingly, the use in conjunction of aPD-1+ virus showed the best tumor control of distant metastases (non-injected tumors) compared to mock (p < .00001), and aPD-1 (p < .001).
Figure 1. Tumor progression and overall survival in a bilateral B16.OVA melanoma animal model treated with aPD-1 + virus therapy. (a) Experimental design: 10 mice per group were engrafted on days −11 and −8 (prior to treatment) with B16.OVA cells. Virus (Ad5-CMV-mTNFa and Ad5-CMV-mIL2) treatments were injected into primary tumors (left side) only. Mock and aPD-1 groups received equivalent volumes of phosphate buffer saline (PBS). Mouse anti-PD-1 was given i.p. Intratumoral injections were performed only into the primary tumors (injected tumors, left side). Virus treatments were initially given on days 0 and 1, then every 3 days (to follow a prime and boost approach). In aPD-1 + virus group, aPD-1 treatment started only on day 3, then every 3 days after that. In total, 15 rounds of treatments were administered. (b) Normalized individual tumor volumes of injected (left) and (c) non-injected tumors (right) from all the experimental groups until day 20 after treatment initiation. (d) Survival curve of animals under study until day 100. *p < .05, **p < .01, ***p < .001 and ****p < .0001.
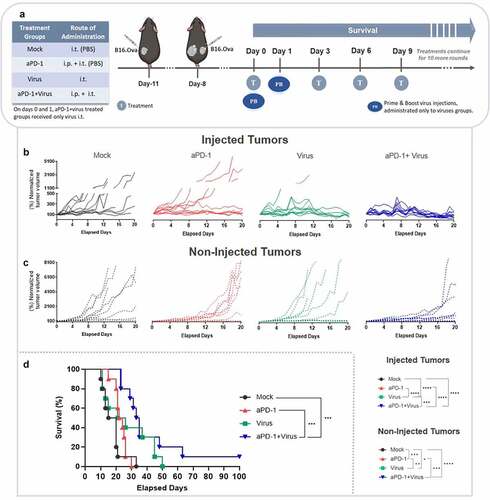
Following long-term observation, the addition of virus injections to aPD-1 therapy was beneficial in mice bearing bilateral melanoma. This group was the only one to show complete response and significantly extended overall survival compared to mock (p = .0002), and aPD-1 (p = .0006) groups (). These data suggest that it is advantageous to add local virus treatment for improving systemic response to aPD-1 therapy in metastatic melanoma.
Combination therapy with aPD-1 plus virus enhances cytotoxic tumor infiltrating CD4+ and tumor specific CD8+ T cells in injected and non-injected tumors
In order to confirm reproducibility of the treatment in controlling distant tumors, and to unveil the immunological mechanisms elicited by the combined therapy, a separate mechanism of action study was performed with the B16.F10 melanoma cell line (). Of note, B16.F10 cell line derives from the same parental cell line as B16.Ova, however, its growth pattern in vitro and in vivo are considerably distinct.Citation26
Interestingly, already 7 days after treatment initiation, virus treatment resulted in better control of injected tumors compared to mock (p = .002; virus vs mock, p = .020; aPD-1+ virus vs mock) (). Virus monotherapy also promoted significantly better anti-tumor responses compared to aPD-1 monotherapy (p = .027). At the same time point, aPD-1+ virus group was the only treatment that provided significant tumor control in non-injected tumors compared to aPD-1 monotherapy (p = .024) ().
Figure 2. Mechanism of action animal study in a bilateral B16.F10 melanoma model treated with aPD-1+ virus therapy. (a) Experimental design: 5 mice per group were engrafted on days −9 and −6 (prior to treatment) with B16.F10 cells. Treatments were administered as above. On day 7, after 3 rounds of treatment all animals were euthanized and tumors were collected for immunological studies. (b) Normalized combined tumor volumes of injected (left) and (c) non-injected tumors (right) from all experimental groups until day 7. (d-n) Phenotypical analyses of adaptive immune cells with flow cytometry of tumors collected on day 7. Percentage of (d) CD4 + T cells, (e) CD69 mean fluorescence intensity (MFI) in CD4 + T cells, (f) PD-1+ CD4 + T cells, (g) cytotoxic CD4 + T cells, (h) Granzyme B MFI in CD4 + T cells, (i) CD8 + T cells, (j) CD69 MFI in CD8 + T cells, (k) PD-1+ CD8 + T cells, (l) cytotoxic CD8 + T cells, (m) Granzyme B MFI in CD8 + T cells (n) TRP-2+CD8+ T cells. Data are presented as mean + SEM. *p < .05, **p < .01, ***p < .001 and ****p < .0001.
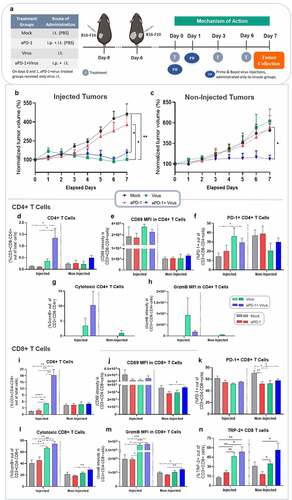
When analyzing the immune cells infiltrating the injected tumors collected on day 7, aPD-1+ virus treatments induced the highest infiltration of CD4 + T cells compared to mock (p = .043), aPD-1 (p = .040), and virus (p = .074)(). Although not statistically significant, an analogous trend was observed at non-injected tumors with higher levels of CD4 + T cells in the aPD-1+ virus group (). Regarding CD4 + T-cell activation status, in both primary and secondary tumors, non-significant differences were detected with regard to CD69 expression in CD4 + T cells (). Similarly, tumor infiltrating PD-1+ CD4 + T cells levels fluctuated across the groups with no statistically significant difference, except in injected aPD-1+ virus tumors that had statistically significant higher percentage of PD-1+ CD4 + T cells than in the mock treated group (p = .037) ().
Curiously, groups receiving virus were the only ones capable of inducing cytotoxicity, as measured by Granzyme B (GrzmB) positivity in CD4 + T cells of injected tumors, although no statistically significant differences were present (). In non-injected tumors, only virus monotherapy induced detectable levels of CD4+ GrzmB+ T cells (). Importantly, combined aPD-1+ virus therapy showed striking increases in CD8 + T cells infiltration of injected tumors, compared to its monotherapy counterparts, aPD-1 (p = .003), virus (p = .008), and mock (p = .003) (). Virus monotherapy induced statistically significantly higher CD8 + T cells levels than mock (p < .0001) and aPD-1 (p = .004) treatment. In non-injected tumors, however, the percentage of tumor infiltrating CD8 + T cells was not statistically significant different in any of the experimental groups (). The presence of CD69+ CD8 + T cells was the only significant finding in non-injected tumors of the aPD-1+ virus group, compared to aPD-1 alone (p = .041) (). The mock group showed statistically significant higher levels of PD-1+ CD8 + T cells in non-injected tumors compared to aPD-1 (p = .010), virus (p = .025), and combined therapy (p = .037) groups ().
Notably, the potency of the virus to boost cytotoxic tumor infiltrating CD8 + T cells was evident in injected tumors of virus-treated groups. While no statistically significant differences were detected between virus and aPD-1+ virus, virus monotherapy had higher levels of CD8 + T cells than mock (p = .009), and aPD-1 (p = .019) (), as well as higher GrzmB expression per CD8 + T cells compared to both groups (p = .011; virus vs mock, p = .012; virus vs aPD-1) (). Tumors treated with aPD-1+ virus not only showed significantly greater percentages of cytotoxic CD8 + T cells in injected tumors compared to mock (p = .002) and aPD-1 monotherapy (p = .005) () but also increased levels of GrzmB in CD8 + T cells in comparison to mock (p = .0008) and aPD-1 (p = .0004) (). Moreover, combined therapy efficiently enhanced infiltration of cytotoxic CD8 + T cells into non-injected tumors (p = .003; aPD-1) (). Likewise, it increased GrzmB expression in CD8 + T cells (p = .047; aPD-1+ virus vs mock, p = .001; aPD-1+ virus vs aPD-1) (). Importantly, aPD-1+ virus therapy also induced increase on specific anti-tumor CD8+ TRP-2 + T cells in injected and non-injected tumors (). Statistical significance was observed in injected aPD-1+ virus group versus mock (p = .006), and aPD-1 (p = .011). Similarly, virus monotherapy also stimulated statistically significant high levels of CD8+ TRP-2 + T cells in injected tumors compared to mock (p = .003) and aPD-1 (p = .009). In non-injected tumors, once more virus-treated groups presented statistically significant higher levels of anti-tumor specific CD8 + T cells than aPD-1 monotherapy. Virus monotherapy versus aPD-1 (p = .02), and aPD-1+ virus versus aPD-1 (p = .02). Overall, these results suggest that aPD-1+ virus therapy efficiently elicits specific anti-tumor response in injected and non-injected melanoma tumors, even in a model where the adenovirus is not replicative.
Local administration of adenoviruses coding for TNFa and IL-2 enhances innate lymphocyte cytotoxicity and dendritic cell maturation in distant tumors in animals receiving aPD-1 therapy
To elucidate the therapeutic effect of combined aPD-1+ virus treatment on other immune cells in the TME, innate lymphocytes and myeloid cells were analyzed. There were no differences in overall Natural Killer (NK) cell frequencies (). The percentage of cytotoxic NK+ cells, however, was lower in the aPD-1+ virus group in comparison to mock (p = .0007), and aPD-1 (p = .0003) in injected and non-injected tumors (p = .021; aPD-1+ virus vs mock, p = .031; aPD-1+ virus vs aPD-1) ().
Figure 3. Characterization of innate immune cells present in tumors upon aPD-1+ virus therapy following the experimental set-up described in . (a-f) Phenotypic analysis by flow cytometry of tumor infiltrating innate lymphocytes in tumors harvested on day 7. Percentage of (a) NK+ cells, (b) cytotoxic NK+ cells, (c) Granzyme B MFI in NK+ cells, (d) NKT+ cells, (e) cytotoxic double-negativeT cells, and (f) Granzyme B MFI in cytotoxic double-negativeT cells. (g-j) Phenotypic analysis by flow cytometry of tumor infiltrating innate dendritic cells and myeloid derived suppressor cells (MDSCs) in tumors harvested on day 7. Percentage of (g) dendritic cells like, (h) CD80 MFI in dendritic cells, (i) PD-L1 MFI in dendritic cells, and (j) MDSCs like. Data are presented as mean + SEM. *p < .05, **p < .01, and ***p < .001.
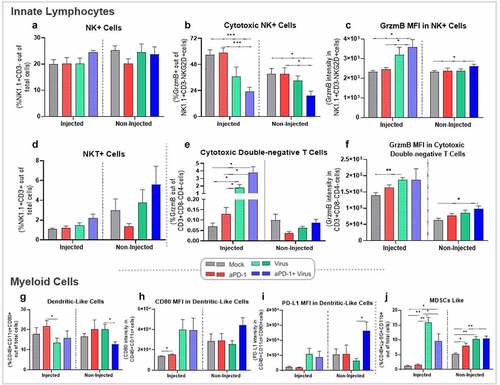
Curiously, different results were obtained when GrzmB intensity per NK cell was analyzed. In injected tumors, aPD-1+ virus promoted significantly higher levels than mock (p = .030), or aPD-1 (p = .041). In non-injected tumors treated with aPD-1+ virus, GrzmB intensity in NKs was superior to the mock group (p = .044) ().
Although not statistically significant, natural killer T cells (NKT) levels in both tumors of aPD-1+ virus treated animals showed increased levels of infiltrating NKT cells, especially in non-injected tumors (). Of note, virus monotherapy induced higher levels of double-negative T cells in injected tumors compared to monotherapy (p = .022; virus vs mock, p = .024; virus vs aPD-1), or when virus was combined with aPD-1 (p = .010; aPD-1+ virus vs mock, p = .011; aPD-1+ virus vs aPD-1) (). Consistent with these observations, virus monotherapy presented significant higher GrzmB intensity in double-negative T cells compared to mock (p = .003) (). Likewise, in non-injected tumors aPD-1+ virus therapy showed better results than mock treatment (p = .016) ().
Differences in dendritic cell (DC) presence was also observed between aPD-1 and virus monotherapies (p = .048) in injected tumors, and in non-injected tumors comparing virus alone and aPD-1+ virus (p = .036) (). Yet, CD80 intensity in DCs was more prominent in virus treated groups in injected tumors, although statistical significance was obtained only in mock versus aPD-1 (p = .042) (). In non-injected tumors, aPD-1+ virus treatment induced a similar trend with augmented CD80 in DCs, but still no statistical significance was met (). Correspondingly, PD-L1 expression in DCs was higher in aPD-1+ virus than all other treatment groups in non-injected tumors, with statistical significance compared to virus monotherapy (p = .025) ().
Immune reactions often cause immune suppressive counter-reactions; the stronger the pro-immune signals, the more potent the suppressive signals are. This was observed in the context of myeloid derived suppressive cells (MDSCs). Virus monotherapy had the highest levels of these cells compared to mock (p = .001) and aPD-1 (p = .001) treatments. Likewise, combined therapy also amplified MDSCs in injected tumors, although at lower scale (p = .030; aPD-1+ virus vs mock, p = .033; aPD-1+ virus vs aPD-1) (). Non-injected tumors of aPD-1 (p = .041), virus (p = .004), and aPD-1+ virus (p = .003) groups had significantly higher levels of MDSCs than mock (). More studies would be needed to investigate how the MDSCs levels change after treatment interruption.
Taken together, these results demonstrate the effect of the combined therapy on innate lymphocytes and DCs promoting the anti-tumor response seen in injected and non-injected melanoma tumors.
Combination therapy with aPD-1 and virotherapy induces release of immunostimulatory cytokines in distant tumors
When cytokine profiling in tumors collected on day 7 was performed, as expected, expression of TNFa and IL-2 (the arming devices of the viruses) in injected tumors was higher in virus treated groups than in aPD-1 and mock (not significant). In non-injected tumors, IL-2 was higher only in aPD-1+ virus, although not significantly (). Interestingly, the combined group was the only one to show increased levels of IFN-γ in both tumors ().
Figure 4. Profile of cytokine expression in tumors collected at day 7 following the experimental set-up described in , after virus treatment with aPD-1 therapy. The cytokine production was normalized by the total protein concentration in the samples. Cytokine levels in tumors for (a) TNFa, (b) IL-2, and (c) IFN-γ, Data are presented as mean + SEM. *p < .05.
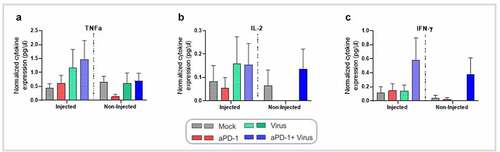
Regarding markers of immunosuppression, IL-4 was significantly higher in the aPD-1 than in the virus monotherapy group (p = .031), while in non-injected tumors no major changes were observed (Supplementary figure 1A). IL-6 and IL-10 expression varied without significant differences (Supplementary figures 1B-C).
Virotherapy enables complete response in injected and non-injected tumors treated with aPD-1
To evaluate efficacy of the combined therapy in promoting tumor control with fewer treatment doses, an addtional survival experiment was performed, this time utilizing a bioluminescent melanoma model (). Notably, local virus treatments promoted continued tumor response, even after treatment discontinuation on day 6 (). On day 39, virus monotherapy showed better tumor control than mock (p < .00001) and aPD-1 therapy (p = .012) ().
Figure 5. Anti-tumor efficacy and overall survival following virotherapy and aPD-1, and protection against metastasis. (a) Experimental design: 9 mice per group were engrafted with B16.F10-Red-Luc cells on days −7 and −2 (in the lower and upper back, respectively), prior to treatment initiation. Treatments were administered as above. On day 6, treatments were stopped in all groups, and animals were observed for survival until day 98. Tumor bioluminescence was measured in vivo right after each tumor inoculation, and on days 0, 2, 4, 9, 14, 19, 24, 29, 34, 39, and 69. (b) Combined tumor bioluminescence in photons per second from injected tumors (lower tumor) until day 14. (c) Individual bioluminescence of tumors in photons per second in injected tumors (lower tumor) until day 39. (d) Combined tumor bioluminescence in photons per second in non-injected tumors (upper tumor) until day 14. (e) Individual bioluminescence of tumors in photons per second in non-injected tumors (upper tumor) until day 39. (f) Pictures of some animals from each treatment group showing the bioluminescence (photons per second) emitted by tumors across the experimental days until day 69. (g) View on the survival curve of mice that received treatments until day 6, and that survived until day 98. (h-j) Percentage of positive melanoma metastasis (red arrows) identified in histopathology slides of lymph nodes collected from mice that relapsed the treatments (euthanized in the survival experiment). Pictures taken from lymph nodes at the time of collection, and eosin and hematoxylin staining of microscopic findings (400x magnification) in (h) mock, (i) aPD-1, and (j) virus groups. Dashed lines represent the day of treatment discontinuation. Combined tumor graphs are presented as mean + SEM. *p < .05, **p < .01, ***p < .001, and ****p < .0001.
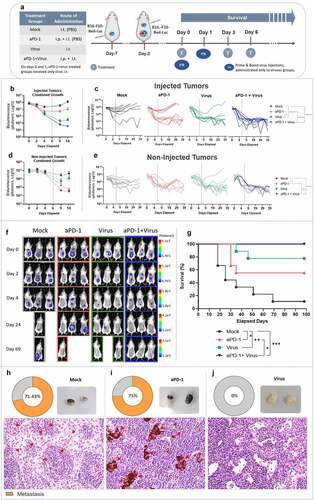
The combined therapy presented similar results (p < .00001; aPD-1+ virus vs mock, p < .0001; aPD-1+ virus vs aPD-1), with no treatment relapse observed at the same time-point (). In non-injected tumors, aPD-1 monotherapy and aPD-1+ virus anti-tumor effects were similar after a few days following treatment discontinuation ().
At later time points, aPD-1+ virus tumor control in secondary tumors was remarkably better compared to mock (p = .0001) and aPD-1 (p = .006) (). The latter showed better efficacy than mock (p = .041) (). Importantly, the efficacy of combined therapy was sustained over time (), which ultimately led to complete response in all animals (). Overall, combined therapy survival was significantly superior over mock, which was 11% (p = .0001).
Notably, addition of the virus to aPD-1 therapy significantly improved the 56% survival rate of aPD-1 monotherapy to 100% (p = .027). Monotherapies, virus (p = .003) and aPD-1 (p = .036), showed improved survival compared to mock, with virus alone yielding 78% survival with local treatment only (). Overall, these results demonstrated the ability of combined treatment to elicit complete response in local and distant melanoma tumors, even after treatment withdrawal.
Adenoviruses coding for TNFa and IL-2 prevent metastasis formation in vivo
Euthanized animals were assessed for spontaneous metastasis formation in inguinal lymph nodes. Metastasis formation was detected in 71.43% (5 out of 7) of lymph nodes of mock animals (). Similarly, 75% (3 out of 4) animals that relapsed after aPD-1 monotherapy had lymph nodes infiltrated with metastatic melanoma cells (; a more detailed description of metastatic load can be found in Supplementary figure 2S). Remarkably, no metastasis development was identified in lymph nodes in the virus monotherapy group (). This suggests that virus treatment has a potent anti-metastatic effect. No animals had to be euthanized in the combination group so lymph nodes could not be studied.
Virotherapy promotes immunological memory against tumor re-challenge and new tumor challenge
To evaluate development of immunological memory, a tumor re-challenge experiment was performed in complete responders (). All cured animals fully rejected re-injection of the cell line to which they showed complete response earlier. The same was not seen in naïve animals ().
Figure 6. Tumor re-challenge in complete responders. (a) View on the experimental design. Briefly, mice that completely rejected the B16.F10-Luc tumors in the bioluminescence survival study; mock (n = 1), aPD-1 (n = 5), virus (n = 7), and aPD-1+ virus (n = 9) were re-challenged with B16.F10-Red-Luc melanoma cells inoculation on their upper left back, and mice were engrafted contralaterally with a new cancer cell line, MC-38. Animals from virus monotherapy and aPD-1+ virus groups were merged into a single virus treated group. Tumor measurements were taken every 3 days, between days 8 and 21, when all animals were euthanized and had tumors and spleens collected for further immunological studies. (b) Tumor volume (mm3) measurements taken from B16.F10-Red-Luc and (c) MC-38 colon cancer tumors. (d-f) Phenotypic analysis by flow cytometry of (d) cytotoxic double-negative T cells, (e) effector memory CD4+, and (f) effector memory CD8+ cells. (g) ELISpot quantification of reactive splenocytes to MC-38 cells (violin plot). Bar graphs are presented as mean + SEM. *p < .05, and **p < .01.
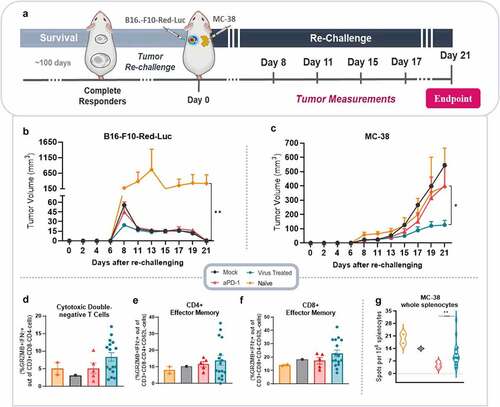
Curiously, when animals cured from melanoma were challenged with MC-38 colon cancer, virus treated animals (here combined in one group) showed the best tumor control, with a statistically significant difference to aPD-1 (p = .017) group (). Of note, MC-38 tumors had similar tumor volumes in the different groups at the beginning of measurement, but tumor control was better in animals cured from melanoma with virus treatment, without any previous exposure to this cell line (Supplementary figure 3S).
To understand which cells were involved in this surprising response, MC-38 tumors were analyzed for key immune cell subsets. Perhaps noteworthy considering the close relationship between colon tissue and innate T cells,Citation27 we observed high levels of cytotoxic double-negativeT cells in the virus treated group, although the result was not significant (). Analogous results were obtained in the virus treated group when cytotoxic CD4+ and CD8 + T effector memory cells were evaluated ().
Additionally, to evaluate a possible specific anti-tumor response generated towards MC-38 tumors, a mouse IFN-γ ELISpot was performed with splenocytes from re-challenged mice. Interestingly, the mean spots count was statistically significant higher in virus treated group compared to aPD-1 group (p = .004). No significant difference was observed between virus treated group and mock, or virus treated group and naïve animals (). Overall, these results indicate that anti-tumor response following virotherapy is durable and show some extended protection even against clones which have not been previously seen by the immune system. This is potentially relevant in the context of clonal variation which frequently leads to tumor escape from targeted therapies.Citation28
Discussion
Important progress in the treatment of advanced cancer, and melanoma in particular, has been achieved with ICI antibodies. Recently, results from a clinical trial with advanced stage melanoma reported 34% overall survival with pembrolizumab (aPD-1) therapy in a cohort of patients previously treated with immunotherapies or immunotherapy-naïve.Citation2 A similar outcome was seen in a phase III trial with ICI-näive patients, where pembrolizumab demonstrated superior (38.7%) overall survival compared to ipilimumab (anti-CTLA-4).Citation1
Despite ICIs not benefiting the majority of advanced stage melanoma patients, these clinical results are remarkable when compared with the modest 15% survival rate reached by systemic IL-2 cytokine therapy almost ten years ago, which in turn was superior to chemotherapy.Citation29 Currently, the key goal is how to extend the gains from ICI therapy to those patients who currently do not benefit. Bearing this in mind, we present here pre-clinical results of a virotherapy strategy utilizing adenoviruses coding for TNFa and IL-2, in animals receiving PD-1 antibody. Our results demonstrate that local virotherapy promotes re-modeling of the microenvironment in both injected and non-injected tumors, mediated by effector CD4 + T, CD8 + T cells, innate lymphocytes, and IFN-γ expression.
With aPD-1+ virus combination treatment, the overall anti-tumor response in injected tumors was more robust than in non-injected tumors, with noteworthy changes seen also in non-injected tumors of animals treated with virus. We attribute this difference to direct intratumoral virus injections, and the spatially localized continuous transgene (TNFa and IL-2) expression, enabled by the CMV promoter inserted in the virus construct in the TME, which in turn stimulated effector lymphocytes in injected tumors.Citation21,Citation30,Citation31 In the work reported here, the viruses were not replication competent, since murine cells are not permissive to human adenoviruses replication, and therefore oncolytic spreading did not influence the response.Citation25 Of note, aPD-1+ virus group was the only group to stimulate high levels of specific anti-tumor response (TRP-2+ CD8 + T cells) in injected and in non-injected tumors. Suggesting that absence of virus replication did not hamper the systemic anti-tumor response generated by the combination therapy.
These results corroborate with the findings of a murine melanoma study, where intratumoral injections with an armed OV (Delta-24-RGDOX; not replication competent in mice) was determinant for the expansion and migration of tumor-specific T cells to non-injected lesions.Citation22 Additionally, similar effects were obtained in a recent phase II trial in unresectable stage III–IV melanoma treated with T-Vec.Citation32 After local T-Vec injection, increased CD8 + T cells infiltration in non-injected tumors was associated with tumor control, with no reported spreading of the virus to distant tumors.Citation32 In our study, however, virus mediated immune response in non-injected tumors was only achieved upon systemic PD-1 blockade of effector immune cells.
In line with these previous findings, our results suggest that injected tumors generate the immunological forces that drive distant tumor control through effector lymphocyte stimulation. In our study, the absence of viable injected tumor critically hampered continuous tumor control in non-injected sites. After disappearance of injected tumors, animals in aPD-1+ virus group quickly relapsed (from day 20 onwards in ). This can be explained by the rapid decrease of immune-cell viability due to apoptosis after antigen (cancer cell) clearance in the injected site.Citation33 Of note, in the clinical context this should not be a limiting factor for systemic response, in view that virus injections can be changed to other lesions upon complete response of injected tumors.Citation8,Citation34,Citation35
Yet, adenovirus’ inherent immunogenicity adds a non-redundant layer of anti-viral immunity that contributes to the final local tumor control.Citation19,Citation36 In particular, here we identified that virus injections stimulated a cytotoxic GrzmB+CD4 + T-cell response. This seemed directly related to adenoviruses’ presence in injected tumors, considering that cytotoxic CD4+ levels were mainly detected in these lesions, and this effector CD4 + T-cell subset has been previously described to be associated to adenovirus infections.Citation37,Citation38 These findings could have been impacted by the fact that the adenoviruses used here were not replicative and did not circulate systemically.Citation39 In contrast, oncolytic adenoviruses are able to travel from tumor to tumor and their systemic effects might be potentiated by oncolysis in distant tumors.Citation11 Thus, human translation of this approach with an oncolytic virus coding for TNFa and IL2 (TILT-123) could result in even more robust control of non-injected tumors.
In our experiments, local virotherapy was determinant for local disease debulking, while systemic tumor control was achieved when systemic aPD-1 was used in combination with the virus. In tumor growth curves from both survival experiments, it was visible that virus monotherapy efficiently controlled most of the primary tumors, but less therapeutic benefit was extended to non-injected lesions. On the other hand, aPD-1 systemic treatment controlled to some extent disease progression in non-injected tumors, but antibody mediated tumor control was quickly overtaken by rapid disease progression. In fact, only when local virus treatment was combined to systemic aPD-1 therapy, complete response was achieved in 100% of animals bearing two tumors.
It has been proposed that including a therapeutic agent which enhances immune infiltration into the TME could be useful in increasing the frequency of tumors responding to ICI.Citation8 Conventionally, tumors with low or complete lack of immune cells infiltration are likely to be unresponsive to ICI therapy.Citation6,Citation7 Of note, clinical trials with different locally injected OVs have tumor infiltrating lymphocytes into tumors, and subsequently improved overall survival rates in patients receiving ICI.Citation10,Citation32,Citation40 With regard to oncolytic adenovirus, it has been described that tumors not immune-infiltrated are more likely to respond than immune-infiltrated tumors, due to extensive infiltrates of exhausted cells in the latter.Citation41 However, effector function on exhausted immune cells can be restored upon ICI administration in combination with adenovirus, as used here and as previously described.Citation39
Despite the well established role of DCs in initiating the systemic adaptive immunity in cancer,Citation8,Citation42,Citation43 the implications of PD-L1 expression by DCs (PD-L1/DCs) remain only partially understood.Citation44,Citation45 Recently, it has been demonstrated that PD-L1/DCs have a detrimental role on tumor immunosuppression, and the ablation of PD-L1 on DCs was crucial to enable anti-tumor T-cell response in mice.Citation46 Of note, PD-L1/DCs mediated immunosuppression can be partially disrupted by aPD-1 therapy, as demonstrated by partial reestablishment of CD80 signaling in PD-L1/DCs after blocking the PD-L1/PD-1 trans interaction with PD-1 antibody in vitro.Citation47
Interestingly, in the aPD-1+ virus group, PD-L1 intensity in DCs of non-injected tumors was higher than in other groups. However, PD-L1 expression in DCs was associated with tumor response, suggesting that increased levels of CD80 and PD-L1 in DCs of non-injected tumors receiving aPD-1+ virus therapy followed the usual expression dynamics in DCs maturation and immune response, rather than immunosuppression.Citation45,Citation46
One of the key challenges in oncology is to prevent metastasis, which typically ultimately determine survival.Citation4,Citation48,Citation49 In this regard, pre-clinical evidence in murine models showed that local treatment with a genetically modified vaccinia virus (VVΔTKΔN1L) and adenovirus (rAd.DCN) prevented metastasis formation in the lungs of treated mice.Citation12,Citation50 Concurring with these reports, in our results adenovirus coding for TNFa and IL-2 cytokines impaired metastasis development in animals with progressive melanoma disease.
Cancer immunotherapies have provided consistent durable responses across a variety of cancer types.Citation51 In agreement with this premise, in our study virus treatment (monotherapy or in combination with aPD-1) demonstrated durable memory response, with complete tumor clearance upon tumor re-challenge.
Notably, following virus treatment, tumor control was also observed when an unrelated cell line (mouse colon cancer) was injected into animals. In conjunction with tumor control, effector double-negative T cells, effector memory CD4+ and CD8 + T cells, appeared at higher levels. Importantly, in virus treated animals was observed generation of specific anti-tumor response against MC-38 cells when compared to aPD-1 group. We speculate that adenovirus treatments might have promoted T-cell cross-reactivity (epitope spreading), and therefore, control of treatment-naïve colon cancer tumors. In fact, memory T-cell response requires much lower peptide concentration for activation than naïve T cells, and peptides of a different tumor could show some affinity for the memory T cells’ TCR.Citation52 Hence, the effector memory T cells observed in our study could have been stimulated by cross-reactive peptides of colon cancer tumors.Citation28 The same phenomenon has been observed before, and it could be of immense clinical benefit as clonal variation is a known cause of treatment resistance.Citation21,Citation31 Additional studies evaluating how the virus treatments affect TCR populations during the re-challenge experiment would be relevant.
Although our results are based on murine melanoma cell lines, which do not fully recapitulate the complexity of human metastatic tumors, we believe that the outcomes here described could be relevant to human advanced melanomas and other tumor types, as previously shown with similar adenoviruses.Citation11,Citation21,Citation23 In fact, we expect more potent response in human cancer cells, where Ad5/3-D24-E2F-hTNFa-IRES-hIL2 (TILT-123), the replicative version of the virus used herein, will be applied.Citation21 However, to evaluate the systemic effect of aPD-1+ virus treatment in other cancer types an initial study optimizing the dose and treatment schedule in mice bearing single tumors should be performed.
Our data provide strong preclinical evidence that local adenovirus therapy in conjunction with systemic PD-1 antibody promotes superior specific tumor control and complete response in injected and in non-injected lesions. Mechanistically, virus injections boost tumor infiltrating lymphocytes’ anti-tumor responsiveness in injected tumors, while aPD-1 unleashes immunity in non-injected tumors. Moreover, this therapy demonstrated durable response against melanoma re-challenge that was also extended to colon cancer tumor control, while metastases were prevented.
In summary, adenovirus coding for TNFa and IL-2 cytokines constitutes a promising asset for the treatment of advanced stage melanoma receiving systemic PD-1 blockade therapy. Clinical trials with the human counterpart TILT-123 are ongoing (NCT04695327 and NCT04217473).
Contributors
DQ, VCC, and AH designed the experiments. DQ, JC, TVK, CH, and SSVK performed the experiments. DQ, VCC, JS, RH, MA, AK, and AH analyzed the results. All authors were involved with writing and critical revision of the manuscript.
Supplemental Material
Download PDF (457.2 KB)Acknowledgments
We thank Minna Oksanen and Riikka Kalliokoski for their assistance. We thank the tissue preparation and histochemistry unit (TPHU), the Laboratory Animal Center (LAC), Biomedicum Imaging Unit (BIU) core facility, and the Flow Cytometry Unit from the University of Helsinki for their technical support in the present study.
Disclosure statement
AH is a shareholder in Targovax ASA. AH is an employee and shareholder in TILT Biotherapeutics. JMS, VCC, RH, and JC are employees of TILT Biotherapeutics.
Supplementary material
Supplemental data for this article can be accessed on the publisher’s website
Additional information
Funding
References
- Robert C, Ribas A, Schachter J, Arance A, Grob -J-J, Mortier L, Daud A, Carlino MS, McNeil CM, Lotem M, et al. Pembrolizumab versus ipilimumab in advanced melanoma (KEYNOTE-006): post-hoc 5-year results from an open-label, multicentre, randomised, controlled, phase 3 study. Lancet Oncol. 2019;20(9):1239–14. doi:10.1016/S1470-2045(19)30388-2.
- Hamid O, Robert C, Daud A, Hodi FS, Hwu WJ, Kefford R, Wolchok JD, Hersey P, Joseph R, Weber JS, et al. Five-year survival outcomes for patients with advanced melanoma treated with pembrolizumab in KEYNOTE-001. Ann Oncol. 2019;30(4):582–588. doi:10.1093/annonc/mdz011.
- Gutzmer R, Stroyakovskiy D, Gogas H, Robert C, Lewis K, Protsenko S, Pereira RP, Eigentler T, Rutkowski P, Demidov L, et al. Atezolizumab, vemurafenib, and cobimetinib as first-line treatment for unresectable advanced BRAFV600 mutation-positive melanoma (IMspire150): primary analysis of the randomised, double-blind, placebo-controlled, phase 3 trial. The Lancet. 2020;395(10240):1835–1844. doi:10.1016/S0140-6736(20)30934-X.
- Gershenwald JE, Scolyer RA. Melanoma staging: American Joint Committee on Cancer (AJCC) 8th edition and beyond. Ann Surg Oncol. 2018;25(8):2105–2110. doi:10.1245/s10434-018-6513-7.
- Tan S, Li D, Zhu X. Cancer immunotherapy: pros, cons and beyond. Biomed Pharmacother. 2020;124:109821. doi:10.1016/j.biopha.2020.109821.
- Sharma P, Hu-Lieskovan S, Wargo JA, Ribas A. Primary, adaptive, and acquired resistance to cancer immunotherapy. Cell. 2017;168(4):707–723. doi:10.1016/j.cell.2017.01.017.
- Jenkins RW, Barbie DA, Flaherty KT. Mechanisms of resistance to immune checkpoint inhibitors. Br J Cancer. 2018;118(1):9–16. doi:10.1038/bjc.2017.434.
- Middleton MR, Hoeller C, Michielin O, Robert C, Caramella C, Öhrling K, Hauschild A. Intratumoural immunotherapies for unresectable and metastatic melanoma: current status and future perspectives. Br J Cancer. 2020;123(6):885–897. doi:10.1038/s41416-020-0994-4.
- Aznar MA, Planelles L, Perez-Olivares M, Molina C, Garasa S, Etxeberría I, Perez G, Rodriguez I, Bolaños E, Lopez-Casas P, et al. Immunotherapeutic effects of intratumoral nanoplexed poly I:C. J Immunother Cancer. 2019;7(1):116. doi:10.1186/s40425-019-0568-2.
- Ribas A, Dummer R, Puzanov I, VanderWalde A, Andtbacka RHI, Michielin O, Olszanski AJ, Malvehy J, Cebon J, Fernandez E, et al. Oncolytic virotherapy promotes intratumoral T cell infiltration and improves Anti-PD-1 immunotherapy. Cell. 2017;170(6):1109–1119.e10. doi:10.1016/j.cell.2017.08.027.
- Koski A, Bramante S, Kipar A, Oksanen M, Juhila J, Vassilev L, Joensuu T, Kanerva A, Hemminki A. Biodistribution analysis of oncolytic adenoviruses in patient autopsy samples reveals vascular transduction of noninjected tumors and tissues. Mol Therapy. 2015;23(10):1641–1652. doi:10.1038/mt.2015.125.
- Ahmed J, Chard LS, Yuan M, Wang J, Howells A, Li Y, Li H, Zhang Z, Lu S, Gao D, et al. A new oncolytic Vaccinia virus augments antitumor immune responses to prevent tumor recurrence and metastasis after surgery. J Immunother Cancer. 2020;8(1):e000415. doi:10.1136/jitc-2019-000415.
- Chesney J, Puzanov I, Collichio F, Singh P, Milhem MM, Glaspy J, Hamid O, Ross M, Friedlander P, Garbe C, et al. Randomized, open-label phase II study evaluating the efficacy and safety of talimogene laherparepvec in combination with Ipilimumab versus ipilimumab alone in patients with advanced, unresectable melanoma. J Clin Oncol. 2018;36(17):1658–1667. doi:10.1200/JCO.2017.73.7379.
- Bai Y, Hui P, Du X, Su X. Updates to the antitumor mechanism of oncolytic virus. Thoracic Cancer. 2019;10(5):1031–1035. doi:10.1111/1759-7714.13043.
- Matos ALD, Franco LS, McFadden G. Oncolytic viruses and the immune system: the dynamic duo. Mol Ther Methods Clin Dev. 2020;17:349–358. doi:10.1016/j.omtm.2020.01.001.
- Quixabeira DCA, Zafar S, Santos JM, Cervera-Carrascon V, Havunen R, Kudling TV, Basnet S, Anttila M, Kanerva A, Hemminki A, et al. Oncolytic adenovirus coding for a variant Interleukin 2 (vIL-2) cytokine re-programs the tumor microenvironment and confers enhanced tumor control. Front Immunol. 2021;12. doi:10.3389/fimmu.2021.674400
- Ranki T, Pesonen S, Hemminki A, Partanen K, Kairemo K, Alanko T, Lundin J, Linder N, Turkki R, Ristimäki A, et al. Phase I study with ONCOS-102 for the treatment of solid tumors - an evaluation of clinical response and exploratory analyses of immune markers. J Immunother Cancer. 2016;4(1):17. doi:10.1186/s40425-016-0121-5.
- Ramelyte E, Tastanova A, Balázs Z, Ignatova D, Turko P, Menzel U, Guenova E, Beisel C, Krauthammer M, Levesque MP, et al. Oncolytic virotherapy-mediated anti-tumor response: a single-cell perspective. Cancer Cell. 2021;39(3):394–406.e4. doi:10.1016/j.ccell.2020.12.022.
- Heiniö C, Havunen R, Santos J, de Lint K, Cervera-Carrascon V, Kanerva A, Hemminki A. TNFa and IL2 encoding oncolytic adenovirus activates pathogen and danger-associated immunological signaling. Cells. 2020;9(4):798. doi:10.3390/cells9040798.
- Kanerva A, Nokisalmi P, Diaconu I, Koski A, Cerullo V, Liikanen I, Tähtinen S, Oksanen M, Heiskanen R, Pesonen S, et al. Antiviral and antitumor T-cell immunity in patients treated with GM-CSF–coding oncolytic adenovirus. Clin Cancer Res. 2013;19(10):2734–2744. doi:10.1158/1078-0432.CCR-12-2546.
- Havunen R, Siurala M, Sorsa S, Grönberg-Vähä-Koskela S, Behr M, Tähtinen S, Santos JM, Karell P, Rusanen J, Nettelbeck DM, et al. Oncolytic adenoviruses armed with tumor necrosis factor alpha and Interleukin-2 enable successful adoptive cell therapy. Mol Ther Oncolytics. 2017;4:77–86. doi:10.1016/j.omto.2016.12.004.
- Jiang H, Shin DH, Nguyen TT, Fueyo J, Fan X, Henry V, Carrillo CC, Yi Y, Alonso MM, Collier TL, et al. Localized treatment with oncolytic adenovirus delta-24-RGDOX induces systemic immunity against disseminated subcutaneous and intracranial melanomas. Clin Cancer Res. 2019;25(22):6801–6814. doi:10.1158/1078-0432.CCR-19-0405.
- Cervera-Carrascon V, Siurala M, Santos JM, Havunen R, Tähtinen S, Karell P, Sorsa S, Kanerva A, Hemminki A. TNFa and IL-2 armed adenoviruses enable complete responses by anti-PD-1 checkpoint blockade. OncoImmunology. 2018;7(5):e1412902. doi:10.1080/2162402X.2017.1412902.
- Kaluza KM, Thompson JM, Kottke TJ, Flynn Gilmer HC, Knutson DL, Vile RG. Adoptive T cell therapy promotes the emergence of genomically altered tumor escape variants. Int J Cancer. 2012;131(4):844–854. doi:10.1002/ijc.26447.
- Siurala M, Havunen R, Saha D, Lumen D, Airaksinen A.J, Tähtinen S, Cervera-Carrascon V, Bramante S, Parviainen S, Vähä-Koskela M, et al. Adenoviral delivery of tumor necrosis factor-α and Interleukin-2 enables successful adoptive cell therapy of immunosuppressive melanoma. Mol Ther. 2016;24(8):1435–1443. doi:10.1038/mt.2016.137.
- Fusciello M, Fontana F, Tähtinen S, Capasso C, Feola S, Martins B, Chiaro J, Peltonen K, Ylösmäki L, Ylösmäki E, et al. Artificially cloaked viral nanovaccine for cancer immunotherapy. Nat Commun. 2019;10(1):5747. doi:10.1038/s41467-019-13744-8.
- Ribot JC, Lopes N, Silva-Santos B. γδ T cells in tissue physiology and surveillance. Nat Rev Immunol. 2021;21(4):221–232. doi:10.1038/s41577-020-00452-4.
- Sewell AK. Why must T cells be cross-reactive? Nat Rev Immunol. 2012;12(9):669–677. doi:10.1038/nri3279.
- Dillman RO, DePriest C, McClure SE. High-dose IL2 in metastatic melanoma: better survival in patients immunized with antigens from autologous tumor cell lines. Cancer Biother Radiopharm. 2014;29(2):53–57. doi:10.1089/cbr.2013.1565.
- Santos JM, Havunen R, Siurala M, Cervera‐Carrascon V, Tähtinen S, Sorsa S, Anttila M, Karell P, Kanerva A, Hemminki A, et al. Adenoviral production of interleukin-2 at the tumor site removes the need for systemic postconditioning in adoptive cell therapy. Int J Cancer. 2017;141(7):1458–1468. doi:10.1002/ijc.30839.
- Cervera-Carrascon V, Quixabeira DCA, Havunen R, Santos JM, Kutvonen E, Clubb JHA, Siurala M, Heiniö C, Zafar S, Koivula T, et al. Comparison of clinically relevant oncolytic virus platforms for enhancing T cell therapy of solid tumors. Mol Ther Oncolytics. 2020;17:47–60. doi:10.1016/j.omto.2020.03.003.
- Malvehy J, Samoylenko I, Schadendorf D, Gutzmer R, Grob J-J, Sacco JJ, Gorski KS, Anderson A, Pickett CA, Liu K, et al. Talimogene laherparepvec upregulates immune-cell populations in non-injected lesions: findings from a phase II, multicenter, open-label study in patients with stage IIIB-IVM1c melanoma. J Immunother Cancer. 2021;9(3):e001621. doi:10.1136/jitc-2020-001621.
- Xia A, Zhang Y, Xu J, Yin T, Lu X-J. T cell dysfunction in cancer immunity and immunotherapy. Front Immunol. 2019;10:1719. doi:10.3389/fimmu.2019.01719.
- Kaufman HL, Maciorowski D. Advancing oncolytic virus therapy by understanding the biology. Nat Rev Clin Oncol. 2021;18(4):197–198. doi:10.1038/s41571-021-00490-4.
- Li L, Liu S, Han D, Tang B, Ma J. Delivery and biosafety of oncolytic virotherapy. Front Oncol. 2020;10:475. doi:10.3389/fonc.2020.00475.
- Hendrickx R, Stichling N, Koelen J, Kuryk L, Lipiec A, Greber UF. Innate immunity to adenovirus. Hum Gene Ther. 2014;25(4):265–284. doi:10.1089/hum.2014.001.
- Donnarumma T, Young GR, Merkenschlager J, Eksmond U, Bongard N, Nutt SL, Boyer C, Dittmer U, Le-Trilling VTK, Trilling M, et al. Opposing development of cytotoxic and follicular helper CD4 T cells controlled by the TCF-1-Bcl6 Nexus. Cell Rep. 2016;17(6):1571–1583. doi:10.1016/j.celrep.2016.10.013.
- Heemskerk B, van Vreeswijk T, Veltrop-Duits LA, Sombroek CC, Franken K, Verhoosel RM, Hiemstra PS, van Leeuwen D, Ressing ME, Toes REM, et al. Adenovirus-specific CD4 + T cell clones recognizing endogenous antigen inhibit viral replication in vitro through cognate interaction. J Immunol. 2006;177(12):8851–8859. doi:10.4049/jimmunol.177.12.8851.
- Havunen R, Santos JM, Sorsa S, Rantapero T, Lumen D, Siurala M, Airaksinen AJ, Cervera-Carrascon V, Tähtinen S, Kanerva A, et al. Abscopal effect in non-injected tumors achieved with cytokine-armed oncolytic adenovirus. Mol Ther Oncolytics. 2018;11:109–121. doi:10.1016/j.omto.2018.10.005.
- Moesta AK, Cooke K, Piasecki J, Mitchell P, Rottman JB, Fitzgerald K, Zhan J, Yang B, Le T, Belmontes B, et al. Local delivery of OncoVEX mGM-CSF generates systemic antitumor immune responses enhanced by cytotoxic T-lymphocyte–associated protein blockade. Clin Cancer Res. 2017;23(20):6190–6202. doi:10.1158/1078-0432.CCR-17-0681.
- Taipale K, Liikanen I, Juhila J, Turkki R, Tähtinen S, Kankainen M, Vassilev L, Ristimäki A, Koski A, Kanerva A, et al. Chronic activation of innate immunity correlates with poor prognosis in cancer patients treated with oncolytic adenovirus. Mol Therapy. 2016;24(1):175–183. doi:10.1038/mt.2015.143.
- Demaria S, Formenti SC. Can abscopal effects of local radiotherapy be predicted by modeling T cell trafficking? J Immunother Cancer. 2016;4(1):29. doi:10.1186/s40425-016-0133-1.
- Ma J, Ramachandran M, Jin C, Quijano-Rubio C, Martikainen M, Yu D, Essand M. Characterization of virus-mediated immunogenic cancer cell death and the consequences for oncolytic virus-based immunotherapy of cancer. Cell Death Dis. 2020;11(1):48. doi:10.1038/s41419-020-2236-3.
- Maier B, Leader AM, Chen ST, Tung N, Chang C, LeBerichel J, Chudnovskiy A, Maskey S, Walker L, Finnigan JP, et al. A conserved dendritic-cell regulatory program limits antitumour immunity. Nature. 2020;580(7802):257–262. doi:10.1038/s41586-020-2134-y.
- Dammeijer F, van Gulijk M, Mulder EE, Lukkes M, Klaase L, van Den Bosch T, van Nimwegen M, Lau SP, Latupeirissa K, Schetters S, et al. The PD-1/PD-L1-checkpoint restrains T cell immunity in tumor-draining lymph nodes. Cancer Cell. 2020;38(5):685–700.e8. doi:10.1016/j.ccell.2020.09.001.
- Oh SA, Wu D-C, Cheung J, Navarro A, Xiong H, Cubas R, Totpal K, Chiu H, Wu Y, Comps-Agrar L, et al. PD-L1 expression by dendritic cells is a key regulator of T-cell immunity in cancer. Nat Cancer. 2020;1(7):681–691. doi:10.1038/s43018-020-0075-x.
- Mayoux M, Roller A, Pulko V, Sammicheli S, Chen S, Sum E, Jost C, Fransen MF, Buser RB, Kowanetz M, et al. Dendritic cells dictate responses to PD-L1 blockade cancer immunotherapy. Sci Transl Med. 2020;12(534). doi:10.1126/scitranslmed.aav7431.
- Steeg PS. Targeting metastasis. Nat Rev Cancer. 2016;16(4):201–218. doi:10.1038/nrc.2016.25.
- Schadendorf D, van Akkooi ACJ, Berking C, Griewank KG, Gutzmer R, Hauschild A, Stang A, Roesch A, Ugurel S. Melanoma. The Lancet. 2018;392(10151):971–984. doi:10.1016/S0140-6736(18)31559-9.
- Zhao H, Wang H, Kong F, Xu W, Wang T, Xiao F, Wang L, Huang D, Seth P, Yang Y, et al. Oncolytic adenovirus rAd.DCN inhibits breast tumor growth and lung metastasis in an immune-competent orthotopic xenograft model. Hum Gene Ther. 2019;30(2):197–210. doi:10.1089/hum.2018.055.
- Chen DS, Mellman I. Oncology meets immunology: the cancer-immunity cycle. Immunity. 2013;39(1):1–10. doi:10.1016/j.immuni.2013.07.012.
- Veiga-Fernandes H, Walter U, Bourgeois C, McLean A, Rocha B. Response of naïve and memory CD8 + T cells to antigen stimulation in vivo. Nat Immunol. 2000;1(1):47–53. doi:10.1038/76907.